Zip Codes with the Highest Percentage of Households with Income Above $100,000 in Pontiac, MI
RELATED REPORTS & OPTIONS
Household Income | $100k+
Pontiac
Compare Zip Codes
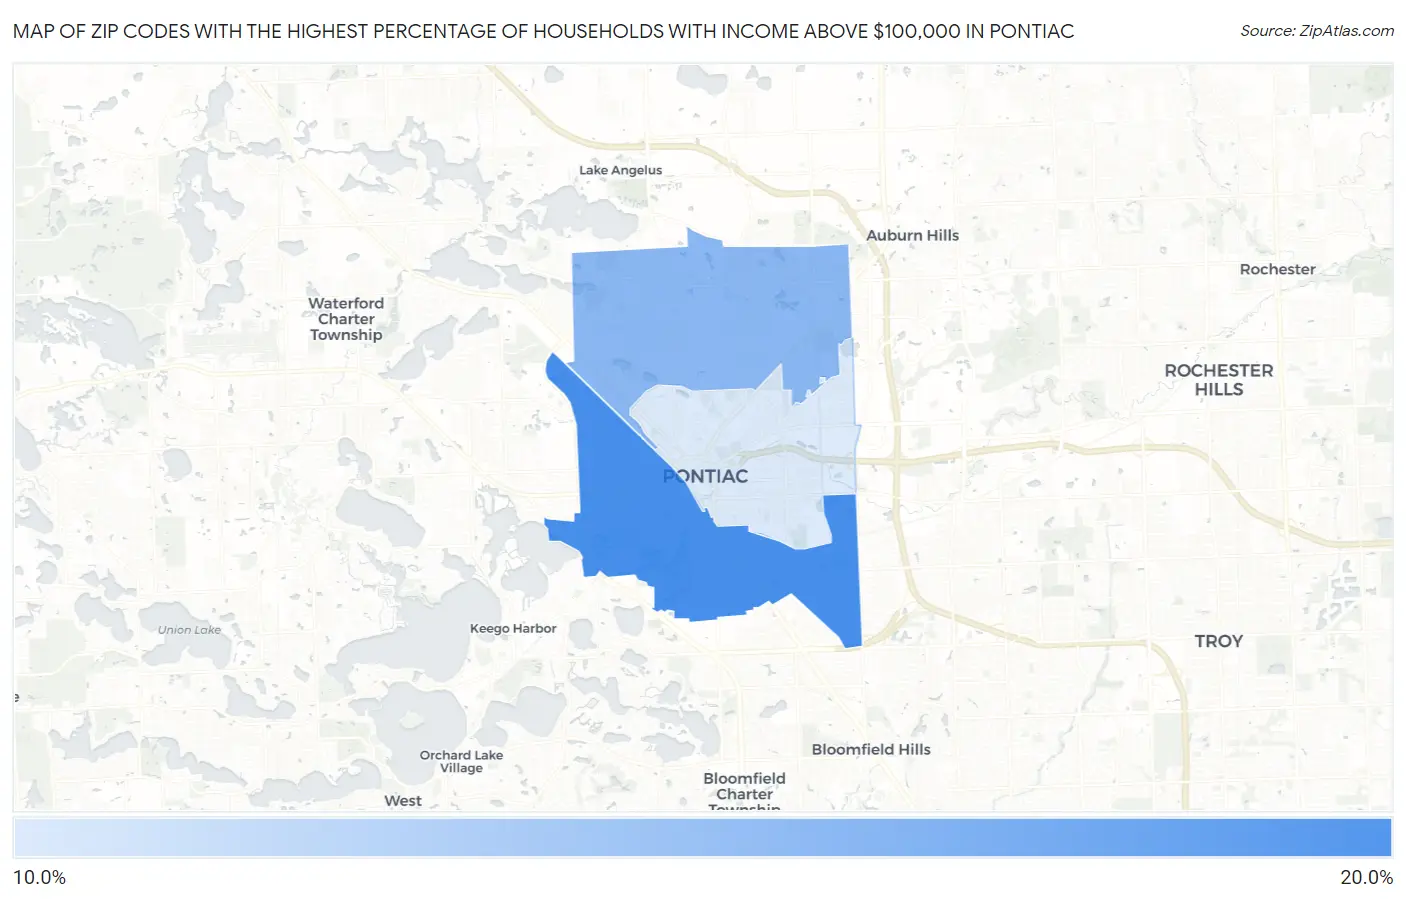
Map of Zip Codes with the Highest Percentage of Households with Income Above $100,000 in Pontiac
11.1%
17.5%
Zip Codes with the Highest Percentage of Households with Income Above $100,000 in Pontiac, MI
| Zip Code | Households with Income > $100k | vs State | vs National | |
| 1. | 48341 | 17.5% | 32.5%(-15.0)#788 | 37.3%(-19.8)#25,904 |
| 2. | 48340 | 14.6% | 32.5%(-17.9)#857 | 37.3%(-22.7)#27,762 |
| 3. | 48342 | 11.1% | 32.5%(-21.4)#905 | 37.3%(-26.2)#29,395 |
1
Common Questions
What are the Top Zip Codes with the Highest Percentage of Households with Income Above $100,000 in Pontiac, MI?
Top Zip Codes with the Highest Percentage of Households with Income Above $100,000 in Pontiac, MI are:
What zip code has the Highest Percentage of Households with Income Above $100,000 in Pontiac, MI?
48341 has the Highest Percentage of Households with Income Above $100,000 in Pontiac, MI with 17.5%.
What is the Percentage of Households with Income Above $100,000 in Pontiac, MI?
Percentage of Households with Income Above $100,000 in Pontiac is 14.5%.
What is the Percentage of Households with Income Above $100,000 in Michigan?
Percentage of Households with Income Above $100,000 in Michigan is 32.5%.
What is the Percentage of Households with Income Above $100,000 in the United States?
Percentage of Households with Income Above $100,000 in the United States is 37.3%.