Pinckney, MI Map & Demographics
Pinckney Map
Pinckney Overview
$42,705
PER CAPITA INCOME
$111,406
AVG FAMILY INCOME
$88,894
AVG HOUSEHOLD INCOME
25.4%
WAGE / INCOME GAP [ % ]
74.6¢/ $1
WAGE / INCOME GAP [ $ ]
0.34
INEQUALITY / GINI INDEX
1,950
TOTAL POPULATION
891
MALE POPULATION
1,059
FEMALE POPULATION
84.14
MALES / 100 FEMALES
118.86
FEMALES / 100 MALES
42.1
MEDIAN AGE
3.1
AVG FAMILY SIZE
2.2
AVG HOUSEHOLD SIZE
1,170
LABOR FORCE [ PEOPLE ]
70.5%
PERCENT IN LABOR FORCE
5.6%
UNEMPLOYMENT RATE
Pinckney Zip Codes
Pinckney Area Codes
Income in Pinckney
Income Overview in Pinckney
Per Capita Income in Pinckney is $42,705, while median incomes of families and households are $111,406 and $88,894 respectively.
| Characteristic | Number | Measure |
| Per Capita Income | 1,950 | $42,705 |
| Median Family Income | 460 | $111,406 |
| Mean Family Income | 460 | $111,661 |
| Median Household Income | 875 | $88,894 |
| Mean Household Income | 875 | $93,451 |
| Income Deficit | 460 | $0 |
| Wage / Income Gap (%) | 1,950 | 25.36% |
| Wage / Income Gap ($) | 1,950 | 74.64¢ per $1 |
| Gini / Inequality Index | 1,950 | 0.34 |
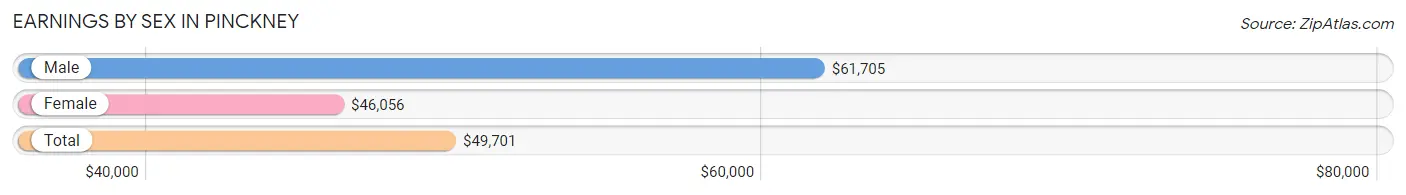
Earnings by Sex in Pinckney
Average Earnings in Pinckney are $49,701, $61,705 for men and $46,056 for women, a difference of 25.4%.
| Sex | Number | Average Earnings |
| Male | 621 (52.2%) | $61,705 |
| Female | 568 (47.8%) | $46,056 |
| Total | 1,189 (100.0%) | $49,701 |
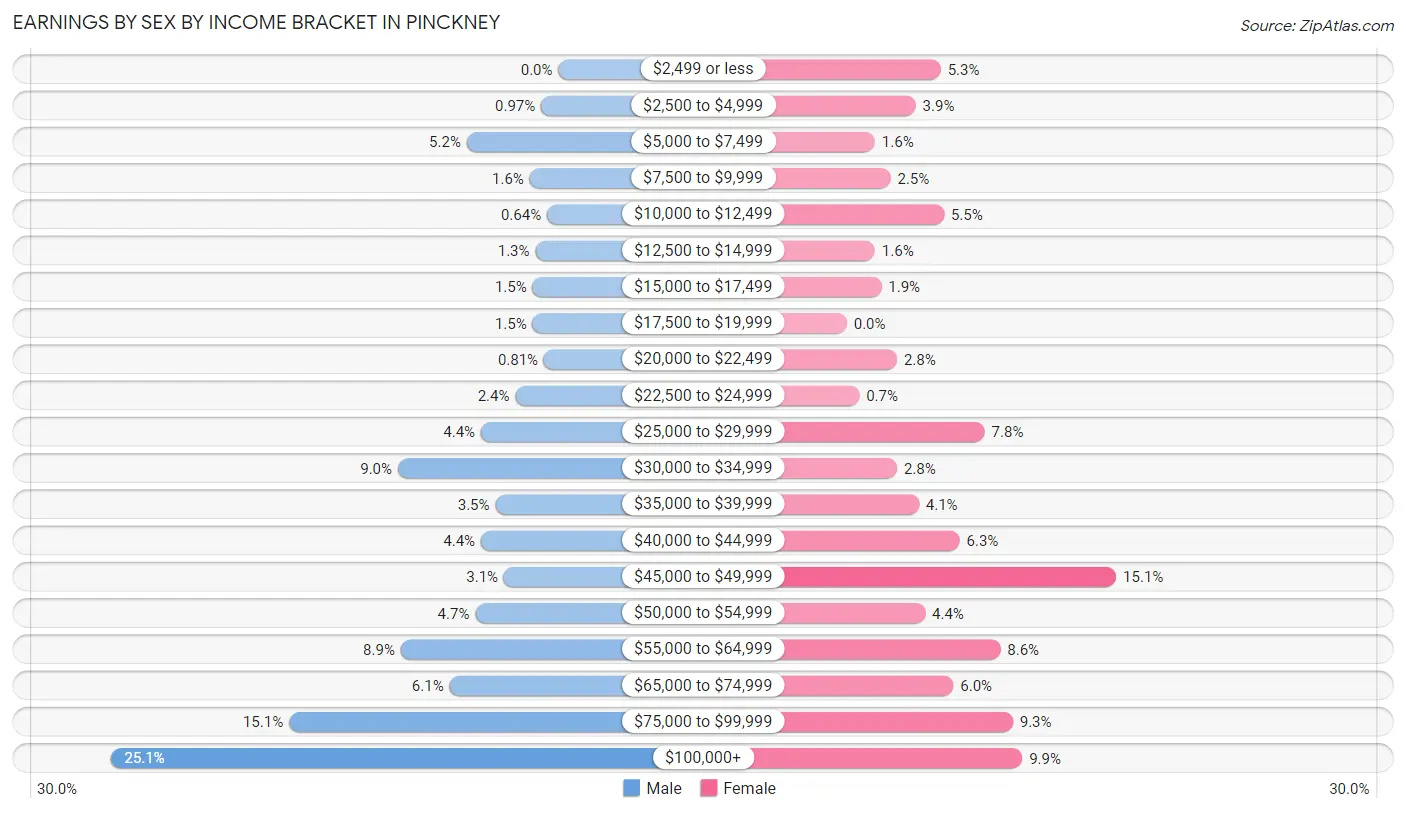
Earnings by Sex by Income Bracket in Pinckney
The most common earnings brackets in Pinckney are $100,000+ for men (156 | 25.1%) and $45,000 to $49,999 for women (86 | 15.1%).
| Income | Male | Female |
| $2,499 or less | 0 (0.0%) | 30 (5.3%) |
| $2,500 to $4,999 | 6 (1.0%) | 22 (3.9%) |
| $5,000 to $7,499 | 32 (5.1%) | 9 (1.6%) |
| $7,500 to $9,999 | 10 (1.6%) | 14 (2.5%) |
| $10,000 to $12,499 | 4 (0.6%) | 31 (5.5%) |
| $12,500 to $14,999 | 8 (1.3%) | 9 (1.6%) |
| $15,000 to $17,499 | 9 (1.5%) | 11 (1.9%) |
| $17,500 to $19,999 | 9 (1.5%) | 0 (0.0%) |
| $20,000 to $22,499 | 5 (0.8%) | 16 (2.8%) |
| $22,500 to $24,999 | 15 (2.4%) | 4 (0.7%) |
| $25,000 to $29,999 | 27 (4.3%) | 44 (7.7%) |
| $30,000 to $34,999 | 56 (9.0%) | 16 (2.8%) |
| $35,000 to $39,999 | 22 (3.5%) | 23 (4.1%) |
| $40,000 to $44,999 | 27 (4.3%) | 36 (6.3%) |
| $45,000 to $49,999 | 19 (3.1%) | 86 (15.1%) |
| $50,000 to $54,999 | 29 (4.7%) | 25 (4.4%) |
| $55,000 to $64,999 | 55 (8.9%) | 49 (8.6%) |
| $65,000 to $74,999 | 38 (6.1%) | 34 (6.0%) |
| $75,000 to $99,999 | 94 (15.1%) | 53 (9.3%) |
| $100,000+ | 156 (25.1%) | 56 (9.9%) |
| Total | 621 (100.0%) | 568 (100.0%) |
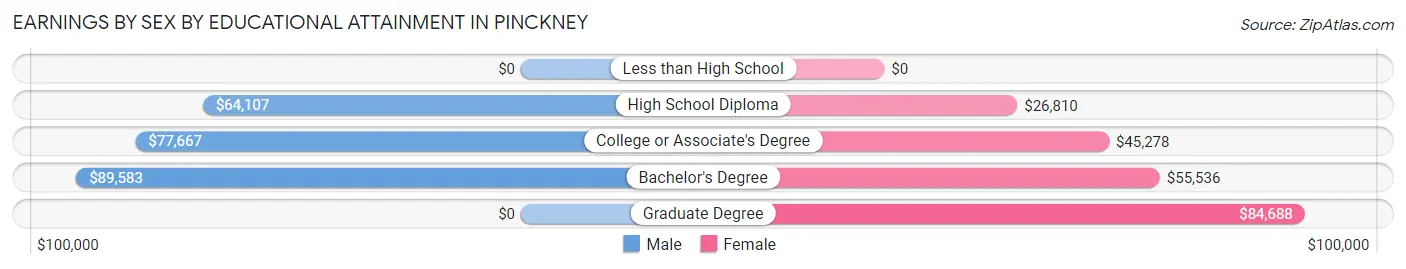
Earnings by Sex by Educational Attainment in Pinckney
Average earnings in Pinckney are $67,250 for men and $48,384 for women, a difference of 28.1%. Men with an educational attainment of bachelor's degree enjoy the highest average annual earnings of $89,583, while those with high school diploma education earn the least with $64,107. Women with an educational attainment of graduate degree earn the most with the average annual earnings of $84,688, while those with high school diploma education have the smallest earnings of $26,810.
| Educational Attainment | Male Income | Female Income |
| Less than High School | - | - |
| High School Diploma | $64,107 | $26,810 |
| College or Associate's Degree | $77,667 | $45,278 |
| Bachelor's Degree | $89,583 | $55,536 |
| Graduate Degree | - | - |
| Total | $67,250 | $48,384 |
Family Income in Pinckney
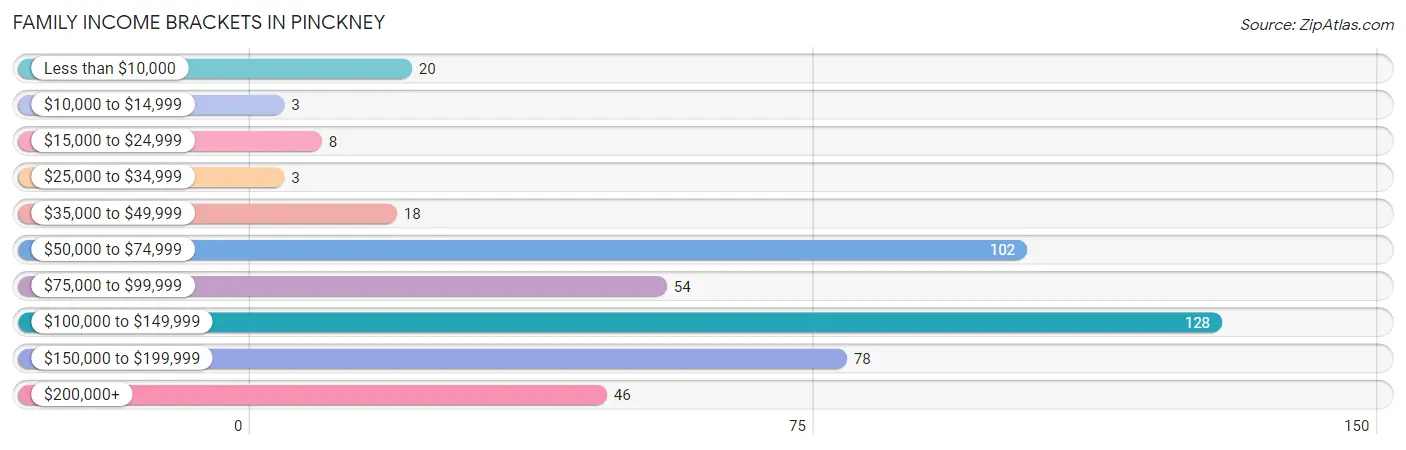
Family Income Brackets in Pinckney
According to the Pinckney family income data, there are 128 families falling into the $100,000 to $149,999 income range, which is the most common income bracket and makes up 27.8% of all families. Conversely, the $10,000 to $14,999 income bracket is the least frequent group with only 3 families (0.6%) belonging to this category.
| Income Bracket | # Families | % Families |
| Less than $10,000 | 20 | 4.3% |
| $10,000 to $14,999 | 3 | 0.7% |
| $15,000 to $24,999 | 8 | 1.7% |
| $25,000 to $34,999 | 3 | 0.7% |
| $35,000 to $49,999 | 18 | 3.9% |
| $50,000 to $74,999 | 102 | 22.2% |
| $75,000 to $99,999 | 54 | 11.7% |
| $100,000 to $149,999 | 128 | 27.8% |
| $150,000 to $199,999 | 78 | 17.0% |
| $200,000+ | 46 | 10.0% |
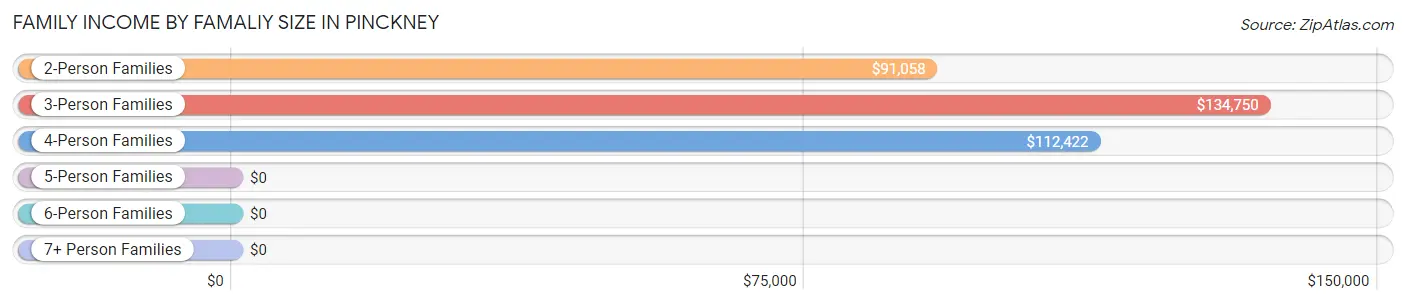
Family Income by Famaliy Size in Pinckney
3-person families (91 | 19.8%) account for the highest median family income in Pinckney with $134,750 per family, while 2-person families (197 | 42.8%) have the highest median income of $45,529 per family member.
| Income Bracket | # Families | Median Income |
| 2-Person Families | 197 (42.8%) | $91,058 |
| 3-Person Families | 91 (19.8%) | $134,750 |
| 4-Person Families | 149 (32.4%) | $112,422 |
| 5-Person Families | 23 (5.0%) | $0 |
| 6-Person Families | 0 (0.0%) | $0 |
| 7+ Person Families | 0 (0.0%) | $0 |
| Total | 460 (100.0%) | $111,406 |
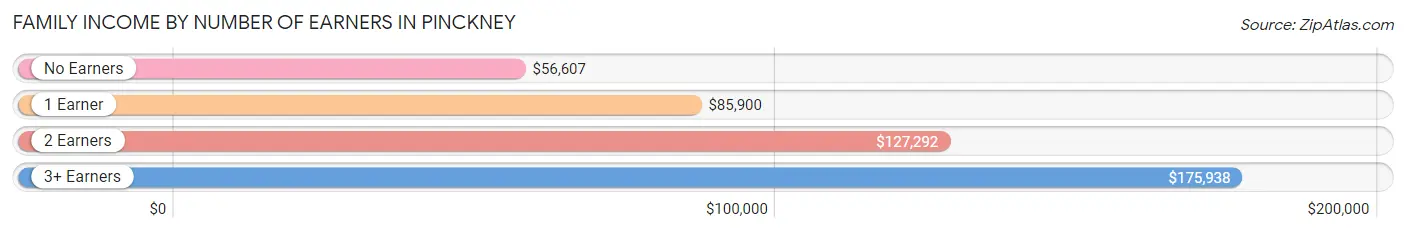
Family Income by Number of Earners in Pinckney
The median family income in Pinckney is $111,406, with families comprising 3+ earners (51) having the highest median family income of $175,938, while families with no earners (48) have the lowest median family income of $56,607, accounting for 11.1% and 10.4% of families, respectively.
| Number of Earners | # Families | Median Income |
| No Earners | 48 (10.4%) | $56,607 |
| 1 Earner | 124 (27.0%) | $85,900 |
| 2 Earners | 237 (51.5%) | $127,292 |
| 3+ Earners | 51 (11.1%) | $175,938 |
| Total | 460 (100.0%) | $111,406 |
Household Income in Pinckney
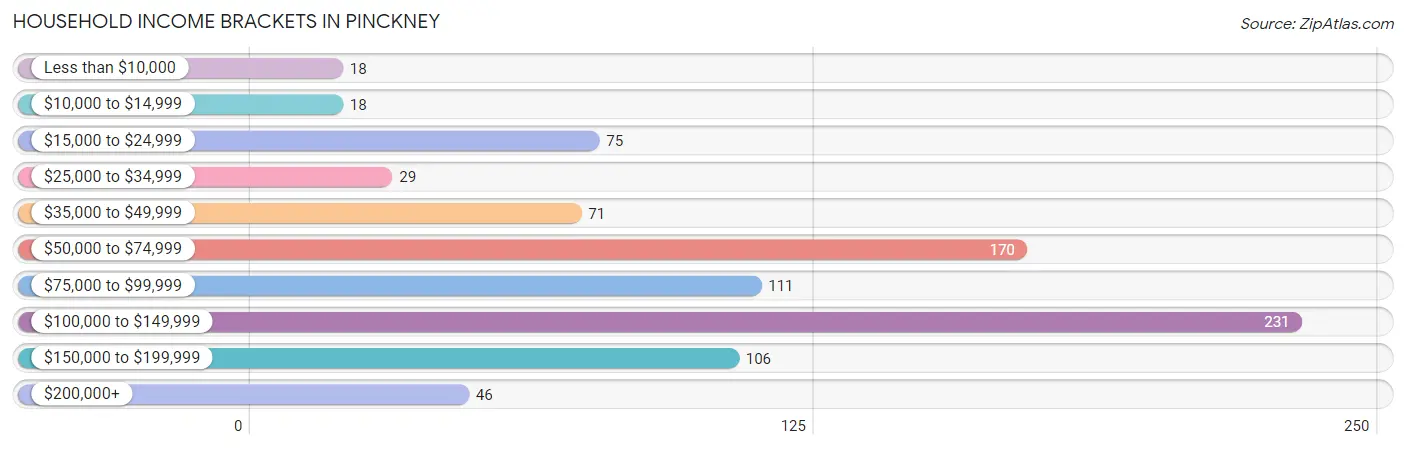
Household Income Brackets in Pinckney
With 231 households falling in the category, the $100,000 to $149,999 income range is the most frequent in Pinckney, accounting for 26.4% of all households. In contrast, only 18 households (2.1%) fall into the less than $10,000 income bracket, making it the least populous group.
| Income Bracket | # Households | % Households |
| Less than $10,000 | 18 | 2.1% |
| $10,000 to $14,999 | 18 | 2.1% |
| $15,000 to $24,999 | 75 | 8.6% |
| $25,000 to $34,999 | 29 | 3.3% |
| $35,000 to $49,999 | 71 | 8.1% |
| $50,000 to $74,999 | 170 | 19.4% |
| $75,000 to $99,999 | 111 | 12.7% |
| $100,000 to $149,999 | 231 | 26.4% |
| $150,000 to $199,999 | 106 | 12.1% |
| $200,000+ | 46 | 5.3% |
Household Income by Householder Age in Pinckney
The median household income in Pinckney is $88,894, with the highest median household income of $102,250 found in the 45 to 64 years age bracket for the primary householder. A total of 403 households (46.1%) fall into this category. Meanwhile, the 15 to 24 years age bracket for the primary householder has the lowest median household income of $0, with 26 households (3.0%) in this group.
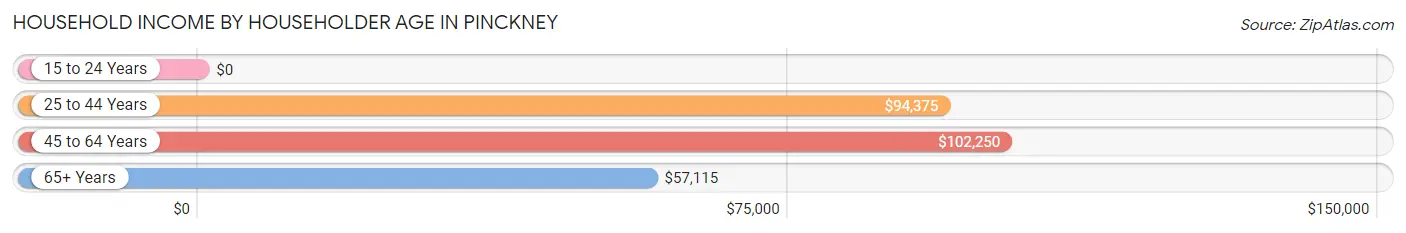
| Income Bracket | # Households | Median Income |
| 15 to 24 Years | 26 (3.0%) | $0 |
| 25 to 44 Years | 216 (24.7%) | $94,375 |
| 45 to 64 Years | 403 (46.1%) | $102,250 |
| 65+ Years | 230 (26.3%) | $57,115 |
| Total | 875 (100.0%) | $88,894 |
Poverty in Pinckney
Income Below Poverty by Sex and Age in Pinckney
With 4.9% poverty level for males and 6.6% for females among the residents of Pinckney, 12 to 14 year old males and under 5 year old females are the most vulnerable to poverty, with 8 males (38.1%) and 18 females (30.5%) in their respective age groups living below the poverty level.
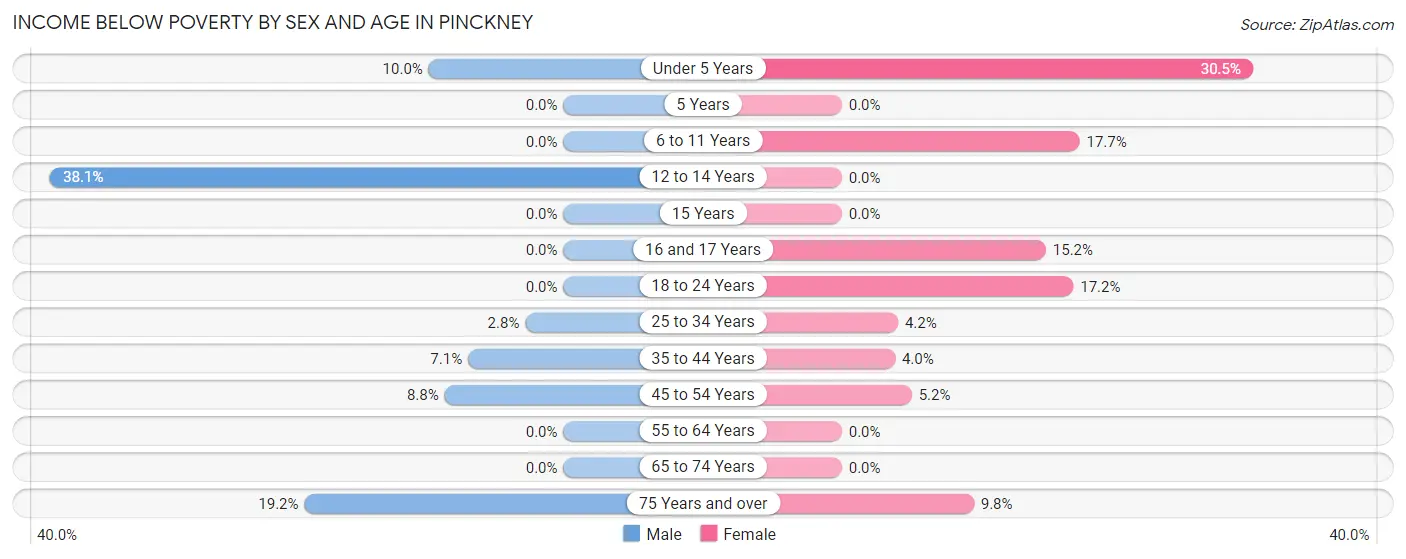
| Age Bracket | Male | Female |
| Under 5 Years | 3 (10.0%) | 18 (30.5%) |
| 5 Years | 0 (0.0%) | 0 (0.0%) |
| 6 to 11 Years | 0 (0.0%) | 12 (17.6%) |
| 12 to 14 Years | 8 (38.1%) | 0 (0.0%) |
| 15 Years | 0 (0.0%) | 0 (0.0%) |
| 16 and 17 Years | 0 (0.0%) | 5 (15.1%) |
| 18 to 24 Years | 0 (0.0%) | 11 (17.2%) |
| 25 to 34 Years | 3 (2.8%) | 5 (4.2%) |
| 35 to 44 Years | 8 (7.1%) | 6 (4.0%) |
| 45 to 54 Years | 12 (8.8%) | 7 (5.2%) |
| 55 to 64 Years | 0 (0.0%) | 0 (0.0%) |
| 65 to 74 Years | 0 (0.0%) | 0 (0.0%) |
| 75 Years and over | 10 (19.2%) | 5 (9.8%) |
| Total | 44 (4.9%) | 69 (6.6%) |
Income Above Poverty by Sex and Age in Pinckney
According to the poverty statistics in Pinckney, males aged 5 years and females aged 5 years are the age groups that are most secure financially, with 100.0% of males and 100.0% of females in these age groups living above the poverty line.
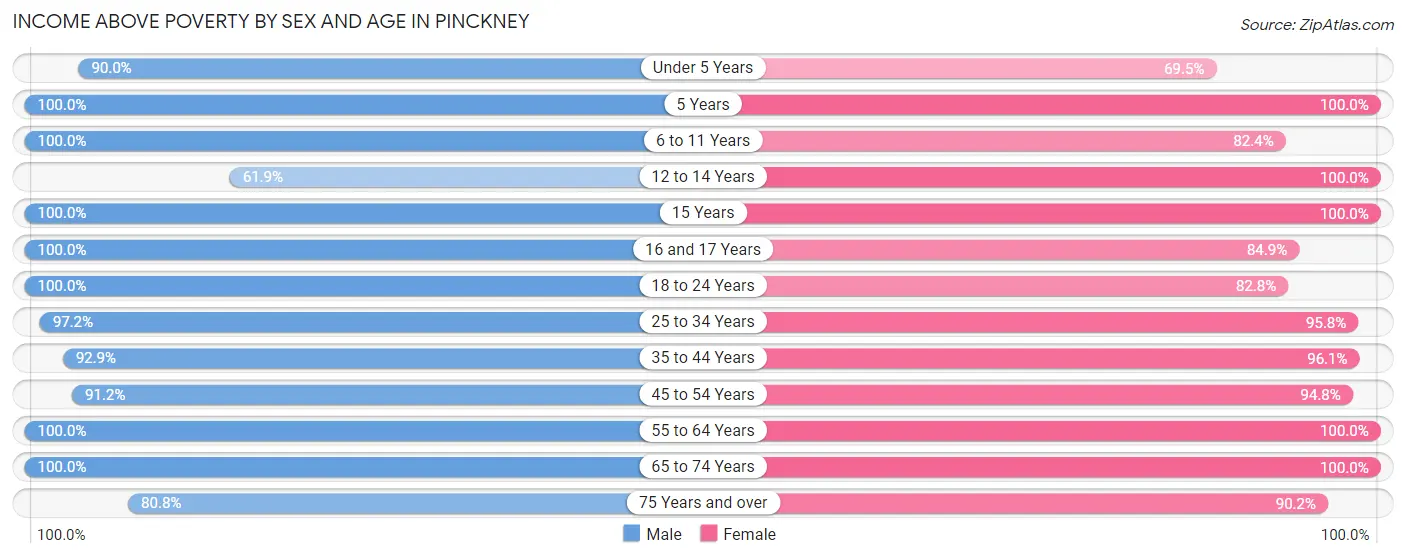
| Age Bracket | Male | Female |
| Under 5 Years | 27 (90.0%) | 41 (69.5%) |
| 5 Years | 7 (100.0%) | 27 (100.0%) |
| 6 to 11 Years | 21 (100.0%) | 56 (82.4%) |
| 12 to 14 Years | 13 (61.9%) | 40 (100.0%) |
| 15 Years | 4 (100.0%) | 14 (100.0%) |
| 16 and 17 Years | 25 (100.0%) | 28 (84.9%) |
| 18 to 24 Years | 120 (100.0%) | 53 (82.8%) |
| 25 to 34 Years | 103 (97.2%) | 115 (95.8%) |
| 35 to 44 Years | 105 (92.9%) | 146 (96.1%) |
| 45 to 54 Years | 124 (91.2%) | 128 (94.8%) |
| 55 to 64 Years | 183 (100.0%) | 139 (100.0%) |
| 65 to 74 Years | 73 (100.0%) | 144 (100.0%) |
| 75 Years and over | 42 (80.8%) | 46 (90.2%) |
| Total | 847 (95.1%) | 977 (93.4%) |
Income Below Poverty Among Married-Couple Families in Pinckney
The poverty statistics for married-couple families in Pinckney show that 1.7% or 6 of the total 357 families live below the poverty line. Families with 3 or 4 children have the highest poverty rate of 16.7%, comprising of 3 families. On the other hand, families with no children have the lowest poverty rate of 0.0%, which includes 0 families.
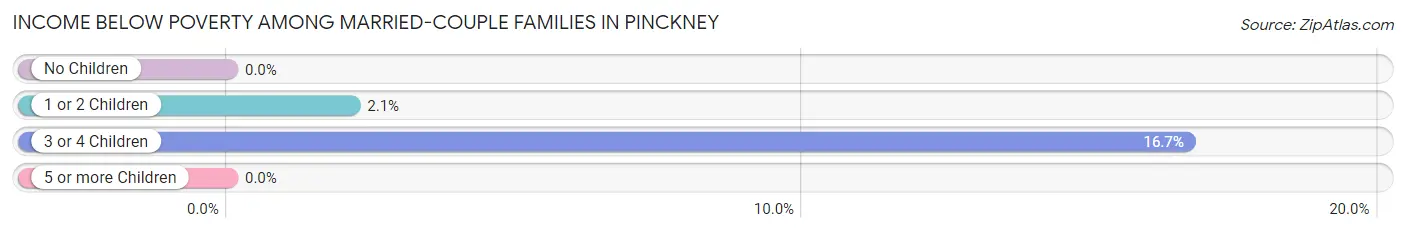
| Children | Above Poverty | Below Poverty |
| No Children | 198 (100.0%) | 0 (0.0%) |
| 1 or 2 Children | 138 (97.9%) | 3 (2.1%) |
| 3 or 4 Children | 15 (83.3%) | 3 (16.7%) |
| 5 or more Children | 0 (0.0%) | 0 (0.0%) |
| Total | 351 (98.3%) | 6 (1.7%) |
Income Below Poverty Among Single-Parent Households in Pinckney
According to the poverty data in Pinckney, 46.2% or 12 single-father households and 13.0% or 10 single-mother households are living below the poverty line. Among single-father households, those with 1 or 2 children have the highest poverty rate, with 12 households (75.0%) experiencing poverty. Likewise, among single-mother households, those with 1 or 2 children have the highest poverty rate, with 10 households (20.4%) falling below the poverty line.
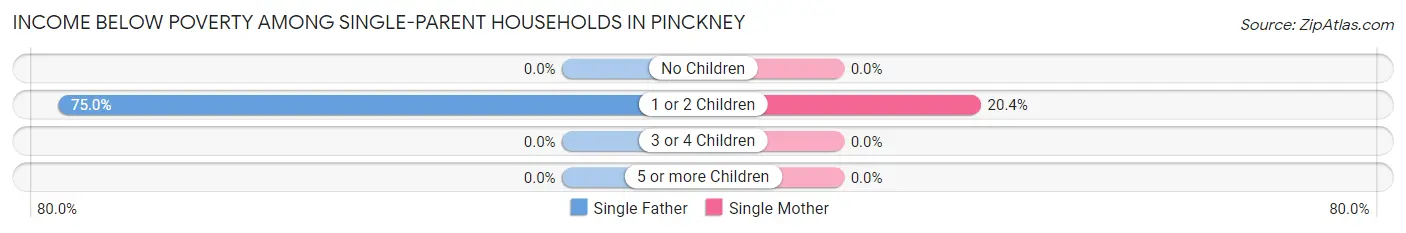
| Children | Single Father | Single Mother |
| No Children | 0 (0.0%) | 0 (0.0%) |
| 1 or 2 Children | 12 (75.0%) | 10 (20.4%) |
| 3 or 4 Children | 0 (0.0%) | 0 (0.0%) |
| 5 or more Children | 0 (0.0%) | 0 (0.0%) |
| Total | 12 (46.2%) | 10 (13.0%) |
Income Below Poverty Among Married-Couple vs Single-Parent Households in Pinckney
The poverty data for Pinckney shows that 6 of the married-couple family households (1.7%) and 22 of the single-parent households (21.4%) are living below the poverty level. Within the married-couple family households, those with 3 or 4 children have the highest poverty rate, with 3 households (16.7%) falling below the poverty line. Among the single-parent households, those with 1 or 2 children have the highest poverty rate, with 22 household (33.9%) living below poverty.
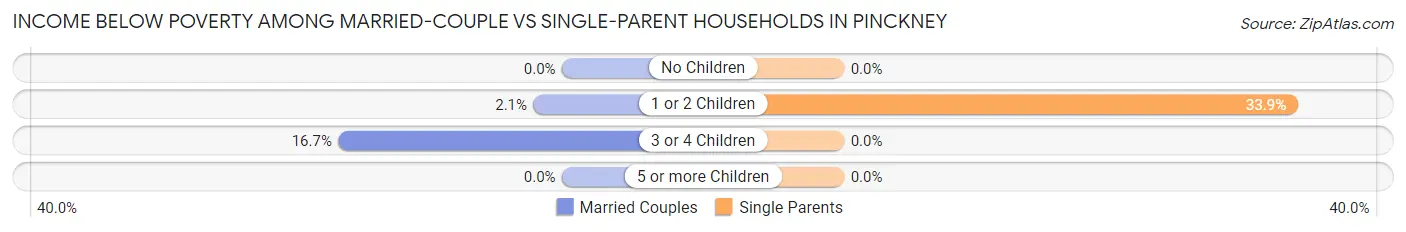
| Children | Married-Couple Families | Single-Parent Households |
| No Children | 0 (0.0%) | 0 (0.0%) |
| 1 or 2 Children | 3 (2.1%) | 22 (33.9%) |
| 3 or 4 Children | 3 (16.7%) | 0 (0.0%) |
| 5 or more Children | 0 (0.0%) | 0 (0.0%) |
| Total | 6 (1.7%) | 22 (21.4%) |
Race in Pinckney
The most populous races in Pinckney are White / Caucasian (1,777 | 91.1%), Two or more Races (115 | 5.9%), and Hispanic or Latino (105 | 5.4%).
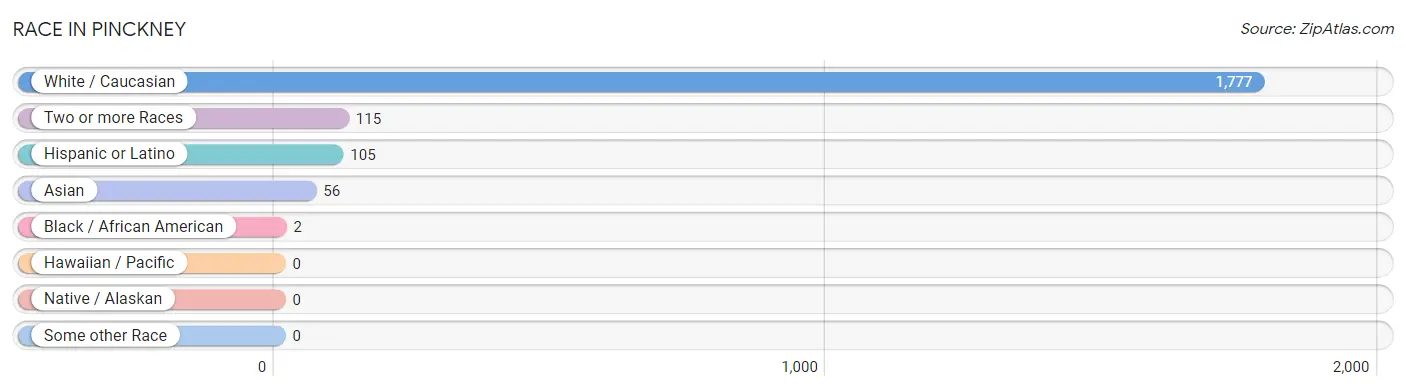
| Race | # Population | % Population |
| Asian | 56 | 2.9% |
| Black / African American | 2 | 0.1% |
| Hawaiian / Pacific | 0 | 0.0% |
| Hispanic or Latino | 105 | 5.4% |
| Native / Alaskan | 0 | 0.0% |
| White / Caucasian | 1,777 | 91.1% |
| Two or more Races | 115 | 5.9% |
| Some other Race | 0 | 0.0% |
| Total | 1,950 | 100.0% |
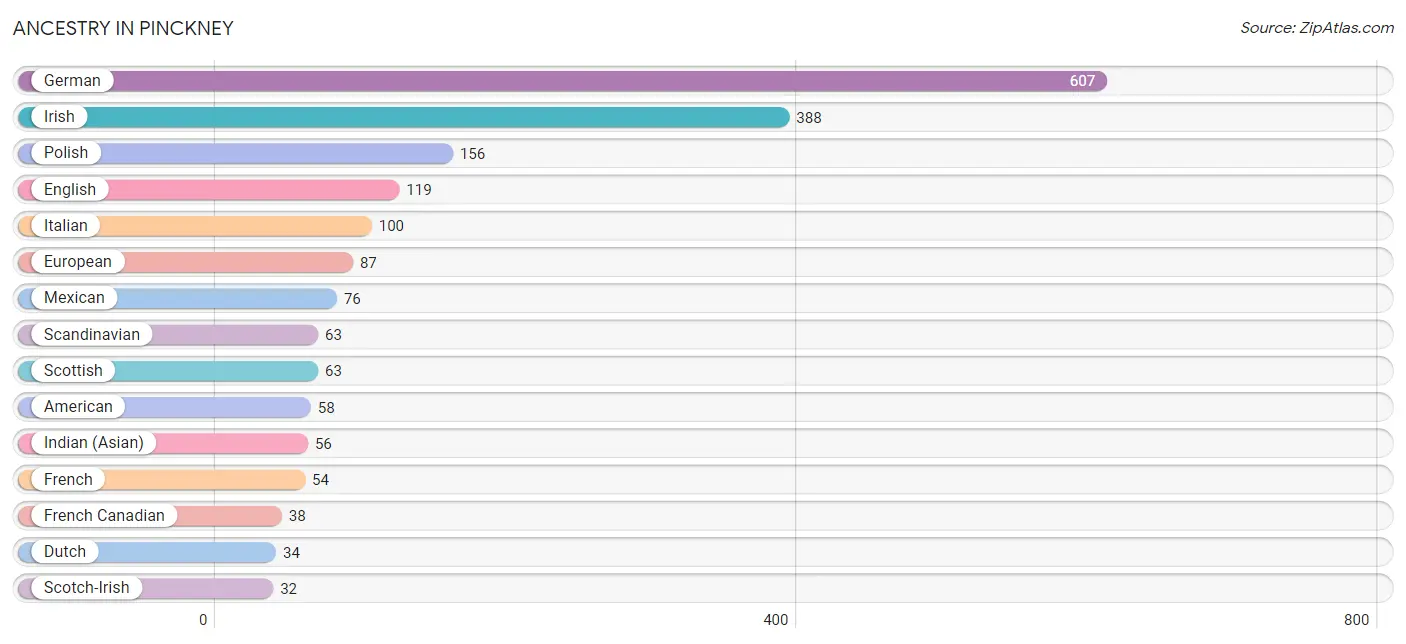
Ancestry in Pinckney
The most populous ancestries reported in Pinckney are German (607 | 31.1%), Irish (388 | 19.9%), Polish (156 | 8.0%), English (119 | 6.1%), and Italian (100 | 5.1%), together accounting for 70.3% of all Pinckney residents.
| Ancestry | # Population | % Population |
| American | 58 | 3.0% |
| Arab | 10 | 0.5% |
| Austrian | 17 | 0.9% |
| Belgian | 4 | 0.2% |
| British | 4 | 0.2% |
| Canadian | 17 | 0.9% |
| Cherokee | 1 | 0.1% |
| Czechoslovakian | 5 | 0.3% |
| Danish | 1 | 0.1% |
| Dutch | 34 | 1.7% |
| Eastern European | 14 | 0.7% |
| English | 119 | 6.1% |
| European | 87 | 4.5% |
| Finnish | 15 | 0.8% |
| French | 54 | 2.8% |
| French Canadian | 38 | 1.9% |
| German | 607 | 31.1% |
| Hungarian | 15 | 0.8% |
| Indian (Asian) | 56 | 2.9% |
| Irish | 388 | 19.9% |
| Italian | 100 | 5.1% |
| Jamaican | 6 | 0.3% |
| Latvian | 14 | 0.7% |
| Lebanese | 4 | 0.2% |
| Lithuanian | 5 | 0.3% |
| Luxembourger | 5 | 0.3% |
| Maltese | 8 | 0.4% |
| Mexican | 76 | 3.9% |
| Norwegian | 9 | 0.5% |
| Polish | 156 | 8.0% |
| Portuguese | 10 | 0.5% |
| Puerto Rican | 14 | 0.7% |
| Russian | 24 | 1.2% |
| Scandinavian | 63 | 3.2% |
| Scotch-Irish | 32 | 1.6% |
| Scottish | 63 | 3.2% |
| Serbian | 4 | 0.2% |
| Slovak | 5 | 0.3% |
| Spanish | 15 | 0.8% |
| Swedish | 14 | 0.7% |
| Syrian | 6 | 0.3% |
| Trinidadian and Tobagonian | 8 | 0.4% |
| Ukrainian | 10 | 0.5% |
| Welsh | 8 | 0.4% | View All 44 Rows |
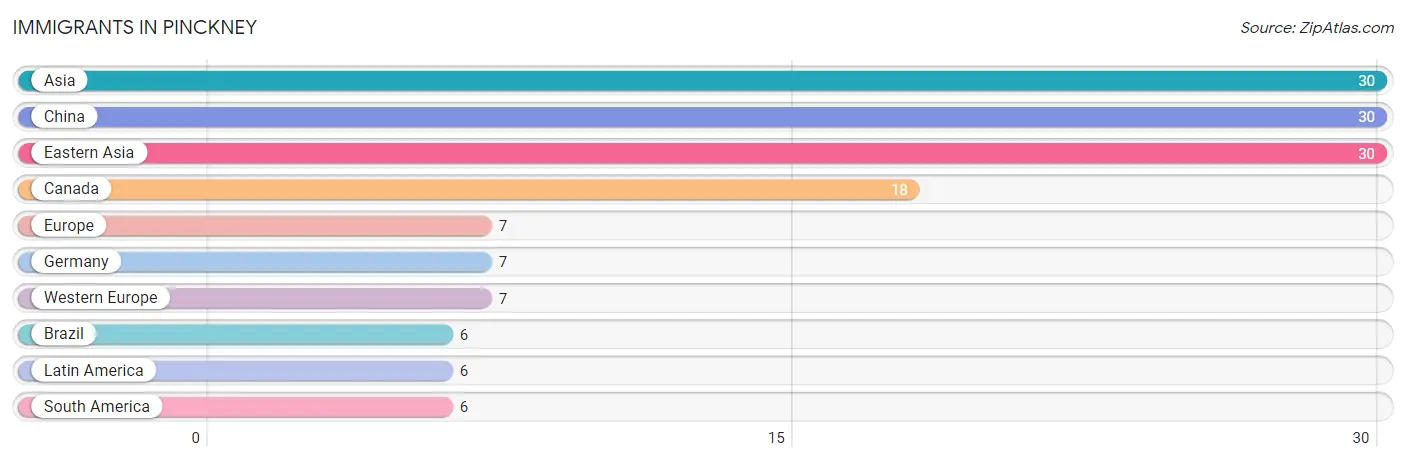
Immigrants in Pinckney
The most numerous immigrant groups reported in Pinckney came from Asia (30 | 1.5%), China (30 | 1.5%), Eastern Asia (30 | 1.5%), Canada (18 | 0.9%), and Europe (7 | 0.4%), together accounting for 5.9% of all Pinckney residents.
| Immigration Origin | # Population | % Population |
| Asia | 30 | 1.5% |
| Brazil | 6 | 0.3% |
| Canada | 18 | 0.9% |
| China | 30 | 1.5% |
| Eastern Asia | 30 | 1.5% |
| Europe | 7 | 0.4% |
| Germany | 7 | 0.4% |
| Latin America | 6 | 0.3% |
| South America | 6 | 0.3% |
| Western Europe | 7 | 0.4% | View All 10 Rows |
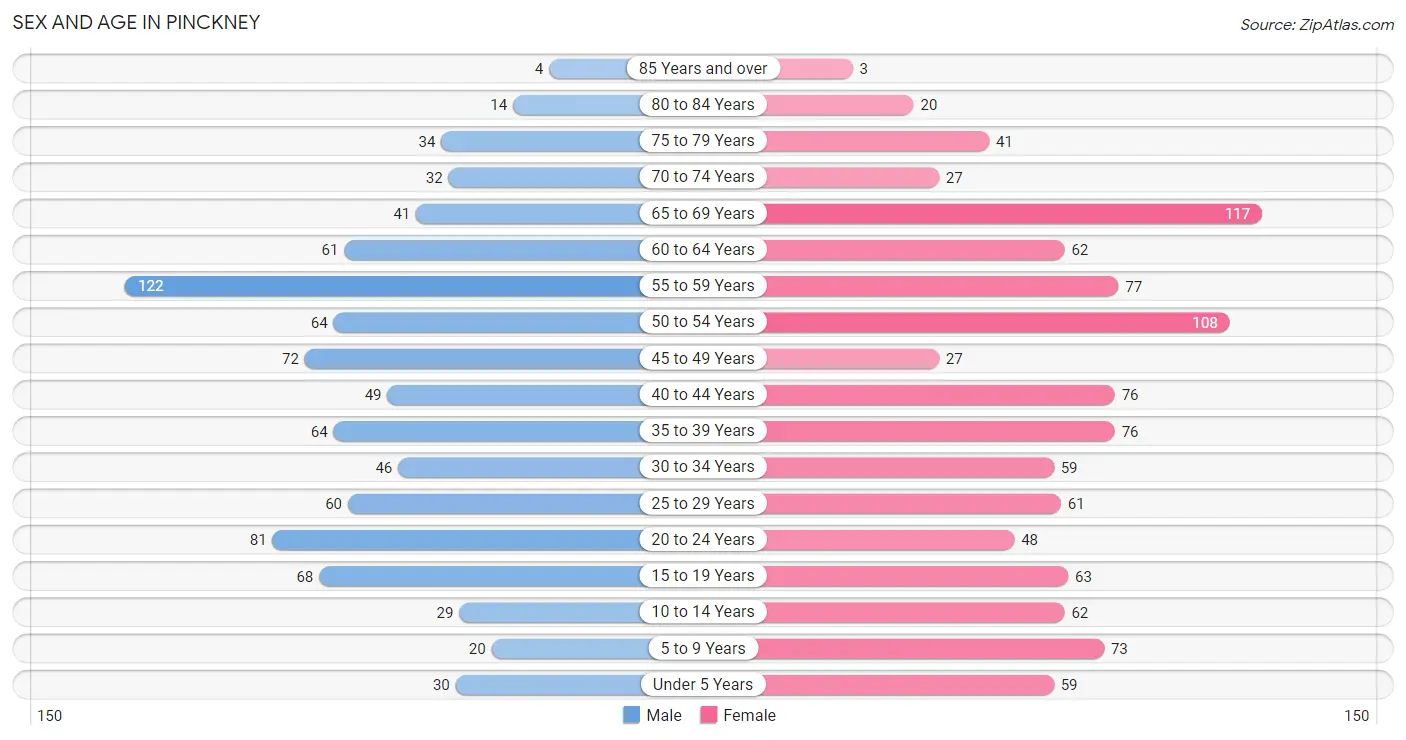
Sex and Age in Pinckney
Sex and Age in Pinckney
The most populous age groups in Pinckney are 55 to 59 Years (122 | 13.7%) for men and 65 to 69 Years (117 | 11.1%) for women.
| Age Bracket | Male | Female |
| Under 5 Years | 30 (3.4%) | 59 (5.6%) |
| 5 to 9 Years | 20 (2.2%) | 73 (6.9%) |
| 10 to 14 Years | 29 (3.3%) | 62 (5.9%) |
| 15 to 19 Years | 68 (7.6%) | 63 (5.9%) |
| 20 to 24 Years | 81 (9.1%) | 48 (4.5%) |
| 25 to 29 Years | 60 (6.7%) | 61 (5.8%) |
| 30 to 34 Years | 46 (5.2%) | 59 (5.6%) |
| 35 to 39 Years | 64 (7.2%) | 76 (7.2%) |
| 40 to 44 Years | 49 (5.5%) | 76 (7.2%) |
| 45 to 49 Years | 72 (8.1%) | 27 (2.5%) |
| 50 to 54 Years | 64 (7.2%) | 108 (10.2%) |
| 55 to 59 Years | 122 (13.7%) | 77 (7.3%) |
| 60 to 64 Years | 61 (6.9%) | 62 (5.9%) |
| 65 to 69 Years | 41 (4.6%) | 117 (11.1%) |
| 70 to 74 Years | 32 (3.6%) | 27 (2.5%) |
| 75 to 79 Years | 34 (3.8%) | 41 (3.9%) |
| 80 to 84 Years | 14 (1.6%) | 20 (1.9%) |
| 85 Years and over | 4 (0.4%) | 3 (0.3%) |
| Total | 891 (100.0%) | 1,059 (100.0%) |
Families and Households in Pinckney
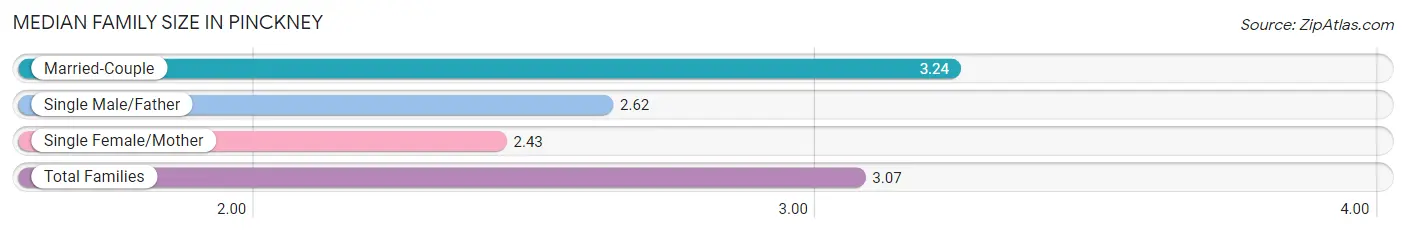
Median Family Size in Pinckney
The median family size in Pinckney is 3.07 persons per family, with married-couple families (357 | 77.6%) accounting for the largest median family size of 3.24 persons per family. On the other hand, single female/mother families (77 | 16.7%) represent the smallest median family size with 2.43 persons per family.
| Family Type | # Families | Family Size |
| Married-Couple | 357 (77.6%) | 3.24 |
| Single Male/Father | 26 (5.7%) | 2.62 |
| Single Female/Mother | 77 (16.7%) | 2.43 |
| Total Families | 460 (100.0%) | 3.07 |
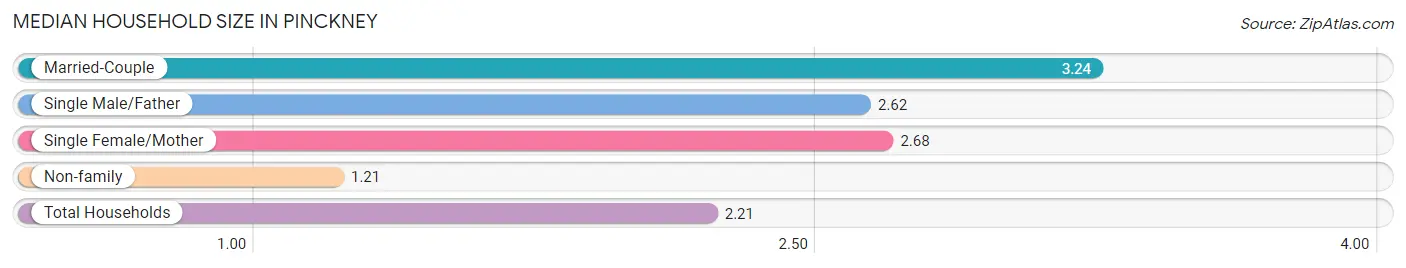
Median Household Size in Pinckney
The median household size in Pinckney is 2.21 persons per household, with married-couple households (357 | 40.8%) accounting for the largest median household size of 3.24 persons per household. non-family households (415 | 47.4%) represent the smallest median household size with 1.21 persons per household.
| Household Type | # Households | Household Size |
| Married-Couple | 357 (40.8%) | 3.24 |
| Single Male/Father | 26 (3.0%) | 2.62 |
| Single Female/Mother | 77 (8.8%) | 2.68 |
| Non-family | 415 (47.4%) | 1.21 |
| Total Households | 875 (100.0%) | 2.21 |
Household Size by Marriage Status in Pinckney
Out of a total of 875 households in Pinckney, 460 (52.6%) are family households, while 415 (47.4%) are nonfamily households. The most numerous type of family households are 2-person households, comprising 187, and the most common type of nonfamily households are 1-person households, comprising 336.
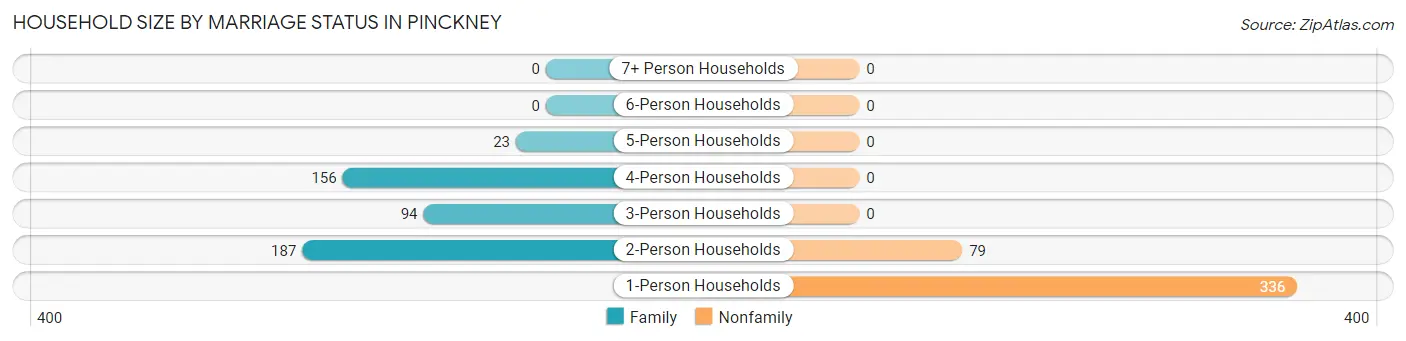
| Household Size | Family Households | Nonfamily Households |
| 1-Person Households | - | 336 (38.4%) |
| 2-Person Households | 187 (21.4%) | 79 (9.0%) |
| 3-Person Households | 94 (10.7%) | 0 (0.0%) |
| 4-Person Households | 156 (17.8%) | 0 (0.0%) |
| 5-Person Households | 23 (2.6%) | 0 (0.0%) |
| 6-Person Households | 0 (0.0%) | 0 (0.0%) |
| 7+ Person Households | 0 (0.0%) | 0 (0.0%) |
| Total | 460 (52.6%) | 415 (47.4%) |
Female Fertility in Pinckney
Fertility by Age in Pinckney
Average fertility rate in Pinckney is 54.0 births per 1,000 women. Women in the age bracket of 20 to 34 years have the highest fertility rate with 137.0 births per 1,000 women. Women in the age bracket of 20 to 34 years acount for 100.0% of all women with births.
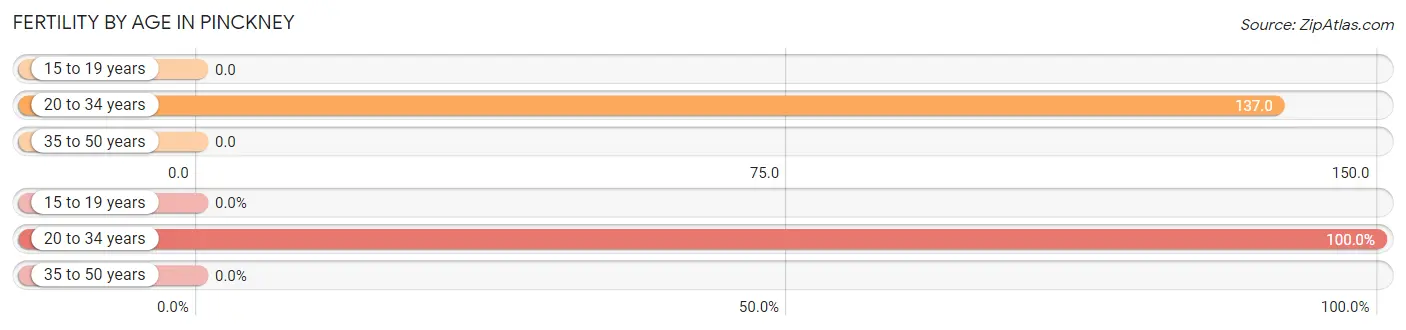
| Age Bracket | Women with Births | Births / 1,000 Women |
| 15 to 19 years | 0 (0.0%) | 0.0 |
| 20 to 34 years | 23 (100.0%) | 137.0 |
| 35 to 50 years | 0 (0.0%) | 0.0 |
| Total | 23 (100.0%) | 54.0 |
Fertility by Age by Marriage Status in Pinckney
65.2% of women with births (23) in Pinckney are married. The highest percentage of unmarried women with births falls into 20 to 34 years age bracket with 34.8% of them unmarried at the time of birth, while the lowest percentage of unmarried women with births belong to 20 to 34 years age bracket with 34.8% of them unmarried.
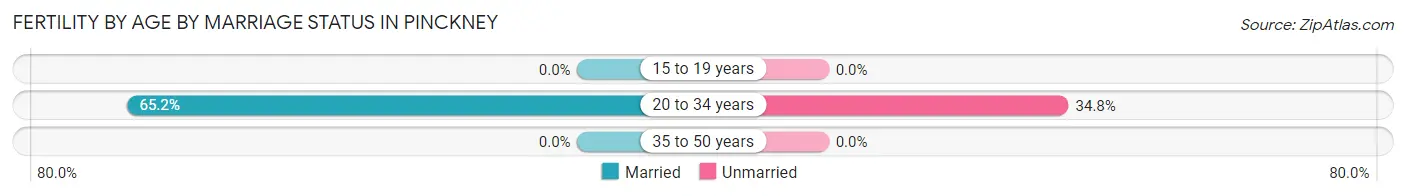
| Age Bracket | Married | Unmarried |
| 15 to 19 years | 0 (0.0%) | 0 (0.0%) |
| 20 to 34 years | 15 (65.2%) | 8 (34.8%) |
| 35 to 50 years | 0 (0.0%) | 0 (0.0%) |
| Total | 15 (65.2%) | 8 (34.8%) |
Fertility by Education in Pinckney
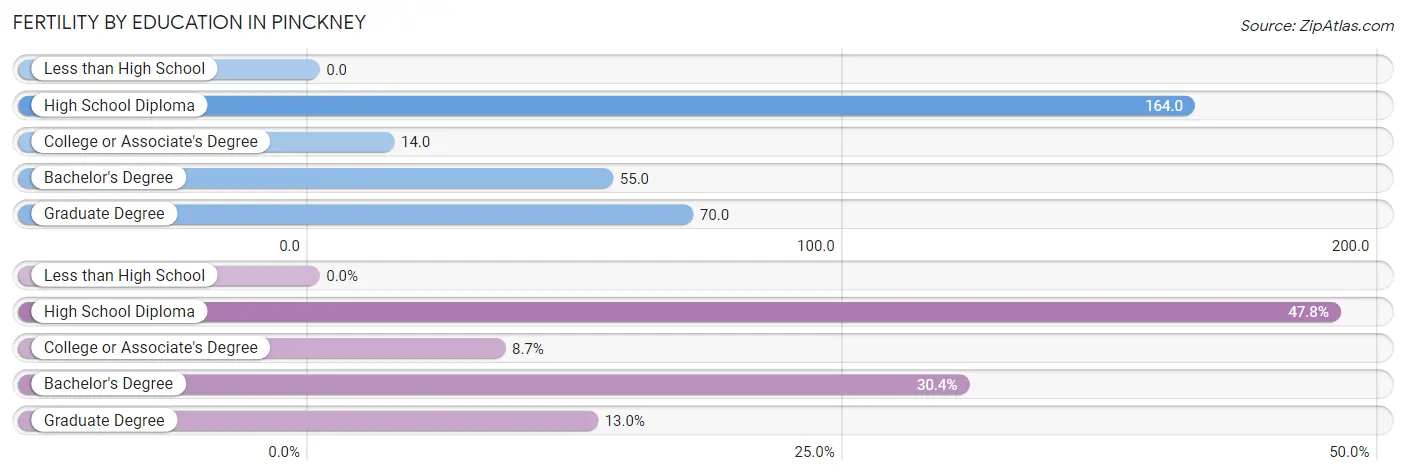
| Educational Attainment | Women with Births | Births / 1,000 Women |
| Less than High School | 0 (0.0%) | 0.0 |
| High School Diploma | 11 (47.8%) | 164.0 |
| College or Associate's Degree | 2 (8.7%) | 14.0 |
| Bachelor's Degree | 7 (30.4%) | 55.0 |
| Graduate Degree | 3 (13.0%) | 70.0 |
| Total | 23 (100.0%) | 54.0 |
Fertility by Education by Marriage Status in Pinckney
34.8% of women with births in Pinckney are unmarried. Women with the educational attainment of bachelor's degree are most likely to be married with 100.0% of them married at childbirth, while women with the educational attainment of college or associate's degree are least likely to be married with 100.0% of them unmarried at childbirth.
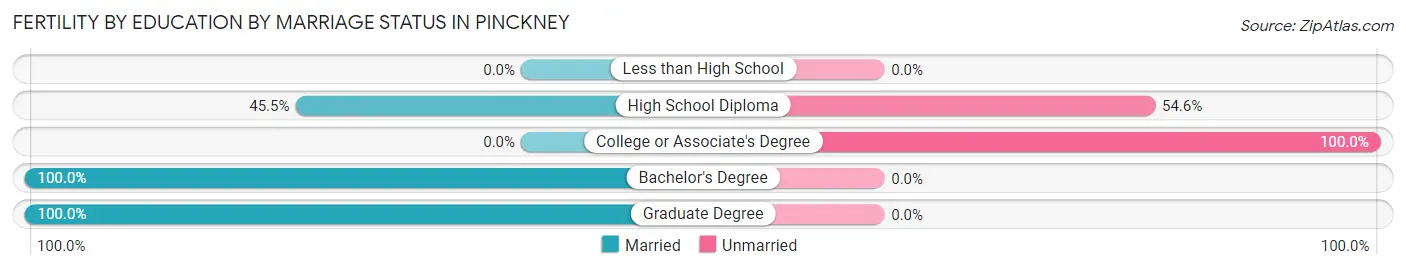
| Educational Attainment | Married | Unmarried |
| Less than High School | 0 (0.0%) | 0 (0.0%) |
| High School Diploma | 5 (45.5%) | 6 (54.5%) |
| College or Associate's Degree | 0 (0.0%) | 2 (100.0%) |
| Bachelor's Degree | 7 (100.0%) | 0 (0.0%) |
| Graduate Degree | 3 (100.0%) | 0 (0.0%) |
| Total | 15 (65.2%) | 8 (34.8%) |
Employment Characteristics in Pinckney
Employment by Class of Employer in Pinckney
Among the 1,080 employed individuals in Pinckney, private company employees (801 | 74.2%), self-employed (not incorporated) (74 | 6.9%), and not-for-profit organizations (66 | 6.1%) make up the most common classes of employment.
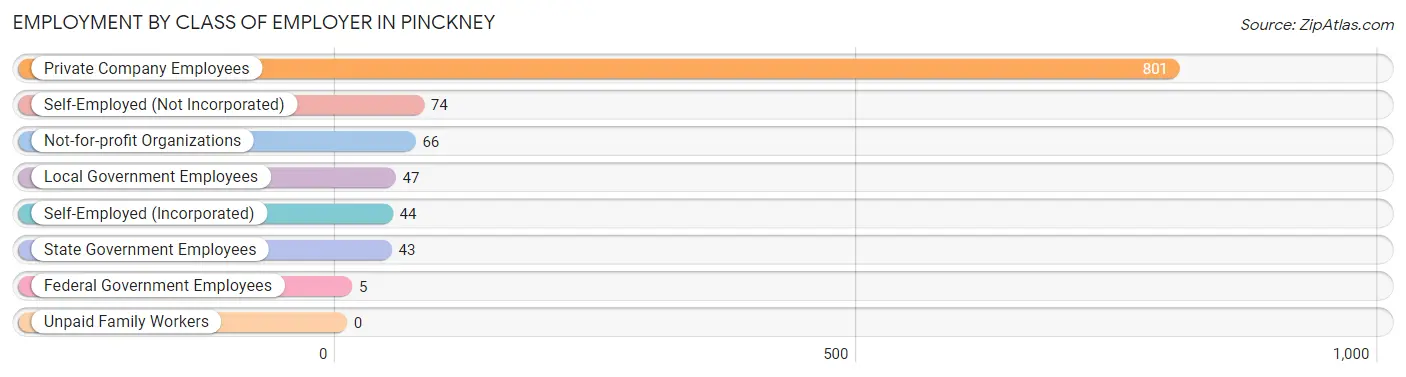
| Employer Class | # Employees | % Employees |
| Private Company Employees | 801 | 74.2% |
| Self-Employed (Incorporated) | 44 | 4.1% |
| Self-Employed (Not Incorporated) | 74 | 6.9% |
| Not-for-profit Organizations | 66 | 6.1% |
| Local Government Employees | 47 | 4.3% |
| State Government Employees | 43 | 4.0% |
| Federal Government Employees | 5 | 0.5% |
| Unpaid Family Workers | 0 | 0.0% |
| Total | 1,080 | 100.0% |
Employment Status by Age in Pinckney
According to the labor force statistics for Pinckney, out of the total population over 16 years of age (1,659), 70.5% or 1,170 individuals are in the labor force, with 5.6% or 66 of them unemployed. The age group with the highest labor force participation rate is 35 to 44 years, with 93.6% or 248 individuals in the labor force. Within the labor force, the 16 to 19 years age range has the highest percentage of unemployed individuals, with 52.8% or 38 of them being unemployed.
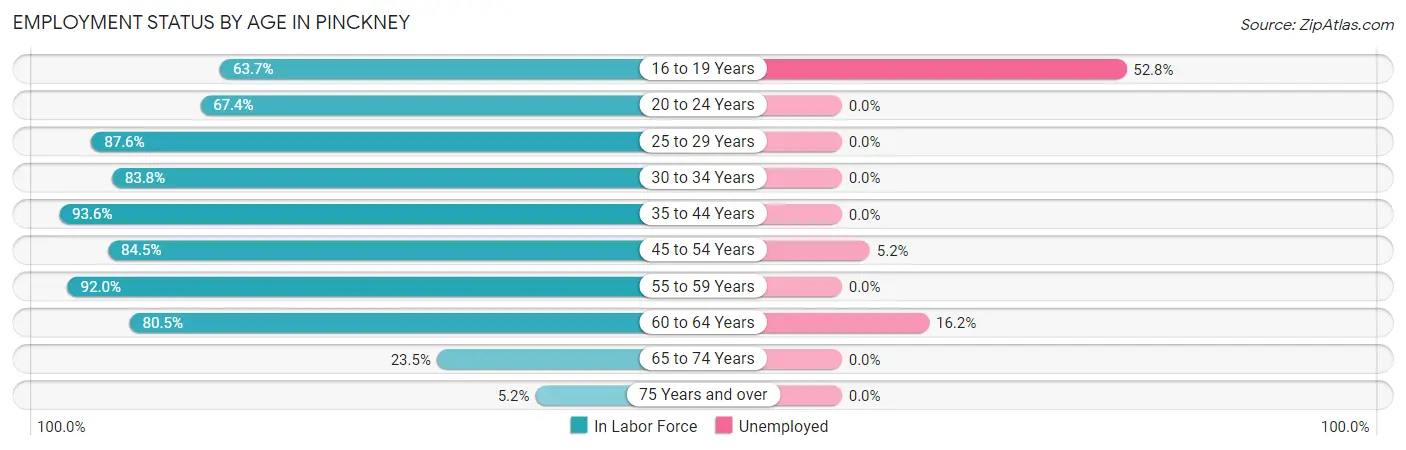
| Age Bracket | In Labor Force | Unemployed |
| 16 to 19 Years | 72 (63.7%) | 38 (52.8%) |
| 20 to 24 Years | 87 (67.4%) | 0 (0.0%) |
| 25 to 29 Years | 106 (87.6%) | 0 (0.0%) |
| 30 to 34 Years | 88 (83.8%) | 0 (0.0%) |
| 35 to 44 Years | 248 (93.6%) | 0 (0.0%) |
| 45 to 54 Years | 229 (84.5%) | 12 (5.2%) |
| 55 to 59 Years | 183 (92.0%) | 0 (0.0%) |
| 60 to 64 Years | 99 (80.5%) | 16 (16.2%) |
| 65 to 74 Years | 51 (23.5%) | 0 (0.0%) |
| 75 Years and over | 6 (5.2%) | 0 (0.0%) |
| Total | 1,170 (70.5%) | 66 (5.6%) |
Employment Status by Educational Attainment in Pinckney
According to labor force statistics for Pinckney, 87.9% of individuals (953) out of the total population between 25 and 64 years of age (1,084) are in the labor force, with 2.9% or 28 of them being unemployed. The group with the highest labor force participation rate are those with the educational attainment of college / associate degree, with 92.7% or 394 individuals in the labor force. Within the labor force, individuals with less than high school education have the highest percentage of unemployment, with 58.3% or 28 of them being unemployed.
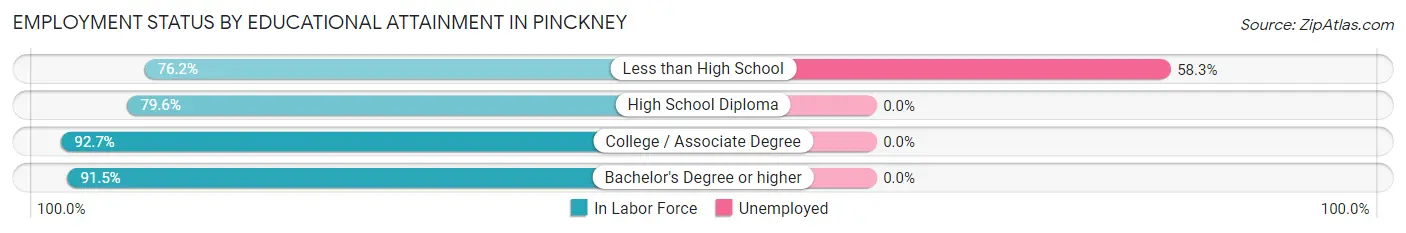
| Educational Attainment | In Labor Force | Unemployed |
| Less than High School | 48 (76.2%) | 37 (58.3%) |
| High School Diploma | 230 (79.6%) | 0 (0.0%) |
| College / Associate Degree | 394 (92.7%) | 0 (0.0%) |
| Bachelor's Degree or higher | 281 (91.5%) | 0 (0.0%) |
| Total | 953 (87.9%) | 31 (2.9%) |
Employment Occupations by Sex in Pinckney
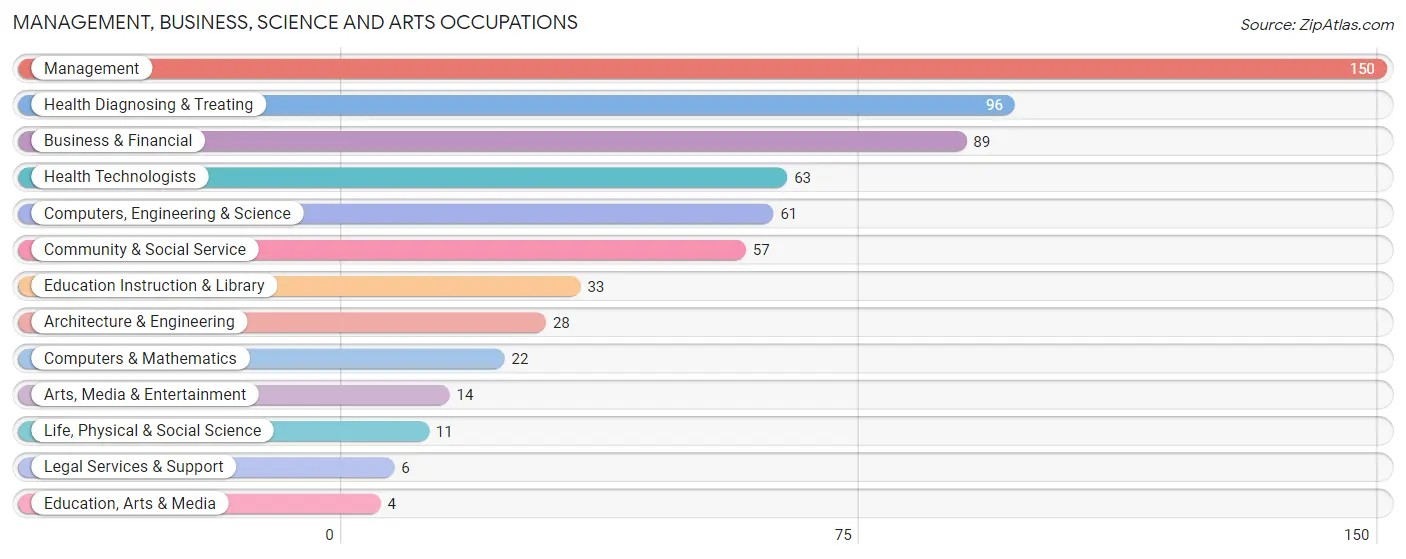
Management, Business, Science and Arts Occupations
The most common Management, Business, Science and Arts occupations in Pinckney are Management (150 | 13.6%), Health Diagnosing & Treating (96 | 8.7%), Business & Financial (89 | 8.1%), Health Technologists (63 | 5.7%), and Computers, Engineering & Science (61 | 5.5%).
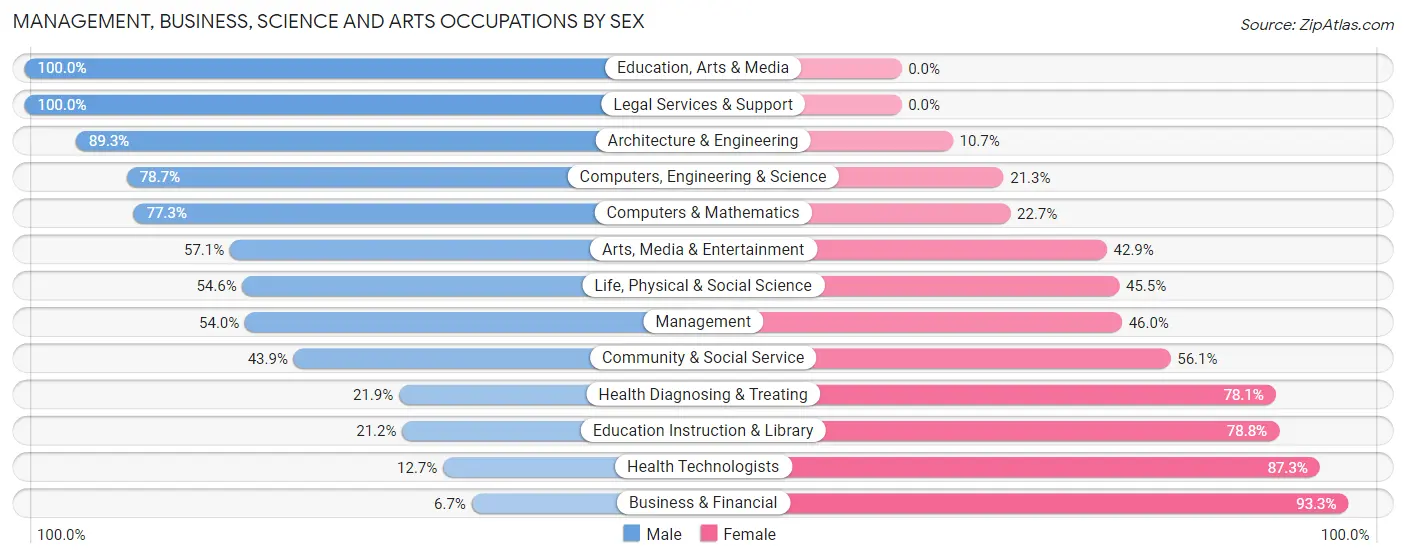
Management, Business, Science and Arts Occupations by Sex
Within the Management, Business, Science and Arts occupations in Pinckney, the most male-oriented occupations are Education, Arts & Media (100.0%), Legal Services & Support (100.0%), and Architecture & Engineering (89.3%), while the most female-oriented occupations are Business & Financial (93.3%), Health Technologists (87.3%), and Education Instruction & Library (78.8%).
| Occupation | Male | Female |
| Management | 81 (54.0%) | 69 (46.0%) |
| Business & Financial | 6 (6.7%) | 83 (93.3%) |
| Computers, Engineering & Science | 48 (78.7%) | 13 (21.3%) |
| Computers & Mathematics | 17 (77.3%) | 5 (22.7%) |
| Architecture & Engineering | 25 (89.3%) | 3 (10.7%) |
| Life, Physical & Social Science | 6 (54.5%) | 5 (45.5%) |
| Community & Social Service | 25 (43.9%) | 32 (56.1%) |
| Education, Arts & Media | 4 (100.0%) | 0 (0.0%) |
| Legal Services & Support | 6 (100.0%) | 0 (0.0%) |
| Education Instruction & Library | 7 (21.2%) | 26 (78.8%) |
| Arts, Media & Entertainment | 8 (57.1%) | 6 (42.9%) |
| Health Diagnosing & Treating | 21 (21.9%) | 75 (78.1%) |
| Health Technologists | 8 (12.7%) | 55 (87.3%) |
| Total (Category) | 181 (40.0%) | 272 (60.0%) |
| Total (Overall) | 568 (51.5%) | 535 (48.5%) |
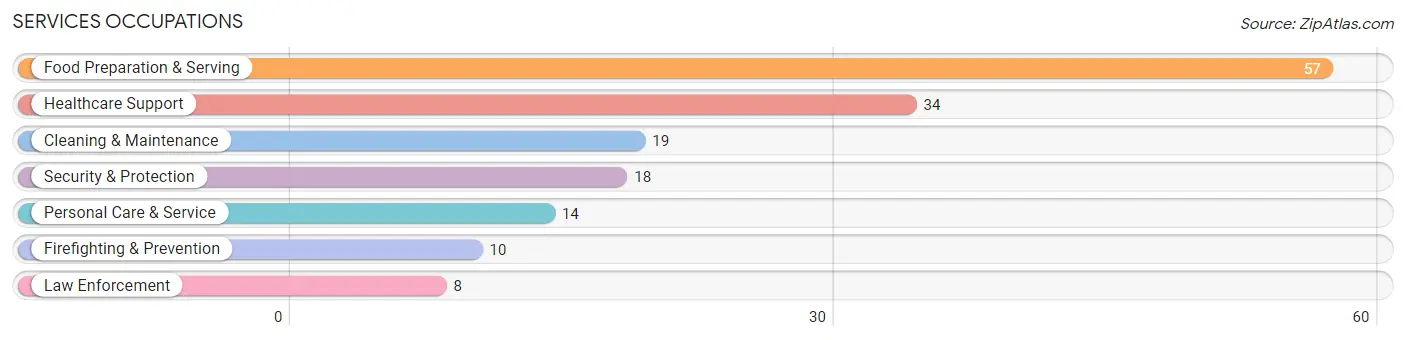
Services Occupations
The most common Services occupations in Pinckney are Food Preparation & Serving (57 | 5.2%), Healthcare Support (34 | 3.1%), Cleaning & Maintenance (19 | 1.7%), Security & Protection (18 | 1.6%), and Personal Care & Service (14 | 1.3%).
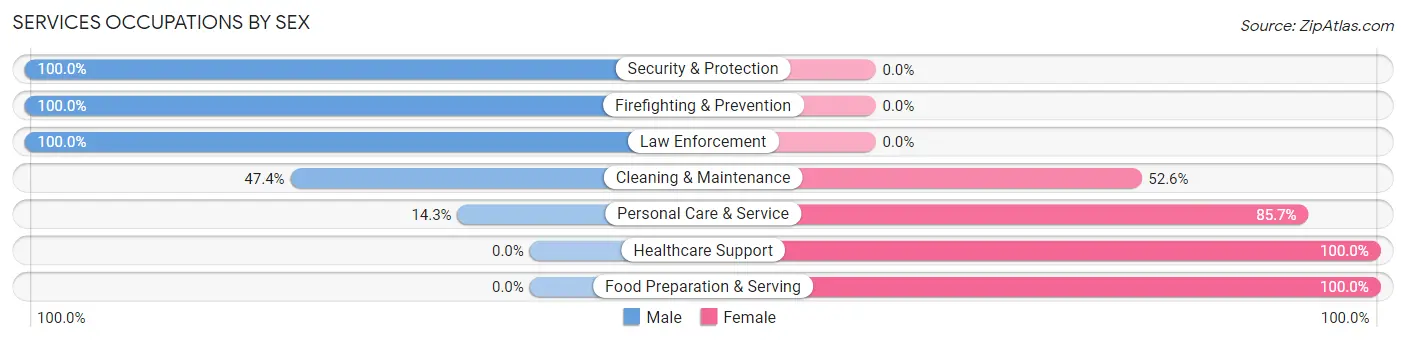
Services Occupations by Sex
Within the Services occupations in Pinckney, the most male-oriented occupations are Security & Protection (100.0%), Firefighting & Prevention (100.0%), and Law Enforcement (100.0%), while the most female-oriented occupations are Healthcare Support (100.0%), Food Preparation & Serving (100.0%), and Personal Care & Service (85.7%).
| Occupation | Male | Female |
| Healthcare Support | 0 (0.0%) | 34 (100.0%) |
| Security & Protection | 18 (100.0%) | 0 (0.0%) |
| Firefighting & Prevention | 10 (100.0%) | 0 (0.0%) |
| Law Enforcement | 8 (100.0%) | 0 (0.0%) |
| Food Preparation & Serving | 0 (0.0%) | 57 (100.0%) |
| Cleaning & Maintenance | 9 (47.4%) | 10 (52.6%) |
| Personal Care & Service | 2 (14.3%) | 12 (85.7%) |
| Total (Category) | 29 (20.4%) | 113 (79.6%) |
| Total (Overall) | 568 (51.5%) | 535 (48.5%) |
Sales and Office Occupations
The most common Sales and Office occupations in Pinckney are Office & Administration (126 | 11.4%), and Sales & Related (125 | 11.3%).

Sales and Office Occupations by Sex

| Occupation | Male | Female |
| Sales & Related | 98 (78.4%) | 27 (21.6%) |
| Office & Administration | 21 (16.7%) | 105 (83.3%) |
| Total (Category) | 119 (47.4%) | 132 (52.6%) |
| Total (Overall) | 568 (51.5%) | 535 (48.5%) |
Natural Resources, Construction and Maintenance Occupations
The most common Natural Resources, Construction and Maintenance occupations in Pinckney are Construction & Extraction (72 | 6.5%), and Installation, Maintenance & Repair (63 | 5.7%).
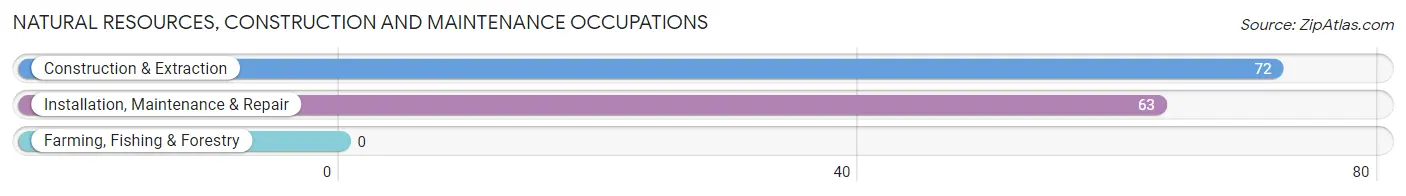
Natural Resources, Construction and Maintenance Occupations by Sex
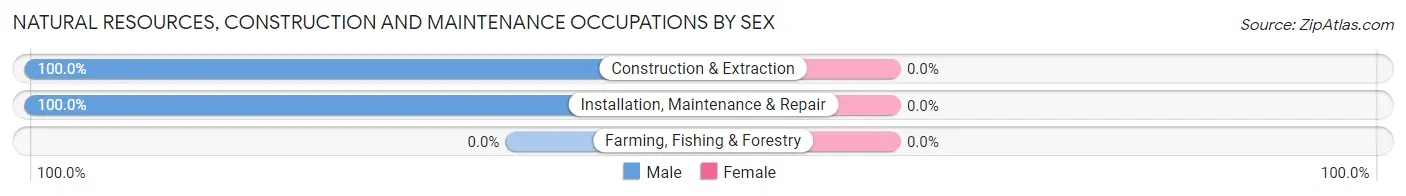
| Occupation | Male | Female |
| Farming, Fishing & Forestry | 0 (0.0%) | 0 (0.0%) |
| Construction & Extraction | 72 (100.0%) | 0 (0.0%) |
| Installation, Maintenance & Repair | 63 (100.0%) | 0 (0.0%) |
| Total (Category) | 135 (100.0%) | 0 (0.0%) |
| Total (Overall) | 568 (51.5%) | 535 (48.5%) |
Production, Transportation and Moving Occupations
The most common Production, Transportation and Moving occupations in Pinckney are Production (62 | 5.6%), Transportation (36 | 3.3%), and Material Moving (24 | 2.2%).
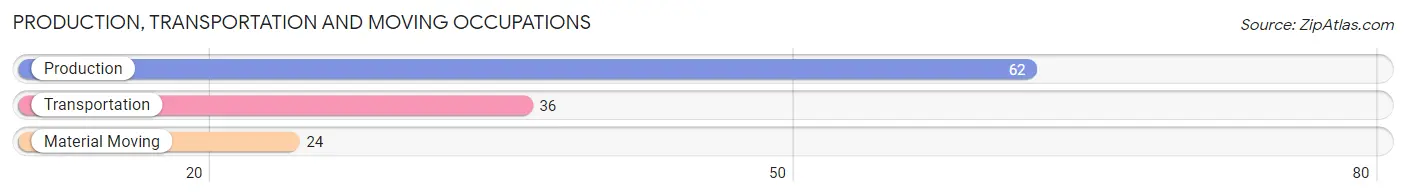
Production, Transportation and Moving Occupations by Sex
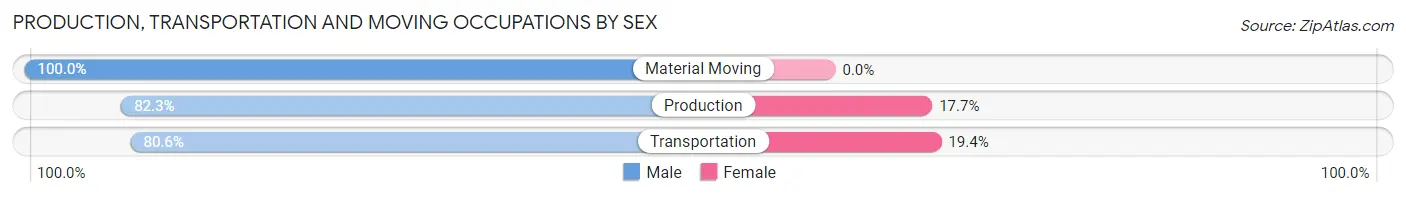
| Occupation | Male | Female |
| Production | 51 (82.3%) | 11 (17.7%) |
| Transportation | 29 (80.6%) | 7 (19.4%) |
| Material Moving | 24 (100.0%) | 0 (0.0%) |
| Total (Category) | 104 (85.3%) | 18 (14.7%) |
| Total (Overall) | 568 (51.5%) | 535 (48.5%) |
Employment Industries by Sex in Pinckney
Employment Industries in Pinckney
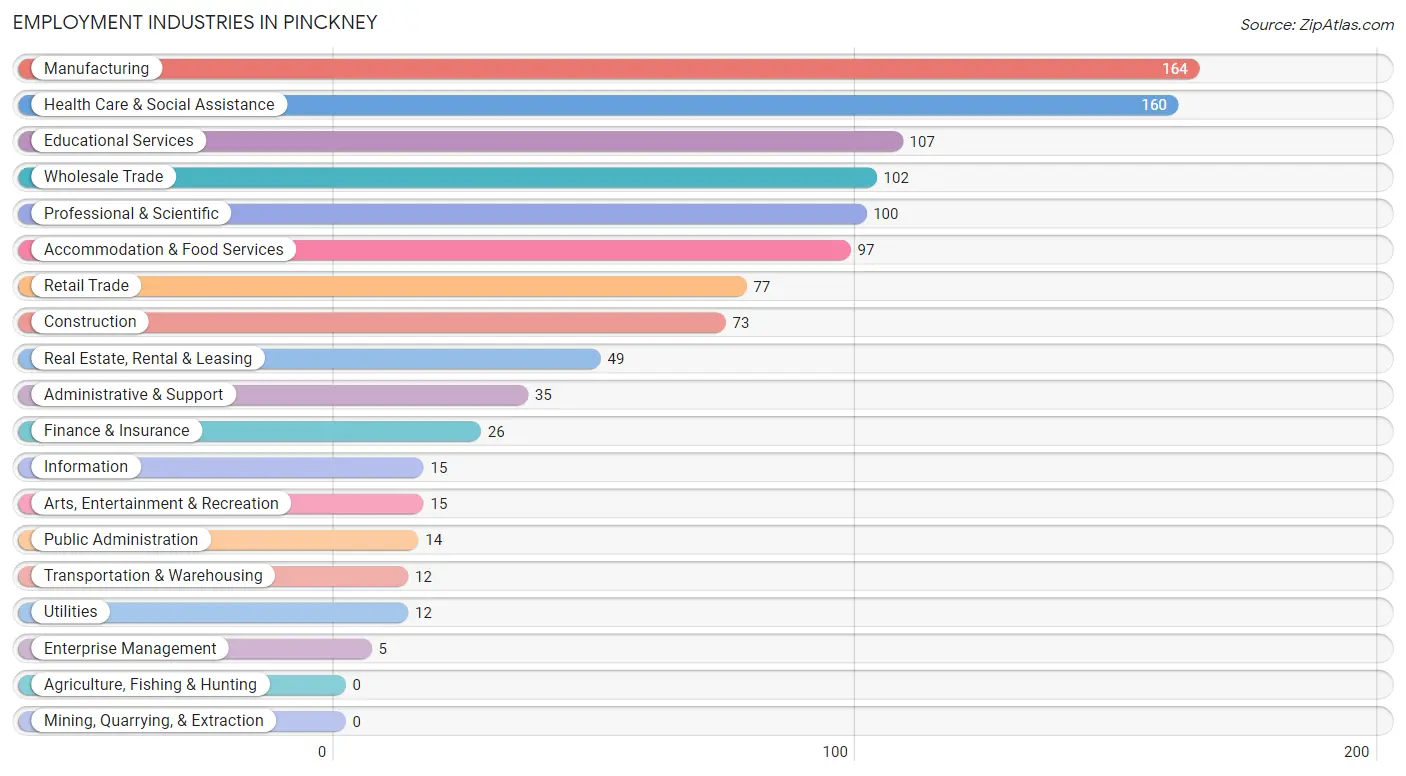
The major employment industries in Pinckney include Manufacturing (164 | 14.9%), Health Care & Social Assistance (160 | 14.5%), Educational Services (107 | 9.7%), Wholesale Trade (102 | 9.2%), and Professional & Scientific (100 | 9.1%).
Employment Industries by Sex in Pinckney
The Pinckney industries that see more men than women are Transportation & Warehousing (100.0%), Utilities (100.0%), and Arts, Entertainment & Recreation (100.0%), whereas the industries that tend to have a higher number of women are Enterprise Management (100.0%), Health Care & Social Assistance (87.5%), and Accommodation & Food Services (80.4%).
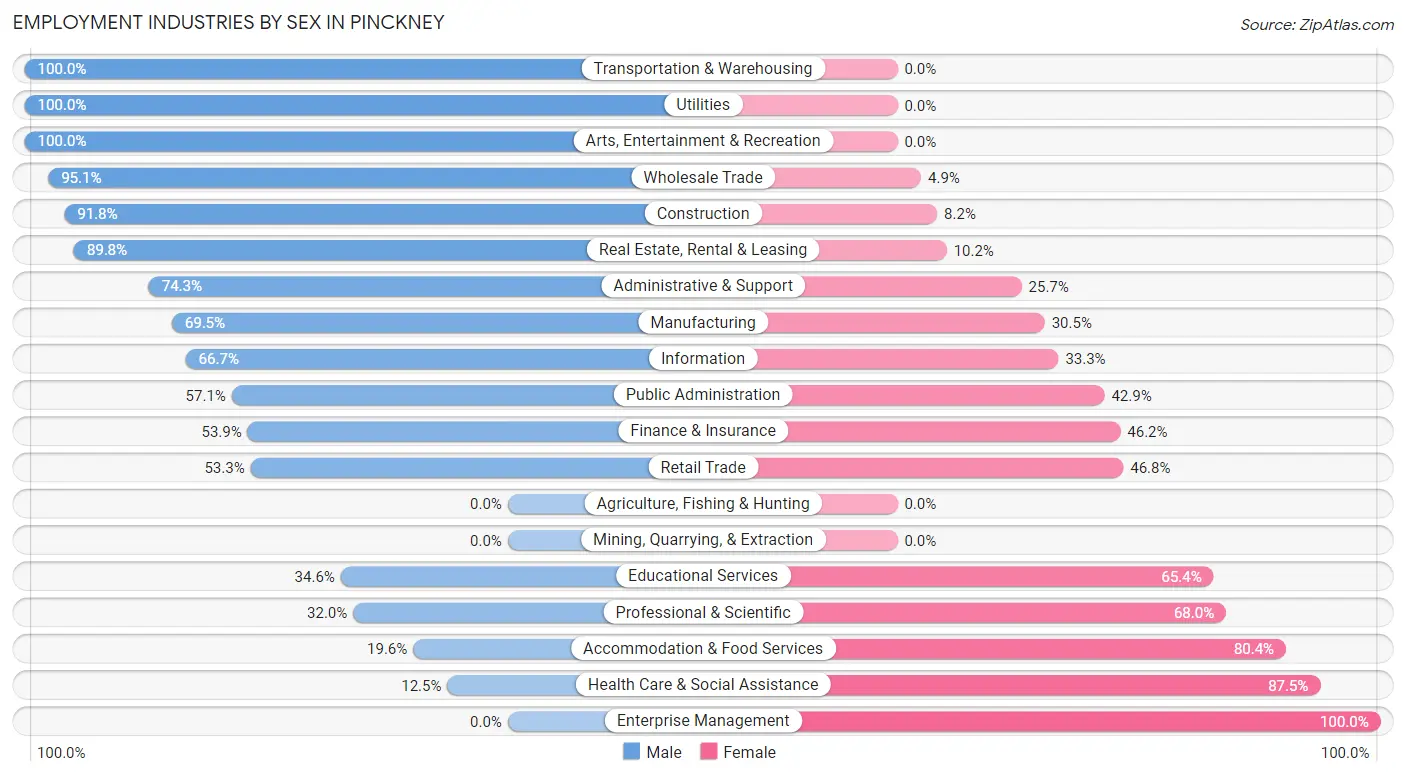
| Industry | Male | Female |
| Agriculture, Fishing & Hunting | 0 (0.0%) | 0 (0.0%) |
| Mining, Quarrying, & Extraction | 0 (0.0%) | 0 (0.0%) |
| Construction | 67 (91.8%) | 6 (8.2%) |
| Manufacturing | 114 (69.5%) | 50 (30.5%) |
| Wholesale Trade | 97 (95.1%) | 5 (4.9%) |
| Retail Trade | 41 (53.2%) | 36 (46.8%) |
| Transportation & Warehousing | 12 (100.0%) | 0 (0.0%) |
| Utilities | 12 (100.0%) | 0 (0.0%) |
| Information | 10 (66.7%) | 5 (33.3%) |
| Finance & Insurance | 14 (53.8%) | 12 (46.2%) |
| Real Estate, Rental & Leasing | 44 (89.8%) | 5 (10.2%) |
| Professional & Scientific | 32 (32.0%) | 68 (68.0%) |
| Enterprise Management | 0 (0.0%) | 5 (100.0%) |
| Administrative & Support | 26 (74.3%) | 9 (25.7%) |
| Educational Services | 37 (34.6%) | 70 (65.4%) |
| Health Care & Social Assistance | 20 (12.5%) | 140 (87.5%) |
| Arts, Entertainment & Recreation | 15 (100.0%) | 0 (0.0%) |
| Accommodation & Food Services | 19 (19.6%) | 78 (80.4%) |
| Public Administration | 8 (57.1%) | 6 (42.9%) |
| Total | 568 (51.5%) | 535 (48.5%) |
Education in Pinckney
School Enrollment in Pinckney
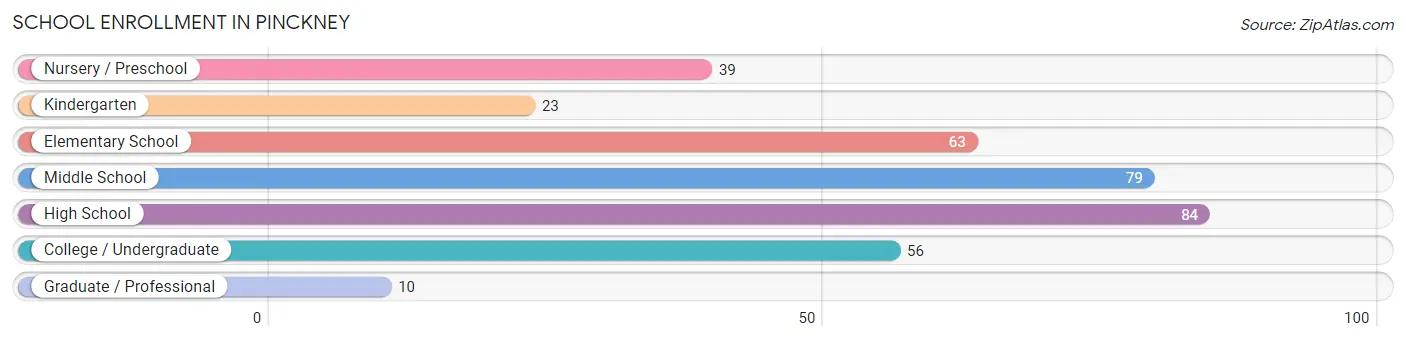
The most common levels of schooling among the 354 students in Pinckney are high school (84 | 23.7%), middle school (79 | 22.3%), and elementary school (63 | 17.8%).
| School Level | # Students | % Students |
| Nursery / Preschool | 39 | 11.0% |
| Kindergarten | 23 | 6.5% |
| Elementary School | 63 | 17.8% |
| Middle School | 79 | 22.3% |
| High School | 84 | 23.7% |
| College / Undergraduate | 56 | 15.8% |
| Graduate / Professional | 10 | 2.8% |
| Total | 354 | 100.0% |
School Enrollment by Age by Funding Source in Pinckney
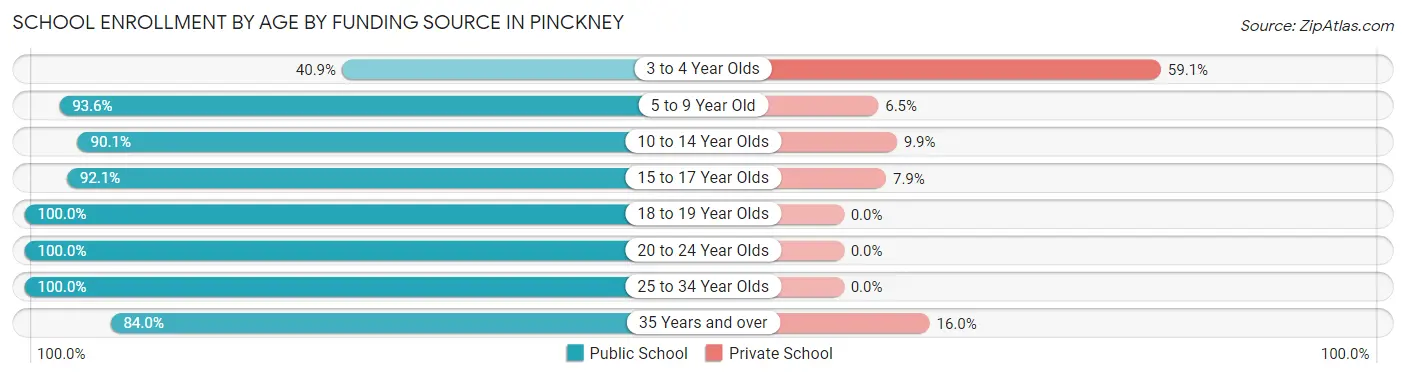
Out of a total of 354 students who are enrolled in schools in Pinckney, 38 (10.7%) attend a private institution, while the remaining 316 (89.3%) are enrolled in public schools. The age group of 3 to 4 year olds has the highest likelihood of being enrolled in private schools, with 13 (59.1% in the age bracket) enrolled. Conversely, the age group of 18 to 19 year olds has the lowest likelihood of being enrolled in a private school, with 16 (100.0% in the age bracket) attending a public institution.
| Age Bracket | Public School | Private School |
| 3 to 4 Year Olds | 9 (40.9%) | 13 (59.1%) |
| 5 to 9 Year Old | 87 (93.5%) | 6 (6.5%) |
| 10 to 14 Year Olds | 82 (90.1%) | 9 (9.9%) |
| 15 to 17 Year Olds | 70 (92.1%) | 6 (7.9%) |
| 18 to 19 Year Olds | 16 (100.0%) | 0 (0.0%) |
| 20 to 24 Year Olds | 27 (100.0%) | 0 (0.0%) |
| 25 to 34 Year Olds | 4 (100.0%) | 0 (0.0%) |
| 35 Years and over | 21 (84.0%) | 4 (16.0%) |
| Total | 316 (89.3%) | 38 (10.7%) |
Educational Attainment by Field of Study in Pinckney
Business (86 | 18.9%), education (59 | 13.0%), science & technology (54 | 11.9%), arts & humanities (48 | 10.6%), and liberal arts & history (39 | 8.6%) are the most common fields of study among 454 individuals in Pinckney who have obtained a bachelor's degree or higher.
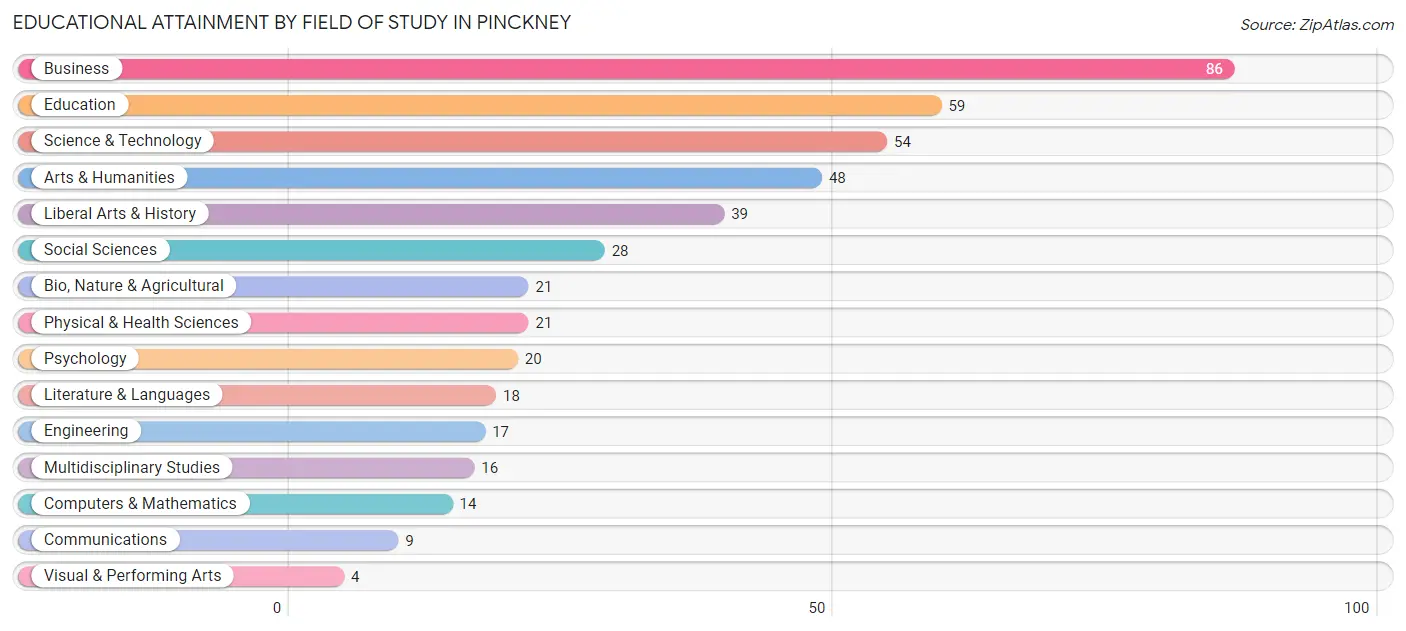
| Field of Study | # Graduates | % Graduates |
| Computers & Mathematics | 14 | 3.1% |
| Bio, Nature & Agricultural | 21 | 4.6% |
| Physical & Health Sciences | 21 | 4.6% |
| Psychology | 20 | 4.4% |
| Social Sciences | 28 | 6.2% |
| Engineering | 17 | 3.7% |
| Multidisciplinary Studies | 16 | 3.5% |
| Science & Technology | 54 | 11.9% |
| Business | 86 | 18.9% |
| Education | 59 | 13.0% |
| Literature & Languages | 18 | 4.0% |
| Liberal Arts & History | 39 | 8.6% |
| Visual & Performing Arts | 4 | 0.9% |
| Communications | 9 | 2.0% |
| Arts & Humanities | 48 | 10.6% |
| Total | 454 | 100.0% |
Transportation & Commute in Pinckney
Vehicle Availability by Sex in Pinckney
The most prevalent vehicle ownership categories in Pinckney are males with 2 vehicles (272, accounting for 48.1%) and females with 2 vehicles (273, making up 53.1%).
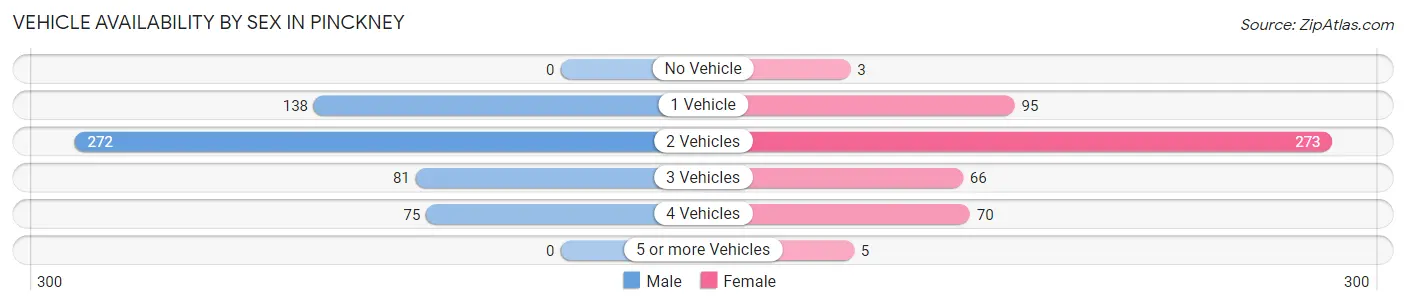
| Vehicles Available | Male | Female |
| No Vehicle | 0 (0.0%) | 3 (0.6%) |
| 1 Vehicle | 138 (24.4%) | 95 (18.5%) |
| 2 Vehicles | 272 (48.1%) | 273 (53.3%) |
| 3 Vehicles | 81 (14.3%) | 66 (12.9%) |
| 4 Vehicles | 75 (13.3%) | 70 (13.7%) |
| 5 or more Vehicles | 0 (0.0%) | 5 (1.0%) |
| Total | 566 (100.0%) | 512 (100.0%) |
Commute Time in Pinckney
The most frequently occuring commute durations in Pinckney are 45 to 59 minutes (174 commuters, 17.5%), 25 to 29 minutes (155 commuters, 15.6%), and 30 to 34 minutes (127 commuters, 12.8%).
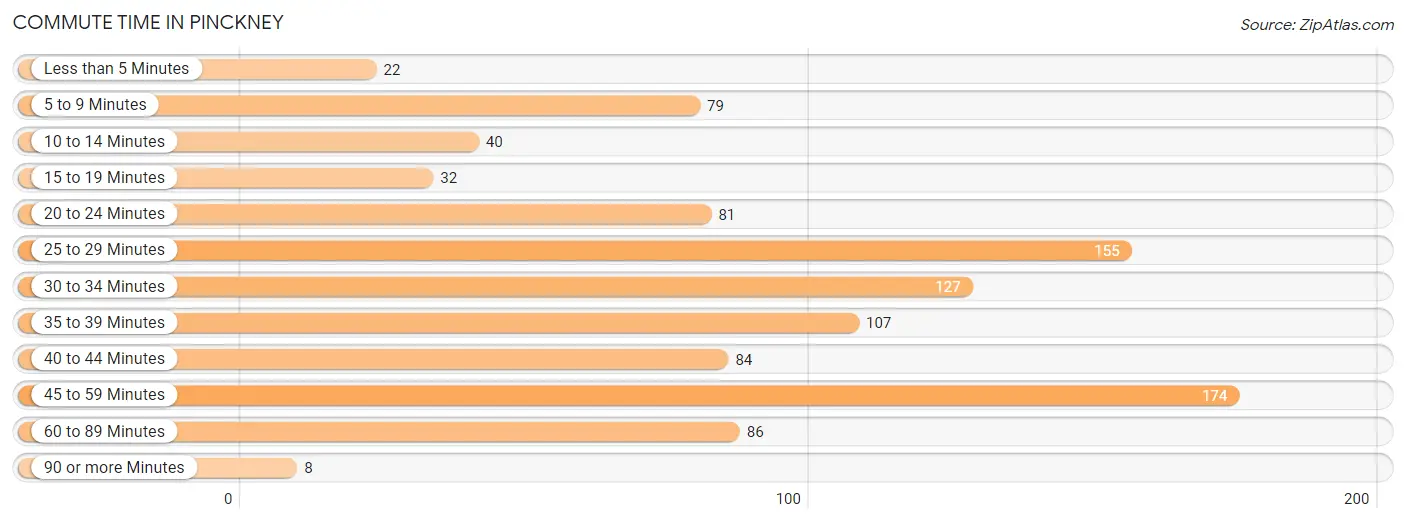
| Commute Time | # Commuters | % Commuters |
| Less than 5 Minutes | 22 | 2.2% |
| 5 to 9 Minutes | 79 | 7.9% |
| 10 to 14 Minutes | 40 | 4.0% |
| 15 to 19 Minutes | 32 | 3.2% |
| 20 to 24 Minutes | 81 | 8.1% |
| 25 to 29 Minutes | 155 | 15.6% |
| 30 to 34 Minutes | 127 | 12.8% |
| 35 to 39 Minutes | 107 | 10.7% |
| 40 to 44 Minutes | 84 | 8.4% |
| 45 to 59 Minutes | 174 | 17.5% |
| 60 to 89 Minutes | 86 | 8.6% |
| 90 or more Minutes | 8 | 0.8% |
Commute Time by Sex in Pinckney
The most common commute times in Pinckney are 45 to 59 minutes (92 commuters, 17.4%) for males and 25 to 29 minutes (107 commuters, 23.0%) for females.
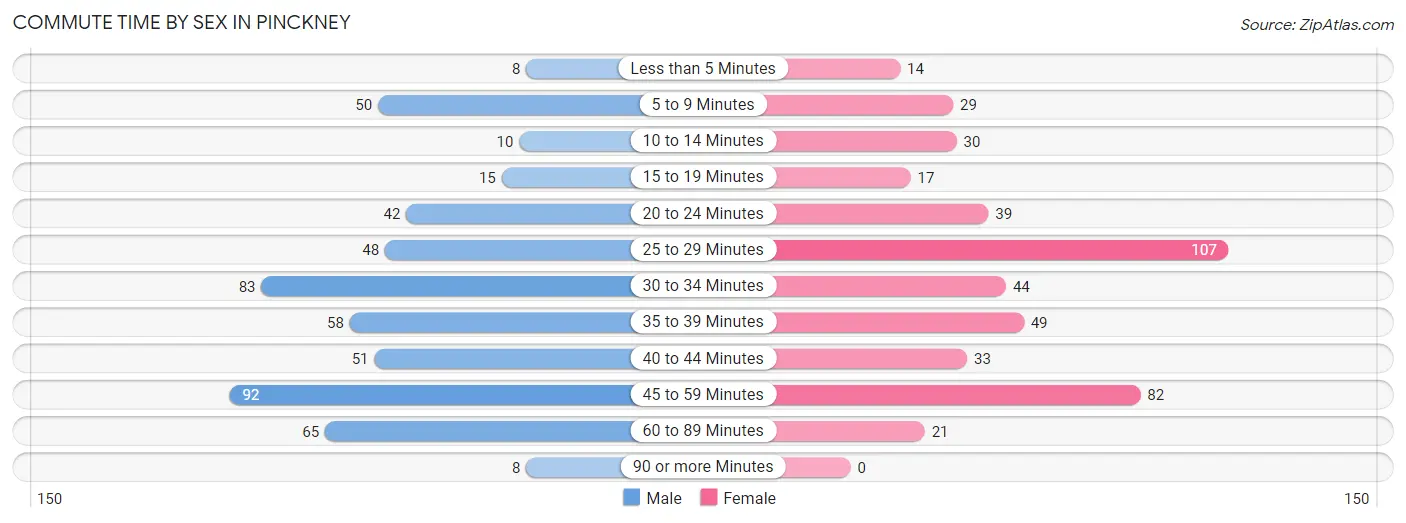
| Commute Time | Male | Female |
| Less than 5 Minutes | 8 (1.5%) | 14 (3.0%) |
| 5 to 9 Minutes | 50 (9.4%) | 29 (6.2%) |
| 10 to 14 Minutes | 10 (1.9%) | 30 (6.5%) |
| 15 to 19 Minutes | 15 (2.8%) | 17 (3.7%) |
| 20 to 24 Minutes | 42 (7.9%) | 39 (8.4%) |
| 25 to 29 Minutes | 48 (9.1%) | 107 (23.0%) |
| 30 to 34 Minutes | 83 (15.7%) | 44 (9.5%) |
| 35 to 39 Minutes | 58 (10.9%) | 49 (10.5%) |
| 40 to 44 Minutes | 51 (9.6%) | 33 (7.1%) |
| 45 to 59 Minutes | 92 (17.4%) | 82 (17.6%) |
| 60 to 89 Minutes | 65 (12.3%) | 21 (4.5%) |
| 90 or more Minutes | 8 (1.5%) | 0 (0.0%) |
Time of Departure to Work by Sex in Pinckney
The most frequent times of departure to work in Pinckney are 5:30 AM to 5:59 AM (94, 17.7%) for males and 7:00 AM to 7:29 AM (105, 22.6%) for females.
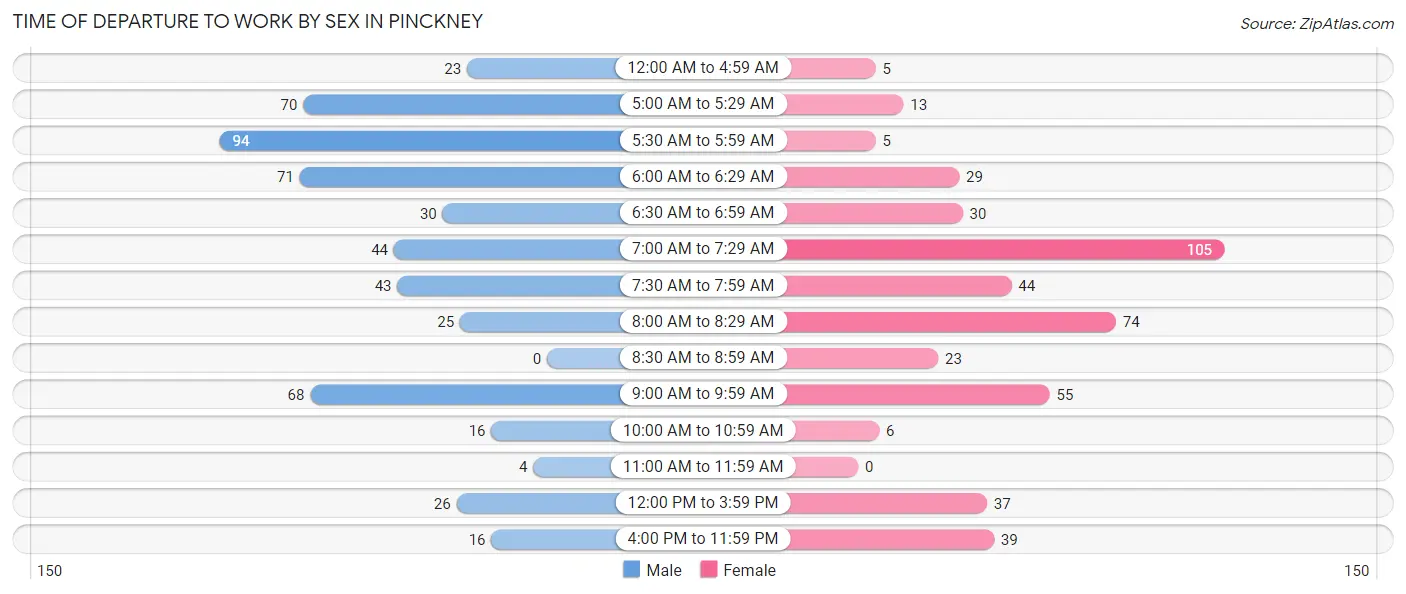
| Time of Departure | Male | Female |
| 12:00 AM to 4:59 AM | 23 (4.3%) | 5 (1.1%) |
| 5:00 AM to 5:29 AM | 70 (13.2%) | 13 (2.8%) |
| 5:30 AM to 5:59 AM | 94 (17.7%) | 5 (1.1%) |
| 6:00 AM to 6:29 AM | 71 (13.4%) | 29 (6.2%) |
| 6:30 AM to 6:59 AM | 30 (5.7%) | 30 (6.5%) |
| 7:00 AM to 7:29 AM | 44 (8.3%) | 105 (22.6%) |
| 7:30 AM to 7:59 AM | 43 (8.1%) | 44 (9.5%) |
| 8:00 AM to 8:29 AM | 25 (4.7%) | 74 (15.9%) |
| 8:30 AM to 8:59 AM | 0 (0.0%) | 23 (5.0%) |
| 9:00 AM to 9:59 AM | 68 (12.8%) | 55 (11.8%) |
| 10:00 AM to 10:59 AM | 16 (3.0%) | 6 (1.3%) |
| 11:00 AM to 11:59 AM | 4 (0.7%) | 0 (0.0%) |
| 12:00 PM to 3:59 PM | 26 (4.9%) | 37 (8.0%) |
| 4:00 PM to 11:59 PM | 16 (3.0%) | 39 (8.4%) |
| Total | 530 (100.0%) | 465 (100.0%) |
Housing Occupancy in Pinckney
Occupancy by Ownership in Pinckney
Of the total 875 dwellings in Pinckney, owner-occupied units account for 652 (74.5%), while renter-occupied units make up 223 (25.5%).
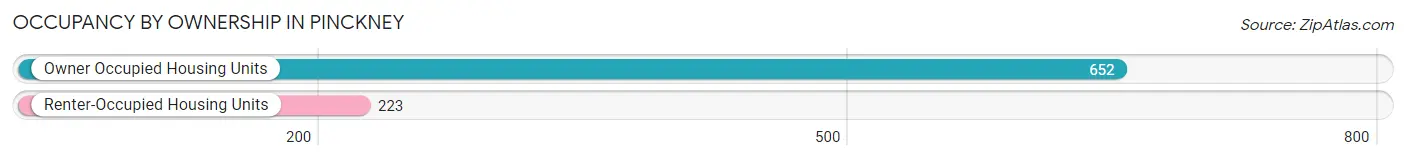
| Occupancy | # Housing Units | % Housing Units |
| Owner Occupied Housing Units | 652 | 74.5% |
| Renter-Occupied Housing Units | 223 | 25.5% |
| Total Occupied Housing Units | 875 | 100.0% |
Occupancy by Household Size in Pinckney
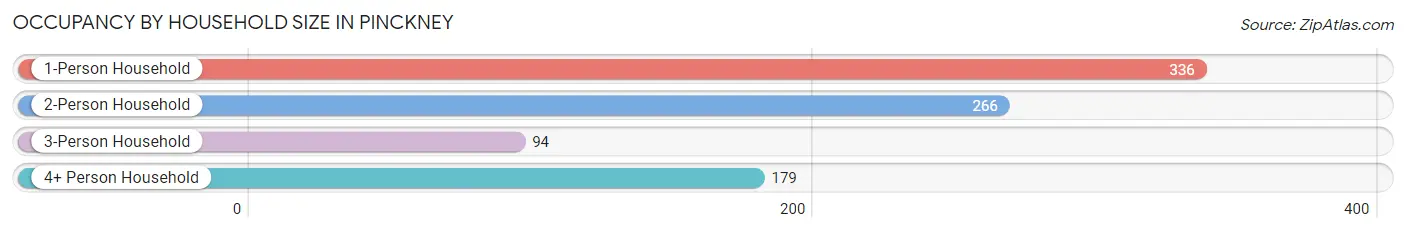
| Household Size | # Housing Units | % Housing Units |
| 1-Person Household | 336 | 38.4% |
| 2-Person Household | 266 | 30.4% |
| 3-Person Household | 94 | 10.7% |
| 4+ Person Household | 179 | 20.5% |
| Total Housing Units | 875 | 100.0% |
Occupancy by Ownership by Household Size in Pinckney
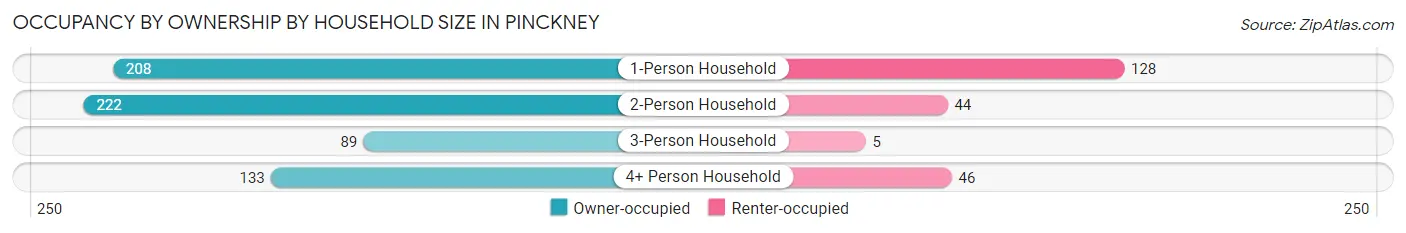
| Household Size | Owner-occupied | Renter-occupied |
| 1-Person Household | 208 (61.9%) | 128 (38.1%) |
| 2-Person Household | 222 (83.5%) | 44 (16.5%) |
| 3-Person Household | 89 (94.7%) | 5 (5.3%) |
| 4+ Person Household | 133 (74.3%) | 46 (25.7%) |
| Total Housing Units | 652 (74.5%) | 223 (25.5%) |
Occupancy by Educational Attainment in Pinckney
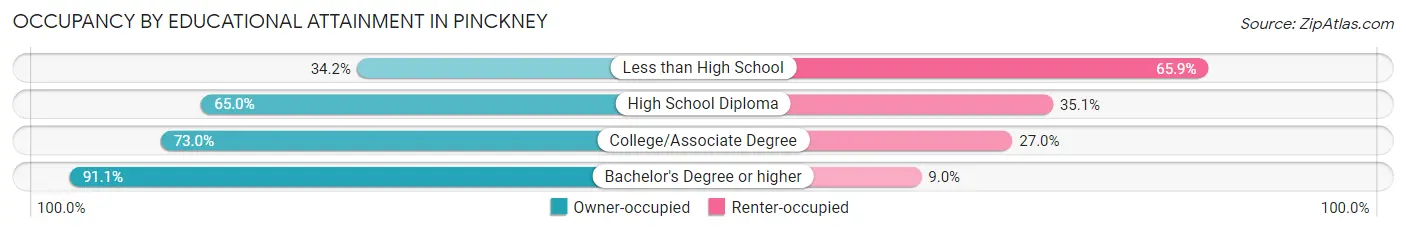
| Household Size | Owner-occupied | Renter-occupied |
| Less than High School | 14 (34.2%) | 27 (65.8%) |
| High School Diploma | 139 (64.9%) | 75 (35.0%) |
| College/Associate Degree | 265 (73.0%) | 98 (27.0%) |
| Bachelor's Degree or higher | 234 (91.0%) | 23 (8.9%) |
Occupancy by Age of Householder in Pinckney
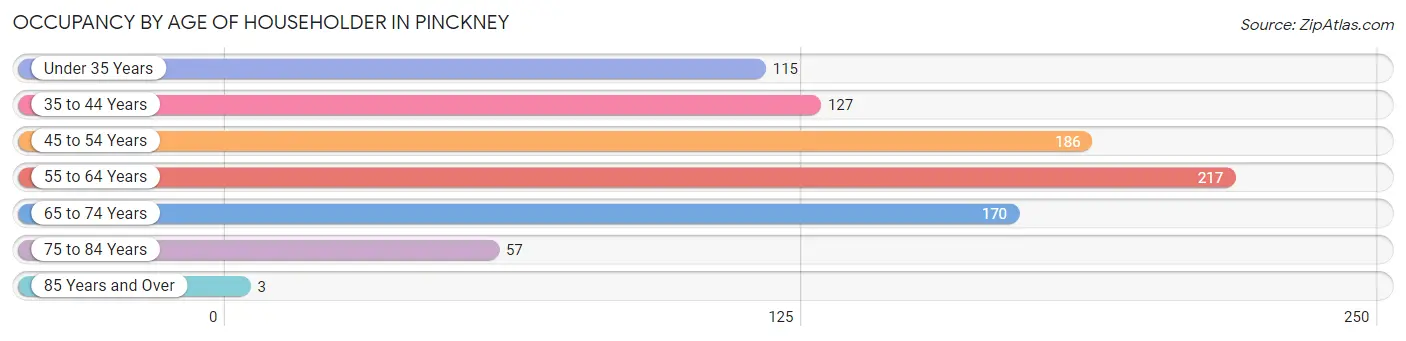
| Age Bracket | # Households | % Households |
| Under 35 Years | 115 | 13.1% |
| 35 to 44 Years | 127 | 14.5% |
| 45 to 54 Years | 186 | 21.3% |
| 55 to 64 Years | 217 | 24.8% |
| 65 to 74 Years | 170 | 19.4% |
| 75 to 84 Years | 57 | 6.5% |
| 85 Years and Over | 3 | 0.3% |
| Total | 875 | 100.0% |
Housing Finances in Pinckney
Median Income by Occupancy in Pinckney
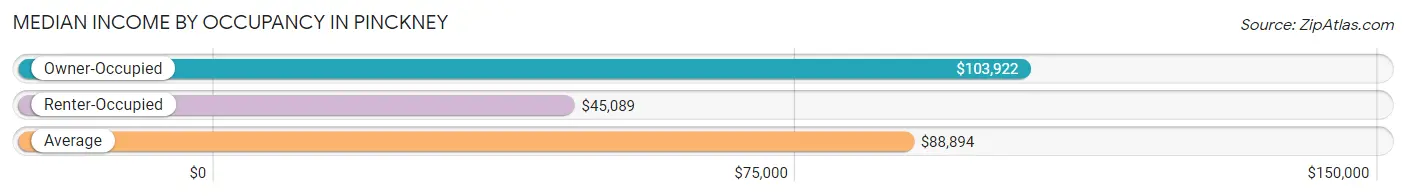
| Occupancy Type | # Households | Median Income |
| Owner-Occupied | 652 (74.5%) | $103,922 |
| Renter-Occupied | 223 (25.5%) | $45,089 |
| Average | 875 (100.0%) | $88,894 |
Occupancy by Householder Income Bracket in Pinckney
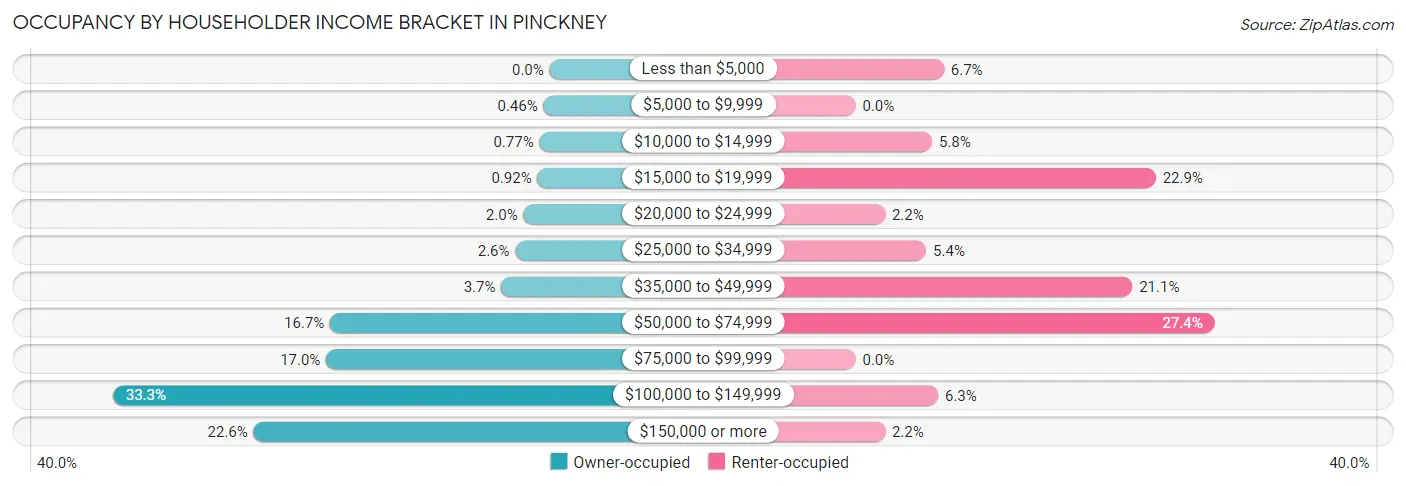
| Income Bracket | Owner-occupied | Renter-occupied |
| Less than $5,000 | 0 (0.0%) | 15 (6.7%) |
| $5,000 to $9,999 | 3 (0.5%) | 0 (0.0%) |
| $10,000 to $14,999 | 5 (0.8%) | 13 (5.8%) |
| $15,000 to $19,999 | 6 (0.9%) | 51 (22.9%) |
| $20,000 to $24,999 | 13 (2.0%) | 5 (2.2%) |
| $25,000 to $34,999 | 17 (2.6%) | 12 (5.4%) |
| $35,000 to $49,999 | 24 (3.7%) | 47 (21.1%) |
| $50,000 to $74,999 | 109 (16.7%) | 61 (27.4%) |
| $75,000 to $99,999 | 111 (17.0%) | 0 (0.0%) |
| $100,000 to $149,999 | 217 (33.3%) | 14 (6.3%) |
| $150,000 or more | 147 (22.6%) | 5 (2.2%) |
| Total | 652 (100.0%) | 223 (100.0%) |
Monthly Housing Cost Tiers in Pinckney
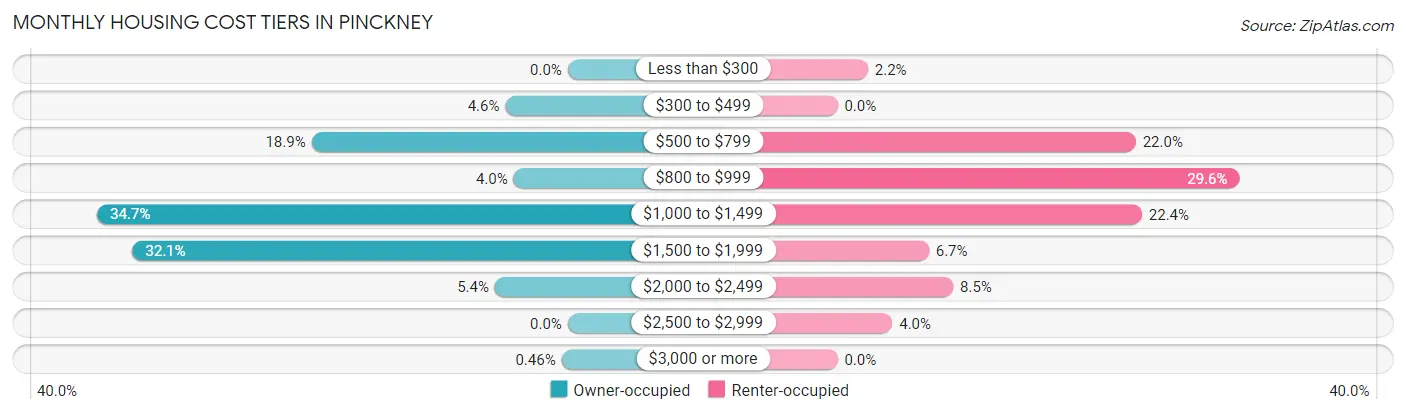
| Monthly Cost | Owner-occupied | Renter-occupied |
| Less than $300 | 0 (0.0%) | 5 (2.2%) |
| $300 to $499 | 30 (4.6%) | 0 (0.0%) |
| $500 to $799 | 123 (18.9%) | 49 (22.0%) |
| $800 to $999 | 26 (4.0%) | 66 (29.6%) |
| $1,000 to $1,499 | 226 (34.7%) | 50 (22.4%) |
| $1,500 to $1,999 | 209 (32.1%) | 15 (6.7%) |
| $2,000 to $2,499 | 35 (5.4%) | 19 (8.5%) |
| $2,500 to $2,999 | 0 (0.0%) | 9 (4.0%) |
| $3,000 or more | 3 (0.5%) | 0 (0.0%) |
| Total | 652 (100.0%) | 223 (100.0%) |
Physical Housing Characteristics in Pinckney
Housing Structures in Pinckney
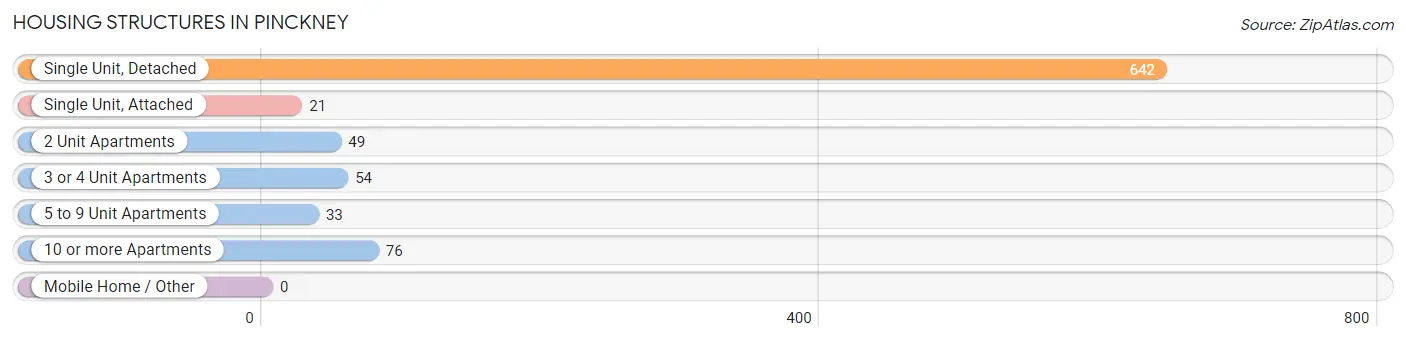
| Structure Type | # Housing Units | % Housing Units |
| Single Unit, Detached | 642 | 73.4% |
| Single Unit, Attached | 21 | 2.4% |
| 2 Unit Apartments | 49 | 5.6% |
| 3 or 4 Unit Apartments | 54 | 6.2% |
| 5 to 9 Unit Apartments | 33 | 3.8% |
| 10 or more Apartments | 76 | 8.7% |
| Mobile Home / Other | 0 | 0.0% |
| Total | 875 | 100.0% |
Housing Structures by Occupancy in Pinckney
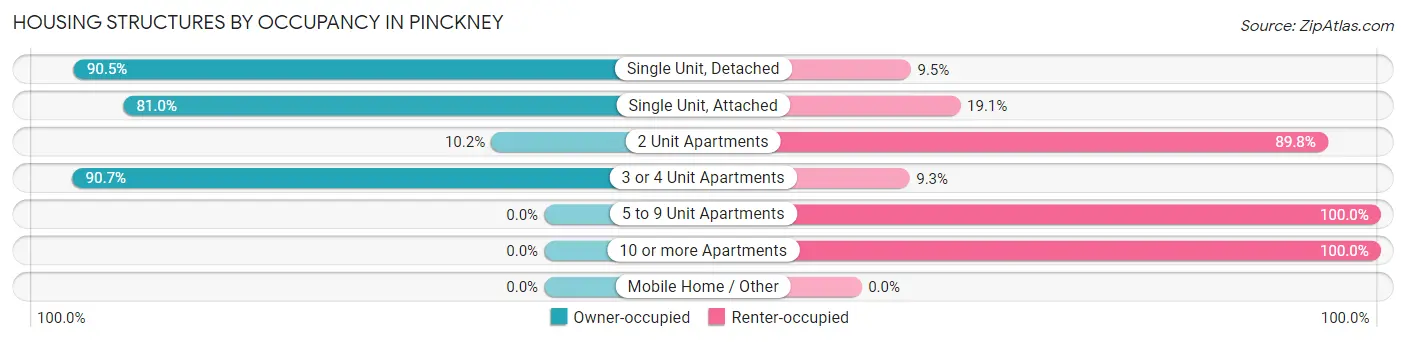
| Structure Type | Owner-occupied | Renter-occupied |
| Single Unit, Detached | 581 (90.5%) | 61 (9.5%) |
| Single Unit, Attached | 17 (80.9%) | 4 (19.1%) |
| 2 Unit Apartments | 5 (10.2%) | 44 (89.8%) |
| 3 or 4 Unit Apartments | 49 (90.7%) | 5 (9.3%) |
| 5 to 9 Unit Apartments | 0 (0.0%) | 33 (100.0%) |
| 10 or more Apartments | 0 (0.0%) | 76 (100.0%) |
| Mobile Home / Other | 0 (0.0%) | 0 (0.0%) |
| Total | 652 (74.5%) | 223 (25.5%) |
Housing Structures by Number of Rooms in Pinckney
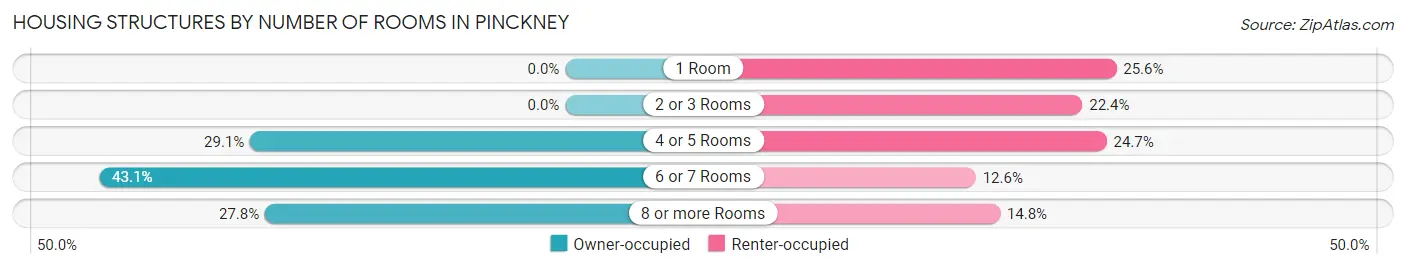
| Number of Rooms | Owner-occupied | Renter-occupied |
| 1 Room | 0 (0.0%) | 57 (25.6%) |
| 2 or 3 Rooms | 0 (0.0%) | 50 (22.4%) |
| 4 or 5 Rooms | 190 (29.1%) | 55 (24.7%) |
| 6 or 7 Rooms | 281 (43.1%) | 28 (12.6%) |
| 8 or more Rooms | 181 (27.8%) | 33 (14.8%) |
| Total | 652 (100.0%) | 223 (100.0%) |
Housing Structure by Heating Type in Pinckney
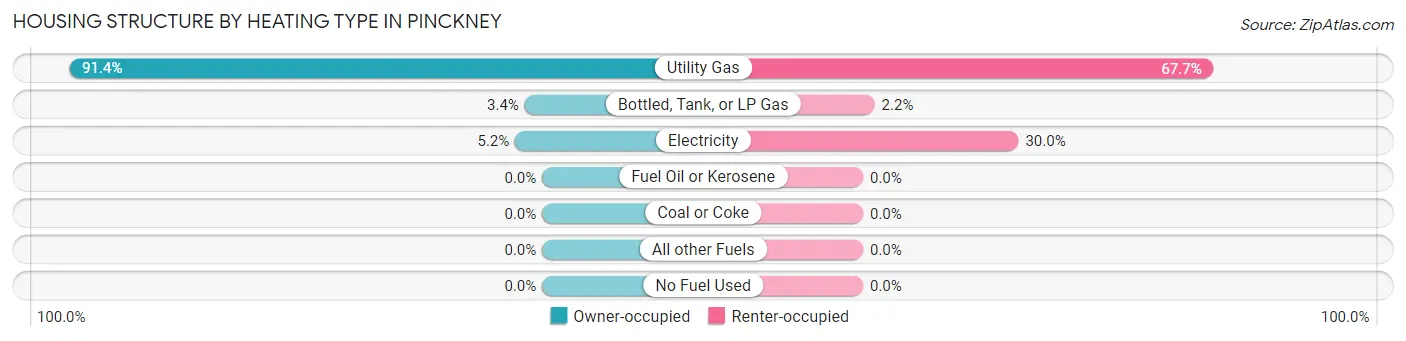
| Heating Type | Owner-occupied | Renter-occupied |
| Utility Gas | 596 (91.4%) | 151 (67.7%) |
| Bottled, Tank, or LP Gas | 22 (3.4%) | 5 (2.2%) |
| Electricity | 34 (5.2%) | 67 (30.0%) |
| Fuel Oil or Kerosene | 0 (0.0%) | 0 (0.0%) |
| Coal or Coke | 0 (0.0%) | 0 (0.0%) |
| All other Fuels | 0 (0.0%) | 0 (0.0%) |
| No Fuel Used | 0 (0.0%) | 0 (0.0%) |
| Total | 652 (100.0%) | 223 (100.0%) |
Household Vehicle Usage in Pinckney
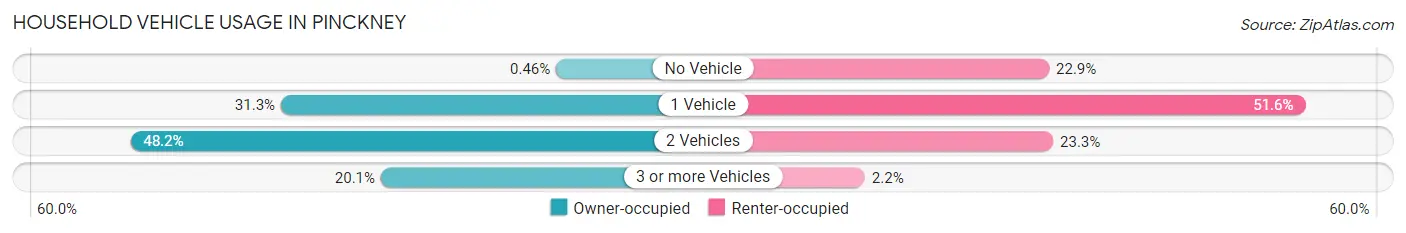
| Vehicles per Household | Owner-occupied | Renter-occupied |
| No Vehicle | 3 (0.5%) | 51 (22.9%) |
| 1 Vehicle | 204 (31.3%) | 115 (51.6%) |
| 2 Vehicles | 314 (48.2%) | 52 (23.3%) |
| 3 or more Vehicles | 131 (20.1%) | 5 (2.2%) |
| Total | 652 (100.0%) | 223 (100.0%) |
Real Estate & Mortgages in Pinckney
Real Estate and Mortgage Overview in Pinckney
| Characteristic | Without Mortgage | With Mortgage |
| Housing Units | 143 | 509 |
| Median Property Value | $223,800 | $232,300 |
| Median Household Income | $67,917 | $117 |
| Monthly Housing Costs | $615 | $3 |
| Real Estate Taxes | $2,913 | $8 |
Property Value by Mortgage Status in Pinckney
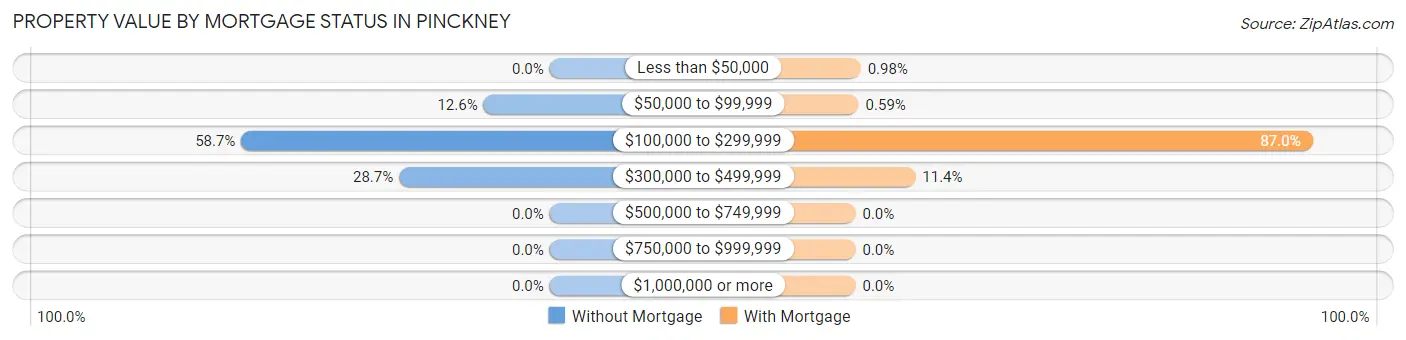
| Property Value | Without Mortgage | With Mortgage |
| Less than $50,000 | 0 (0.0%) | 5 (1.0%) |
| $50,000 to $99,999 | 18 (12.6%) | 3 (0.6%) |
| $100,000 to $299,999 | 84 (58.7%) | 443 (87.0%) |
| $300,000 to $499,999 | 41 (28.7%) | 58 (11.4%) |
| $500,000 to $749,999 | 0 (0.0%) | 0 (0.0%) |
| $750,000 to $999,999 | 0 (0.0%) | 0 (0.0%) |
| $1,000,000 or more | 0 (0.0%) | 0 (0.0%) |
| Total | 143 (100.0%) | 509 (100.0%) |
Household Income by Mortgage Status in Pinckney
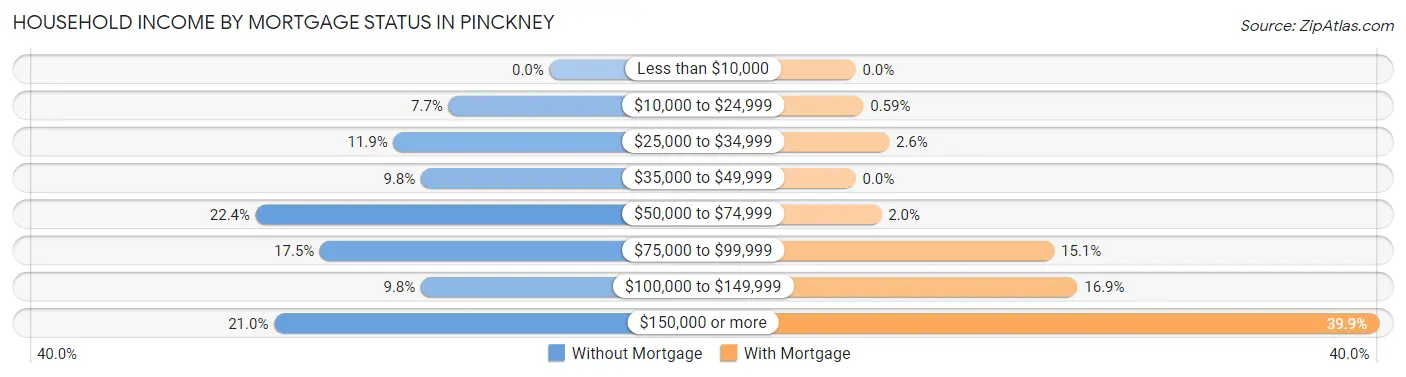
| Household Income | Without Mortgage | With Mortgage |
| Less than $10,000 | 0 (0.0%) | 0 (0.0%) |
| $10,000 to $24,999 | 11 (7.7%) | 3 (0.6%) |
| $25,000 to $34,999 | 17 (11.9%) | 13 (2.5%) |
| $35,000 to $49,999 | 14 (9.8%) | 0 (0.0%) |
| $50,000 to $74,999 | 32 (22.4%) | 10 (2.0%) |
| $75,000 to $99,999 | 25 (17.5%) | 77 (15.1%) |
| $100,000 to $149,999 | 14 (9.8%) | 86 (16.9%) |
| $150,000 or more | 30 (21.0%) | 203 (39.9%) |
| Total | 143 (100.0%) | 509 (100.0%) |
Property Value to Household Income Ratio in Pinckney
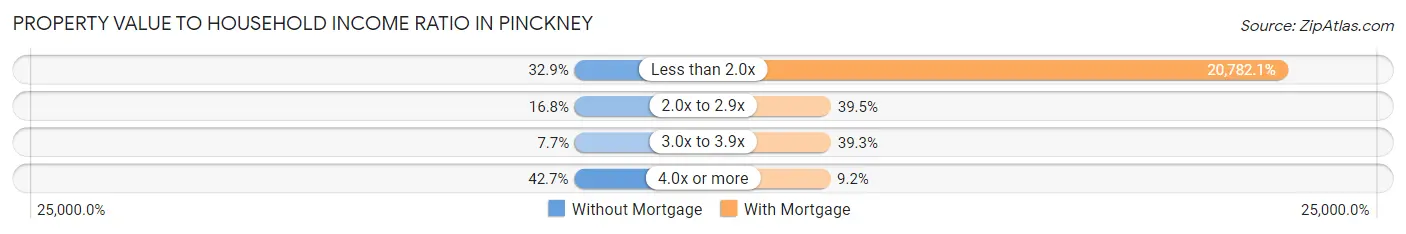
| Value-to-Income Ratio | Without Mortgage | With Mortgage |
| Less than 2.0x | 47 (32.9%) | 105,781 (20,782.1%) |
| 2.0x to 2.9x | 24 (16.8%) | 201 (39.5%) |
| 3.0x to 3.9x | 11 (7.7%) | 200 (39.3%) |
| 4.0x or more | 61 (42.7%) | 47 (9.2%) |
| Total | 143 (100.0%) | 509 (100.0%) |
Real Estate Taxes by Mortgage Status in Pinckney
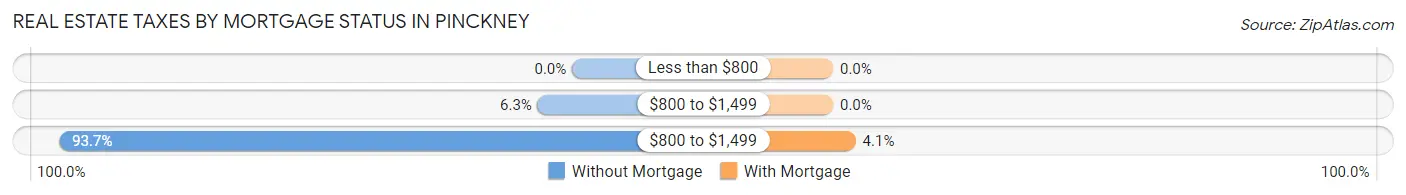
| Property Taxes | Without Mortgage | With Mortgage |
| Less than $800 | 0 (0.0%) | 0 (0.0%) |
| $800 to $1,499 | 9 (6.3%) | 0 (0.0%) |
| $800 to $1,499 | 134 (93.7%) | 21 (4.1%) |
| Total | 143 (100.0%) | 509 (100.0%) |
Health & Disability in Pinckney
Health Insurance Coverage by Age in Pinckney
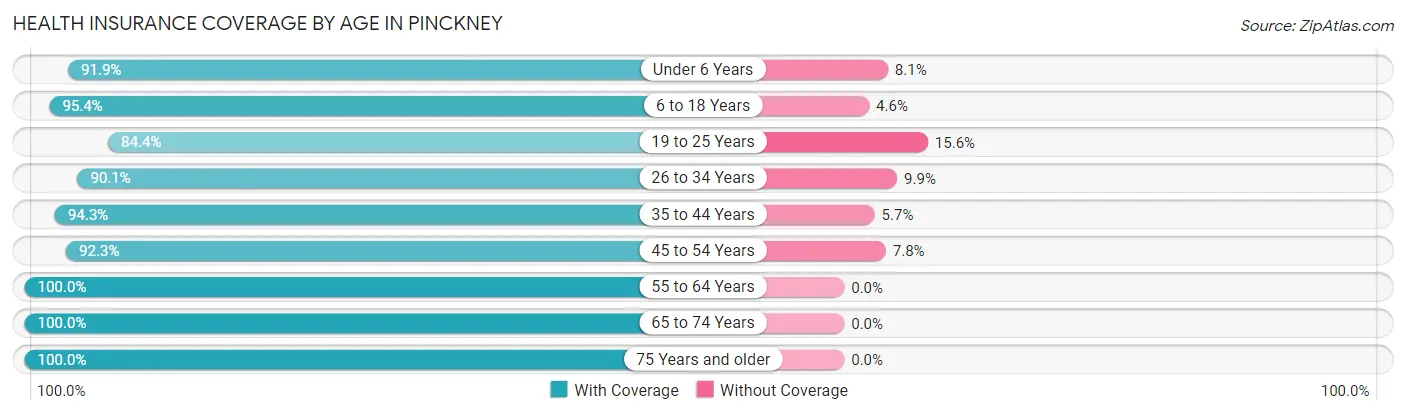
| Age Bracket | With Coverage | Without Coverage |
| Under 6 Years | 113 (91.9%) | 10 (8.1%) |
| 6 to 18 Years | 226 (95.4%) | 11 (4.6%) |
| 19 to 25 Years | 157 (84.4%) | 29 (15.6%) |
| 26 to 34 Years | 192 (90.1%) | 21 (9.9%) |
| 35 to 44 Years | 250 (94.3%) | 15 (5.7%) |
| 45 to 54 Years | 250 (92.2%) | 21 (7.7%) |
| 55 to 64 Years | 322 (100.0%) | 0 (0.0%) |
| 65 to 74 Years | 217 (100.0%) | 0 (0.0%) |
| 75 Years and older | 103 (100.0%) | 0 (0.0%) |
| Total | 1,830 (94.5%) | 107 (5.5%) |
Health Insurance Coverage by Citizenship Status in Pinckney
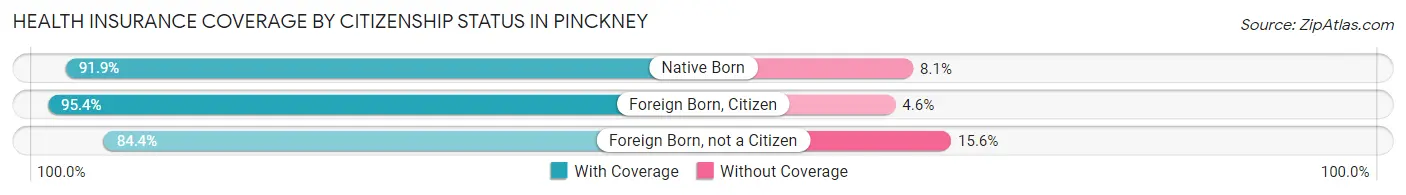
| Citizenship Status | With Coverage | Without Coverage |
| Native Born | 113 (91.9%) | 10 (8.1%) |
| Foreign Born, Citizen | 226 (95.4%) | 11 (4.6%) |
| Foreign Born, not a Citizen | 157 (84.4%) | 29 (15.6%) |
Health Insurance Coverage by Household Income in Pinckney
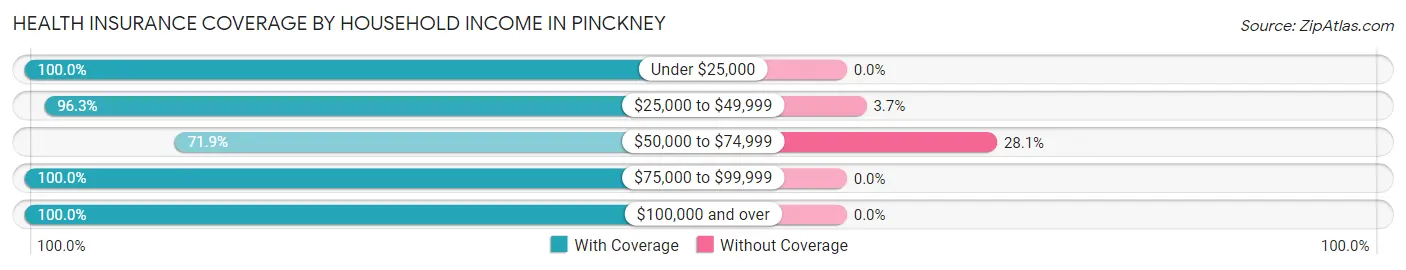
| Household Income | With Coverage | Without Coverage |
| Under $25,000 | 166 (100.0%) | 0 (0.0%) |
| $25,000 to $49,999 | 157 (96.3%) | 6 (3.7%) |
| $50,000 to $74,999 | 258 (71.9%) | 101 (28.1%) |
| $75,000 to $99,999 | 243 (100.0%) | 0 (0.0%) |
| $100,000 and over | 1,004 (100.0%) | 0 (0.0%) |
Public vs Private Health Insurance Coverage by Age in Pinckney
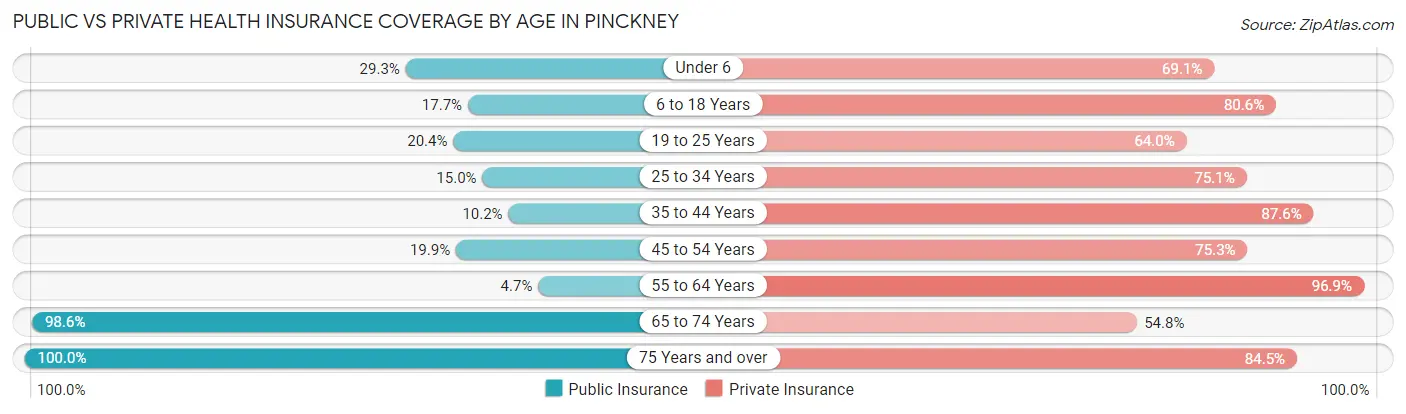
| Age Bracket | Public Insurance | Private Insurance |
| Under 6 | 36 (29.3%) | 85 (69.1%) |
| 6 to 18 Years | 42 (17.7%) | 191 (80.6%) |
| 19 to 25 Years | 38 (20.4%) | 119 (64.0%) |
| 25 to 34 Years | 32 (15.0%) | 160 (75.1%) |
| 35 to 44 Years | 27 (10.2%) | 232 (87.5%) |
| 45 to 54 Years | 54 (19.9%) | 204 (75.3%) |
| 55 to 64 Years | 15 (4.7%) | 312 (96.9%) |
| 65 to 74 Years | 214 (98.6%) | 119 (54.8%) |
| 75 Years and over | 103 (100.0%) | 87 (84.5%) |
| Total | 561 (29.0%) | 1,509 (77.9%) |
Disability Status by Sex by Age in Pinckney
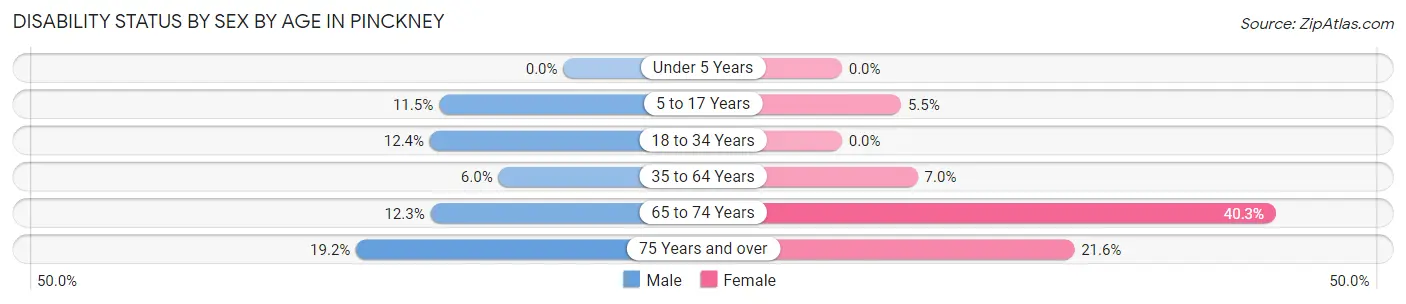
| Age Bracket | Male | Female |
| Under 5 Years | 0 (0.0%) | 0 (0.0%) |
| 5 to 17 Years | 9 (11.5%) | 10 (5.5%) |
| 18 to 34 Years | 28 (12.4%) | 0 (0.0%) |
| 35 to 64 Years | 26 (6.0%) | 30 (7.0%) |
| 65 to 74 Years | 9 (12.3%) | 58 (40.3%) |
| 75 Years and over | 10 (19.2%) | 11 (21.6%) |
Disability Class by Sex by Age in Pinckney
Disability Class: Hearing Difficulty
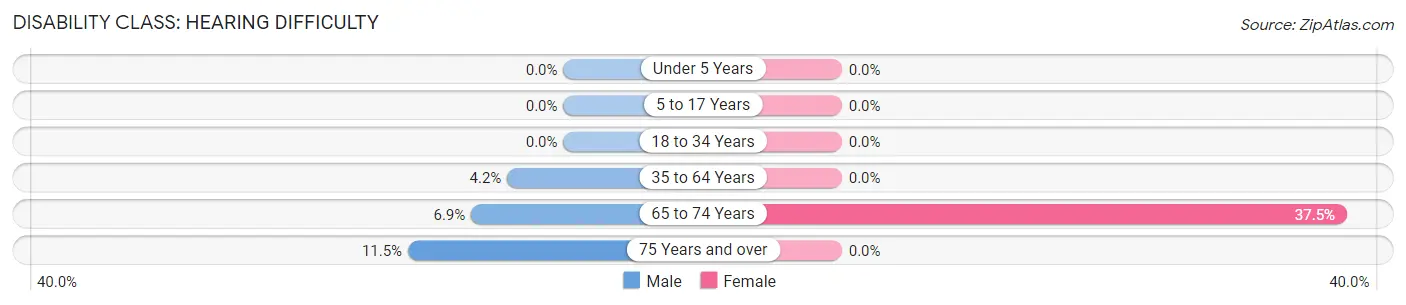
| Age Bracket | Male | Female |
| Under 5 Years | 0 (0.0%) | 0 (0.0%) |
| 5 to 17 Years | 0 (0.0%) | 0 (0.0%) |
| 18 to 34 Years | 0 (0.0%) | 0 (0.0%) |
| 35 to 64 Years | 18 (4.2%) | 0 (0.0%) |
| 65 to 74 Years | 5 (6.9%) | 54 (37.5%) |
| 75 Years and over | 6 (11.5%) | 0 (0.0%) |
Disability Class: Vision Difficulty
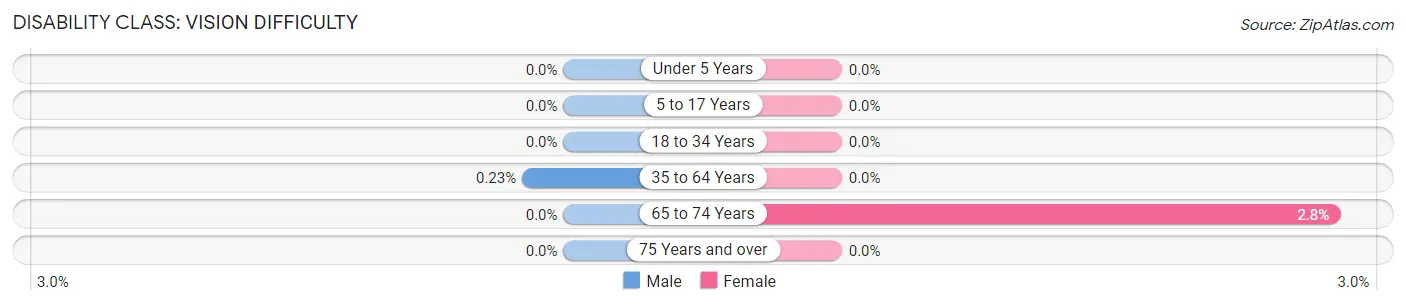
| Age Bracket | Male | Female |
| Under 5 Years | 0 (0.0%) | 0 (0.0%) |
| 5 to 17 Years | 0 (0.0%) | 0 (0.0%) |
| 18 to 34 Years | 0 (0.0%) | 0 (0.0%) |
| 35 to 64 Years | 1 (0.2%) | 0 (0.0%) |
| 65 to 74 Years | 0 (0.0%) | 4 (2.8%) |
| 75 Years and over | 0 (0.0%) | 0 (0.0%) |
Disability Class: Cognitive Difficulty
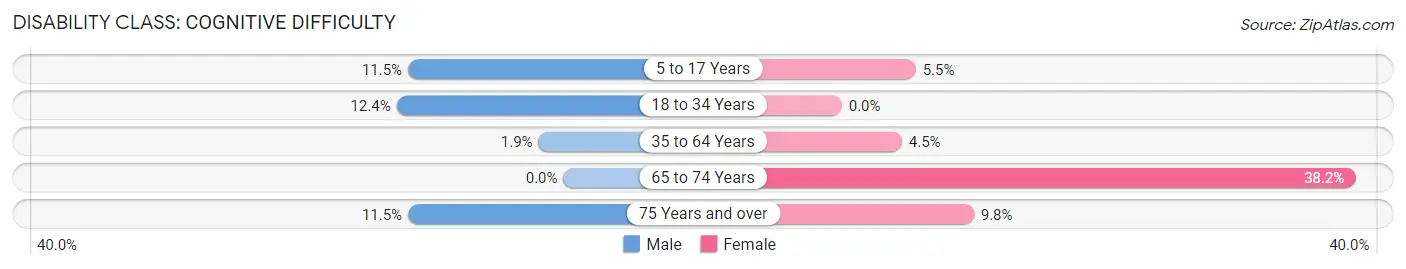
| Age Bracket | Male | Female |
| 5 to 17 Years | 9 (11.5%) | 10 (5.5%) |
| 18 to 34 Years | 28 (12.4%) | 0 (0.0%) |
| 35 to 64 Years | 8 (1.8%) | 19 (4.5%) |
| 65 to 74 Years | 0 (0.0%) | 55 (38.2%) |
| 75 Years and over | 6 (11.5%) | 5 (9.8%) |
Disability Class: Ambulatory Difficulty
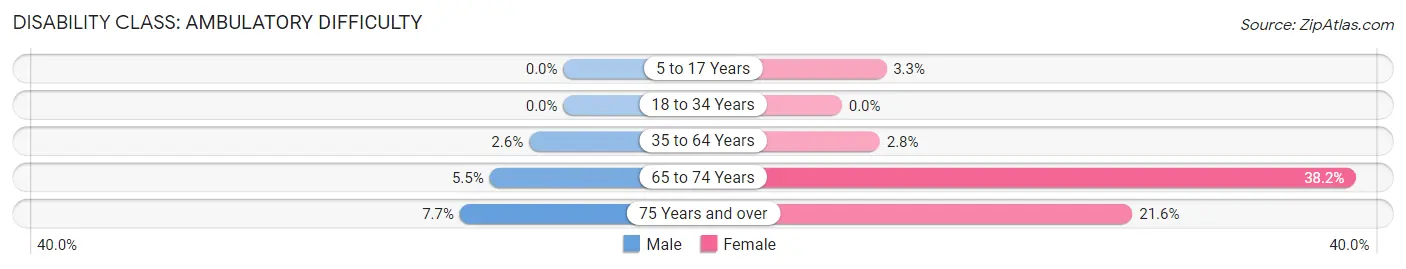
| Age Bracket | Male | Female |
| 5 to 17 Years | 0 (0.0%) | 6 (3.3%) |
| 18 to 34 Years | 0 (0.0%) | 0 (0.0%) |
| 35 to 64 Years | 11 (2.5%) | 12 (2.8%) |
| 65 to 74 Years | 4 (5.5%) | 55 (38.2%) |
| 75 Years and over | 4 (7.7%) | 11 (21.6%) |
Disability Class: Self-Care Difficulty
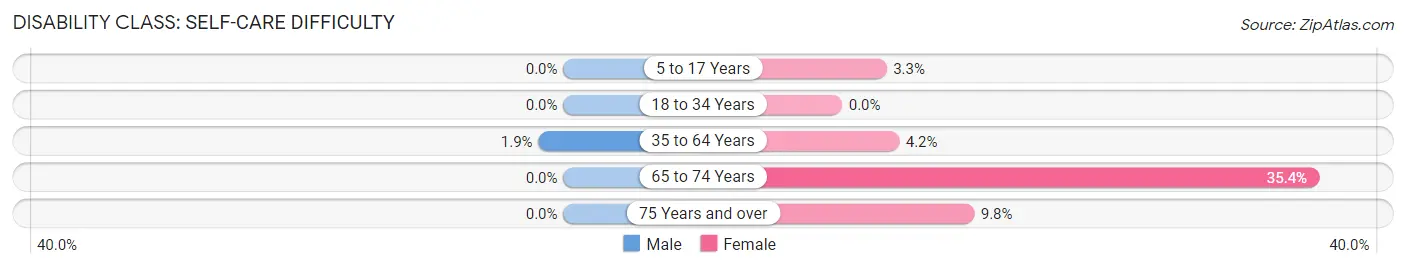
| Age Bracket | Male | Female |
| 5 to 17 Years | 0 (0.0%) | 6 (3.3%) |
| 18 to 34 Years | 0 (0.0%) | 0 (0.0%) |
| 35 to 64 Years | 8 (1.8%) | 18 (4.2%) |
| 65 to 74 Years | 0 (0.0%) | 51 (35.4%) |
| 75 Years and over | 0 (0.0%) | 5 (9.8%) |
Technology Access in Pinckney
Computing Device Access in Pinckney
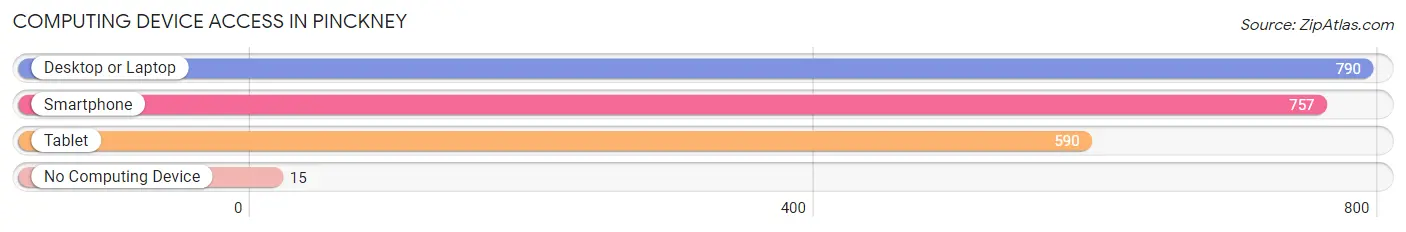
| Device Type | # Households | % Households |
| Desktop or Laptop | 790 | 90.3% |
| Smartphone | 757 | 86.5% |
| Tablet | 590 | 67.4% |
| No Computing Device | 15 | 1.7% |
| Total | 875 | 100.0% |
Internet Access in Pinckney
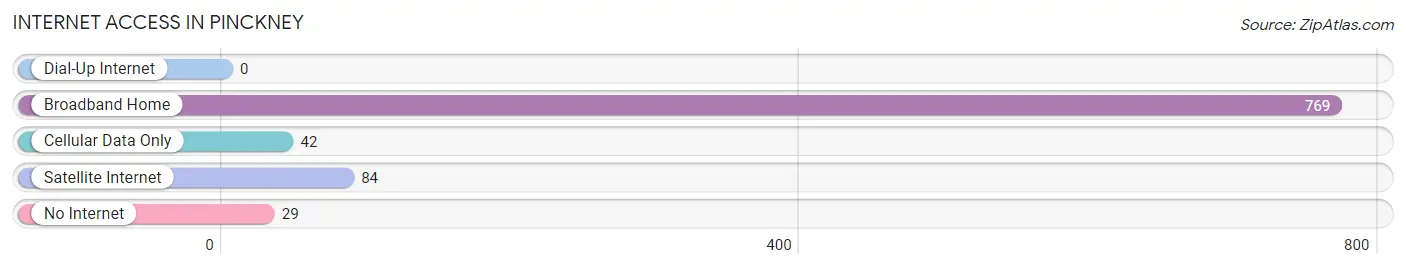
| Internet Type | # Households | % Households |
| Dial-Up Internet | 0 | 0.0% |
| Broadband Home | 769 | 87.9% |
| Cellular Data Only | 42 | 4.8% |
| Satellite Internet | 84 | 9.6% |
| No Internet | 29 | 3.3% |
| Total | 875 | 100.0% |
Pinckney Summary
Pinckney, Michigan is a small village located in Livingston County, Michigan. It is situated in the southeast corner of the county, approximately 30 miles northwest of Ann Arbor and 40 miles southwest of Detroit. The village has a population of approximately 2,500 people and covers an area of 1.3 square miles.
History
Pinckney was first settled in 1825 by a group of settlers from New York. The village was named after Charles Cotesworth Pinckney, a Revolutionary War hero and signer of the United States Constitution. The village was officially incorporated in 1837.
In the late 19th century, Pinckney was a thriving agricultural community. The village was home to several mills, a cheese factory, and a canning factory. The village also had a railroad station, which connected it to nearby towns and cities.
In the early 20th century, Pinckney began to experience a decline in population as many of its residents moved away to larger cities. The village was also affected by the Great Depression, which caused many businesses to close.
Geography
Pinckney is located in the southeast corner of Livingston County, Michigan. It is situated on the Huron River, which flows through the village. The village is surrounded by several small lakes, including Lakeland, Silver Lake, and Long Lake.
The village is located in a rural area, with most of the land being used for agricultural purposes. The village is also home to several parks, including Pinckney State Recreation Area, which is located on the Huron River.
Economy
The economy of Pinckney is largely based on agriculture and tourism. The village is home to several farms, which produce a variety of crops, including corn, soybeans, and wheat. The village is also home to several wineries, which produce a variety of wines.
The village is also home to several small businesses, including restaurants, shops, and a grocery store. The village is also home to several bed and breakfasts, which attract tourists from all over the state.
Demographics
As of the 2010 census, the population of Pinckney was 2,427. The racial makeup of the village was 97.3% White, 0.7% African American, 0.3% Native American, 0.3% Asian, 0.2% from other races, and 1.2% from two or more races. Hispanic or Latino of any race were 1.2% of the population.
The median household income in Pinckney was $50,938, and the median family income was $60,938. The per capita income for the village was $25,938. About 5.3% of families and 7.2% of the population were below the poverty line, including 8.3% of those under age 18 and 5.2% of those age 65 or over.
Common Questions
What is Per Capita Income in Pinckney?
Per Capita income in Pinckney is $42,705.
What is the Median Family Income in Pinckney?
Median Family Income in Pinckney is $111,406.
What is the Median Household income in Pinckney?
Median Household Income in Pinckney is $88,894.
What is Income or Wage Gap in Pinckney?
Income or Wage Gap in Pinckney is 25.4%.
Women in Pinckney earn 74.6 cents for every dollar earned by a man.
What is Inequality or Gini Index in Pinckney?
Inequality or Gini Index in Pinckney is 0.34.
What is the Total Population of Pinckney?
Total Population of Pinckney is 1,950.
What is the Total Male Population of Pinckney?
Total Male Population of Pinckney is 891.
What is the Total Female Population of Pinckney?
Total Female Population of Pinckney is 1,059.
What is the Ratio of Males per 100 Females in Pinckney?
There are 84.14 Males per 100 Females in Pinckney.
What is the Ratio of Females per 100 Males in Pinckney?
There are 118.86 Females per 100 Males in Pinckney.
What is the Median Population Age in Pinckney?
Median Population Age in Pinckney is 42.1 Years.
What is the Average Family Size in Pinckney
Average Family Size in Pinckney is 3.1 People.
What is the Average Household Size in Pinckney
Average Household Size in Pinckney is 2.2 People.
How Large is the Labor Force in Pinckney?
There are 1,170 People in the Labor Forcein in Pinckney.
What is the Percentage of People in the Labor Force in Pinckney?
70.5% of People are in the Labor Force in Pinckney.
What is the Unemployment Rate in Pinckney?
Unemployment Rate in Pinckney is 5.6%.