Zip Codes with the Highest Percentage of Households with Income Above $100,000 in Dearborn, MI
RELATED REPORTS & OPTIONS
Household Income | $100k+
Dearborn
Compare Zip Codes
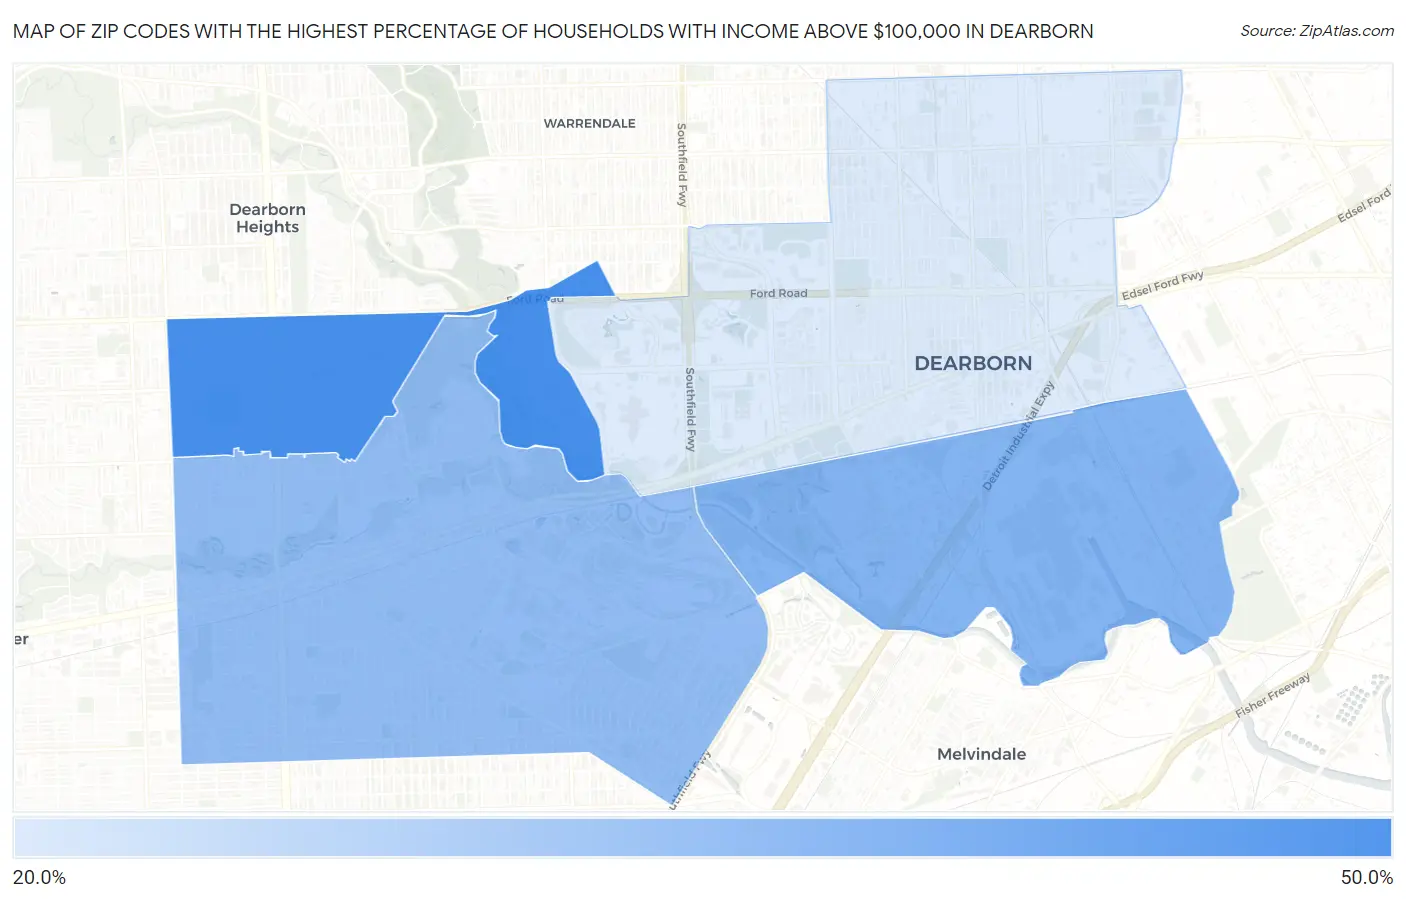
Map of Zip Codes with the Highest Percentage of Households with Income Above $100,000 in Dearborn
20.5%
48.7%
Zip Codes with the Highest Percentage of Households with Income Above $100,000 in Dearborn, MI
| Zip Code | Households with Income > $100k | vs State | vs National | |
| 1. | 48128 | 48.7% | 32.5%(+16.2)#92 | 37.3%(+11.4)#5,264 |
| 2. | 48120 | 36.7% | 32.5%(+4.20)#242 | 37.3%(-0.600)#10,752 |
| 3. | 48124 | 33.9% | 32.5%(+1.40)#308 | 37.3%(-3.40)#12,491 |
| 4. | 48126 | 20.5% | 32.5%(-12.0)#687 | 37.3%(-16.8)#23,627 |
1
Common Questions
What are the Top 3 Zip Codes with the Highest Percentage of Households with Income Above $100,000 in Dearborn, MI?
Top 3 Zip Codes with the Highest Percentage of Households with Income Above $100,000 in Dearborn, MI are:
What zip code has the Highest Percentage of Households with Income Above $100,000 in Dearborn, MI?
48128 has the Highest Percentage of Households with Income Above $100,000 in Dearborn, MI with 48.7%.
What is the Percentage of Households with Income Above $100,000 in Dearborn, MI?
Percentage of Households with Income Above $100,000 in Dearborn is 30.3%.
What is the Percentage of Households with Income Above $100,000 in Michigan?
Percentage of Households with Income Above $100,000 in Michigan is 32.5%.
What is the Percentage of Households with Income Above $100,000 in the United States?
Percentage of Households with Income Above $100,000 in the United States is 37.3%.