Zip Codes with the Highest Percentage of Households with Income Above $100,000 in Sterling Heights, MI
RELATED REPORTS & OPTIONS
Household Income | $100k+
Sterling Heights
Compare Zip Codes
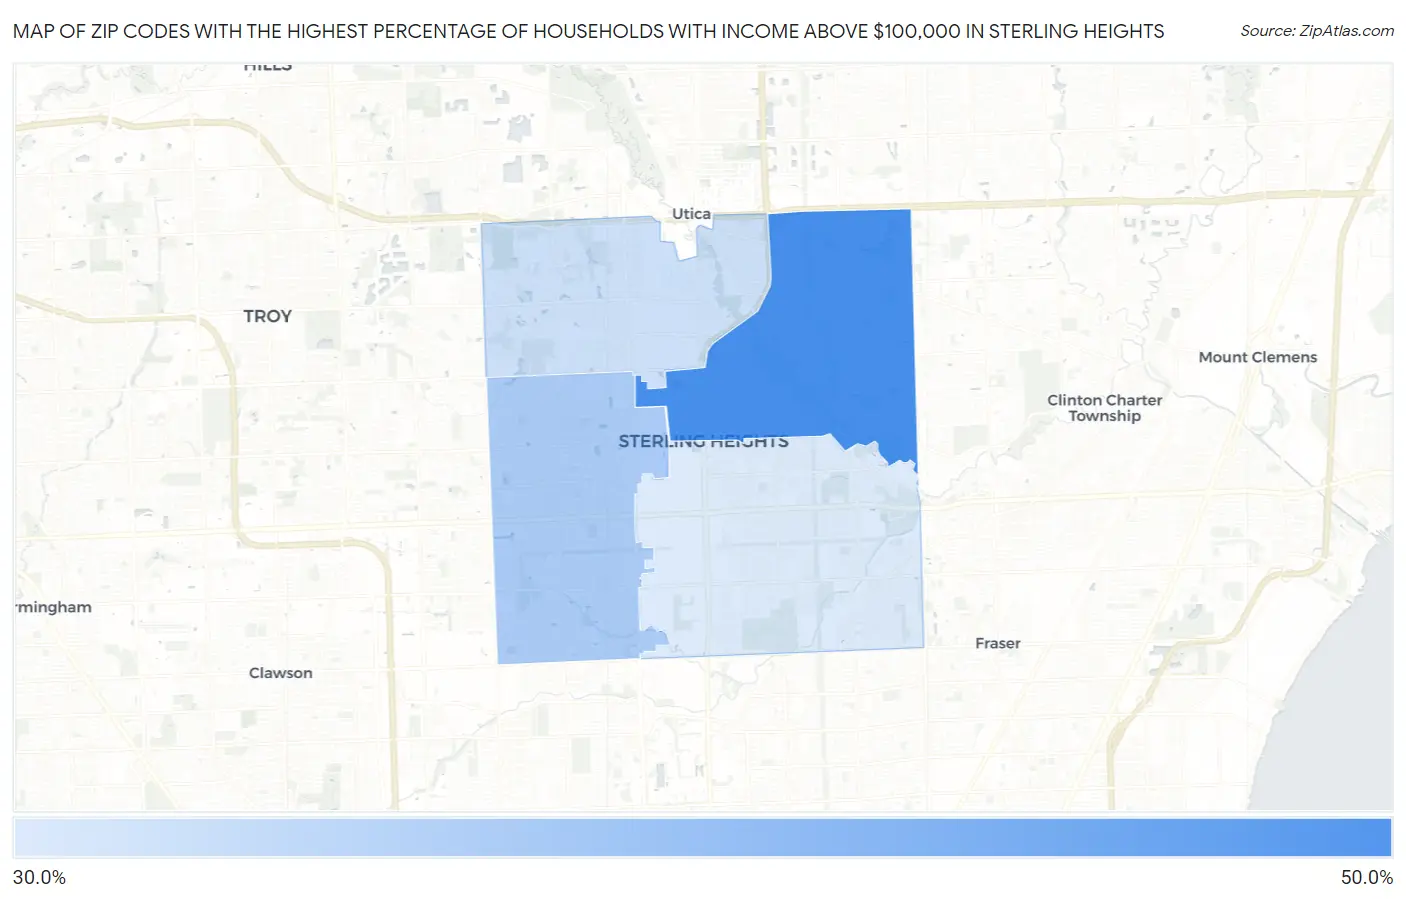
Map of Zip Codes with the Highest Percentage of Households with Income Above $100,000 in Sterling Heights
32.2%
43.3%
Zip Codes with the Highest Percentage of Households with Income Above $100,000 in Sterling Heights, MI
| Zip Code | Households with Income > $100k | vs State | vs National | |
| 1. | 48313 | 43.3% | 32.5%(+10.8)#145 | 37.3%(+6.00)#7,288 |
| 2. | 48310 | 35.8% | 32.5%(+3.30)#266 | 37.3%(-1.50)#11,243 |
| 3. | 48314 | 33.4% | 32.5%(+0.900)#323 | 37.3%(-3.90)#12,822 |
| 4. | 48312 | 32.2% | 32.5%(-0.300)#352 | 37.3%(-5.10)#13,692 |
1
Common Questions
What are the Top 3 Zip Codes with the Highest Percentage of Households with Income Above $100,000 in Sterling Heights, MI?
Top 3 Zip Codes with the Highest Percentage of Households with Income Above $100,000 in Sterling Heights, MI are:
What zip code has the Highest Percentage of Households with Income Above $100,000 in Sterling Heights, MI?
48313 has the Highest Percentage of Households with Income Above $100,000 in Sterling Heights, MI with 43.3%.
What is the Percentage of Households with Income Above $100,000 in Sterling Heights, MI?
Percentage of Households with Income Above $100,000 in Sterling Heights is 36.4%.
What is the Percentage of Households with Income Above $100,000 in Michigan?
Percentage of Households with Income Above $100,000 in Michigan is 32.5%.
What is the Percentage of Households with Income Above $100,000 in the United States?
Percentage of Households with Income Above $100,000 in the United States is 37.3%.