Reese, MI Map & Demographics
Reese Map
Reese Overview
$44,800
PER CAPITA INCOME
$105,956
AVG FAMILY INCOME
$81,583
AVG HOUSEHOLD INCOME
38.7%
WAGE / INCOME GAP [ % ]
61.3¢/ $1
WAGE / INCOME GAP [ $ ]
0.40
INEQUALITY / GINI INDEX
1,300
TOTAL POPULATION
599
MALE POPULATION
701
FEMALE POPULATION
85.45
MALES / 100 FEMALES
117.03
FEMALES / 100 MALES
48.3
MEDIAN AGE
2.7
AVG FAMILY SIZE
2.3
AVG HOUSEHOLD SIZE
736
LABOR FORCE [ PEOPLE ]
65.5%
PERCENT IN LABOR FORCE
11.7%
UNEMPLOYMENT RATE
Reese Zip Codes
Reese Area Codes
Income in Reese
Income Overview in Reese
Per Capita Income in Reese is $44,800, while median incomes of families and households are $105,956 and $81,583 respectively.
| Characteristic | Number | Measure |
| Per Capita Income | 1,300 | $44,800 |
| Median Family Income | 371 | $105,956 |
| Mean Family Income | 371 | $125,569 |
| Median Household Income | 571 | $81,583 |
| Mean Household Income | 571 | $100,061 |
| Income Deficit | 371 | $0 |
| Wage / Income Gap (%) | 1,300 | 38.73% |
| Wage / Income Gap ($) | 1,300 | 61.27¢ per $1 |
| Gini / Inequality Index | 1,300 | 0.40 |
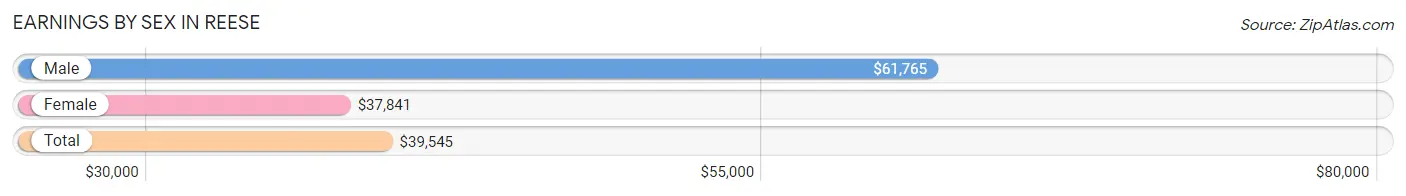
Earnings by Sex in Reese
Average Earnings in Reese are $39,545, $61,765 for men and $37,841 for women, a difference of 38.7%.
| Sex | Number | Average Earnings |
| Male | 380 (50.0%) | $61,765 |
| Female | 380 (50.0%) | $37,841 |
| Total | 760 (100.0%) | $39,545 |
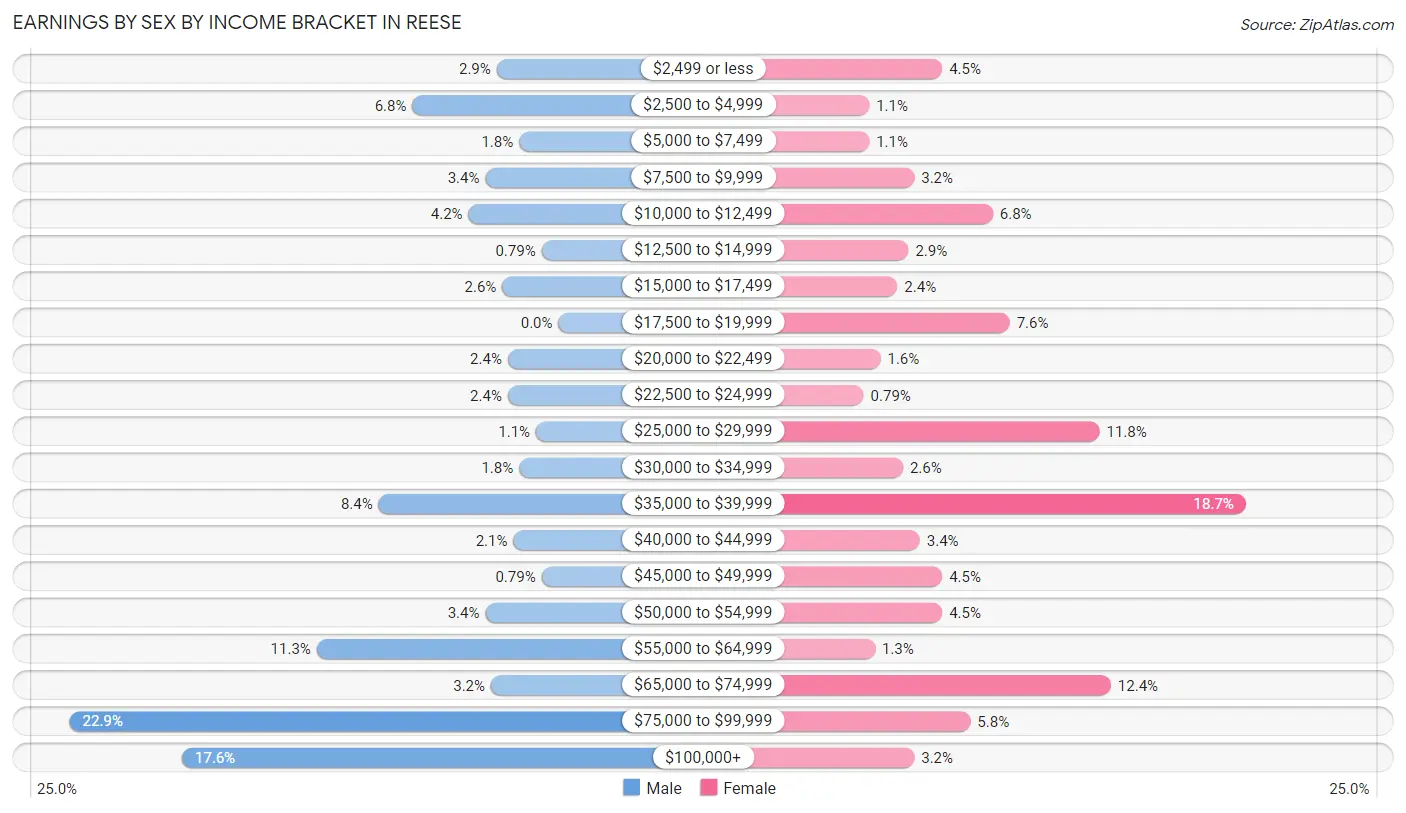
Earnings by Sex by Income Bracket in Reese
The most common earnings brackets in Reese are $75,000 to $99,999 for men (87 | 22.9%) and $35,000 to $39,999 for women (71 | 18.7%).
| Income | Male | Female |
| $2,499 or less | 11 (2.9%) | 17 (4.5%) |
| $2,500 to $4,999 | 26 (6.8%) | 4 (1.1%) |
| $5,000 to $7,499 | 7 (1.8%) | 4 (1.1%) |
| $7,500 to $9,999 | 13 (3.4%) | 12 (3.2%) |
| $10,000 to $12,499 | 16 (4.2%) | 26 (6.8%) |
| $12,500 to $14,999 | 3 (0.8%) | 11 (2.9%) |
| $15,000 to $17,499 | 10 (2.6%) | 9 (2.4%) |
| $17,500 to $19,999 | 0 (0.0%) | 29 (7.6%) |
| $20,000 to $22,499 | 9 (2.4%) | 6 (1.6%) |
| $22,500 to $24,999 | 9 (2.4%) | 3 (0.8%) |
| $25,000 to $29,999 | 4 (1.1%) | 45 (11.8%) |
| $30,000 to $34,999 | 7 (1.8%) | 10 (2.6%) |
| $35,000 to $39,999 | 32 (8.4%) | 71 (18.7%) |
| $40,000 to $44,999 | 8 (2.1%) | 13 (3.4%) |
| $45,000 to $49,999 | 3 (0.8%) | 17 (4.5%) |
| $50,000 to $54,999 | 13 (3.4%) | 17 (4.5%) |
| $55,000 to $64,999 | 43 (11.3%) | 5 (1.3%) |
| $65,000 to $74,999 | 12 (3.2%) | 47 (12.4%) |
| $75,000 to $99,999 | 87 (22.9%) | 22 (5.8%) |
| $100,000+ | 67 (17.6%) | 12 (3.2%) |
| Total | 380 (100.0%) | 380 (100.0%) |
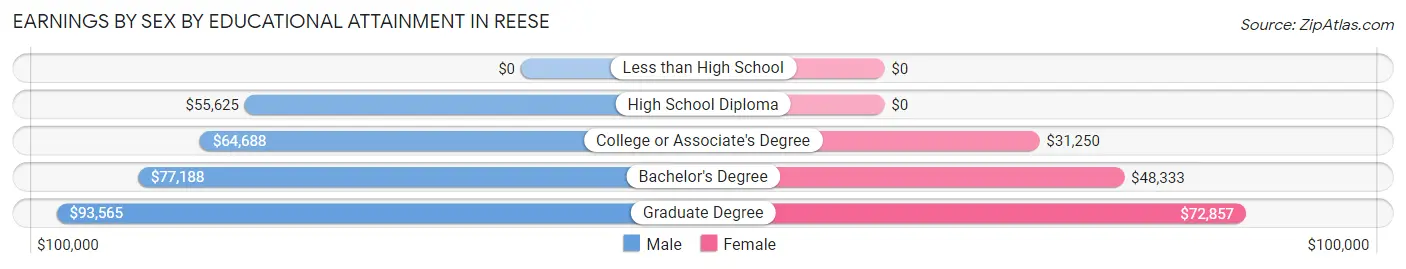
Earnings by Sex by Educational Attainment in Reese
Average earnings in Reese are $64,922 for men and $38,655 for women, a difference of 40.5%. Men with an educational attainment of graduate degree enjoy the highest average annual earnings of $93,565, while those with high school diploma education earn the least with $55,625. Women with an educational attainment of graduate degree earn the most with the average annual earnings of $72,857, while those with college or associate's degree education have the smallest earnings of $31,250.
| Educational Attainment | Male Income | Female Income |
| Less than High School | - | - |
| High School Diploma | $55,625 | $0 |
| College or Associate's Degree | $64,688 | $31,250 |
| Bachelor's Degree | $77,188 | $48,333 |
| Graduate Degree | $93,565 | $72,857 |
| Total | $64,922 | $38,655 |
Family Income in Reese
Family Income Brackets in Reese
According to the Reese family income data, there are 121 families falling into the $100,000 to $149,999 income range, which is the most common income bracket and makes up 32.6% of all families.
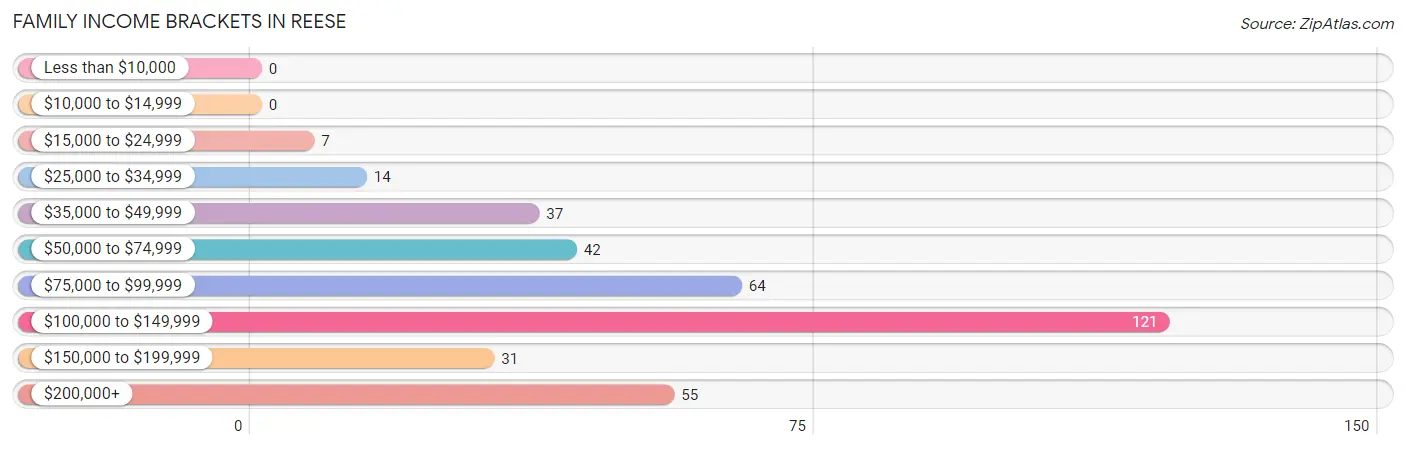
| Income Bracket | # Families | % Families |
| Less than $10,000 | 0 | 0.0% |
| $10,000 to $14,999 | 0 | 0.0% |
| $15,000 to $24,999 | 7 | 1.9% |
| $25,000 to $34,999 | 14 | 3.8% |
| $35,000 to $49,999 | 37 | 10.0% |
| $50,000 to $74,999 | 42 | 11.3% |
| $75,000 to $99,999 | 64 | 17.3% |
| $100,000 to $149,999 | 121 | 32.6% |
| $150,000 to $199,999 | 31 | 8.4% |
| $200,000+ | 55 | 14.8% |
Family Income by Famaliy Size in Reese
4-person families (71 | 19.1%) account for the highest median family income in Reese with $205,362 per family, while 4-person families (71 | 19.1%) have the highest median income of $51,340 per family member.
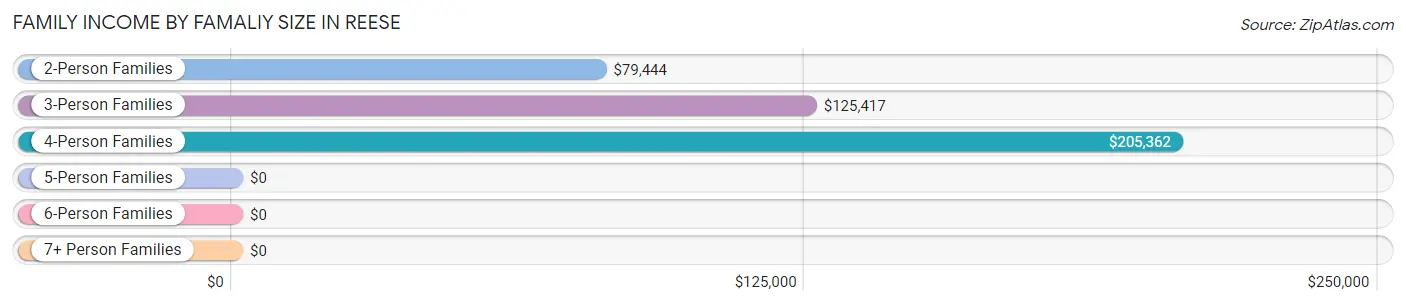
| Income Bracket | # Families | Median Income |
| 2-Person Families | 214 (57.7%) | $79,444 |
| 3-Person Families | 71 (19.1%) | $125,417 |
| 4-Person Families | 71 (19.1%) | $205,362 |
| 5-Person Families | 15 (4.0%) | $0 |
| 6-Person Families | 0 (0.0%) | $0 |
| 7+ Person Families | 0 (0.0%) | $0 |
| Total | 371 (100.0%) | $105,956 |
Family Income by Number of Earners in Reese
The median family income in Reese is $105,956, with families comprising 2 earners (166) having the highest median family income of $143,438, while families with 1 earner (102) have the lowest median family income of $73,571, accounting for 44.7% and 27.5% of families, respectively.
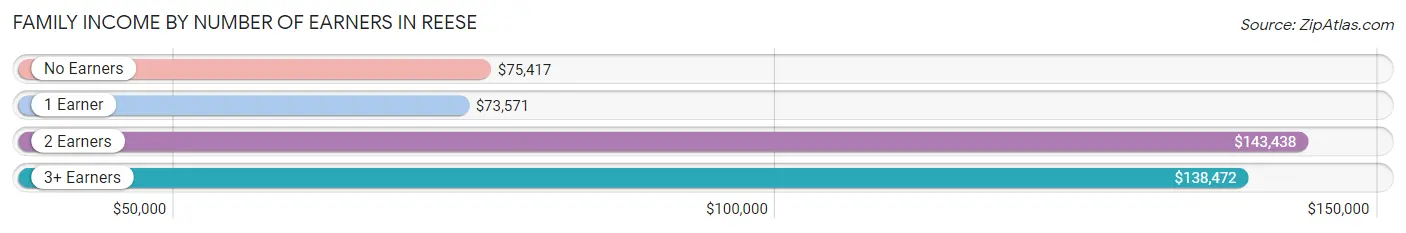
| Number of Earners | # Families | Median Income |
| No Earners | 64 (17.2%) | $75,417 |
| 1 Earner | 102 (27.5%) | $73,571 |
| 2 Earners | 166 (44.7%) | $143,438 |
| 3+ Earners | 39 (10.5%) | $138,472 |
| Total | 371 (100.0%) | $105,956 |
Household Income in Reese
Household Income Brackets in Reese
With 142 households falling in the category, the $100,000 to $149,999 income range is the most frequent in Reese, accounting for 24.9% of all households. In contrast, only 7 households (1.2%) fall into the less than $10,000 income bracket, making it the least populous group.
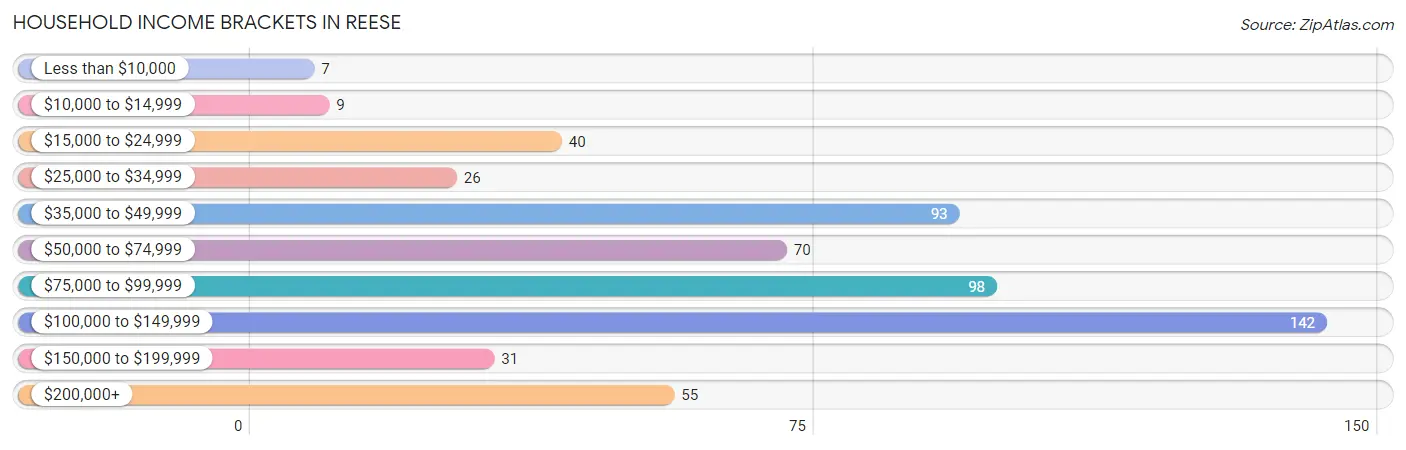
| Income Bracket | # Households | % Households |
| Less than $10,000 | 7 | 1.2% |
| $10,000 to $14,999 | 9 | 1.6% |
| $15,000 to $24,999 | 40 | 7.0% |
| $25,000 to $34,999 | 26 | 4.6% |
| $35,000 to $49,999 | 93 | 16.3% |
| $50,000 to $74,999 | 70 | 12.3% |
| $75,000 to $99,999 | 98 | 17.2% |
| $100,000 to $149,999 | 142 | 24.9% |
| $150,000 to $199,999 | 31 | 5.4% |
| $200,000+ | 55 | 9.6% |
Household Income by Householder Age in Reese
The median household income in Reese is $81,583, with the highest median household income of $131,563 found in the 45 to 64 years age bracket for the primary householder. A total of 217 households (38.0%) fall into this category. Meanwhile, the 15 to 24 years age bracket for the primary householder has the lowest median household income of $39,250, with 40 households (7.0%) in this group.
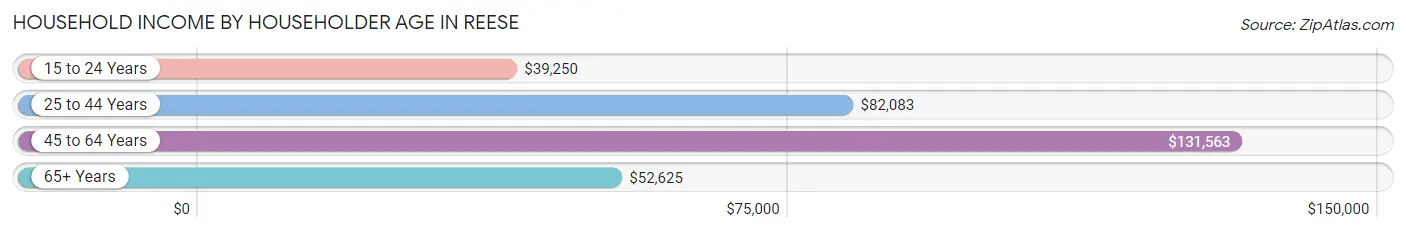
| Income Bracket | # Households | Median Income |
| 15 to 24 Years | 40 (7.0%) | $39,250 |
| 25 to 44 Years | 117 (20.5%) | $82,083 |
| 45 to 64 Years | 217 (38.0%) | $131,563 |
| 65+ Years | 197 (34.5%) | $52,625 |
| Total | 571 (100.0%) | $81,583 |
Poverty in Reese
Income Below Poverty by Sex and Age in Reese
With 2.4% poverty level for males and 6.6% for females among the residents of Reese, 18 to 24 year old males and 25 to 34 year old females are the most vulnerable to poverty, with 6 males (18.2%) and 15 females (16.7%) in their respective age groups living below the poverty level.
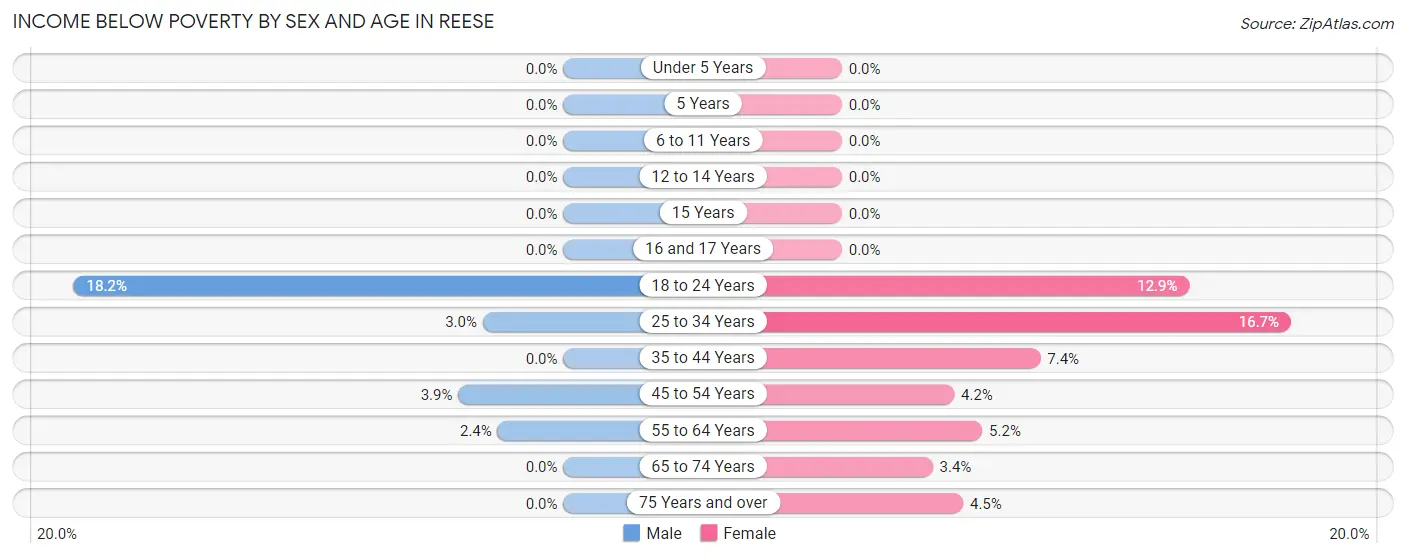
| Age Bracket | Male | Female |
| Under 5 Years | 0 (0.0%) | 0 (0.0%) |
| 5 Years | 0 (0.0%) | 0 (0.0%) |
| 6 to 11 Years | 0 (0.0%) | 0 (0.0%) |
| 12 to 14 Years | 0 (0.0%) | 0 (0.0%) |
| 15 Years | 0 (0.0%) | 0 (0.0%) |
| 16 and 17 Years | 0 (0.0%) | 0 (0.0%) |
| 18 to 24 Years | 6 (18.2%) | 8 (12.9%) |
| 25 to 34 Years | 2 (3.0%) | 15 (16.7%) |
| 35 to 44 Years | 0 (0.0%) | 7 (7.4%) |
| 45 to 54 Years | 3 (3.9%) | 3 (4.2%) |
| 55 to 64 Years | 3 (2.4%) | 5 (5.2%) |
| 65 to 74 Years | 0 (0.0%) | 3 (3.4%) |
| 75 Years and over | 0 (0.0%) | 5 (4.5%) |
| Total | 14 (2.4%) | 46 (6.6%) |
Income Above Poverty by Sex and Age in Reese
According to the poverty statistics in Reese, males aged under 5 years and females aged under 5 years are the age groups that are most secure financially, with 100.0% of males and 100.0% of females in these age groups living above the poverty line.
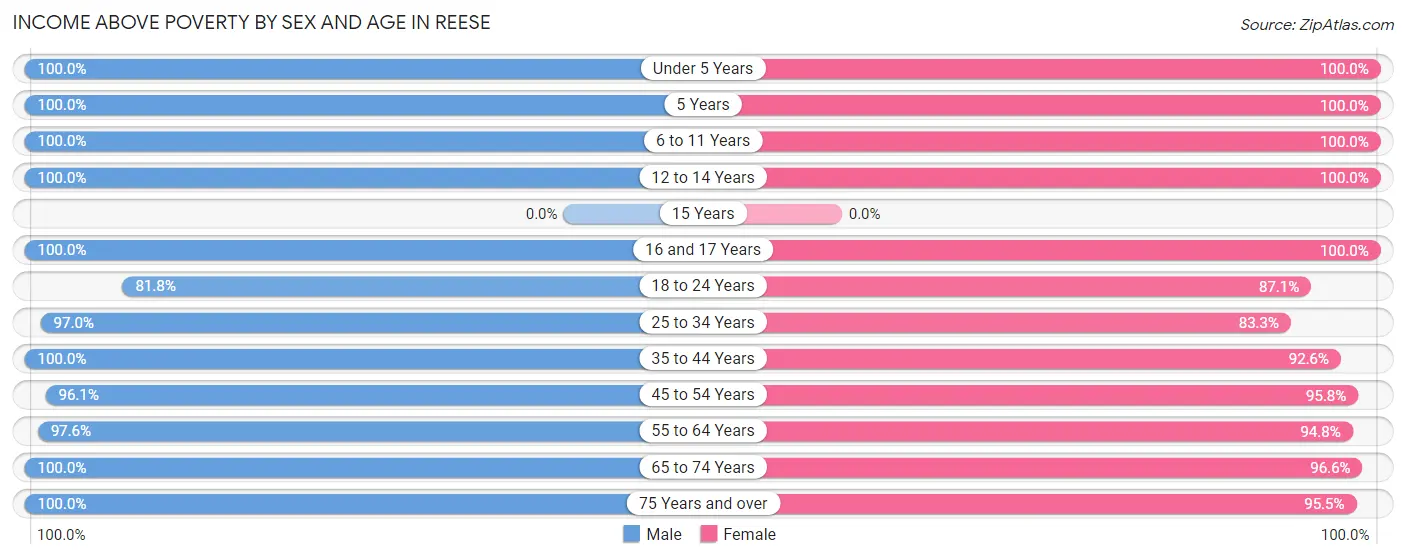
| Age Bracket | Male | Female |
| Under 5 Years | 21 (100.0%) | 16 (100.0%) |
| 5 Years | 14 (100.0%) | 3 (100.0%) |
| 6 to 11 Years | 21 (100.0%) | 19 (100.0%) |
| 12 to 14 Years | 35 (100.0%) | 40 (100.0%) |
| 15 Years | 0 (0.0%) | 0 (0.0%) |
| 16 and 17 Years | 21 (100.0%) | 8 (100.0%) |
| 18 to 24 Years | 27 (81.8%) | 54 (87.1%) |
| 25 to 34 Years | 65 (97.0%) | 75 (83.3%) |
| 35 to 44 Years | 56 (100.0%) | 88 (92.6%) |
| 45 to 54 Years | 74 (96.1%) | 69 (95.8%) |
| 55 to 64 Years | 120 (97.6%) | 91 (94.8%) |
| 65 to 74 Years | 93 (100.0%) | 86 (96.6%) |
| 75 Years and over | 31 (100.0%) | 106 (95.5%) |
| Total | 578 (97.6%) | 655 (93.4%) |
Income Below Poverty Among Married-Couple Families in Reese
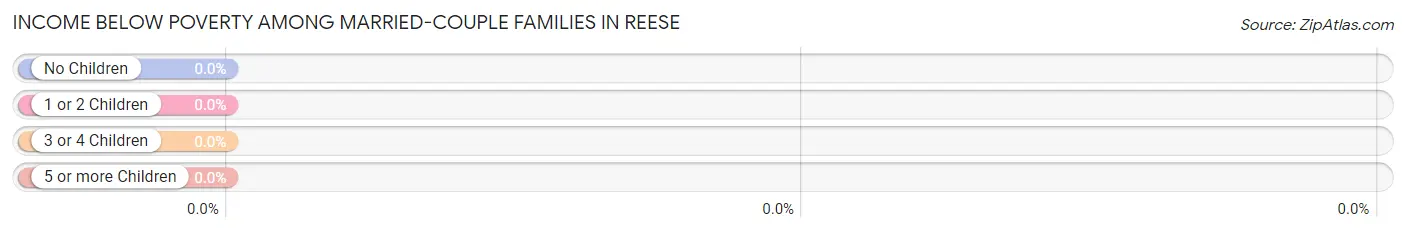
| Children | Above Poverty | Below Poverty |
| No Children | 202 (100.0%) | 0 (0.0%) |
| 1 or 2 Children | 98 (100.0%) | 0 (0.0%) |
| 3 or 4 Children | 10 (100.0%) | 0 (0.0%) |
| 5 or more Children | 0 (0.0%) | 0 (0.0%) |
| Total | 310 (100.0%) | 0 (0.0%) |
Income Below Poverty Among Single-Parent Households in Reese
| Children | Single Father | Single Mother |
| No Children | 0 (0.0%) | 0 (0.0%) |
| 1 or 2 Children | 0 (0.0%) | 0 (0.0%) |
| 3 or 4 Children | 0 (0.0%) | 0 (0.0%) |
| 5 or more Children | 0 (0.0%) | 0 (0.0%) |
| Total | 0 (0.0%) | 0 (0.0%) |
Income Below Poverty Among Married-Couple vs Single-Parent Households in Reese
| Children | Married-Couple Families | Single-Parent Households |
| No Children | 0 (0.0%) | 0 (0.0%) |
| 1 or 2 Children | 0 (0.0%) | 0 (0.0%) |
| 3 or 4 Children | 0 (0.0%) | 0 (0.0%) |
| 5 or more Children | 0 (0.0%) | 0 (0.0%) |
| Total | 0 (0.0%) | 0 (0.0%) |
Race in Reese
The most populous races in Reese are White / Caucasian (1,242 | 95.5%), Two or more Races (46 | 3.5%), and Hispanic or Latino (21 | 1.6%).
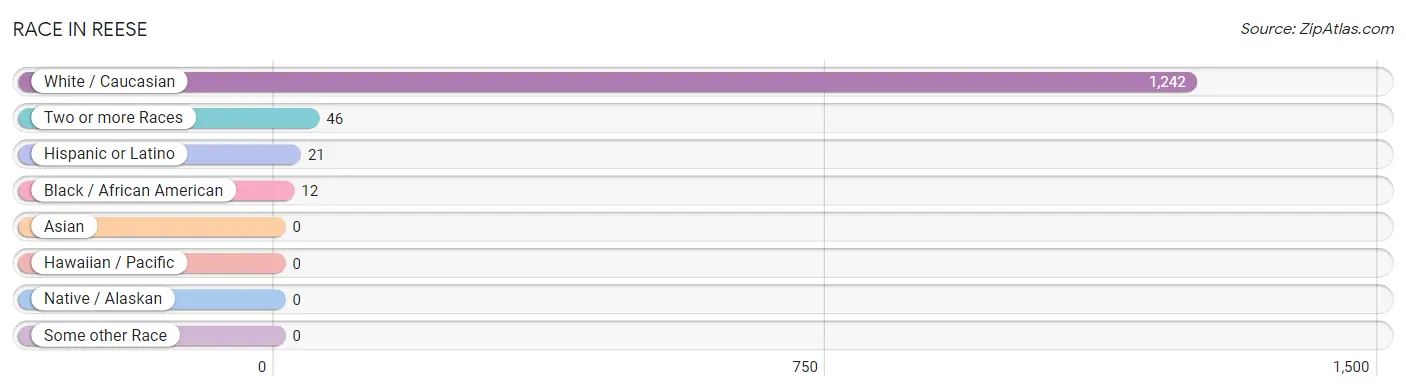
| Race | # Population | % Population |
| Asian | 0 | 0.0% |
| Black / African American | 12 | 0.9% |
| Hawaiian / Pacific | 0 | 0.0% |
| Hispanic or Latino | 21 | 1.6% |
| Native / Alaskan | 0 | 0.0% |
| White / Caucasian | 1,242 | 95.5% |
| Two or more Races | 46 | 3.5% |
| Some other Race | 0 | 0.0% |
| Total | 1,300 | 100.0% |
Ancestry in Reese
The most populous ancestries reported in Reese are German (703 | 54.1%), Polish (230 | 17.7%), French (108 | 8.3%), American (102 | 7.9%), and Irish (102 | 7.9%), together accounting for 95.8% of all Reese residents.
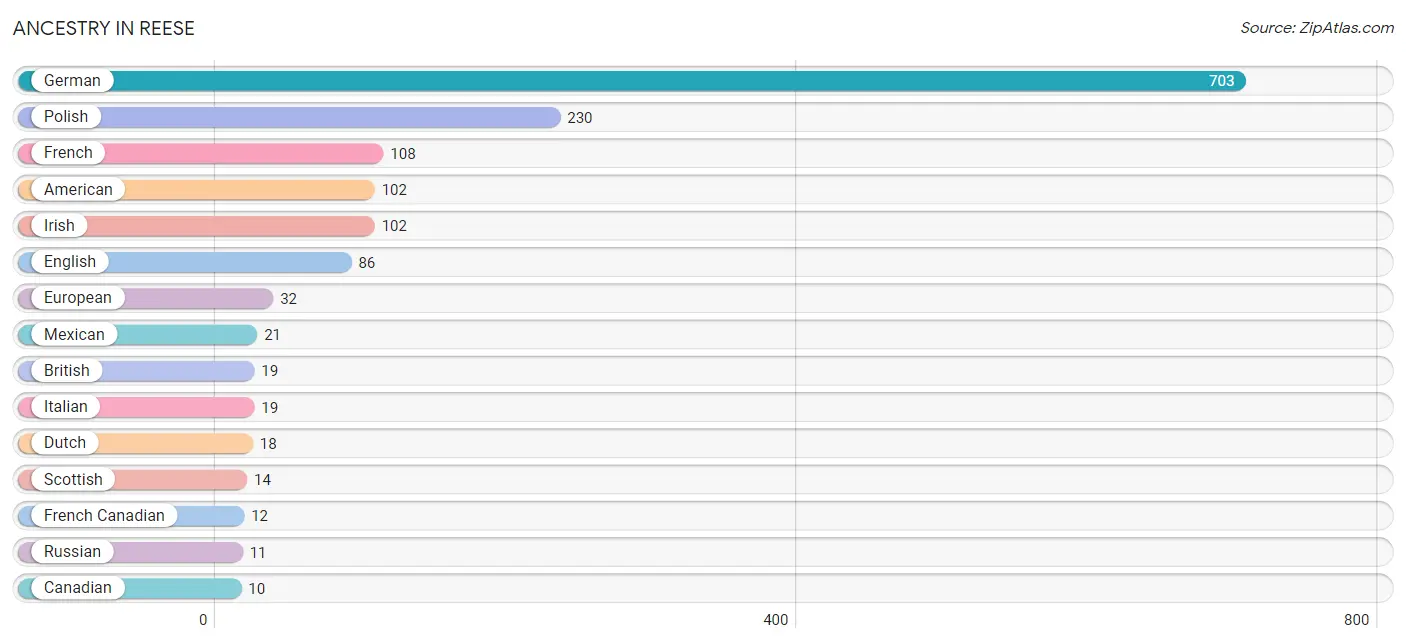
| Ancestry | # Population | % Population |
| American | 102 | 7.9% |
| Austrian | 7 | 0.5% |
| Belgian | 4 | 0.3% |
| British | 19 | 1.5% |
| Canadian | 10 | 0.8% |
| Chippewa | 3 | 0.2% |
| Czechoslovakian | 3 | 0.2% |
| Dutch | 18 | 1.4% |
| Eastern European | 8 | 0.6% |
| English | 86 | 6.6% |
| European | 32 | 2.5% |
| French | 108 | 8.3% |
| French Canadian | 12 | 0.9% |
| German | 703 | 54.1% |
| Greek | 5 | 0.4% |
| Hungarian | 6 | 0.5% |
| Irish | 102 | 7.9% |
| Italian | 19 | 1.5% |
| Lithuanian | 5 | 0.4% |
| Mexican | 21 | 1.6% |
| Norwegian | 7 | 0.5% |
| Polish | 230 | 17.7% |
| Russian | 11 | 0.9% |
| Scotch-Irish | 10 | 0.8% |
| Scottish | 14 | 1.1% |
| Swedish | 2 | 0.2% | View All 26 Rows |
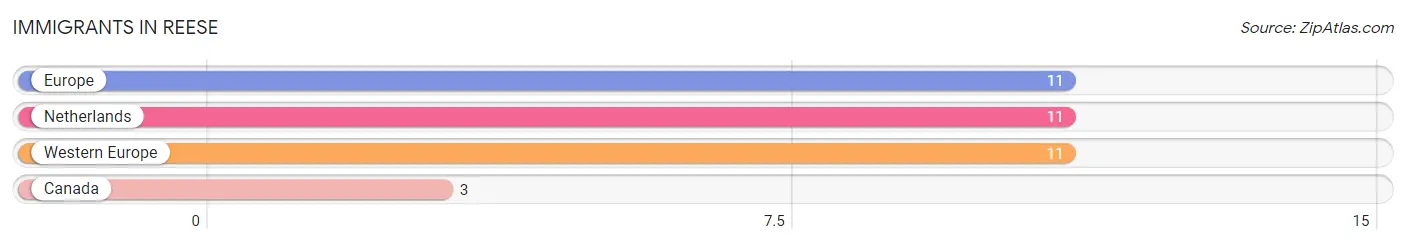
Immigrants in Reese
The most numerous immigrant groups reported in Reese came from Europe (11 | 0.9%), Netherlands (11 | 0.9%), Western Europe (11 | 0.9%), and Canada (3 | 0.2%), together accounting for 2.8% of all Reese residents.
| Immigration Origin | # Population | % Population |
| Canada | 3 | 0.2% |
| Europe | 11 | 0.9% |
| Netherlands | 11 | 0.9% |
| Western Europe | 11 | 0.9% | View All 4 Rows |
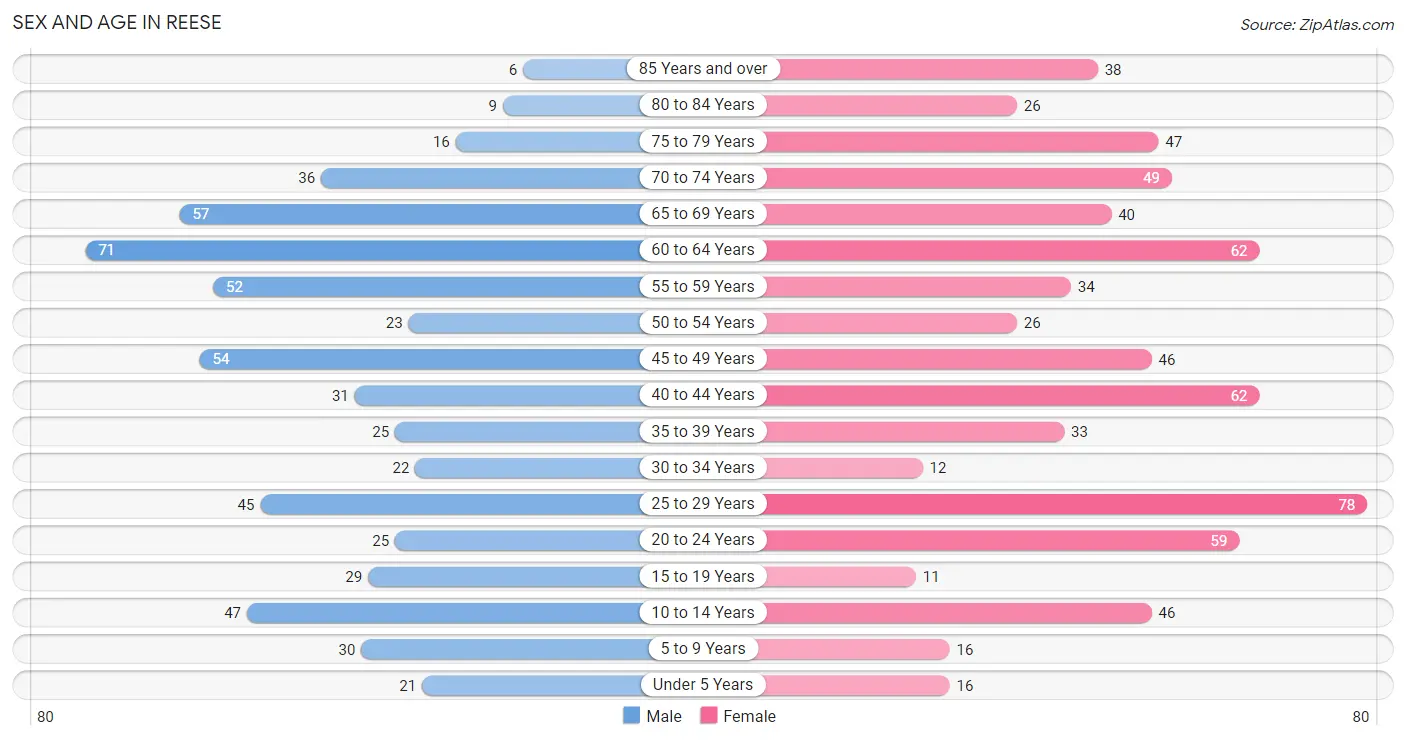
Sex and Age in Reese
Sex and Age in Reese
The most populous age groups in Reese are 60 to 64 Years (71 | 11.8%) for men and 25 to 29 Years (78 | 11.1%) for women.
| Age Bracket | Male | Female |
| Under 5 Years | 21 (3.5%) | 16 (2.3%) |
| 5 to 9 Years | 30 (5.0%) | 16 (2.3%) |
| 10 to 14 Years | 47 (7.9%) | 46 (6.6%) |
| 15 to 19 Years | 29 (4.8%) | 11 (1.6%) |
| 20 to 24 Years | 25 (4.2%) | 59 (8.4%) |
| 25 to 29 Years | 45 (7.5%) | 78 (11.1%) |
| 30 to 34 Years | 22 (3.7%) | 12 (1.7%) |
| 35 to 39 Years | 25 (4.2%) | 33 (4.7%) |
| 40 to 44 Years | 31 (5.2%) | 62 (8.8%) |
| 45 to 49 Years | 54 (9.0%) | 46 (6.6%) |
| 50 to 54 Years | 23 (3.8%) | 26 (3.7%) |
| 55 to 59 Years | 52 (8.7%) | 34 (4.9%) |
| 60 to 64 Years | 71 (11.8%) | 62 (8.8%) |
| 65 to 69 Years | 57 (9.5%) | 40 (5.7%) |
| 70 to 74 Years | 36 (6.0%) | 49 (7.0%) |
| 75 to 79 Years | 16 (2.7%) | 47 (6.7%) |
| 80 to 84 Years | 9 (1.5%) | 26 (3.7%) |
| 85 Years and over | 6 (1.0%) | 38 (5.4%) |
| Total | 599 (100.0%) | 701 (100.0%) |
Families and Households in Reese
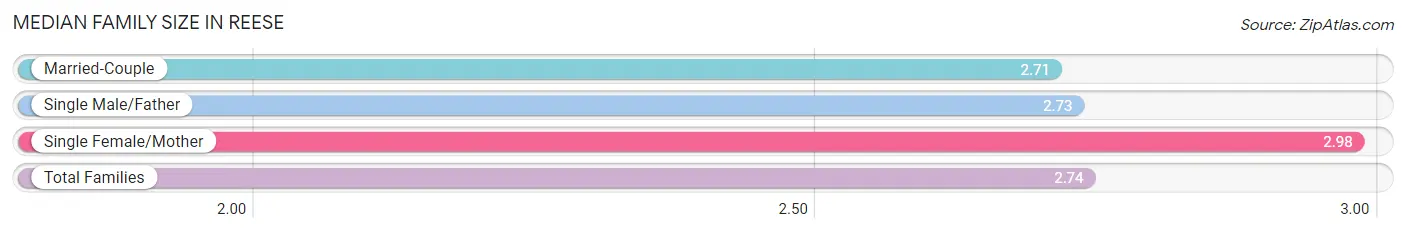
Median Family Size in Reese
The median family size in Reese is 2.74 persons per family, with single female/mother families (46 | 12.4%) accounting for the largest median family size of 2.98 persons per family. On the other hand, married-couple families (310 | 83.6%) represent the smallest median family size with 2.71 persons per family.
| Family Type | # Families | Family Size |
| Married-Couple | 310 (83.6%) | 2.71 |
| Single Male/Father | 15 (4.0%) | 2.73 |
| Single Female/Mother | 46 (12.4%) | 2.98 |
| Total Families | 371 (100.0%) | 2.74 |
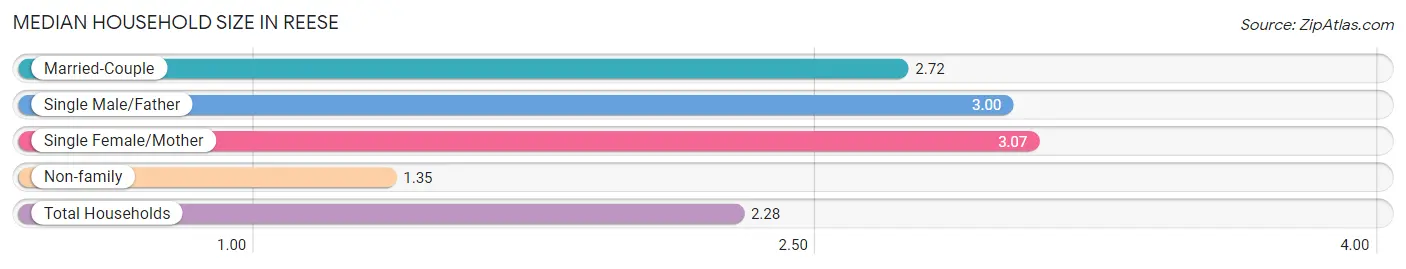
Median Household Size in Reese
The median household size in Reese is 2.28 persons per household, with single female/mother households (46 | 8.1%) accounting for the largest median household size of 3.07 persons per household. non-family households (200 | 35.0%) represent the smallest median household size with 1.35 persons per household.
| Household Type | # Households | Household Size |
| Married-Couple | 310 (54.3%) | 2.72 |
| Single Male/Father | 15 (2.6%) | 3.00 |
| Single Female/Mother | 46 (8.1%) | 3.07 |
| Non-family | 200 (35.0%) | 1.35 |
| Total Households | 571 (100.0%) | 2.28 |
Household Size by Marriage Status in Reese
Out of a total of 571 households in Reese, 371 (65.0%) are family households, while 200 (35.0%) are nonfamily households. The most numerous type of family households are 2-person households, comprising 208, and the most common type of nonfamily households are 1-person households, comprising 144.
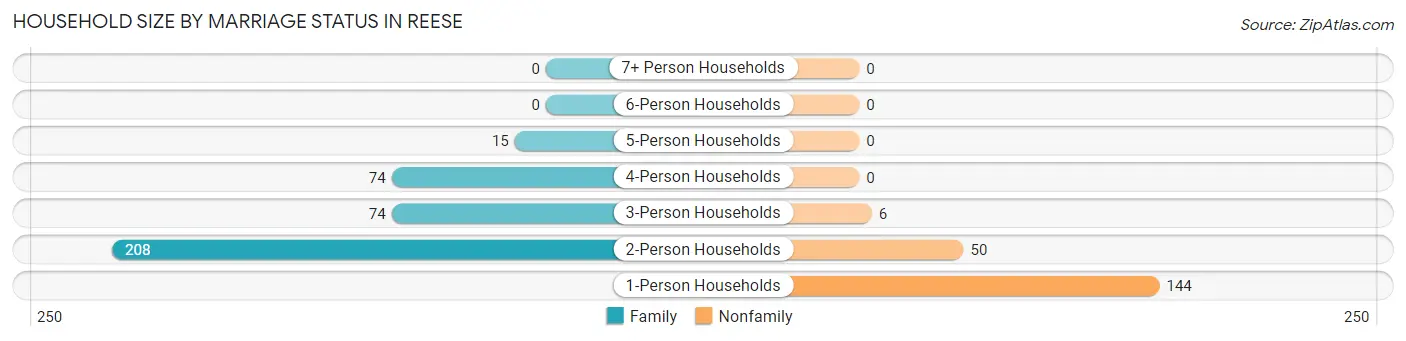
| Household Size | Family Households | Nonfamily Households |
| 1-Person Households | - | 144 (25.2%) |
| 2-Person Households | 208 (36.4%) | 50 (8.8%) |
| 3-Person Households | 74 (13.0%) | 6 (1.1%) |
| 4-Person Households | 74 (13.0%) | 0 (0.0%) |
| 5-Person Households | 15 (2.6%) | 0 (0.0%) |
| 6-Person Households | 0 (0.0%) | 0 (0.0%) |
| 7+ Person Households | 0 (0.0%) | 0 (0.0%) |
| Total | 371 (65.0%) | 200 (35.0%) |
Female Fertility in Reese
Fertility by Age in Reese
Average fertility rate in Reese is 13.0 births per 1,000 women. Women in the age bracket of 20 to 34 years have the highest fertility rate with 27.0 births per 1,000 women. Women in the age bracket of 20 to 34 years acount for 100.0% of all women with births.
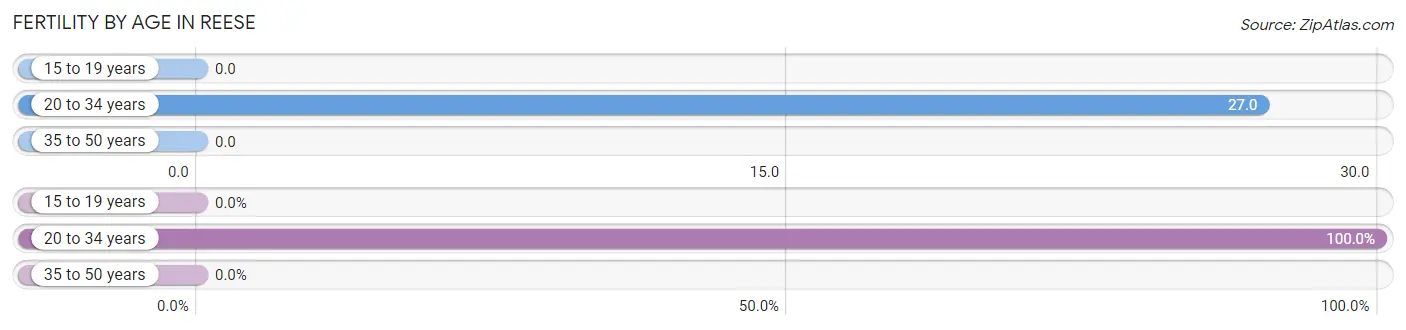
| Age Bracket | Women with Births | Births / 1,000 Women |
| 15 to 19 years | 0 (0.0%) | 0.0 |
| 20 to 34 years | 4 (100.0%) | 27.0 |
| 35 to 50 years | 0 (0.0%) | 0.0 |
| Total | 4 (100.0%) | 13.0 |
Fertility by Age by Marriage Status in Reese
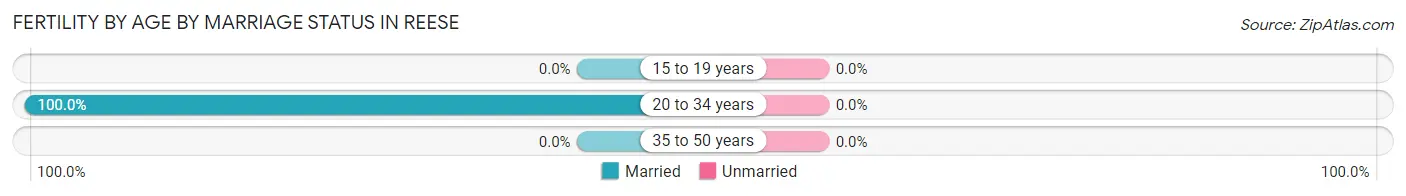
| Age Bracket | Married | Unmarried |
| 15 to 19 years | 0 (0.0%) | 0 (0.0%) |
| 20 to 34 years | 4 (100.0%) | 0 (0.0%) |
| 35 to 50 years | 0 (0.0%) | 0 (0.0%) |
| Total | 4 (100.0%) | 0 (0.0%) |
Fertility by Education in Reese
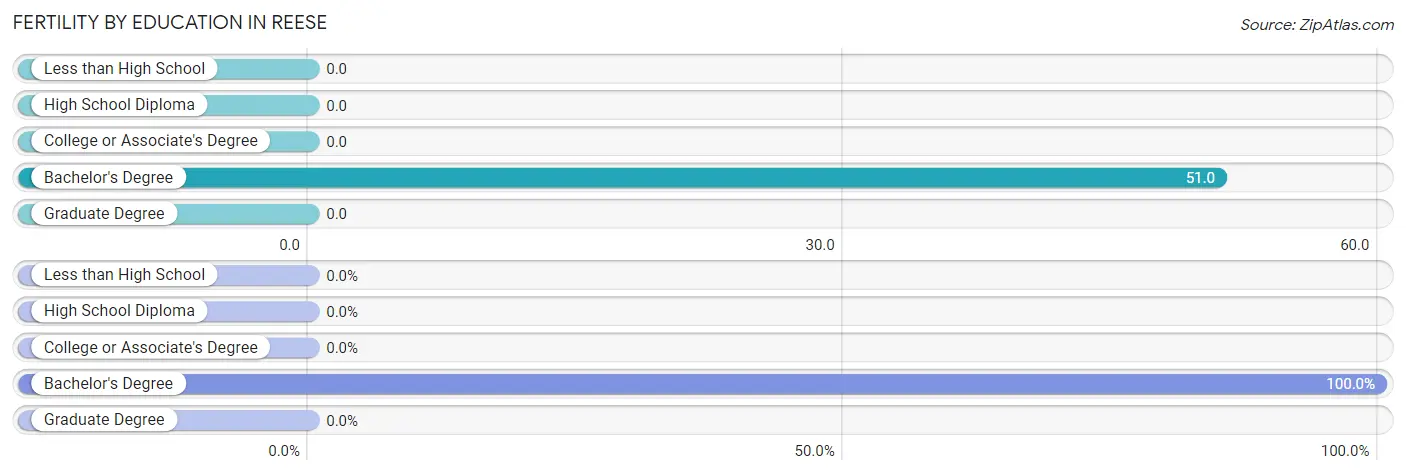
| Educational Attainment | Women with Births | Births / 1,000 Women |
| Less than High School | 0 (0.0%) | 0.0 |
| High School Diploma | 0 (0.0%) | 0.0 |
| College or Associate's Degree | 0 (0.0%) | 0.0 |
| Bachelor's Degree | 4 (100.0%) | 51.0 |
| Graduate Degree | 0 (0.0%) | 0.0 |
| Total | 4 (100.0%) | 13.0 |
Fertility by Education by Marriage Status in Reese
| Educational Attainment | Married | Unmarried |
| Less than High School | 0 (0.0%) | 0 (0.0%) |
| High School Diploma | 0 (0.0%) | 0 (0.0%) |
| College or Associate's Degree | 0 (0.0%) | 0 (0.0%) |
| Bachelor's Degree | 4 (100.0%) | 0 (0.0%) |
| Graduate Degree | 0 (0.0%) | 0 (0.0%) |
| Total | 4 (100.0%) | 0 (0.0%) |
Employment Characteristics in Reese
Employment by Class of Employer in Reese
Among the 638 employed individuals in Reese, private company employees (409 | 64.1%), local government employees (112 | 17.5%), and not-for-profit organizations (55 | 8.6%) make up the most common classes of employment.
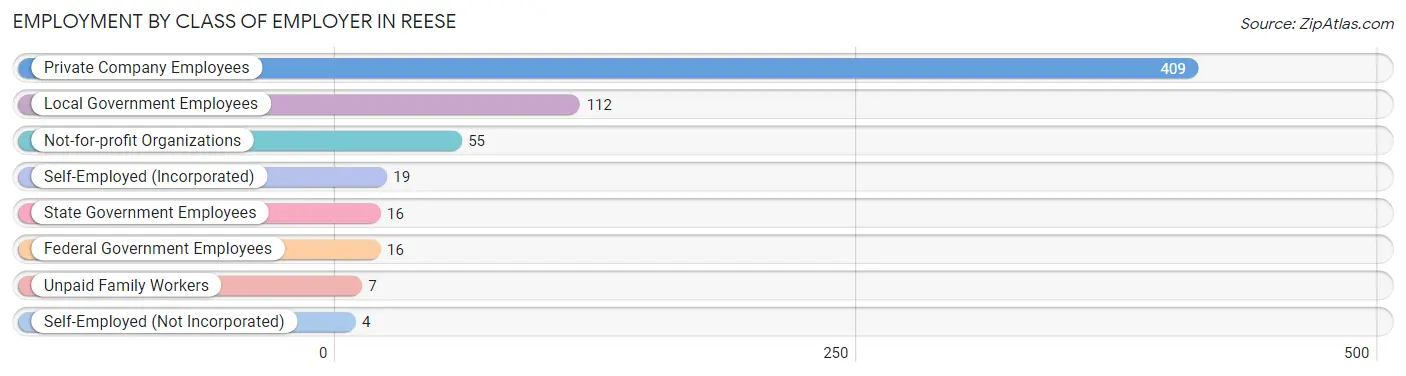
| Employer Class | # Employees | % Employees |
| Private Company Employees | 409 | 64.1% |
| Self-Employed (Incorporated) | 19 | 3.0% |
| Self-Employed (Not Incorporated) | 4 | 0.6% |
| Not-for-profit Organizations | 55 | 8.6% |
| Local Government Employees | 112 | 17.5% |
| State Government Employees | 16 | 2.5% |
| Federal Government Employees | 16 | 2.5% |
| Unpaid Family Workers | 7 | 1.1% |
| Total | 638 | 100.0% |
Employment Status by Age in Reese
According to the labor force statistics for Reese, out of the total population over 16 years of age (1,124), 65.5% or 736 individuals are in the labor force, with 11.7% or 86 of them unemployed. The age group with the highest labor force participation rate is 30 to 34 years, with 100.0% or 34 individuals in the labor force. Within the labor force, the 16 to 19 years age range has the highest percentage of unemployed individuals, with 80.8% or 21 of them being unemployed.
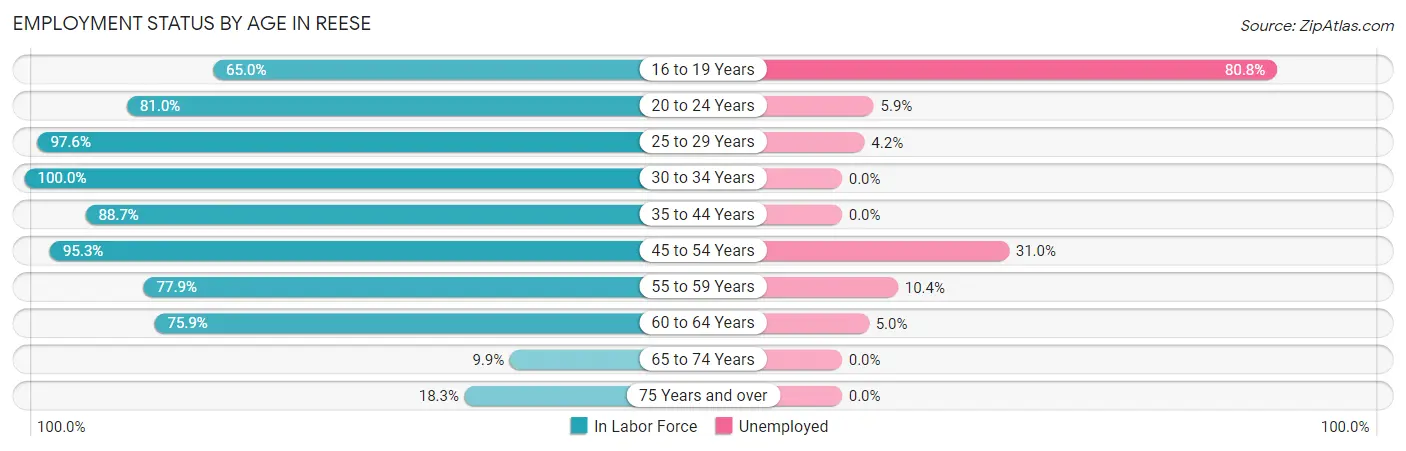
| Age Bracket | In Labor Force | Unemployed |
| 16 to 19 Years | 26 (65.0%) | 21 (80.8%) |
| 20 to 24 Years | 68 (81.0%) | 4 (5.9%) |
| 25 to 29 Years | 120 (97.6%) | 5 (4.2%) |
| 30 to 34 Years | 34 (100.0%) | 0 (0.0%) |
| 35 to 44 Years | 134 (88.7%) | 0 (0.0%) |
| 45 to 54 Years | 142 (95.3%) | 44 (31.0%) |
| 55 to 59 Years | 67 (77.9%) | 7 (10.4%) |
| 60 to 64 Years | 101 (75.9%) | 5 (5.0%) |
| 65 to 74 Years | 18 (9.9%) | 0 (0.0%) |
| 75 Years and over | 26 (18.3%) | 0 (0.0%) |
| Total | 736 (65.5%) | 86 (11.7%) |
Employment Status by Educational Attainment in Reese
According to labor force statistics for Reese, 88.5% of individuals (598) out of the total population between 25 and 64 years of age (676) are in the labor force, with 10.2% or 61 of them being unemployed. The group with the highest labor force participation rate are those with the educational attainment of bachelor's degree or higher, with 97.0% or 193 individuals in the labor force. Within the labor force, individuals with college / associate degree education have the highest percentage of unemployment, with 16.3% or 45 of them being unemployed.
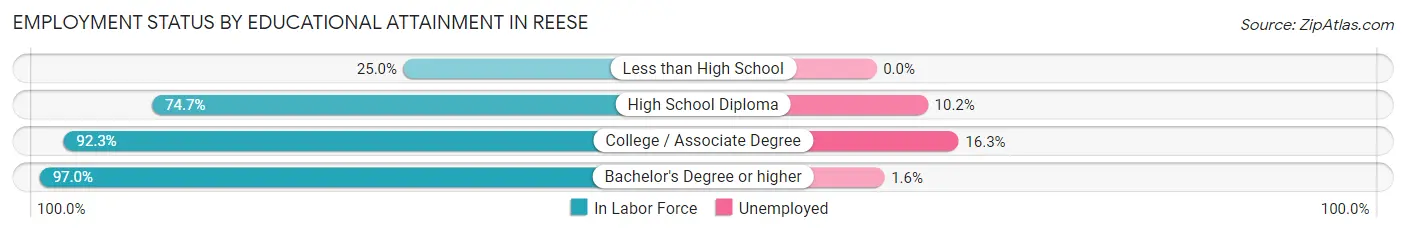
| Educational Attainment | In Labor Force | Unemployed |
| Less than High School | 2 (25.0%) | 0 (0.0%) |
| High School Diploma | 127 (74.7%) | 17 (10.2%) |
| College / Associate Degree | 276 (92.3%) | 49 (16.3%) |
| Bachelor's Degree or higher | 193 (97.0%) | 3 (1.6%) |
| Total | 598 (88.5%) | 69 (10.2%) |
Employment Occupations by Sex in Reese
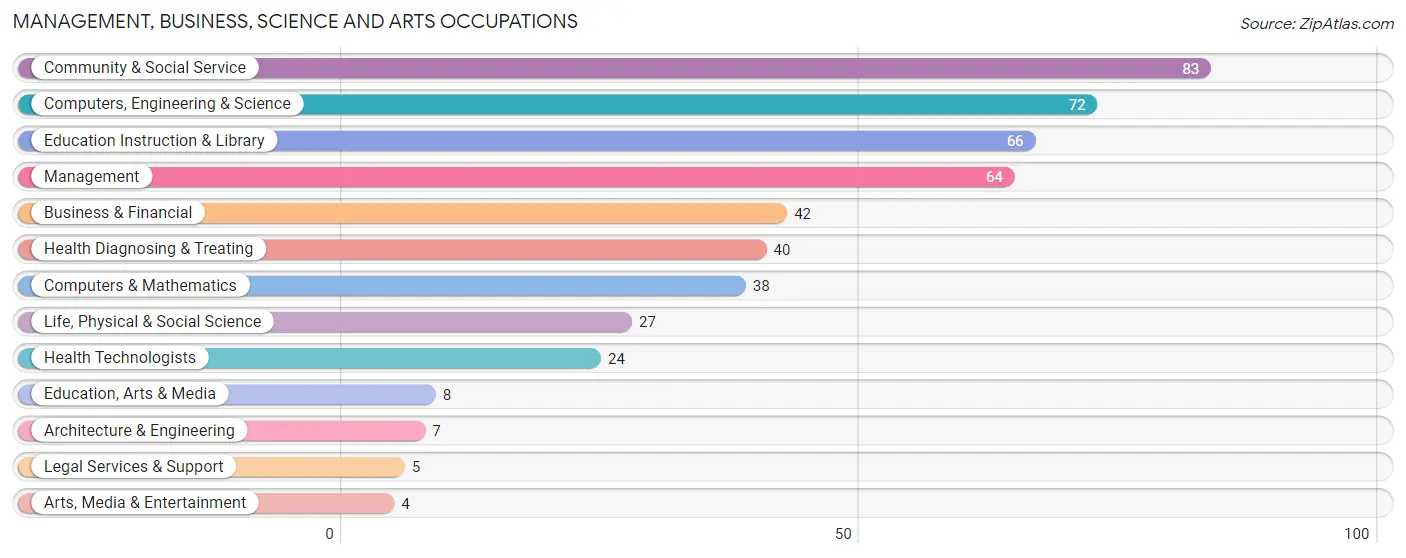
Management, Business, Science and Arts Occupations
The most common Management, Business, Science and Arts occupations in Reese are Community & Social Service (83 | 12.8%), Computers, Engineering & Science (72 | 11.1%), Education Instruction & Library (66 | 10.2%), Management (64 | 9.9%), and Business & Financial (42 | 6.5%).
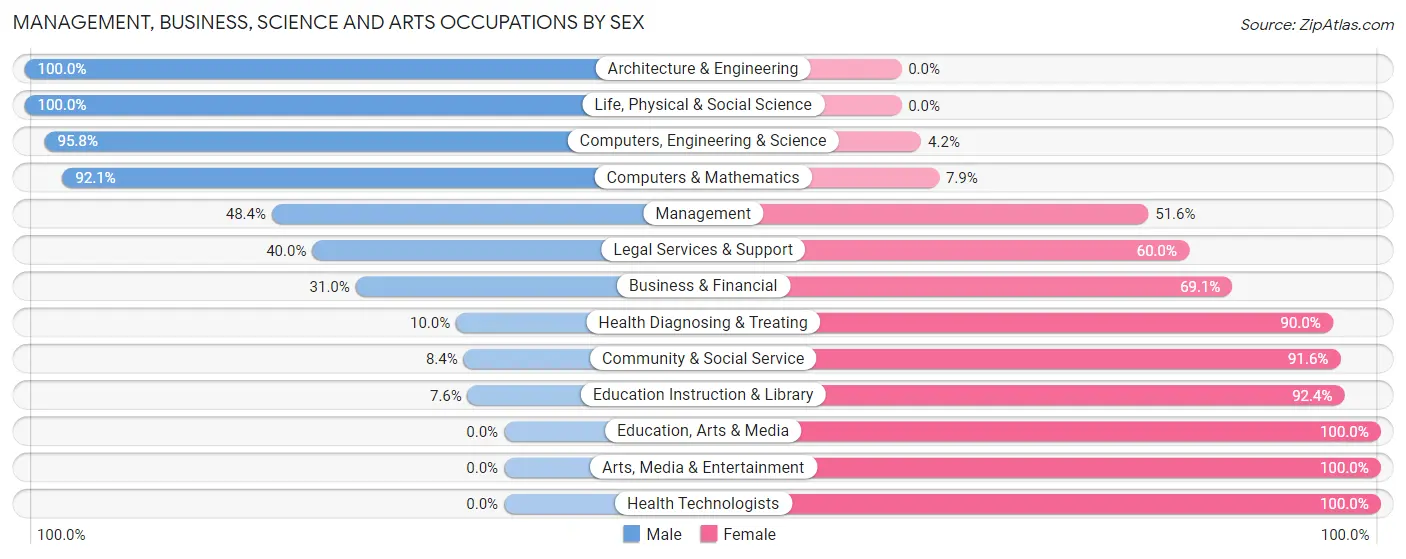
Management, Business, Science and Arts Occupations by Sex
Within the Management, Business, Science and Arts occupations in Reese, the most male-oriented occupations are Architecture & Engineering (100.0%), Life, Physical & Social Science (100.0%), and Computers, Engineering & Science (95.8%), while the most female-oriented occupations are Education, Arts & Media (100.0%), Arts, Media & Entertainment (100.0%), and Health Technologists (100.0%).
| Occupation | Male | Female |
| Management | 31 (48.4%) | 33 (51.6%) |
| Business & Financial | 13 (30.9%) | 29 (69.1%) |
| Computers, Engineering & Science | 69 (95.8%) | 3 (4.2%) |
| Computers & Mathematics | 35 (92.1%) | 3 (7.9%) |
| Architecture & Engineering | 7 (100.0%) | 0 (0.0%) |
| Life, Physical & Social Science | 27 (100.0%) | 0 (0.0%) |
| Community & Social Service | 7 (8.4%) | 76 (91.6%) |
| Education, Arts & Media | 0 (0.0%) | 8 (100.0%) |
| Legal Services & Support | 2 (40.0%) | 3 (60.0%) |
| Education Instruction & Library | 5 (7.6%) | 61 (92.4%) |
| Arts, Media & Entertainment | 0 (0.0%) | 4 (100.0%) |
| Health Diagnosing & Treating | 4 (10.0%) | 36 (90.0%) |
| Health Technologists | 0 (0.0%) | 24 (100.0%) |
| Total (Category) | 124 (41.2%) | 177 (58.8%) |
| Total (Overall) | 287 (44.2%) | 363 (55.8%) |
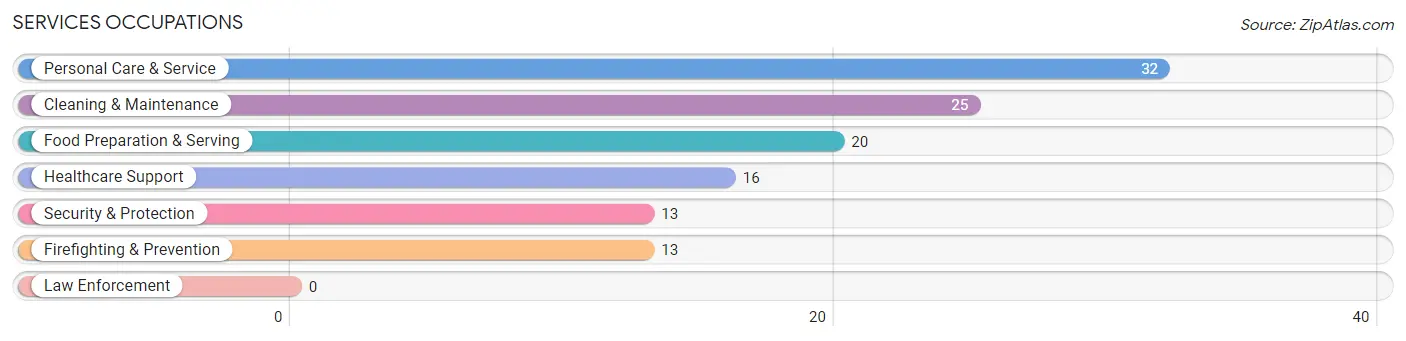
Services Occupations
The most common Services occupations in Reese are Personal Care & Service (32 | 4.9%), Cleaning & Maintenance (25 | 3.8%), Food Preparation & Serving (20 | 3.1%), Healthcare Support (16 | 2.5%), and Security & Protection (13 | 2.0%).
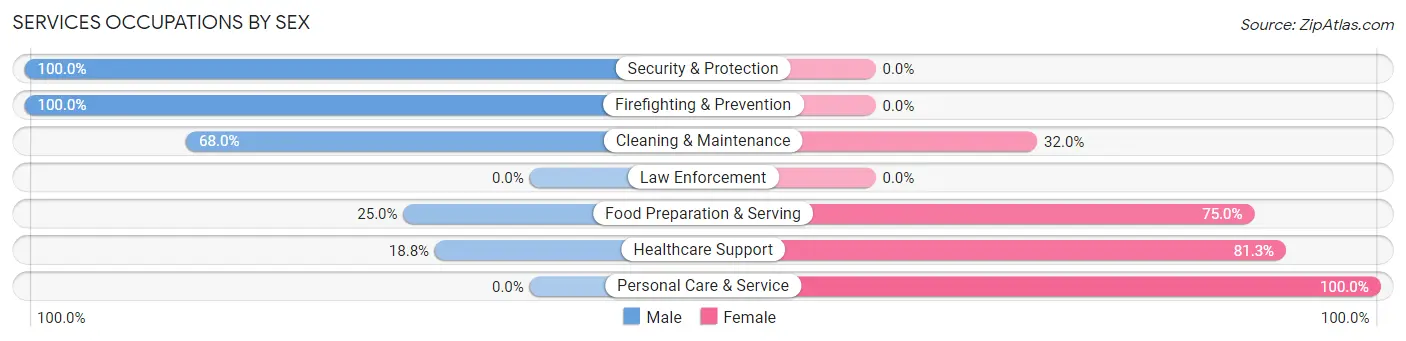
Services Occupations by Sex
Within the Services occupations in Reese, the most male-oriented occupations are Security & Protection (100.0%), Firefighting & Prevention (100.0%), and Cleaning & Maintenance (68.0%), while the most female-oriented occupations are Personal Care & Service (100.0%), Healthcare Support (81.2%), and Food Preparation & Serving (75.0%).
| Occupation | Male | Female |
| Healthcare Support | 3 (18.8%) | 13 (81.2%) |
| Security & Protection | 13 (100.0%) | 0 (0.0%) |
| Firefighting & Prevention | 13 (100.0%) | 0 (0.0%) |
| Law Enforcement | 0 (0.0%) | 0 (0.0%) |
| Food Preparation & Serving | 5 (25.0%) | 15 (75.0%) |
| Cleaning & Maintenance | 17 (68.0%) | 8 (32.0%) |
| Personal Care & Service | 0 (0.0%) | 32 (100.0%) |
| Total (Category) | 38 (35.8%) | 68 (64.1%) |
| Total (Overall) | 287 (44.2%) | 363 (55.8%) |
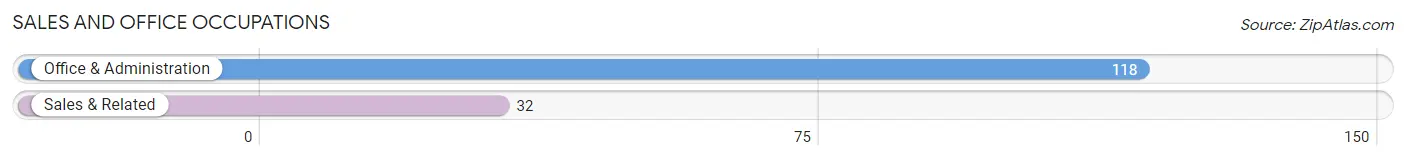
Sales and Office Occupations
The most common Sales and Office occupations in Reese are Office & Administration (118 | 18.1%), and Sales & Related (32 | 4.9%).
Sales and Office Occupations by Sex
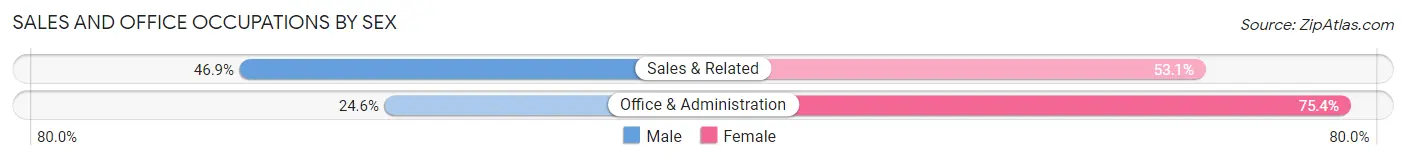
| Occupation | Male | Female |
| Sales & Related | 15 (46.9%) | 17 (53.1%) |
| Office & Administration | 29 (24.6%) | 89 (75.4%) |
| Total (Category) | 44 (29.3%) | 106 (70.7%) |
| Total (Overall) | 287 (44.2%) | 363 (55.8%) |
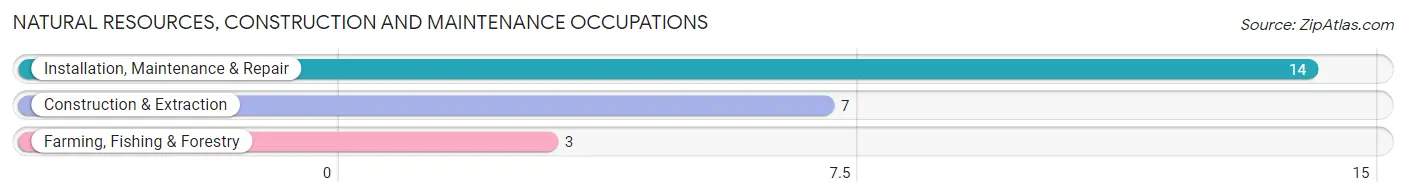
Natural Resources, Construction and Maintenance Occupations
The most common Natural Resources, Construction and Maintenance occupations in Reese are Installation, Maintenance & Repair (14 | 2.1%), Construction & Extraction (7 | 1.1%), and Farming, Fishing & Forestry (3 | 0.5%).
Natural Resources, Construction and Maintenance Occupations by Sex
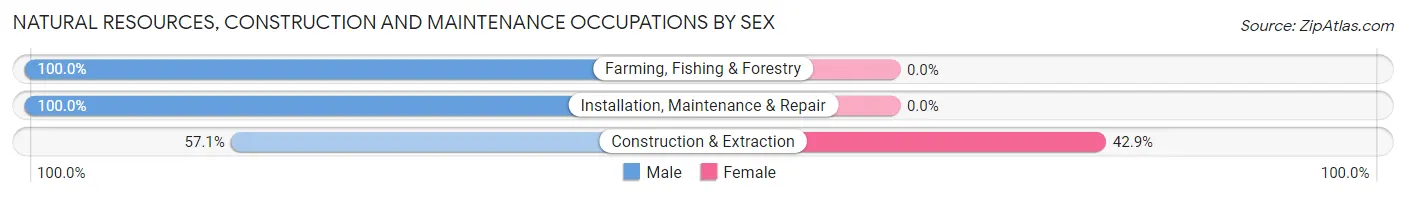
| Occupation | Male | Female |
| Farming, Fishing & Forestry | 3 (100.0%) | 0 (0.0%) |
| Construction & Extraction | 4 (57.1%) | 3 (42.9%) |
| Installation, Maintenance & Repair | 14 (100.0%) | 0 (0.0%) |
| Total (Category) | 21 (87.5%) | 3 (12.5%) |
| Total (Overall) | 287 (44.2%) | 363 (55.8%) |
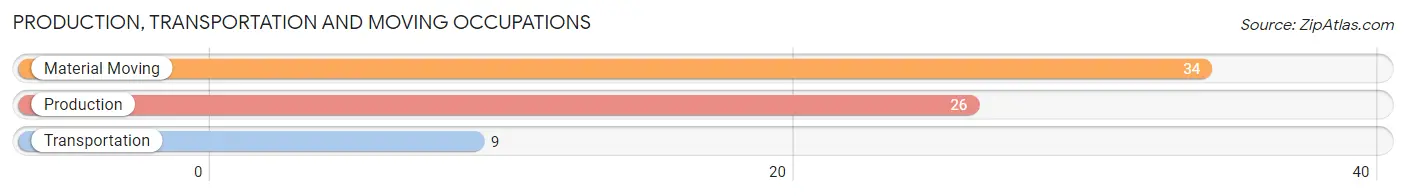
Production, Transportation and Moving Occupations
The most common Production, Transportation and Moving occupations in Reese are Material Moving (34 | 5.2%), Production (26 | 4.0%), and Transportation (9 | 1.4%).
Production, Transportation and Moving Occupations by Sex
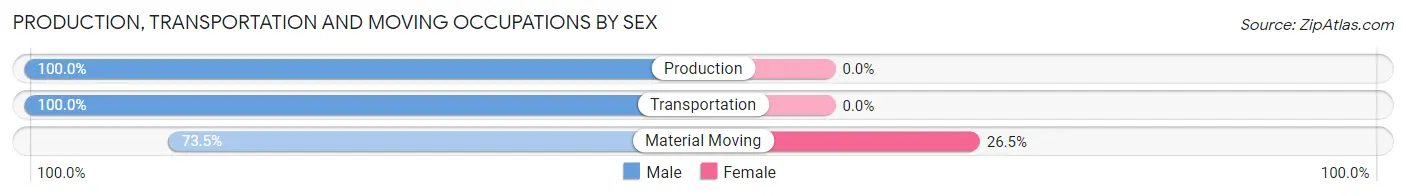
| Occupation | Male | Female |
| Production | 26 (100.0%) | 0 (0.0%) |
| Transportation | 9 (100.0%) | 0 (0.0%) |
| Material Moving | 25 (73.5%) | 9 (26.5%) |
| Total (Category) | 60 (87.0%) | 9 (13.0%) |
| Total (Overall) | 287 (44.2%) | 363 (55.8%) |
Employment Industries by Sex in Reese
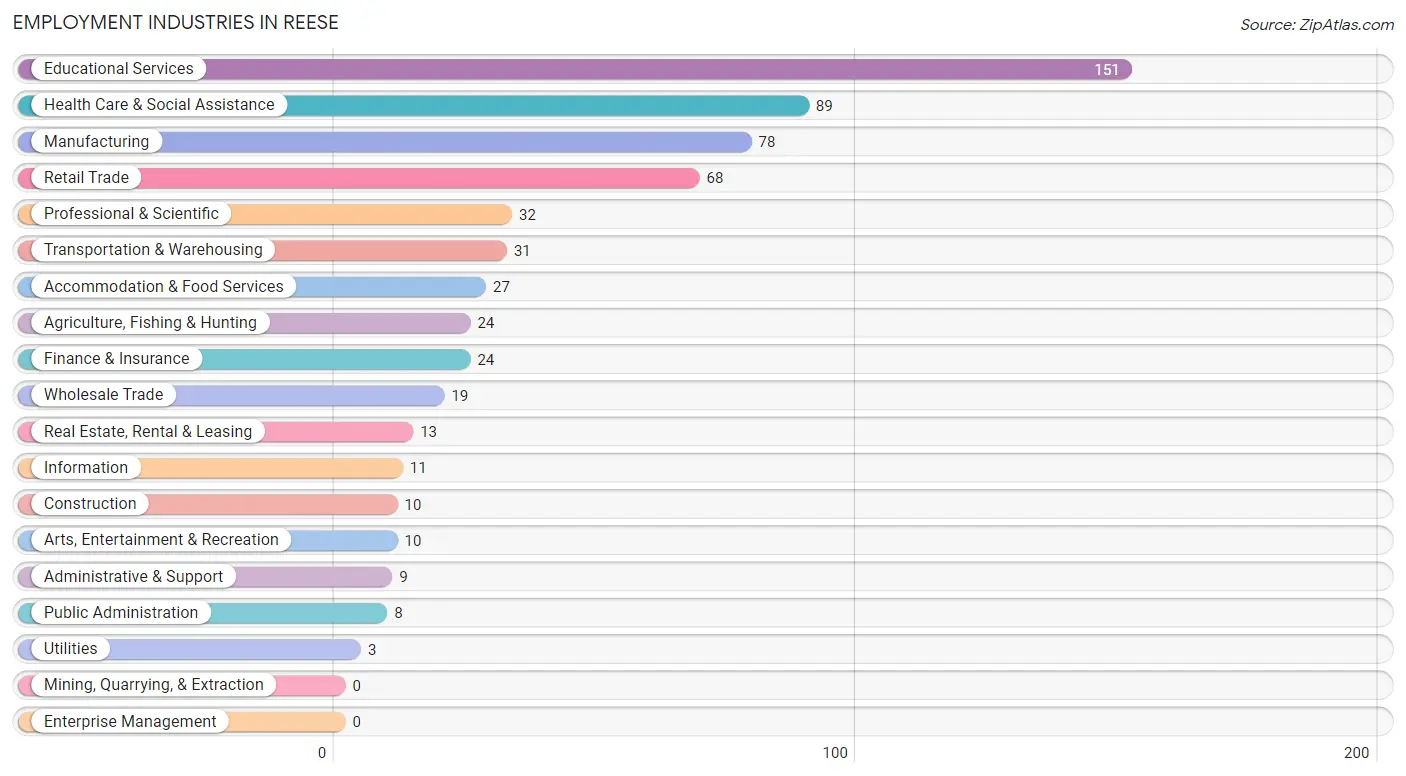
Employment Industries in Reese
The major employment industries in Reese include Educational Services (151 | 23.2%), Health Care & Social Assistance (89 | 13.7%), Manufacturing (78 | 12.0%), Retail Trade (68 | 10.5%), and Professional & Scientific (32 | 4.9%).
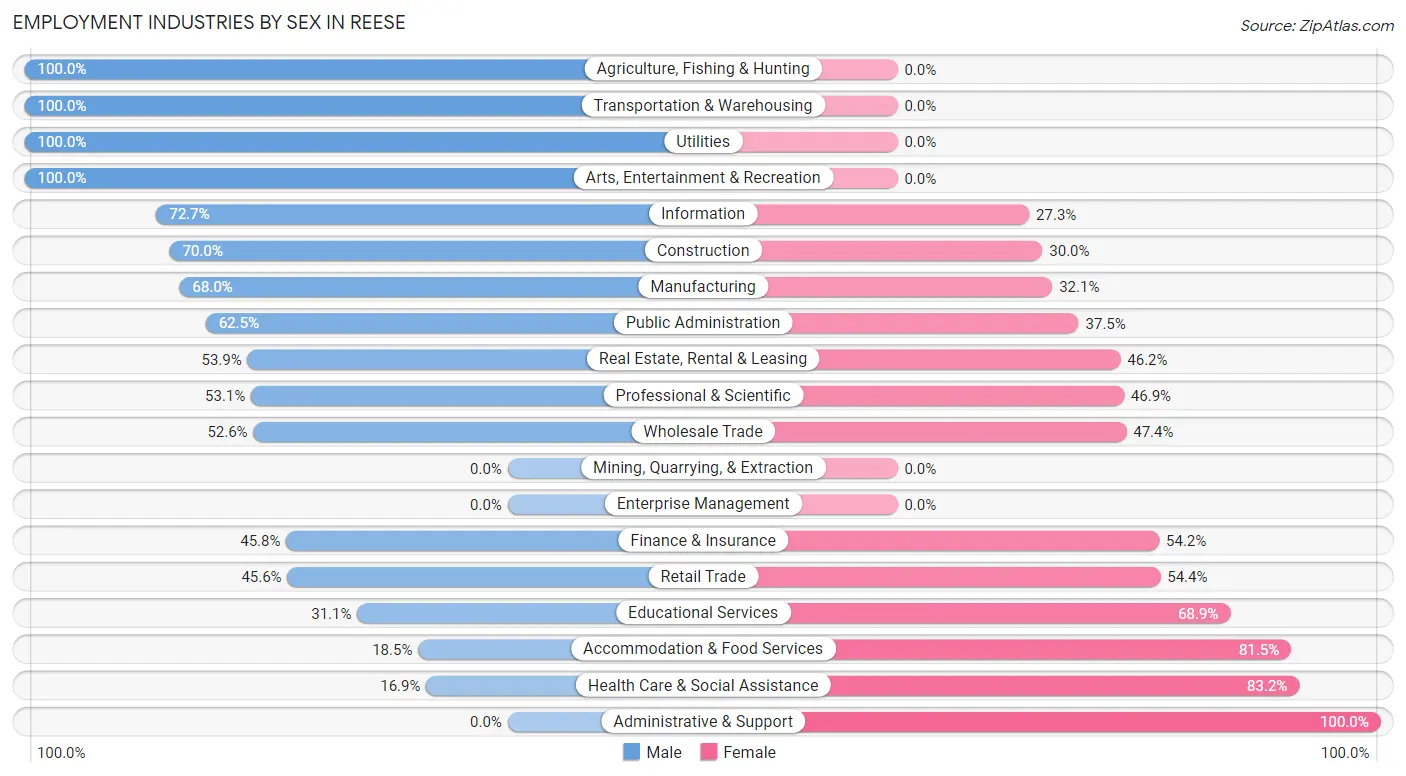
Employment Industries by Sex in Reese
The Reese industries that see more men than women are Agriculture, Fishing & Hunting (100.0%), Transportation & Warehousing (100.0%), and Utilities (100.0%), whereas the industries that tend to have a higher number of women are Administrative & Support (100.0%), Health Care & Social Assistance (83.2%), and Accommodation & Food Services (81.5%).
| Industry | Male | Female |
| Agriculture, Fishing & Hunting | 24 (100.0%) | 0 (0.0%) |
| Mining, Quarrying, & Extraction | 0 (0.0%) | 0 (0.0%) |
| Construction | 7 (70.0%) | 3 (30.0%) |
| Manufacturing | 53 (67.9%) | 25 (32.1%) |
| Wholesale Trade | 10 (52.6%) | 9 (47.4%) |
| Retail Trade | 31 (45.6%) | 37 (54.4%) |
| Transportation & Warehousing | 31 (100.0%) | 0 (0.0%) |
| Utilities | 3 (100.0%) | 0 (0.0%) |
| Information | 8 (72.7%) | 3 (27.3%) |
| Finance & Insurance | 11 (45.8%) | 13 (54.2%) |
| Real Estate, Rental & Leasing | 7 (53.8%) | 6 (46.2%) |
| Professional & Scientific | 17 (53.1%) | 15 (46.9%) |
| Enterprise Management | 0 (0.0%) | 0 (0.0%) |
| Administrative & Support | 0 (0.0%) | 9 (100.0%) |
| Educational Services | 47 (31.1%) | 104 (68.9%) |
| Health Care & Social Assistance | 15 (16.9%) | 74 (83.2%) |
| Arts, Entertainment & Recreation | 10 (100.0%) | 0 (0.0%) |
| Accommodation & Food Services | 5 (18.5%) | 22 (81.5%) |
| Public Administration | 5 (62.5%) | 3 (37.5%) |
| Total | 287 (44.2%) | 363 (55.8%) |
Education in Reese
School Enrollment in Reese
The most common levels of schooling among the 223 students in Reese are middle school (86 | 38.6%), high school (41 | 18.4%), and college / undergraduate (35 | 15.7%).
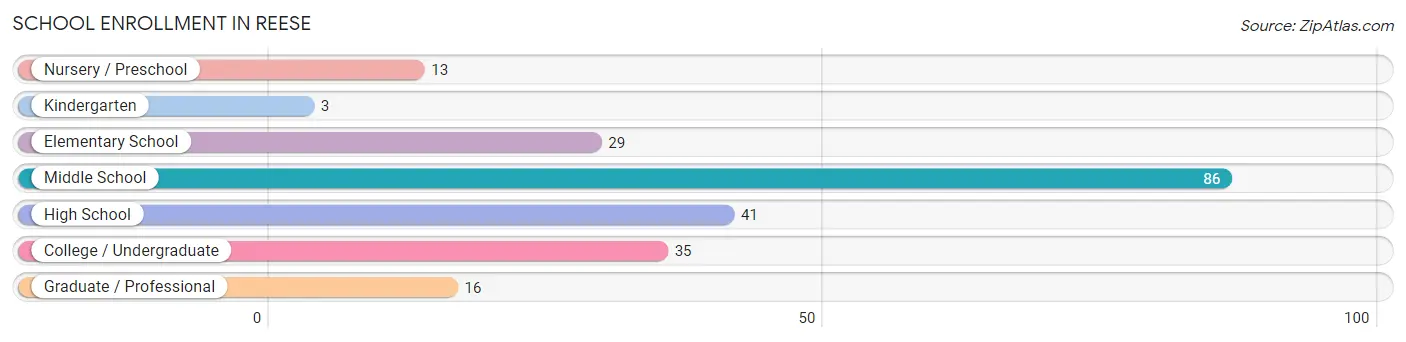
| School Level | # Students | % Students |
| Nursery / Preschool | 13 | 5.8% |
| Kindergarten | 3 | 1.3% |
| Elementary School | 29 | 13.0% |
| Middle School | 86 | 38.6% |
| High School | 41 | 18.4% |
| College / Undergraduate | 35 | 15.7% |
| Graduate / Professional | 16 | 7.2% |
| Total | 223 | 100.0% |
School Enrollment by Age by Funding Source in Reese
Out of a total of 223 students who are enrolled in schools in Reese, 72 (32.3%) attend a private institution, while the remaining 151 (67.7%) are enrolled in public schools. The age group of 3 to 4 year olds has the highest likelihood of being enrolled in private schools, with 3 (100.0% in the age bracket) enrolled. Conversely, the age group of 15 to 17 year olds has the lowest likelihood of being enrolled in a private school, with 29 (100.0% in the age bracket) attending a public institution.
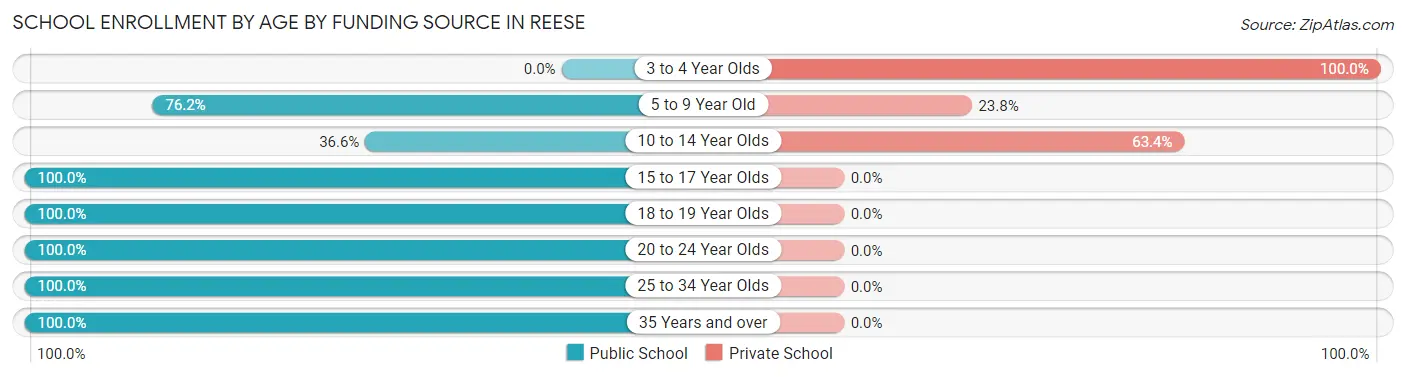
| Age Bracket | Public School | Private School |
| 3 to 4 Year Olds | 0 (0.0%) | 3 (100.0%) |
| 5 to 9 Year Old | 32 (76.2%) | 10 (23.8%) |
| 10 to 14 Year Olds | 34 (36.6%) | 59 (63.4%) |
| 15 to 17 Year Olds | 29 (100.0%) | 0 (0.0%) |
| 18 to 19 Year Olds | 5 (100.0%) | 0 (0.0%) |
| 20 to 24 Year Olds | 16 (100.0%) | 0 (0.0%) |
| 25 to 34 Year Olds | 30 (100.0%) | 0 (0.0%) |
| 35 Years and over | 5 (100.0%) | 0 (0.0%) |
| Total | 151 (67.7%) | 72 (32.3%) |
Educational Attainment by Field of Study in Reese
Education (67 | 27.7%), science & technology (63 | 26.0%), business (61 | 25.2%), computers & mathematics (14 | 5.8%), and arts & humanities (11 | 4.5%) are the most common fields of study among 242 individuals in Reese who have obtained a bachelor's degree or higher.
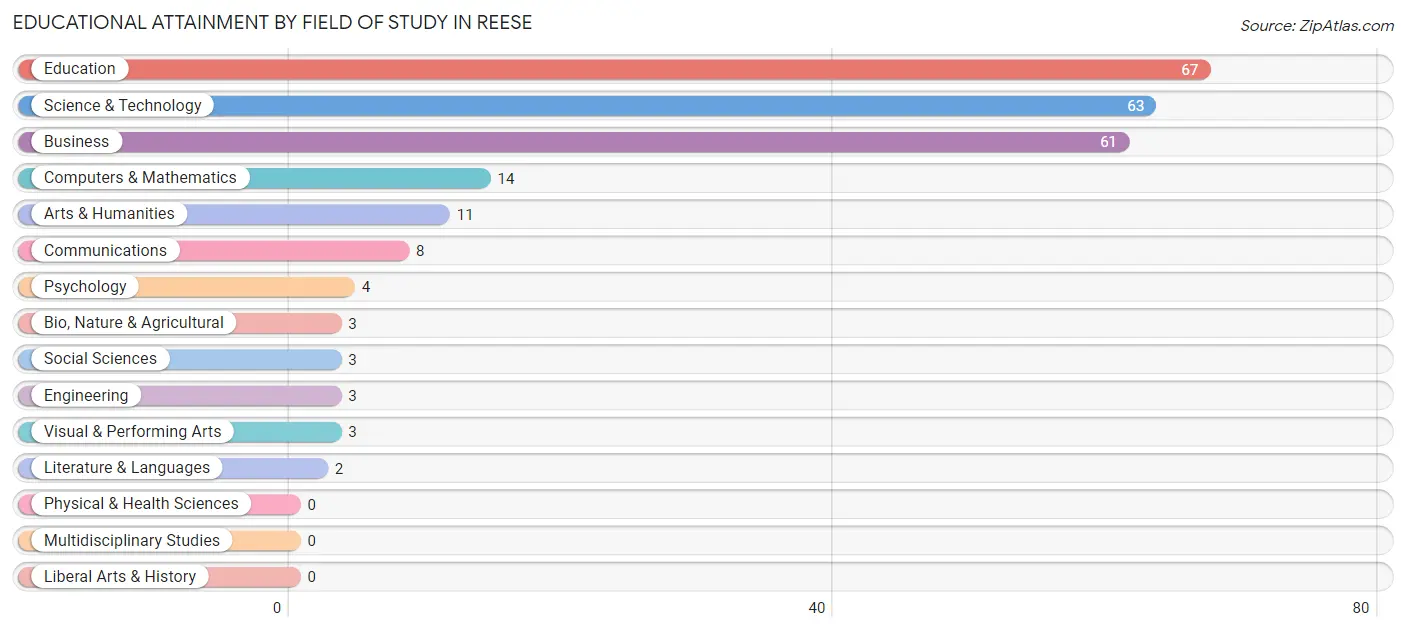
| Field of Study | # Graduates | % Graduates |
| Computers & Mathematics | 14 | 5.8% |
| Bio, Nature & Agricultural | 3 | 1.2% |
| Physical & Health Sciences | 0 | 0.0% |
| Psychology | 4 | 1.7% |
| Social Sciences | 3 | 1.2% |
| Engineering | 3 | 1.2% |
| Multidisciplinary Studies | 0 | 0.0% |
| Science & Technology | 63 | 26.0% |
| Business | 61 | 25.2% |
| Education | 67 | 27.7% |
| Literature & Languages | 2 | 0.8% |
| Liberal Arts & History | 0 | 0.0% |
| Visual & Performing Arts | 3 | 1.2% |
| Communications | 8 | 3.3% |
| Arts & Humanities | 11 | 4.5% |
| Total | 242 | 100.0% |
Transportation & Commute in Reese
Vehicle Availability by Sex in Reese
The most prevalent vehicle ownership categories in Reese are males with 2 vehicles (176, accounting for 63.1%) and females with 2 vehicles (196, making up 49.0%).
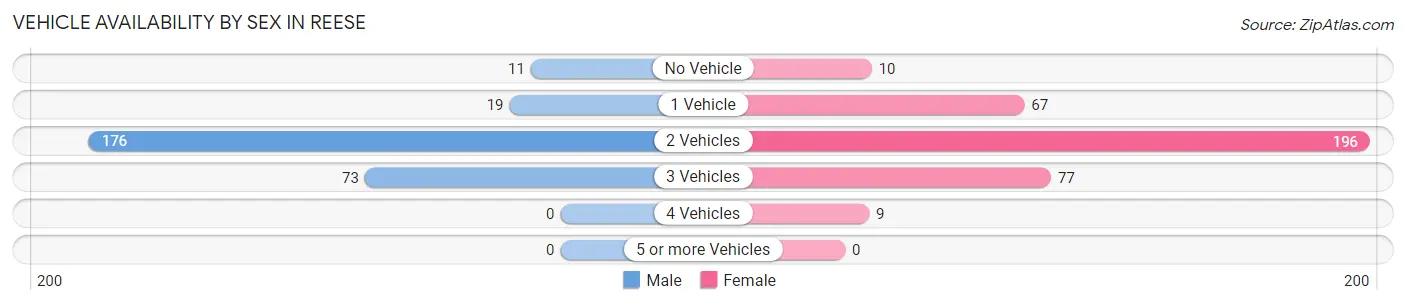
| Vehicles Available | Male | Female |
| No Vehicle | 11 (3.9%) | 10 (2.8%) |
| 1 Vehicle | 19 (6.8%) | 67 (18.7%) |
| 2 Vehicles | 176 (63.1%) | 196 (54.6%) |
| 3 Vehicles | 73 (26.2%) | 77 (21.4%) |
| 4 Vehicles | 0 (0.0%) | 9 (2.5%) |
| 5 or more Vehicles | 0 (0.0%) | 0 (0.0%) |
| Total | 279 (100.0%) | 359 (100.0%) |
Commute Time in Reese
The most frequently occuring commute durations in Reese are 25 to 29 minutes (133 commuters, 21.8%), 20 to 24 minutes (98 commuters, 16.1%), and 5 to 9 minutes (96 commuters, 15.7%).
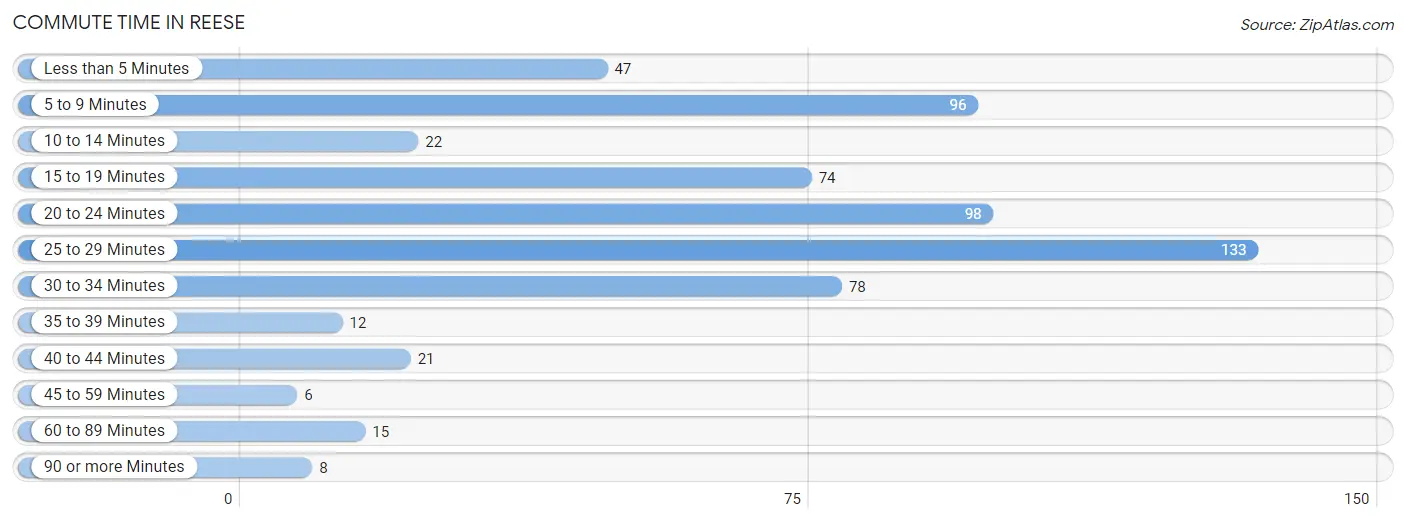
| Commute Time | # Commuters | % Commuters |
| Less than 5 Minutes | 47 | 7.7% |
| 5 to 9 Minutes | 96 | 15.7% |
| 10 to 14 Minutes | 22 | 3.6% |
| 15 to 19 Minutes | 74 | 12.1% |
| 20 to 24 Minutes | 98 | 16.1% |
| 25 to 29 Minutes | 133 | 21.8% |
| 30 to 34 Minutes | 78 | 12.8% |
| 35 to 39 Minutes | 12 | 2.0% |
| 40 to 44 Minutes | 21 | 3.4% |
| 45 to 59 Minutes | 6 | 1.0% |
| 60 to 89 Minutes | 15 | 2.5% |
| 90 or more Minutes | 8 | 1.3% |
Commute Time by Sex in Reese
The most common commute times in Reese are 15 to 19 minutes (51 commuters, 18.8%) for males and 25 to 29 minutes (94 commuters, 27.8%) for females.
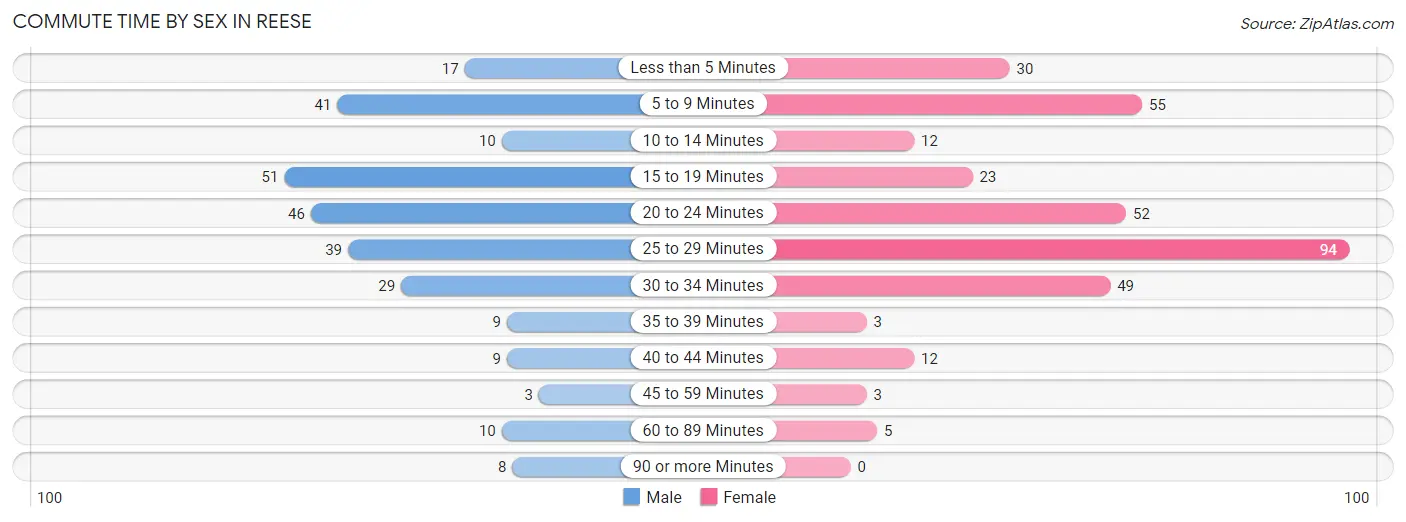
| Commute Time | Male | Female |
| Less than 5 Minutes | 17 (6.2%) | 30 (8.9%) |
| 5 to 9 Minutes | 41 (15.1%) | 55 (16.3%) |
| 10 to 14 Minutes | 10 (3.7%) | 12 (3.5%) |
| 15 to 19 Minutes | 51 (18.8%) | 23 (6.8%) |
| 20 to 24 Minutes | 46 (16.9%) | 52 (15.4%) |
| 25 to 29 Minutes | 39 (14.3%) | 94 (27.8%) |
| 30 to 34 Minutes | 29 (10.7%) | 49 (14.5%) |
| 35 to 39 Minutes | 9 (3.3%) | 3 (0.9%) |
| 40 to 44 Minutes | 9 (3.3%) | 12 (3.5%) |
| 45 to 59 Minutes | 3 (1.1%) | 3 (0.9%) |
| 60 to 89 Minutes | 10 (3.7%) | 5 (1.5%) |
| 90 or more Minutes | 8 (2.9%) | 0 (0.0%) |
Time of Departure to Work by Sex in Reese
The most frequent times of departure to work in Reese are 7:30 AM to 7:59 AM (57, 21.0%) for males and 6:00 AM to 6:29 AM (70, 20.7%) for females.
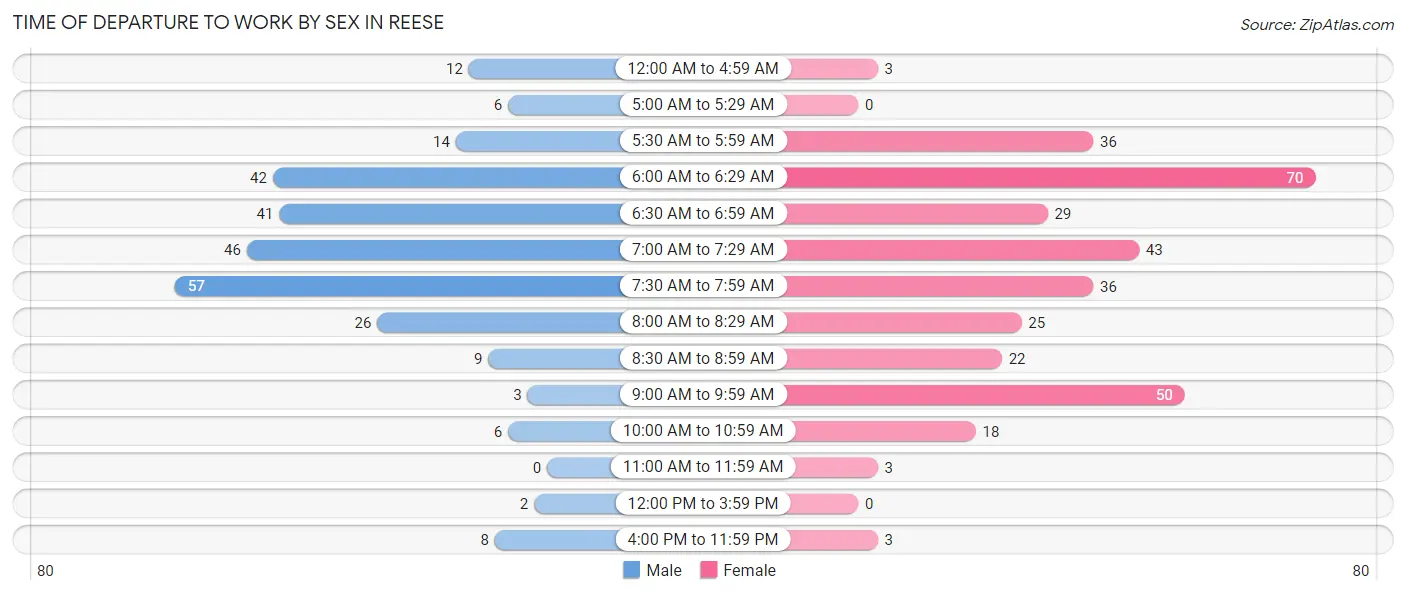
| Time of Departure | Male | Female |
| 12:00 AM to 4:59 AM | 12 (4.4%) | 3 (0.9%) |
| 5:00 AM to 5:29 AM | 6 (2.2%) | 0 (0.0%) |
| 5:30 AM to 5:59 AM | 14 (5.1%) | 36 (10.6%) |
| 6:00 AM to 6:29 AM | 42 (15.4%) | 70 (20.7%) |
| 6:30 AM to 6:59 AM | 41 (15.1%) | 29 (8.6%) |
| 7:00 AM to 7:29 AM | 46 (16.9%) | 43 (12.7%) |
| 7:30 AM to 7:59 AM | 57 (21.0%) | 36 (10.6%) |
| 8:00 AM to 8:29 AM | 26 (9.6%) | 25 (7.4%) |
| 8:30 AM to 8:59 AM | 9 (3.3%) | 22 (6.5%) |
| 9:00 AM to 9:59 AM | 3 (1.1%) | 50 (14.8%) |
| 10:00 AM to 10:59 AM | 6 (2.2%) | 18 (5.3%) |
| 11:00 AM to 11:59 AM | 0 (0.0%) | 3 (0.9%) |
| 12:00 PM to 3:59 PM | 2 (0.7%) | 0 (0.0%) |
| 4:00 PM to 11:59 PM | 8 (2.9%) | 3 (0.9%) |
| Total | 272 (100.0%) | 338 (100.0%) |
Housing Occupancy in Reese
Occupancy by Ownership in Reese
Of the total 571 dwellings in Reese, owner-occupied units account for 450 (78.8%), while renter-occupied units make up 121 (21.2%).
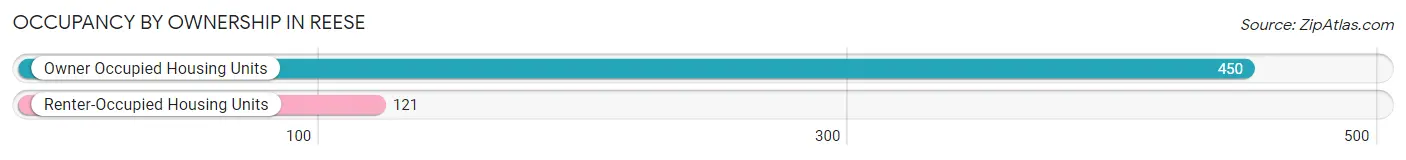
| Occupancy | # Housing Units | % Housing Units |
| Owner Occupied Housing Units | 450 | 78.8% |
| Renter-Occupied Housing Units | 121 | 21.2% |
| Total Occupied Housing Units | 571 | 100.0% |
Occupancy by Household Size in Reese
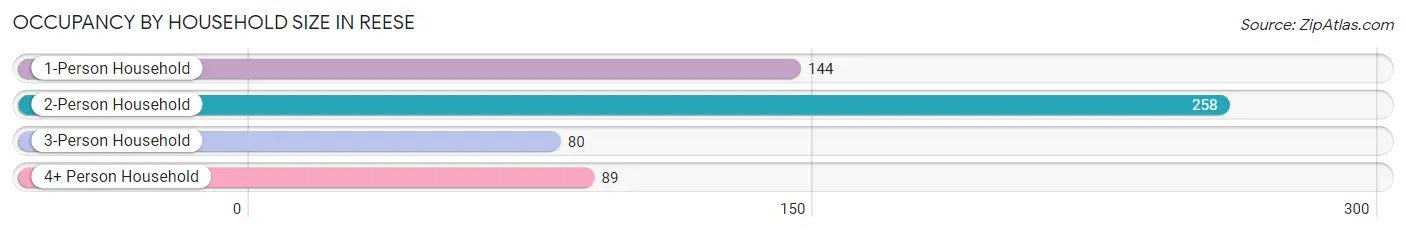
| Household Size | # Housing Units | % Housing Units |
| 1-Person Household | 144 | 25.2% |
| 2-Person Household | 258 | 45.2% |
| 3-Person Household | 80 | 14.0% |
| 4+ Person Household | 89 | 15.6% |
| Total Housing Units | 571 | 100.0% |
Occupancy by Ownership by Household Size in Reese
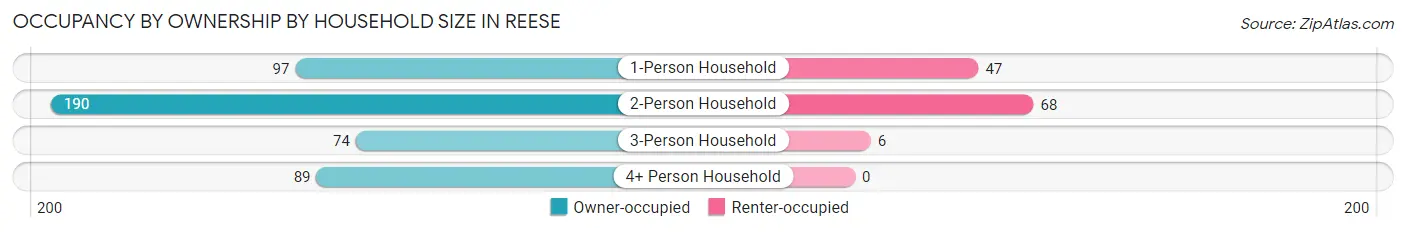
| Household Size | Owner-occupied | Renter-occupied |
| 1-Person Household | 97 (67.4%) | 47 (32.6%) |
| 2-Person Household | 190 (73.6%) | 68 (26.4%) |
| 3-Person Household | 74 (92.5%) | 6 (7.5%) |
| 4+ Person Household | 89 (100.0%) | 0 (0.0%) |
| Total Housing Units | 450 (78.8%) | 121 (21.2%) |
Occupancy by Educational Attainment in Reese
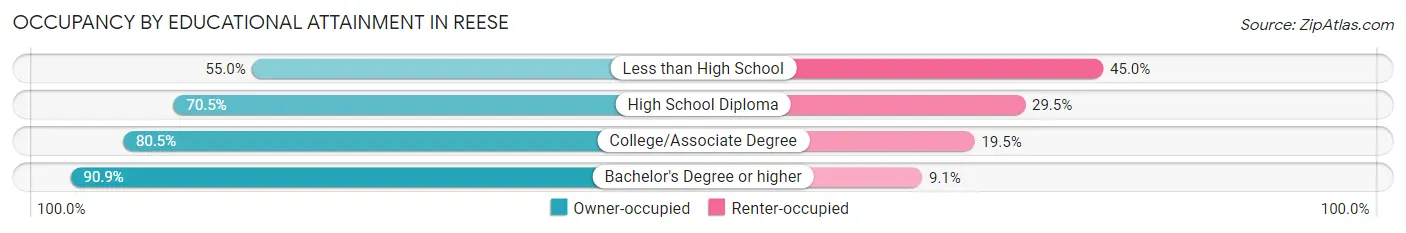
| Household Size | Owner-occupied | Renter-occupied |
| Less than High School | 11 (55.0%) | 9 (45.0%) |
| High School Diploma | 129 (70.5%) | 54 (29.5%) |
| College/Associate Degree | 190 (80.5%) | 46 (19.5%) |
| Bachelor's Degree or higher | 120 (90.9%) | 12 (9.1%) |
Occupancy by Age of Householder in Reese
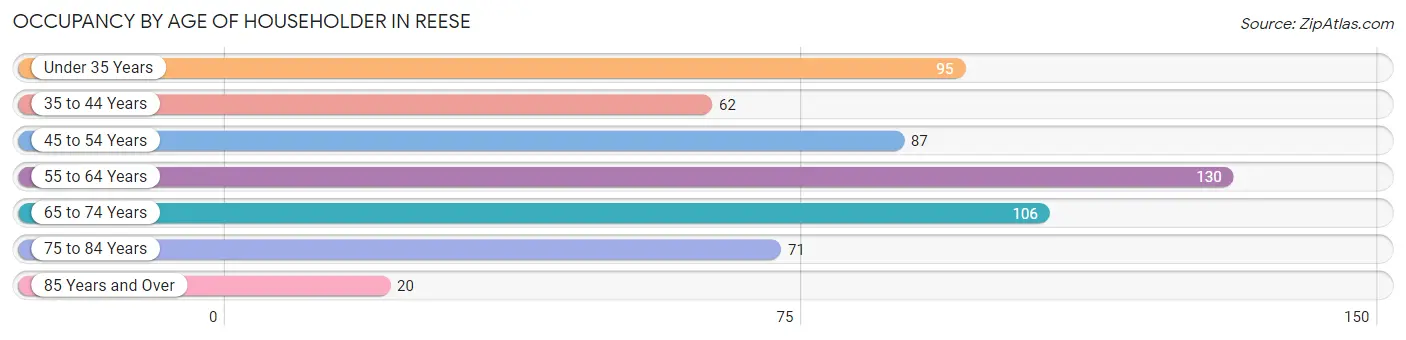
| Age Bracket | # Households | % Households |
| Under 35 Years | 95 | 16.6% |
| 35 to 44 Years | 62 | 10.9% |
| 45 to 54 Years | 87 | 15.2% |
| 55 to 64 Years | 130 | 22.8% |
| 65 to 74 Years | 106 | 18.6% |
| 75 to 84 Years | 71 | 12.4% |
| 85 Years and Over | 20 | 3.5% |
| Total | 571 | 100.0% |
Housing Finances in Reese
Median Income by Occupancy in Reese
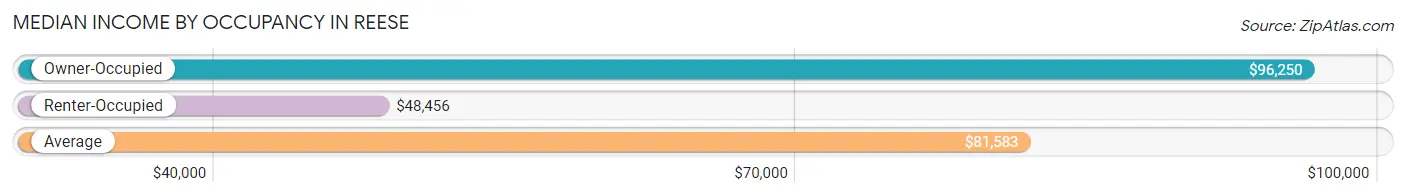
| Occupancy Type | # Households | Median Income |
| Owner-Occupied | 450 (78.8%) | $96,250 |
| Renter-Occupied | 121 (21.2%) | $48,456 |
| Average | 571 (100.0%) | $81,583 |
Occupancy by Householder Income Bracket in Reese
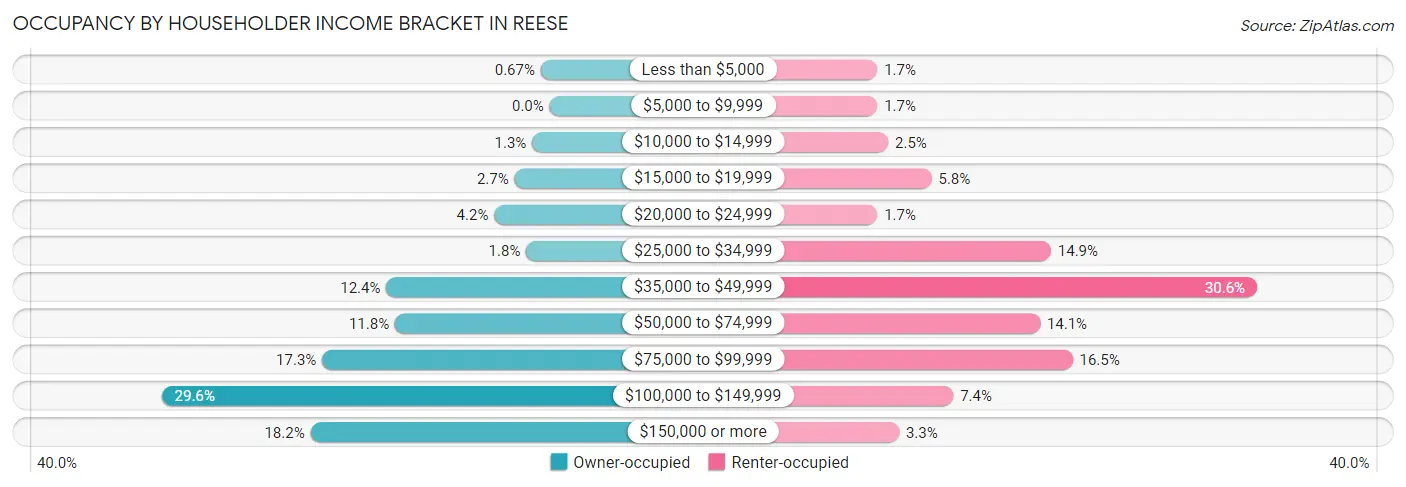
| Income Bracket | Owner-occupied | Renter-occupied |
| Less than $5,000 | 3 (0.7%) | 2 (1.7%) |
| $5,000 to $9,999 | 0 (0.0%) | 2 (1.7%) |
| $10,000 to $14,999 | 6 (1.3%) | 3 (2.5%) |
| $15,000 to $19,999 | 12 (2.7%) | 7 (5.8%) |
| $20,000 to $24,999 | 19 (4.2%) | 2 (1.7%) |
| $25,000 to $34,999 | 8 (1.8%) | 18 (14.9%) |
| $35,000 to $49,999 | 56 (12.4%) | 37 (30.6%) |
| $50,000 to $74,999 | 53 (11.8%) | 17 (14.1%) |
| $75,000 to $99,999 | 78 (17.3%) | 20 (16.5%) |
| $100,000 to $149,999 | 133 (29.6%) | 9 (7.4%) |
| $150,000 or more | 82 (18.2%) | 4 (3.3%) |
| Total | 450 (100.0%) | 121 (100.0%) |
Monthly Housing Cost Tiers in Reese
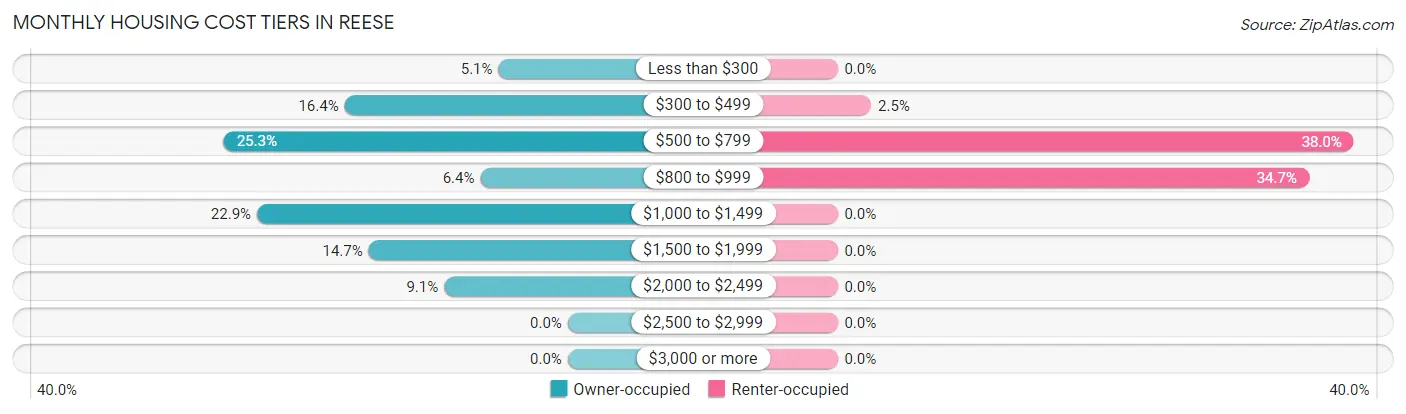
| Monthly Cost | Owner-occupied | Renter-occupied |
| Less than $300 | 23 (5.1%) | 0 (0.0%) |
| $300 to $499 | 74 (16.4%) | 3 (2.5%) |
| $500 to $799 | 114 (25.3%) | 46 (38.0%) |
| $800 to $999 | 29 (6.4%) | 42 (34.7%) |
| $1,000 to $1,499 | 103 (22.9%) | 0 (0.0%) |
| $1,500 to $1,999 | 66 (14.7%) | 0 (0.0%) |
| $2,000 to $2,499 | 41 (9.1%) | 0 (0.0%) |
| $2,500 to $2,999 | 0 (0.0%) | 0 (0.0%) |
| $3,000 or more | 0 (0.0%) | 0 (0.0%) |
| Total | 450 (100.0%) | 121 (100.0%) |
Physical Housing Characteristics in Reese
Housing Structures in Reese
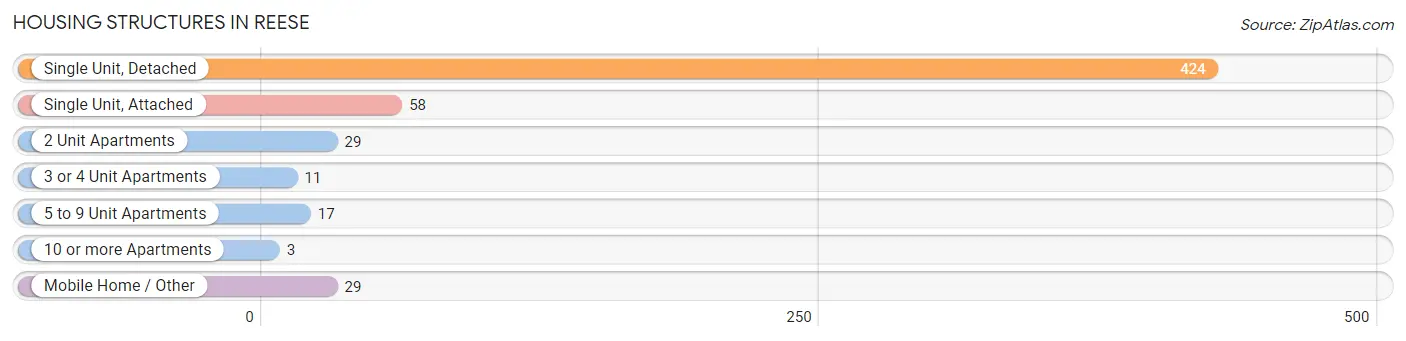
| Structure Type | # Housing Units | % Housing Units |
| Single Unit, Detached | 424 | 74.3% |
| Single Unit, Attached | 58 | 10.2% |
| 2 Unit Apartments | 29 | 5.1% |
| 3 or 4 Unit Apartments | 11 | 1.9% |
| 5 to 9 Unit Apartments | 17 | 3.0% |
| 10 or more Apartments | 3 | 0.5% |
| Mobile Home / Other | 29 | 5.1% |
| Total | 571 | 100.0% |
Housing Structures by Occupancy in Reese
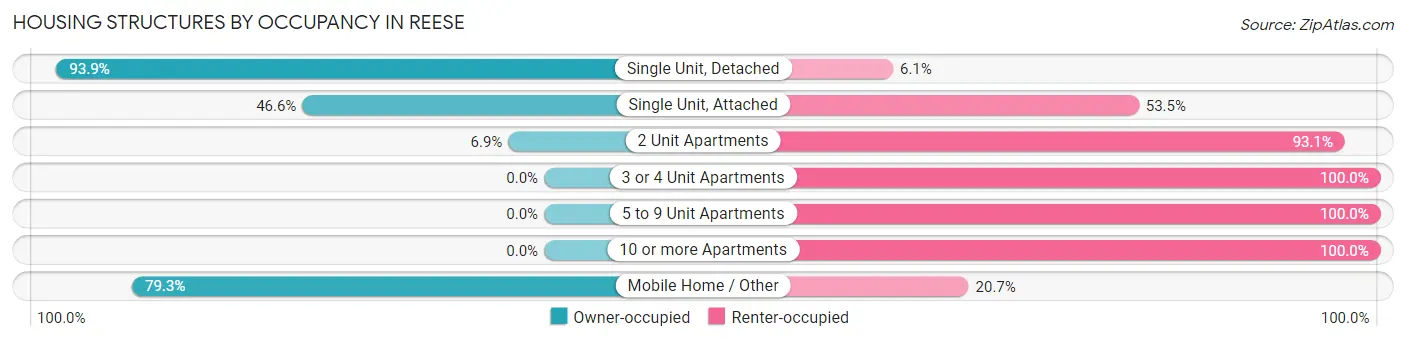
| Structure Type | Owner-occupied | Renter-occupied |
| Single Unit, Detached | 398 (93.9%) | 26 (6.1%) |
| Single Unit, Attached | 27 (46.6%) | 31 (53.4%) |
| 2 Unit Apartments | 2 (6.9%) | 27 (93.1%) |
| 3 or 4 Unit Apartments | 0 (0.0%) | 11 (100.0%) |
| 5 to 9 Unit Apartments | 0 (0.0%) | 17 (100.0%) |
| 10 or more Apartments | 0 (0.0%) | 3 (100.0%) |
| Mobile Home / Other | 23 (79.3%) | 6 (20.7%) |
| Total | 450 (78.8%) | 121 (21.2%) |
Housing Structures by Number of Rooms in Reese
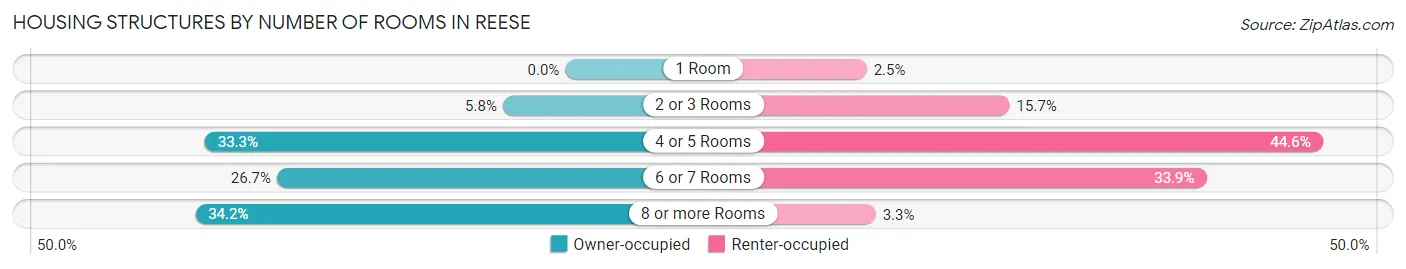
| Number of Rooms | Owner-occupied | Renter-occupied |
| 1 Room | 0 (0.0%) | 3 (2.5%) |
| 2 or 3 Rooms | 26 (5.8%) | 19 (15.7%) |
| 4 or 5 Rooms | 150 (33.3%) | 54 (44.6%) |
| 6 or 7 Rooms | 120 (26.7%) | 41 (33.9%) |
| 8 or more Rooms | 154 (34.2%) | 4 (3.3%) |
| Total | 450 (100.0%) | 121 (100.0%) |
Housing Structure by Heating Type in Reese
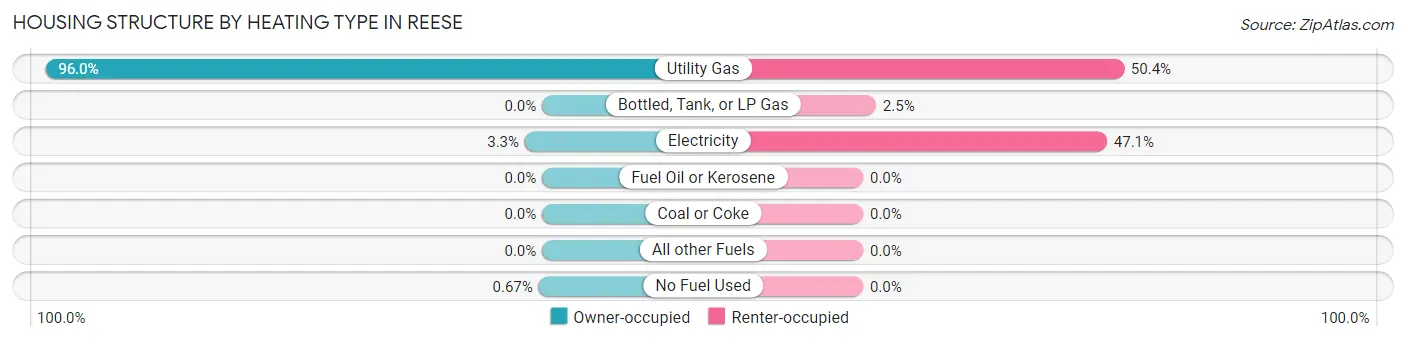
| Heating Type | Owner-occupied | Renter-occupied |
| Utility Gas | 432 (96.0%) | 61 (50.4%) |
| Bottled, Tank, or LP Gas | 0 (0.0%) | 3 (2.5%) |
| Electricity | 15 (3.3%) | 57 (47.1%) |
| Fuel Oil or Kerosene | 0 (0.0%) | 0 (0.0%) |
| Coal or Coke | 0 (0.0%) | 0 (0.0%) |
| All other Fuels | 0 (0.0%) | 0 (0.0%) |
| No Fuel Used | 3 (0.7%) | 0 (0.0%) |
| Total | 450 (100.0%) | 121 (100.0%) |
Household Vehicle Usage in Reese
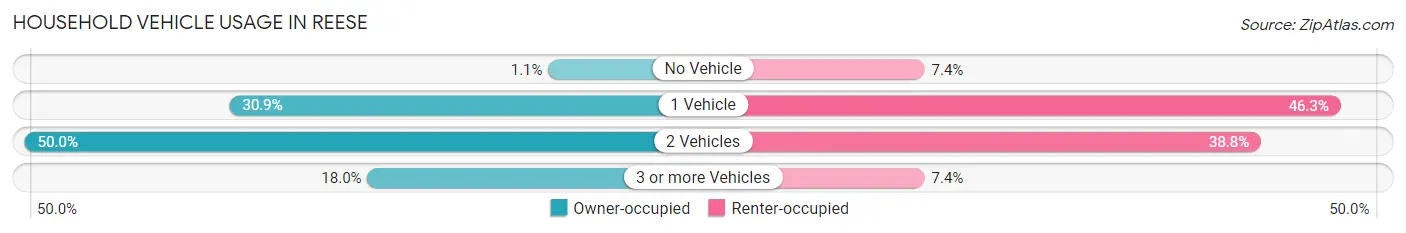
| Vehicles per Household | Owner-occupied | Renter-occupied |
| No Vehicle | 5 (1.1%) | 9 (7.4%) |
| 1 Vehicle | 139 (30.9%) | 56 (46.3%) |
| 2 Vehicles | 225 (50.0%) | 47 (38.8%) |
| 3 or more Vehicles | 81 (18.0%) | 9 (7.4%) |
| Total | 450 (100.0%) | 121 (100.0%) |
Real Estate & Mortgages in Reese
Real Estate and Mortgage Overview in Reese
| Characteristic | Without Mortgage | With Mortgage |
| Housing Units | 198 | 252 |
| Median Property Value | $150,900 | $196,400 |
| Median Household Income | $68,750 | $72 |
| Monthly Housing Costs | $505 | $0 |
| Real Estate Taxes | $2,222 | $5 |
Property Value by Mortgage Status in Reese
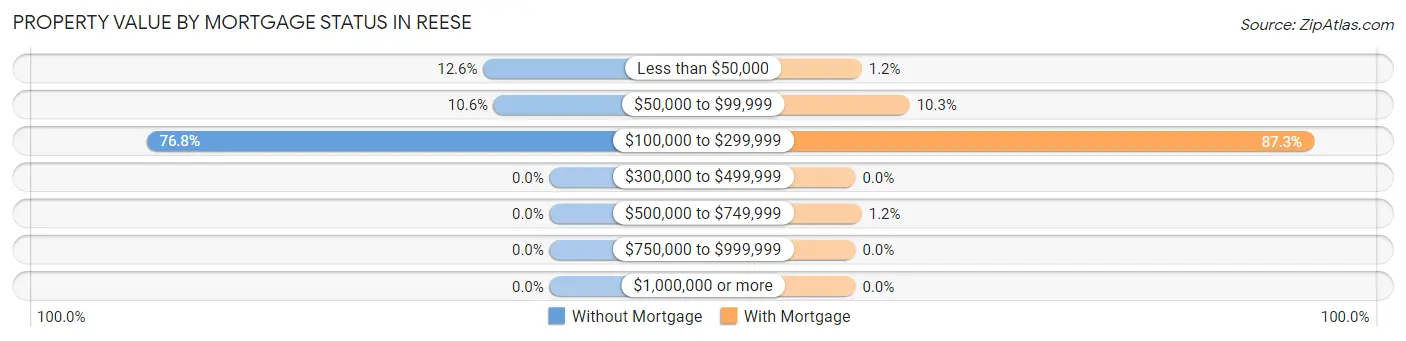
| Property Value | Without Mortgage | With Mortgage |
| Less than $50,000 | 25 (12.6%) | 3 (1.2%) |
| $50,000 to $99,999 | 21 (10.6%) | 26 (10.3%) |
| $100,000 to $299,999 | 152 (76.8%) | 220 (87.3%) |
| $300,000 to $499,999 | 0 (0.0%) | 0 (0.0%) |
| $500,000 to $749,999 | 0 (0.0%) | 3 (1.2%) |
| $750,000 to $999,999 | 0 (0.0%) | 0 (0.0%) |
| $1,000,000 or more | 0 (0.0%) | 0 (0.0%) |
| Total | 198 (100.0%) | 252 (100.0%) |
Household Income by Mortgage Status in Reese
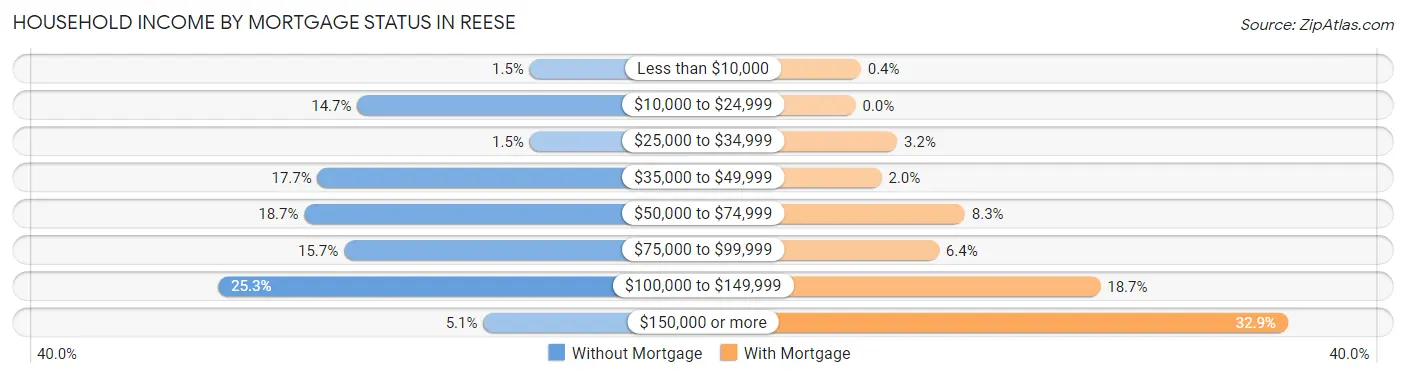
| Household Income | Without Mortgage | With Mortgage |
| Less than $10,000 | 3 (1.5%) | 1 (0.4%) |
| $10,000 to $24,999 | 29 (14.6%) | 0 (0.0%) |
| $25,000 to $34,999 | 3 (1.5%) | 8 (3.2%) |
| $35,000 to $49,999 | 35 (17.7%) | 5 (2.0%) |
| $50,000 to $74,999 | 37 (18.7%) | 21 (8.3%) |
| $75,000 to $99,999 | 31 (15.7%) | 16 (6.4%) |
| $100,000 to $149,999 | 50 (25.3%) | 47 (18.6%) |
| $150,000 or more | 10 (5.1%) | 83 (32.9%) |
| Total | 198 (100.0%) | 252 (100.0%) |
Property Value to Household Income Ratio in Reese
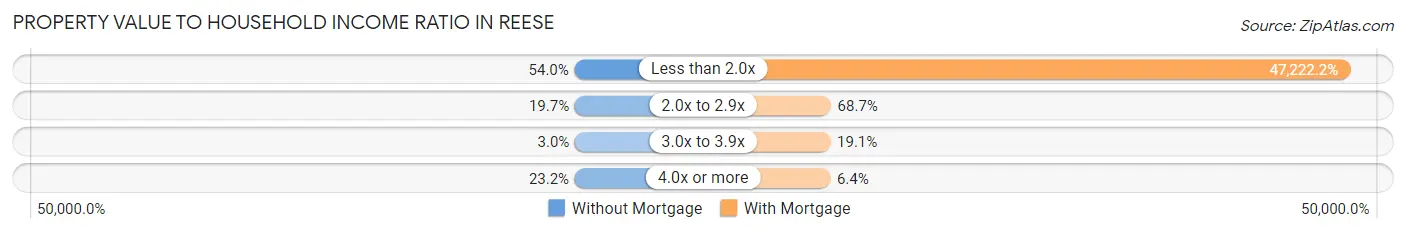
| Value-to-Income Ratio | Without Mortgage | With Mortgage |
| Less than 2.0x | 107 (54.0%) | 119,000 (47,222.2%) |
| 2.0x to 2.9x | 39 (19.7%) | 173 (68.6%) |
| 3.0x to 3.9x | 6 (3.0%) | 48 (19.1%) |
| 4.0x or more | 46 (23.2%) | 16 (6.4%) |
| Total | 198 (100.0%) | 252 (100.0%) |
Real Estate Taxes by Mortgage Status in Reese
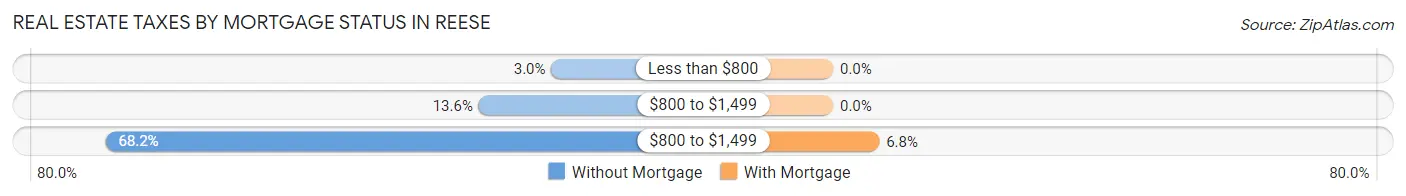
| Property Taxes | Without Mortgage | With Mortgage |
| Less than $800 | 6 (3.0%) | 0 (0.0%) |
| $800 to $1,499 | 27 (13.6%) | 0 (0.0%) |
| $800 to $1,499 | 135 (68.2%) | 17 (6.8%) |
| Total | 198 (100.0%) | 252 (100.0%) |
Health & Disability in Reese
Health Insurance Coverage by Age in Reese
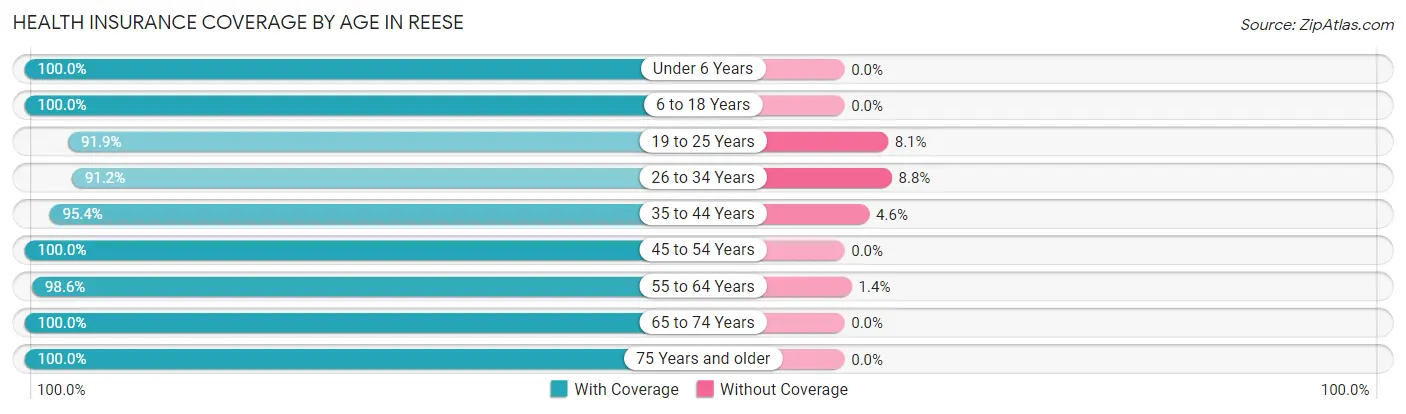
| Age Bracket | With Coverage | Without Coverage |
| Under 6 Years | 54 (100.0%) | 0 (0.0%) |
| 6 to 18 Years | 156 (100.0%) | 0 (0.0%) |
| 19 to 25 Years | 102 (91.9%) | 9 (8.1%) |
| 26 to 34 Years | 124 (91.2%) | 12 (8.8%) |
| 35 to 44 Years | 144 (95.4%) | 7 (4.6%) |
| 45 to 54 Years | 149 (100.0%) | 0 (0.0%) |
| 55 to 64 Years | 216 (98.6%) | 3 (1.4%) |
| 65 to 74 Years | 182 (100.0%) | 0 (0.0%) |
| 75 Years and older | 142 (100.0%) | 0 (0.0%) |
| Total | 1,269 (97.6%) | 31 (2.4%) |
Health Insurance Coverage by Citizenship Status in Reese
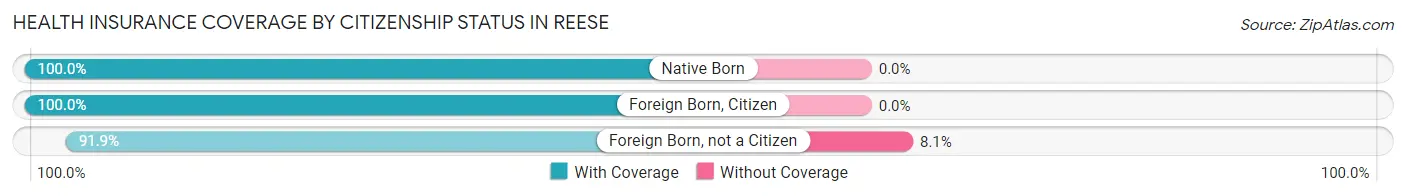
| Citizenship Status | With Coverage | Without Coverage |
| Native Born | 54 (100.0%) | 0 (0.0%) |
| Foreign Born, Citizen | 156 (100.0%) | 0 (0.0%) |
| Foreign Born, not a Citizen | 102 (91.9%) | 9 (8.1%) |
Health Insurance Coverage by Household Income in Reese
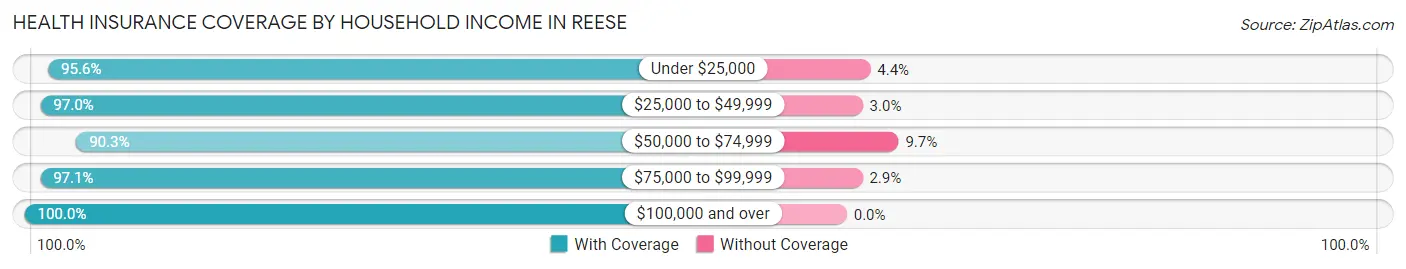
| Household Income | With Coverage | Without Coverage |
| Under $25,000 | 65 (95.6%) | 3 (4.4%) |
| $25,000 to $49,999 | 196 (97.0%) | 6 (3.0%) |
| $50,000 to $74,999 | 140 (90.3%) | 15 (9.7%) |
| $75,000 to $99,999 | 232 (97.1%) | 7 (2.9%) |
| $100,000 and over | 636 (100.0%) | 0 (0.0%) |
Public vs Private Health Insurance Coverage by Age in Reese
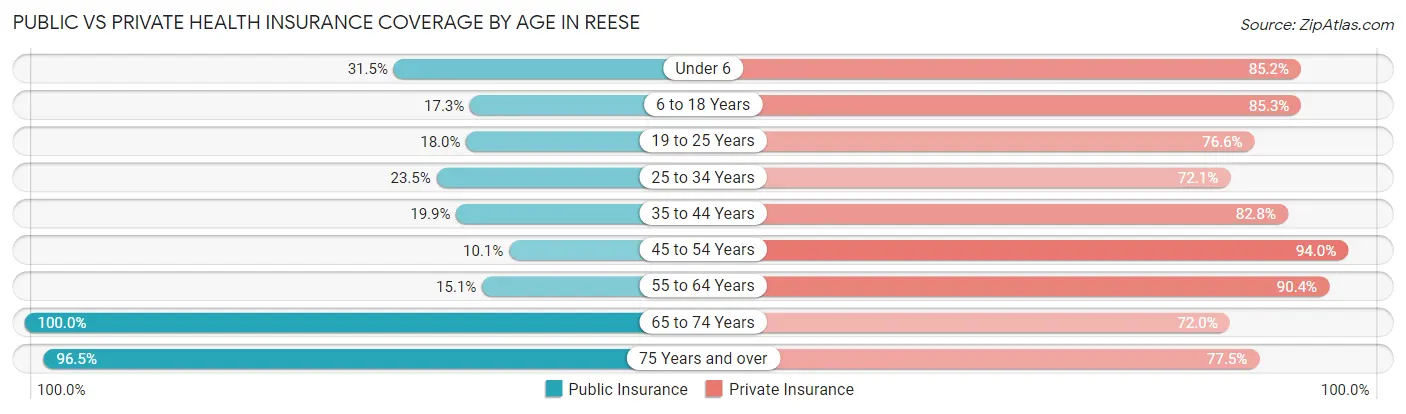
| Age Bracket | Public Insurance | Private Insurance |
| Under 6 | 17 (31.5%) | 46 (85.2%) |
| 6 to 18 Years | 27 (17.3%) | 133 (85.3%) |
| 19 to 25 Years | 20 (18.0%) | 85 (76.6%) |
| 25 to 34 Years | 32 (23.5%) | 98 (72.1%) |
| 35 to 44 Years | 30 (19.9%) | 125 (82.8%) |
| 45 to 54 Years | 15 (10.1%) | 140 (94.0%) |
| 55 to 64 Years | 33 (15.1%) | 198 (90.4%) |
| 65 to 74 Years | 182 (100.0%) | 131 (72.0%) |
| 75 Years and over | 137 (96.5%) | 110 (77.5%) |
| Total | 493 (37.9%) | 1,066 (82.0%) |
Disability Status by Sex by Age in Reese
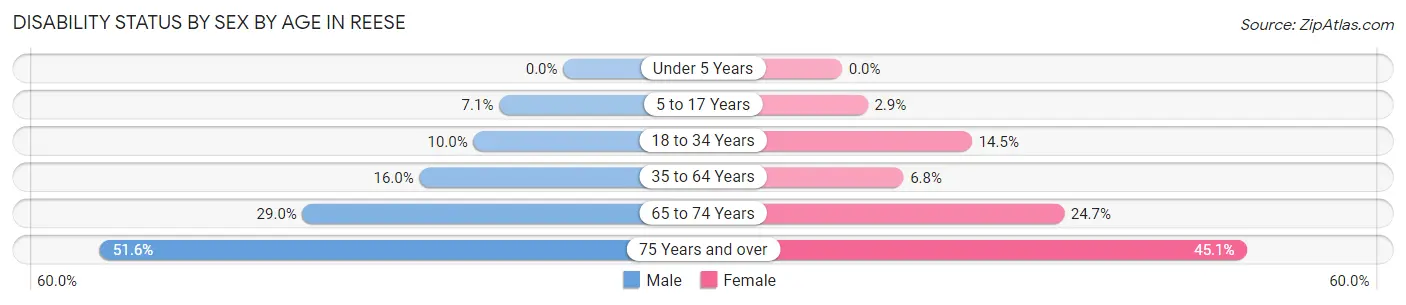
| Age Bracket | Male | Female |
| Under 5 Years | 0 (0.0%) | 0 (0.0%) |
| 5 to 17 Years | 7 (7.1%) | 2 (2.9%) |
| 18 to 34 Years | 10 (10.0%) | 22 (14.5%) |
| 35 to 64 Years | 41 (16.0%) | 18 (6.8%) |
| 65 to 74 Years | 27 (29.0%) | 22 (24.7%) |
| 75 Years and over | 16 (51.6%) | 50 (45.1%) |
Disability Class by Sex by Age in Reese
Disability Class: Hearing Difficulty
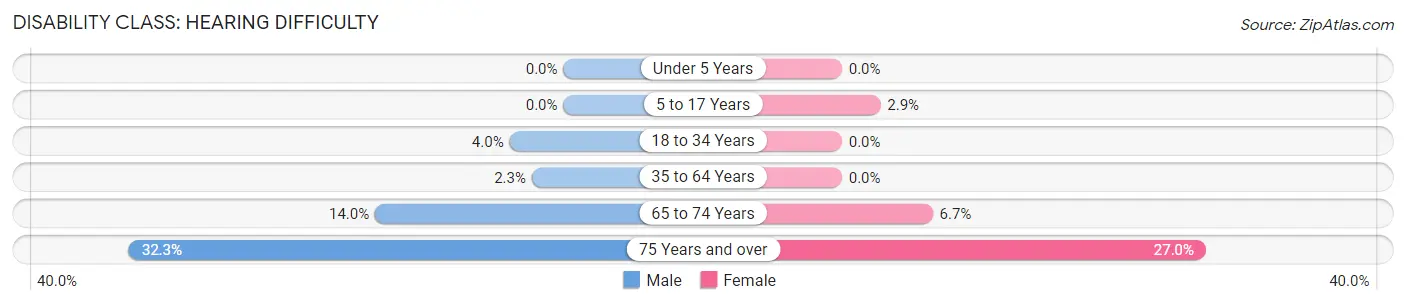
| Age Bracket | Male | Female |
| Under 5 Years | 0 (0.0%) | 0 (0.0%) |
| 5 to 17 Years | 0 (0.0%) | 2 (2.9%) |
| 18 to 34 Years | 4 (4.0%) | 0 (0.0%) |
| 35 to 64 Years | 6 (2.3%) | 0 (0.0%) |
| 65 to 74 Years | 13 (14.0%) | 6 (6.7%) |
| 75 Years and over | 10 (32.3%) | 30 (27.0%) |
Disability Class: Vision Difficulty
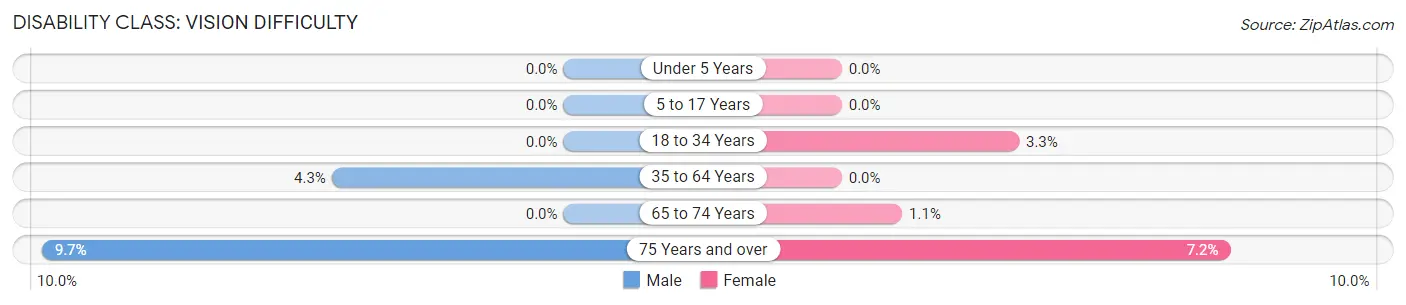
| Age Bracket | Male | Female |
| Under 5 Years | 0 (0.0%) | 0 (0.0%) |
| 5 to 17 Years | 0 (0.0%) | 0 (0.0%) |
| 18 to 34 Years | 0 (0.0%) | 5 (3.3%) |
| 35 to 64 Years | 11 (4.3%) | 0 (0.0%) |
| 65 to 74 Years | 0 (0.0%) | 1 (1.1%) |
| 75 Years and over | 3 (9.7%) | 8 (7.2%) |
Disability Class: Cognitive Difficulty
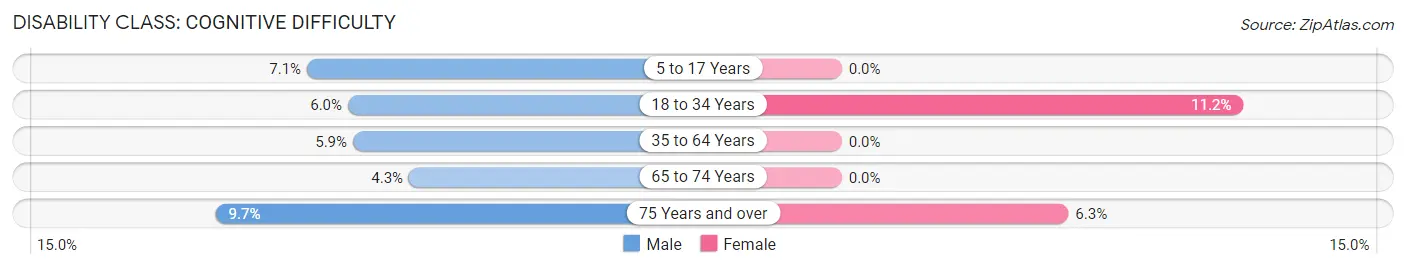
| Age Bracket | Male | Female |
| 5 to 17 Years | 7 (7.1%) | 0 (0.0%) |
| 18 to 34 Years | 6 (6.0%) | 17 (11.2%) |
| 35 to 64 Years | 15 (5.9%) | 0 (0.0%) |
| 65 to 74 Years | 4 (4.3%) | 0 (0.0%) |
| 75 Years and over | 3 (9.7%) | 7 (6.3%) |
Disability Class: Ambulatory Difficulty
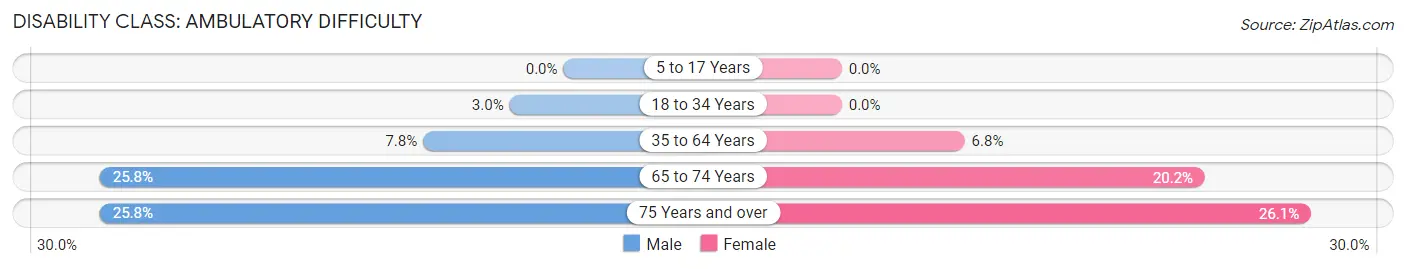
| Age Bracket | Male | Female |
| 5 to 17 Years | 0 (0.0%) | 0 (0.0%) |
| 18 to 34 Years | 3 (3.0%) | 0 (0.0%) |
| 35 to 64 Years | 20 (7.8%) | 18 (6.8%) |
| 65 to 74 Years | 24 (25.8%) | 18 (20.2%) |
| 75 Years and over | 8 (25.8%) | 29 (26.1%) |
Disability Class: Self-Care Difficulty
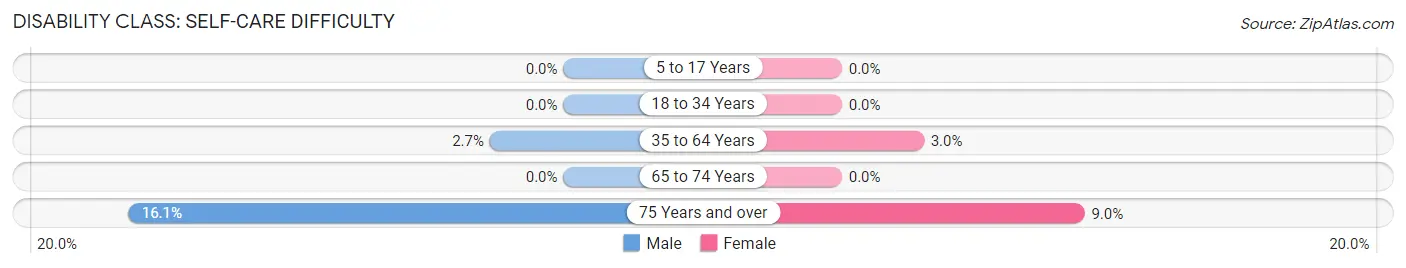
| Age Bracket | Male | Female |
| 5 to 17 Years | 0 (0.0%) | 0 (0.0%) |
| 18 to 34 Years | 0 (0.0%) | 0 (0.0%) |
| 35 to 64 Years | 7 (2.7%) | 8 (3.0%) |
| 65 to 74 Years | 0 (0.0%) | 0 (0.0%) |
| 75 Years and over | 5 (16.1%) | 10 (9.0%) |
Technology Access in Reese
Computing Device Access in Reese
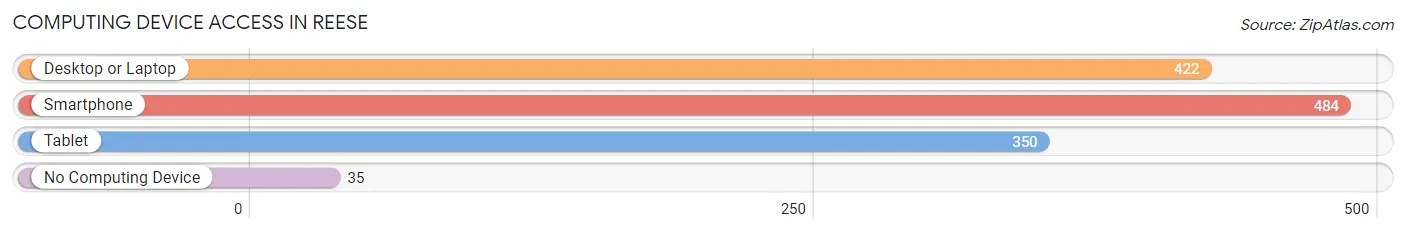
| Device Type | # Households | % Households |
| Desktop or Laptop | 422 | 73.9% |
| Smartphone | 484 | 84.8% |
| Tablet | 350 | 61.3% |
| No Computing Device | 35 | 6.1% |
| Total | 571 | 100.0% |
Internet Access in Reese
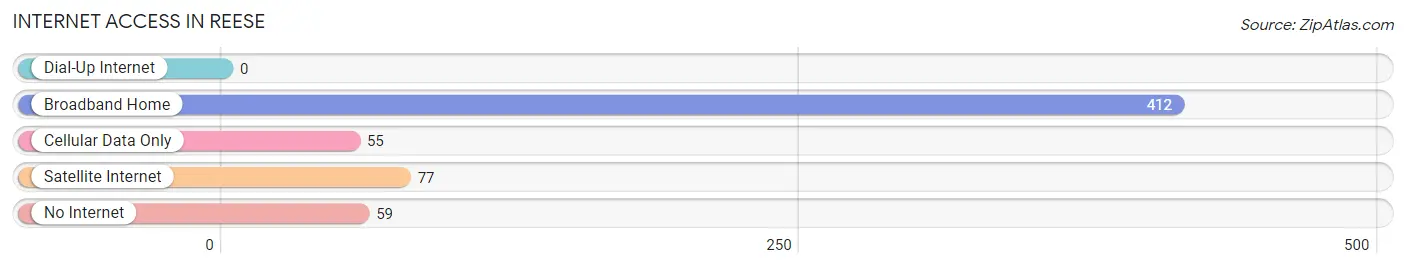
| Internet Type | # Households | % Households |
| Dial-Up Internet | 0 | 0.0% |
| Broadband Home | 412 | 72.2% |
| Cellular Data Only | 55 | 9.6% |
| Satellite Internet | 77 | 13.5% |
| No Internet | 59 | 10.3% |
| Total | 571 | 100.0% |
Reese Summary
Reese is a small village located in Tuscola County, Michigan. It is situated in the Thumb region of the state, approximately 10 miles south of the city of Saginaw. The village has a population of 1,845 people, according to the 2010 census.
History
Reese was founded in 1871 by a group of German immigrants who had recently arrived in the area. The village was named after a local landowner, John Reese. The first settlers were primarily farmers, and the village grew slowly over the years. In 1876, the first post office was established, and the village was officially incorporated in 1881.
In the early 1900s, the village began to experience a period of growth. The railroad arrived in 1906, and the village was connected to the larger cities of Saginaw and Bay City. This allowed for the development of a small manufacturing industry, and the village began to attract more people. By the 1920s, the population had grown to over 1,000 people.
Geography
Reese is located in the Thumb region of Michigan, approximately 10 miles south of the city of Saginaw. The village is situated on the banks of the Cass River, which flows through the area. The terrain is mostly flat, with some rolling hills in the surrounding area. The climate is humid continental, with hot summers and cold winters.
Economy
The economy of Reese is largely based on agriculture and manufacturing. The village is home to several small businesses, including a grocery store, a hardware store, and a few restaurants. The village also has a small industrial park, which is home to several manufacturing companies.
The village is also home to a few small farms, which produce a variety of crops, including corn, soybeans, and wheat. The village also has a few small wineries, which produce a variety of wines.
Demographics
According to the 2010 census, the population of Reese was 1,845 people. The racial makeup of the village was 95.3% White, 0.9% African American, 0.3% Native American, 0.7% Asian, 0.1% Pacific Islander, and 2.7% from other races. The median household income was $41,944, and the median family income was $50,938.
Reese is a small village with a rich history and a diverse population. The village is home to a variety of businesses, and the economy is largely based on agriculture and manufacturing. The village is also home to a few small farms and wineries, which produce a variety of crops and wines.
Common Questions
What is Per Capita Income in Reese?
Per Capita income in Reese is $44,800.
What is the Median Family Income in Reese?
Median Family Income in Reese is $105,956.
What is the Median Household income in Reese?
Median Household Income in Reese is $81,583.
What is Income or Wage Gap in Reese?
Income or Wage Gap in Reese is 38.7%.
Women in Reese earn 61.3 cents for every dollar earned by a man.
What is Inequality or Gini Index in Reese?
Inequality or Gini Index in Reese is 0.40.
What is the Total Population of Reese?
Total Population of Reese is 1,300.
What is the Total Male Population of Reese?
Total Male Population of Reese is 599.
What is the Total Female Population of Reese?
Total Female Population of Reese is 701.
What is the Ratio of Males per 100 Females in Reese?
There are 85.45 Males per 100 Females in Reese.
What is the Ratio of Females per 100 Males in Reese?
There are 117.03 Females per 100 Males in Reese.
What is the Median Population Age in Reese?
Median Population Age in Reese is 48.3 Years.
What is the Average Family Size in Reese
Average Family Size in Reese is 2.7 People.
What is the Average Household Size in Reese
Average Household Size in Reese is 2.3 People.
How Large is the Labor Force in Reese?
There are 736 People in the Labor Forcein in Reese.
What is the Percentage of People in the Labor Force in Reese?
65.5% of People are in the Labor Force in Reese.
What is the Unemployment Rate in Reese?
Unemployment Rate in Reese is 11.7%.