Zip Codes with the Highest Percentage of Households with Income Above $100,000 in Detroit, MI
RELATED REPORTS & OPTIONS
Household Income | $100k+
Detroit
Compare Zip Codes
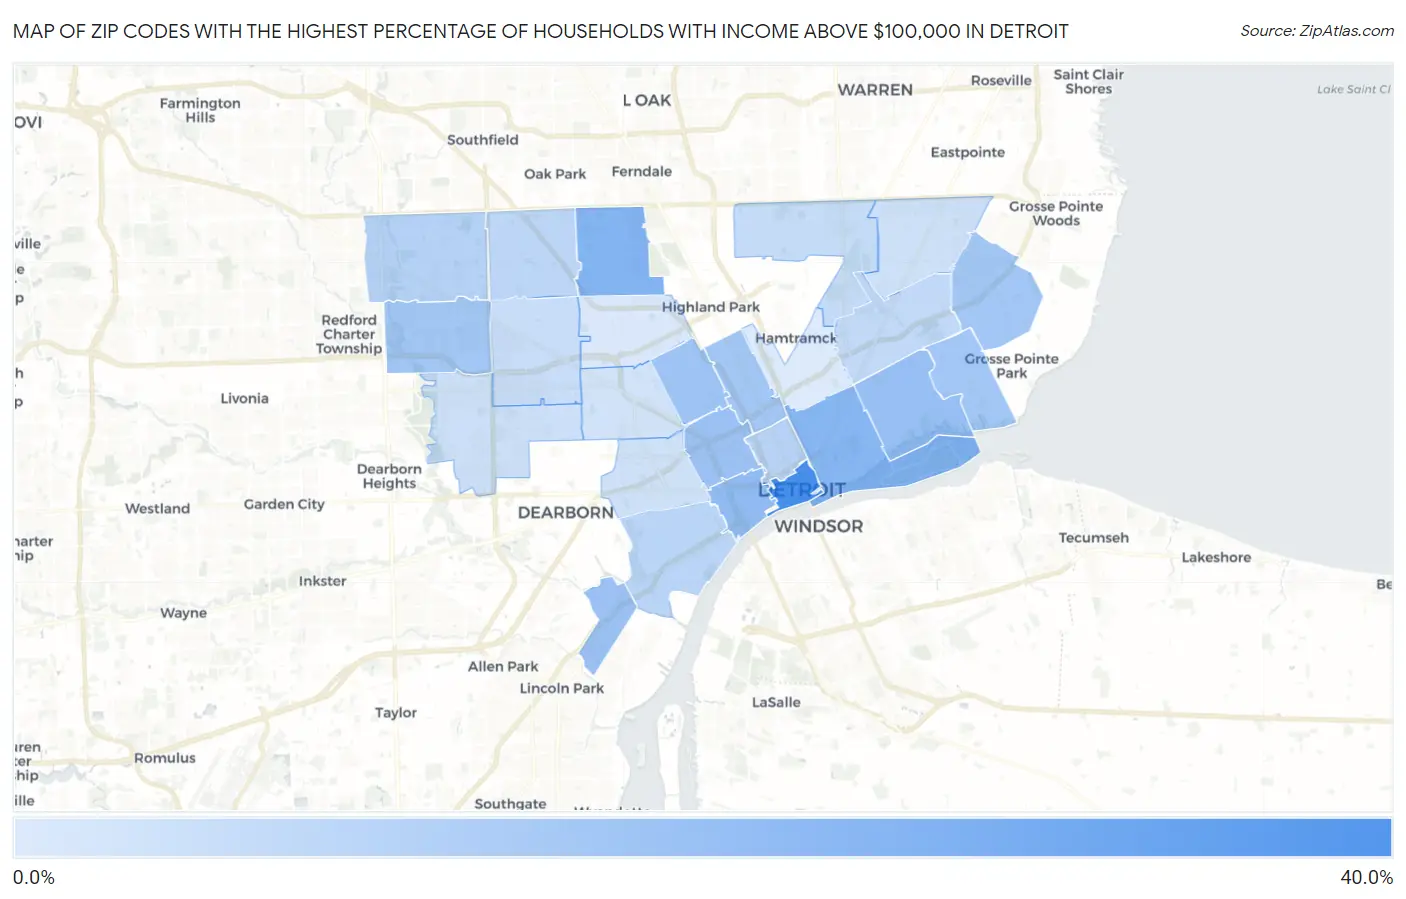
Map of Zip Codes with the Highest Percentage of Households with Income Above $100,000 in Detroit
0.0%
40.0%
Zip Codes with the Highest Percentage of Households with Income Above $100,000 in Detroit, MI
| Zip Code | Households with Income > $100k | vs State | vs National | |
| 1. | 48226 | 32.9% | 32.5%(+0.400)#338 | 37.3%(-4.40)#13,209 |
| 2. | 48221 | 21.7% | 32.5%(-10.8)#641 | 37.3%(-15.6)#22,648 |
| 3. | 48207 | 20.6% | 32.5%(-11.9)#683 | 37.3%(-16.7)#23,564 |
| 4. | 48216 | 19.1% | 32.5%(-13.4)#743 | 37.3%(-18.2)#24,766 |
| 5. | 48214 | 17.9% | 32.5%(-14.6)#777 | 37.3%(-19.4)#25,610 |
| 6. | 48208 | 17.0% | 32.5%(-15.5)#799 | 37.3%(-20.3)#26,230 |
| 7. | 48217 | 16.9% | 32.5%(-15.6)#801 | 37.3%(-20.4)#26,306 |
| 8. | 48206 | 16.6% | 32.5%(-15.9)#808 | 37.3%(-20.7)#26,499 |
| 9. | 48223 | 15.9% | 32.5%(-16.6)#826 | 37.3%(-21.4)#26,985 |
| 10. | 48224 | 15.8% | 32.5%(-16.7)#830 | 37.3%(-21.5)#27,041 |
| 11. | 48202 | 15.8% | 32.5%(-16.7)#831 | 37.3%(-21.5)#27,046 |
| 12. | 48215 | 15.8% | 32.5%(-16.7)#832 | 37.3%(-21.5)#27,047 |
| 13. | 48219 | 12.9% | 32.5%(-19.6)#877 | 37.3%(-24.4)#28,620 |
| 14. | 48201 | 12.3% | 32.5%(-20.2)#886 | 37.3%(-25.0)#28,902 |
| 15. | 48209 | 12.0% | 32.5%(-20.5)#893 | 37.3%(-25.3)#29,019 |
| 16. | 48235 | 11.7% | 32.5%(-20.8)#896 | 37.3%(-25.6)#29,145 |
| 17. | 48213 | 11.0% | 32.5%(-21.5)#907 | 37.3%(-26.3)#29,448 |
| 18. | 48234 | 10.1% | 32.5%(-22.4)#920 | 37.3%(-27.2)#29,789 |
| 19. | 48227 | 9.7% | 32.5%(-22.8)#922 | 37.3%(-27.6)#29,917 |
| 20. | 48228 | 9.1% | 32.5%(-23.4)#925 | 37.3%(-28.2)#30,109 |
| 21. | 48210 | 8.6% | 32.5%(-23.9)#930 | 37.3%(-28.7)#30,258 |
| 22. | 48205 | 8.5% | 32.5%(-24.0)#932 | 37.3%(-28.8)#30,299 |
| 23. | 48204 | 8.2% | 32.5%(-24.3)#937 | 37.3%(-29.1)#30,380 |
| 24. | 48238 | 6.9% | 32.5%(-25.6)#944 | 37.3%(-30.4)#30,678 |
| 25. | 48211 | 6.4% | 32.5%(-26.1)#951 | 37.3%(-30.9)#30,786 |
1
Common Questions
What are the Top 10 Zip Codes with the Highest Percentage of Households with Income Above $100,000 in Detroit, MI?
Top 10 Zip Codes with the Highest Percentage of Households with Income Above $100,000 in Detroit, MI are:
What zip code has the Highest Percentage of Households with Income Above $100,000 in Detroit, MI?
48226 has the Highest Percentage of Households with Income Above $100,000 in Detroit, MI with 32.9%.
What is the Percentage of Households with Income Above $100,000 in Detroit, MI?
Percentage of Households with Income Above $100,000 in Detroit is 13.4%.
What is the Percentage of Households with Income Above $100,000 in Michigan?
Percentage of Households with Income Above $100,000 in Michigan is 32.5%.
What is the Percentage of Households with Income Above $100,000 in the United States?
Percentage of Households with Income Above $100,000 in the United States is 37.3%.