Zip Codes with the Highest Percentage of Households with Income Above $100,000 in New Baltimore, MI
RELATED REPORTS & OPTIONS
Household Income | $100k+
New Baltimore
Compare Zip Codes
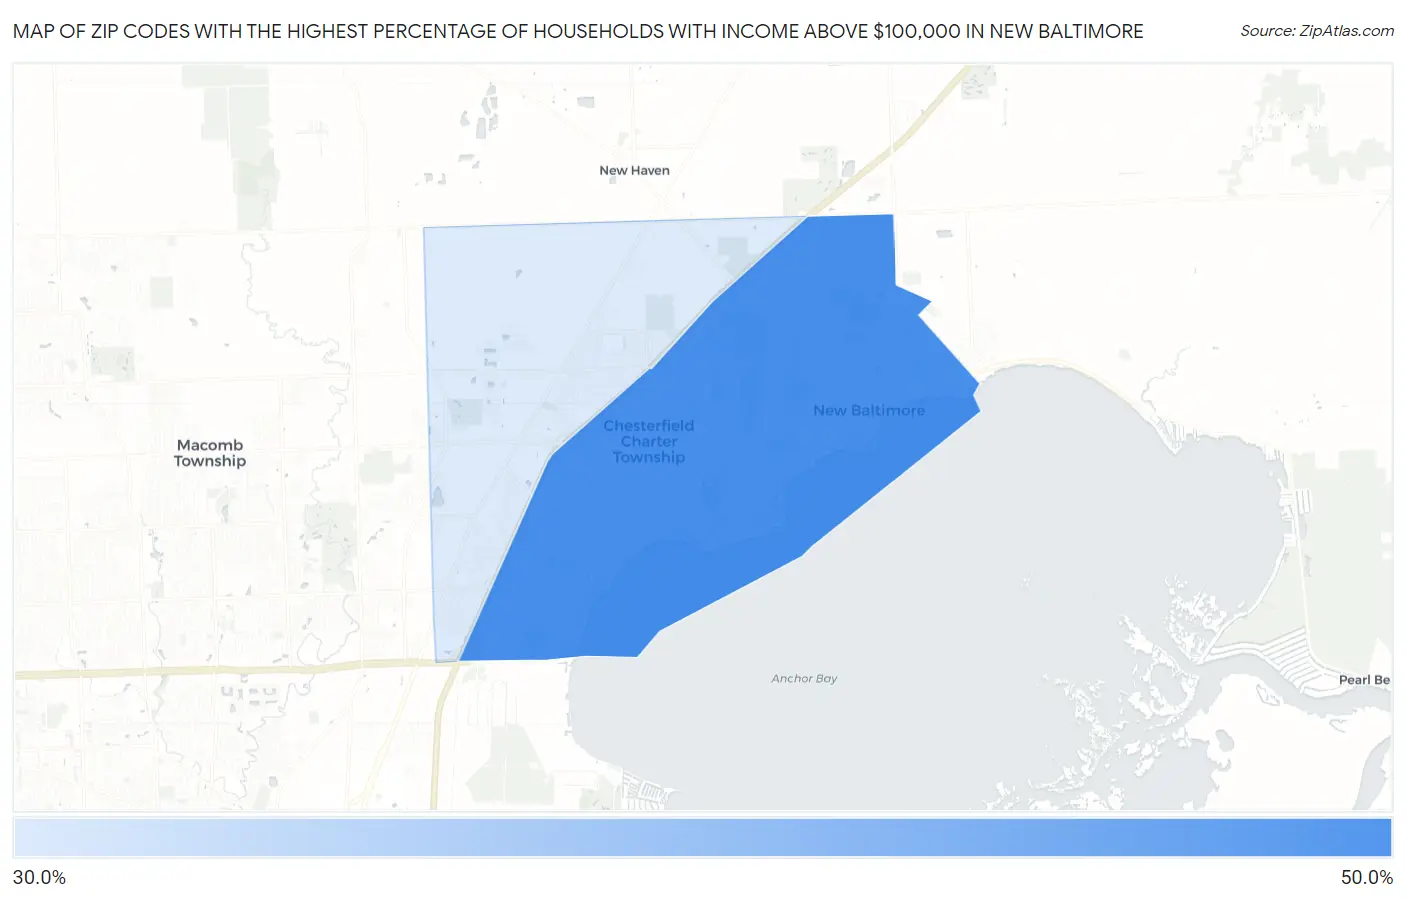
Map of Zip Codes with the Highest Percentage of Households with Income Above $100,000 in New Baltimore
39.5%
44.7%
Zip Codes with the Highest Percentage of Households with Income Above $100,000 in New Baltimore, MI
| Zip Code | Households with Income > $100k | vs State | vs National | |
| 1. | 48047 | 44.7% | 32.5%(+12.2)#134 | 37.3%(+7.40)#6,741 |
| 2. | 48051 | 39.5% | 32.5%(+7.00)#191 | 37.3%(+2.20)#9,180 |
1
Common Questions
What are the Top Zip Codes with the Highest Percentage of Households with Income Above $100,000 in New Baltimore, MI?
Top Zip Codes with the Highest Percentage of Households with Income Above $100,000 in New Baltimore, MI are:
What zip code has the Highest Percentage of Households with Income Above $100,000 in New Baltimore, MI?
48047 has the Highest Percentage of Households with Income Above $100,000 in New Baltimore, MI with 44.7%.
What is the Percentage of Households with Income Above $100,000 in New Baltimore, MI?
Percentage of Households with Income Above $100,000 in New Baltimore is 46.2%.
What is the Percentage of Households with Income Above $100,000 in Michigan?
Percentage of Households with Income Above $100,000 in Michigan is 32.5%.
What is the Percentage of Households with Income Above $100,000 in the United States?
Percentage of Households with Income Above $100,000 in the United States is 37.3%.