Zip Codes with the Highest Percentage of Households with Income Above $100,000 in Bloomfield Hills, MI
RELATED REPORTS & OPTIONS
Household Income | $100k+
Bloomfield Hills
Compare Zip Codes
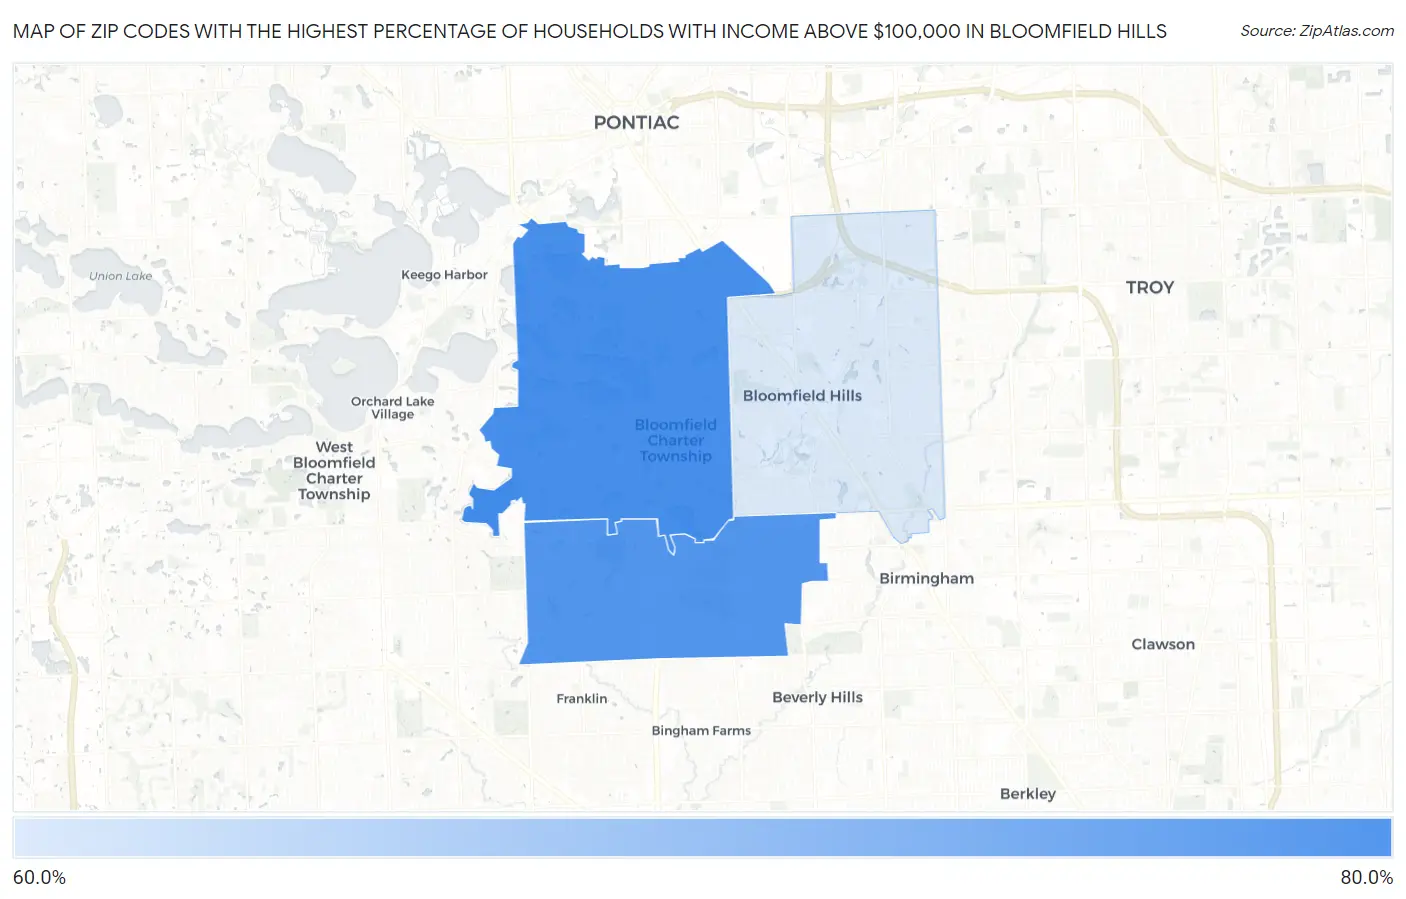
Map of Zip Codes with the Highest Percentage of Households with Income Above $100,000 in Bloomfield Hills
64.4%
68.0%
Zip Codes with the Highest Percentage of Households with Income Above $100,000 in Bloomfield Hills, MI
| Zip Code | Households with Income > $100k | vs State | vs National | |
| 1. | 48302 | 68.0% | 32.5%(+35.5)#12 | 37.3%(+30.7)#1,163 |
| 2. | 48301 | 67.7% | 32.5%(+35.2)#13 | 37.3%(+30.4)#1,201 |
| 3. | 48304 | 64.4% | 32.5%(+31.9)#18 | 37.3%(+27.1)#1,631 |
1
Common Questions
What are the Top Zip Codes with the Highest Percentage of Households with Income Above $100,000 in Bloomfield Hills, MI?
Top Zip Codes with the Highest Percentage of Households with Income Above $100,000 in Bloomfield Hills, MI are:
What zip code has the Highest Percentage of Households with Income Above $100,000 in Bloomfield Hills, MI?
48302 has the Highest Percentage of Households with Income Above $100,000 in Bloomfield Hills, MI with 68.0%.
What is the Percentage of Households with Income Above $100,000 in Bloomfield Hills, MI?
Percentage of Households with Income Above $100,000 in Bloomfield Hills is 74.7%.
What is the Percentage of Households with Income Above $100,000 in Michigan?
Percentage of Households with Income Above $100,000 in Michigan is 32.5%.
What is the Percentage of Households with Income Above $100,000 in the United States?
Percentage of Households with Income Above $100,000 in the United States is 37.3%.