Zip Codes with the Highest Percentage of Households with Income Above $100,000 in Oxford, MI
RELATED REPORTS & OPTIONS
Household Income | $100k+
Oxford
Compare Zip Codes
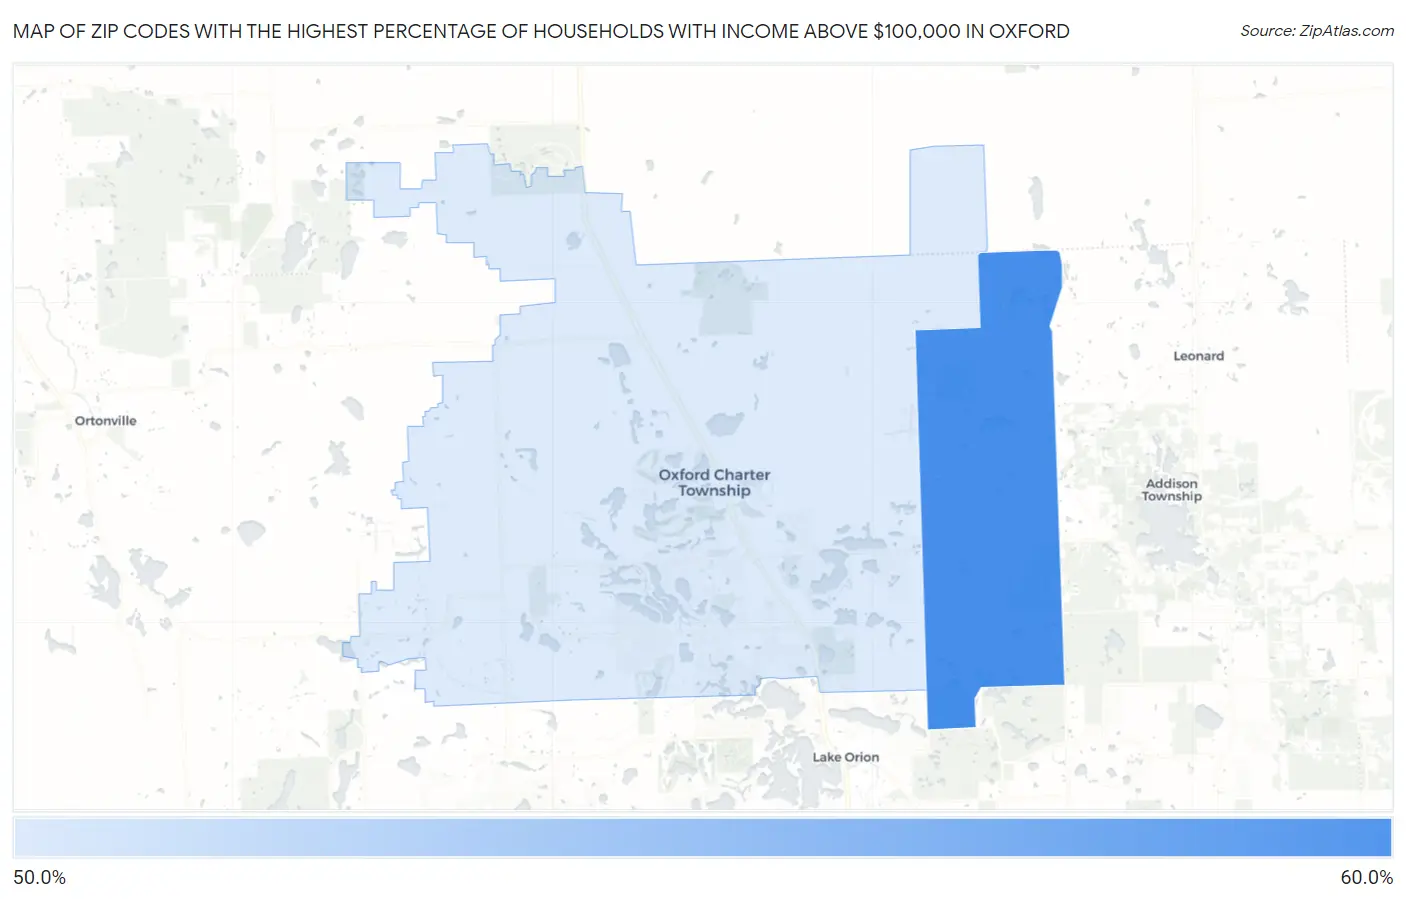
Map of Zip Codes with the Highest Percentage of Households with Income Above $100,000 in Oxford
51.8%
55.9%
Zip Codes with the Highest Percentage of Households with Income Above $100,000 in Oxford, MI
| Zip Code | Households with Income > $100k | vs State | vs National | |
| 1. | 48370 | 55.9% | 32.5%(+23.4)#41 | 37.3%(+18.6)#3,223 |
| 2. | 48371 | 51.8% | 32.5%(+19.3)#63 | 37.3%(+14.5)#4,294 |
1
Common Questions
What are the Top Zip Codes with the Highest Percentage of Households with Income Above $100,000 in Oxford, MI?
Top Zip Codes with the Highest Percentage of Households with Income Above $100,000 in Oxford, MI are:
What zip code has the Highest Percentage of Households with Income Above $100,000 in Oxford, MI?
48370 has the Highest Percentage of Households with Income Above $100,000 in Oxford, MI with 55.9%.
What is the Percentage of Households with Income Above $100,000 in Oxford, MI?
Percentage of Households with Income Above $100,000 in Oxford is 41.3%.
What is the Percentage of Households with Income Above $100,000 in Michigan?
Percentage of Households with Income Above $100,000 in Michigan is 32.5%.
What is the Percentage of Households with Income Above $100,000 in the United States?
Percentage of Households with Income Above $100,000 in the United States is 37.3%.