Zip Codes with the Highest Percentage of Households with Income Above $100,000 in Michigan
RELATED REPORTS & OPTIONS
Household Income | $100k+
Michigan
Compare Zip Codes
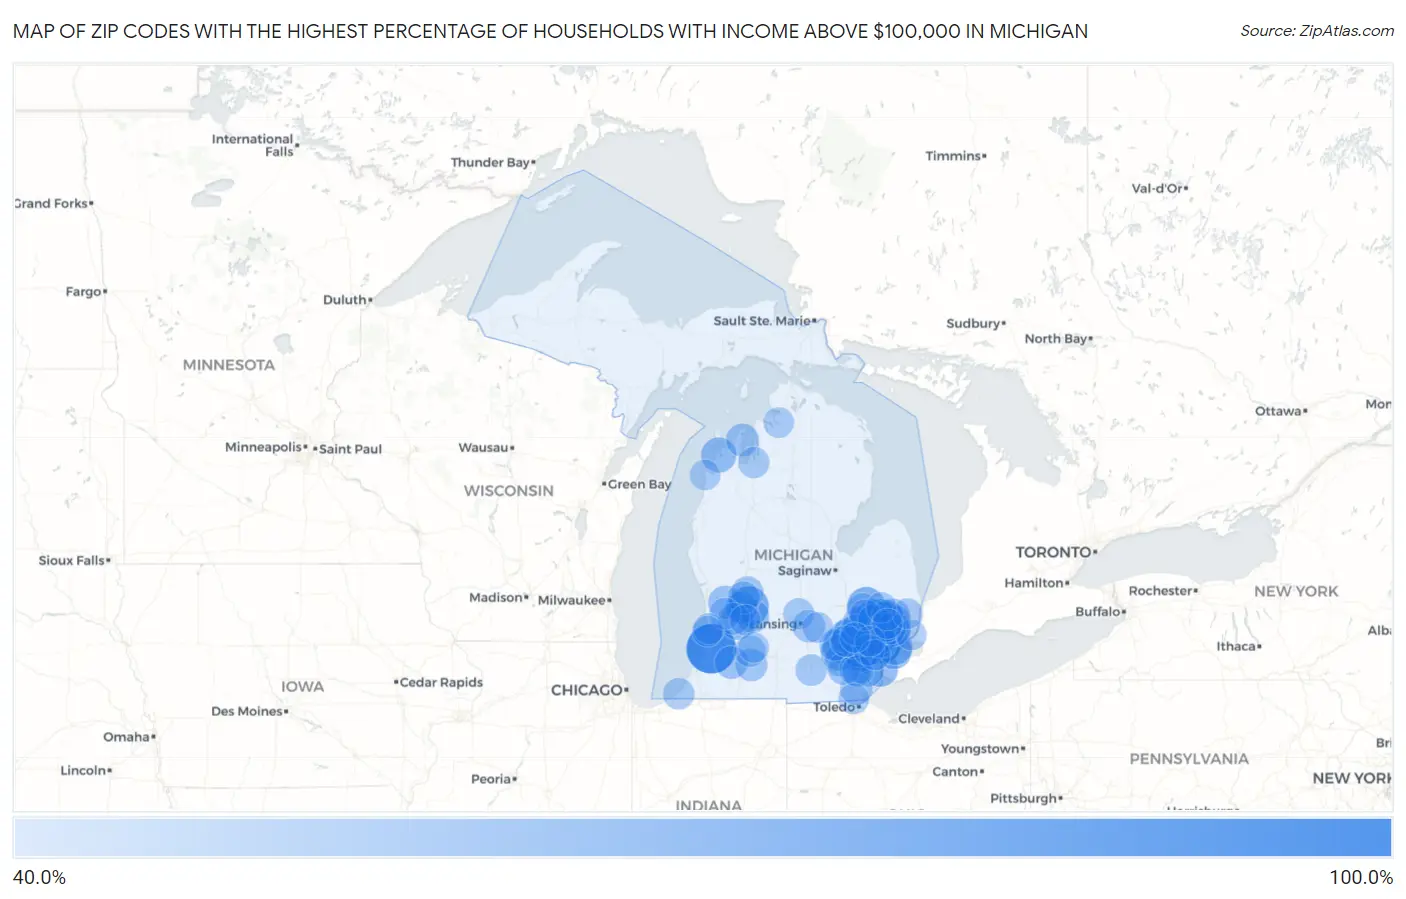
Map of Zip Codes with the Highest Percentage of Households with Income Above $100,000 in Michigan
40.0%
100.0%
Zip Codes with the Highest Percentage of Households with Income Above $100,000 in Michigan
| Zip Code | Households with Income > $100k | vs State | vs National | |
| 1. | 49063 | 100.0% | 32.5%(+67.5)#1 | 37.3%(+62.7)#46 |
| 2. | 48070 | 79.1% | 32.5%(+46.6)#2 | 37.3%(+41.8)#381 |
| 3. | 48374 | 78.2% | 32.5%(+45.7)#3 | 37.3%(+40.9)#411 |
| 4. | 48306 | 76.2% | 32.5%(+43.7)#4 | 37.3%(+38.9)#508 |
| 5. | 49301 | 74.0% | 32.5%(+41.5)#5 | 37.3%(+36.7)#634 |
| 6. | 48025 | 72.2% | 32.5%(+39.7)#6 | 37.3%(+34.9)#762 |
| 7. | 48069 | 71.8% | 32.5%(+39.3)#7 | 37.3%(+34.5)#797 |
| 8. | 48168 | 71.5% | 32.5%(+39.0)#8 | 37.3%(+34.2)#821 |
| 9. | 48098 | 70.2% | 32.5%(+37.7)#9 | 37.3%(+32.9)#945 |
| 10. | 48363 | 69.3% | 32.5%(+36.8)#10 | 37.3%(+32.0)#1,030 |
| 11. | 48440 | 69.0% | 32.5%(+36.5)#11 | 37.3%(+31.7)#1,067 |
| 12. | 48302 | 68.0% | 32.5%(+35.5)#12 | 37.3%(+30.7)#1,163 |
| 13. | 48301 | 67.7% | 32.5%(+35.2)#13 | 37.3%(+30.4)#1,201 |
| 14. | 48085 | 66.9% | 32.5%(+34.4)#14 | 37.3%(+29.6)#1,277 |
| 15. | 48380 | 64.6% | 32.5%(+32.1)#15 | 37.3%(+27.3)#1,595 |
| 16. | 48143 | 64.6% | 32.5%(+32.1)#16 | 37.3%(+27.3)#1,605 |
| 17. | 48009 | 64.4% | 32.5%(+31.9)#17 | 37.3%(+27.1)#1,629 |
| 18. | 48304 | 64.4% | 32.5%(+31.9)#18 | 37.3%(+27.1)#1,631 |
| 19. | 48138 | 63.2% | 32.5%(+30.7)#19 | 37.3%(+25.9)#1,812 |
| 20. | 48130 | 63.0% | 32.5%(+30.5)#20 | 37.3%(+25.7)#1,844 |
| 21. | 48323 | 62.9% | 32.5%(+30.4)#21 | 37.3%(+25.6)#1,866 |
| 22. | 48324 | 62.4% | 32.5%(+29.9)#22 | 37.3%(+25.1)#1,942 |
| 23. | 48382 | 62.3% | 32.5%(+29.8)#23 | 37.3%(+25.0)#1,953 |
| 24. | 48230 | 62.0% | 32.5%(+29.5)#24 | 37.3%(+24.7)#2,000 |
| 25. | 48095 | 61.9% | 32.5%(+29.4)#25 | 37.3%(+24.6)#2,024 |
| 26. | 49636 | 60.7% | 32.5%(+28.2)#26 | 37.3%(+23.4)#2,237 |
| 27. | 48348 | 60.4% | 32.5%(+27.9)#27 | 37.3%(+23.1)#2,285 |
| 28. | 48236 | 60.0% | 32.5%(+27.5)#28 | 37.3%(+22.7)#2,361 |
| 29. | 48360 | 59.8% | 32.5%(+27.3)#29 | 37.3%(+22.5)#2,411 |
| 30. | 48331 | 59.7% | 32.5%(+27.2)#30 | 37.3%(+22.4)#2,426 |
| 31. | 48178 | 59.4% | 32.5%(+26.9)#31 | 37.3%(+22.1)#2,482 |
| 32. | 49335 | 59.3% | 32.5%(+26.8)#32 | 37.3%(+22.0)#2,517 |
| 33. | 48309 | 58.7% | 32.5%(+26.2)#33 | 37.3%(+21.4)#2,619 |
| 34. | 48042 | 57.0% | 32.5%(+24.5)#34 | 37.3%(+19.7)#2,976 |
| 35. | 48188 | 56.6% | 32.5%(+24.1)#35 | 37.3%(+19.3)#3,067 |
| 36. | 49430 | 56.3% | 32.5%(+23.8)#36 | 37.3%(+19.0)#3,145 |
| 37. | 48103 | 56.1% | 32.5%(+23.6)#37 | 37.3%(+18.8)#3,166 |
| 38. | 48114 | 56.0% | 32.5%(+23.5)#38 | 37.3%(+18.7)#3,192 |
| 39. | 49302 | 55.9% | 32.5%(+23.4)#39 | 37.3%(+18.6)#3,211 |
| 40. | 48096 | 55.9% | 32.5%(+23.4)#40 | 37.3%(+18.6)#3,219 |
| 41. | 48370 | 55.9% | 32.5%(+23.4)#41 | 37.3%(+18.6)#3,223 |
| 42. | 48164 | 55.8% | 32.5%(+23.3)#42 | 37.3%(+18.5)#3,249 |
| 43. | 48187 | 55.7% | 32.5%(+23.2)#43 | 37.3%(+18.4)#3,266 |
| 44. | 49674 | 55.0% | 32.5%(+22.5)#44 | 37.3%(+17.7)#3,466 |
| 45. | 48375 | 54.9% | 32.5%(+22.4)#45 | 37.3%(+17.6)#3,475 |
| 46. | 49071 | 54.8% | 32.5%(+22.3)#46 | 37.3%(+17.5)#3,506 |
| 47. | 48044 | 54.7% | 32.5%(+22.2)#47 | 37.3%(+17.4)#3,521 |
| 48. | 48322 | 54.7% | 32.5%(+22.2)#48 | 37.3%(+17.4)#3,524 |
| 49. | 48072 | 54.4% | 32.5%(+21.9)#49 | 37.3%(+17.1)#3,614 |
| 50. | 49506 | 53.9% | 32.5%(+21.4)#50 | 37.3%(+16.6)#3,739 |
| 51. | 48005 | 53.7% | 32.5%(+21.2)#51 | 37.3%(+16.4)#3,790 |
| 52. | 48167 | 53.5% | 32.5%(+21.0)#52 | 37.3%(+16.2)#3,835 |
| 53. | 48084 | 53.5% | 32.5%(+21.0)#53 | 37.3%(+16.2)#3,838 |
| 54. | 48864 | 53.4% | 32.5%(+20.9)#54 | 37.3%(+16.1)#3,856 |
| 55. | 48140 | 53.0% | 32.5%(+20.5)#55 | 37.3%(+15.7)#3,974 |
| 56. | 49341 | 52.9% | 32.5%(+20.4)#56 | 37.3%(+15.6)#3,980 |
| 57. | 48176 | 52.9% | 32.5%(+20.4)#57 | 37.3%(+15.6)#3,986 |
| 58. | 49088 | 52.9% | 32.5%(+20.4)#58 | 37.3%(+15.6)#4,000 |
| 59. | 48350 | 52.8% | 32.5%(+20.3)#59 | 37.3%(+15.5)#4,031 |
| 60. | 49306 | 52.3% | 32.5%(+19.8)#60 | 37.3%(+15.0)#4,172 |
| 61. | 48367 | 52.3% | 32.5%(+19.8)#61 | 37.3%(+15.0)#4,176 |
| 62. | 48170 | 52.1% | 32.5%(+19.6)#62 | 37.3%(+14.8)#4,211 |
| 63. | 48371 | 51.8% | 32.5%(+19.3)#63 | 37.3%(+14.5)#4,294 |
| 64. | 49315 | 51.7% | 32.5%(+19.2)#64 | 37.3%(+14.4)#4,334 |
| 65. | 49426 | 51.6% | 32.5%(+19.1)#65 | 37.3%(+14.3)#4,359 |
| 66. | 48190 | 51.4% | 32.5%(+18.9)#66 | 37.3%(+14.1)#4,448 |
| 67. | 48165 | 51.3% | 32.5%(+18.8)#67 | 37.3%(+14.0)#4,461 |
| 68. | 48307 | 51.1% | 32.5%(+18.6)#68 | 37.3%(+13.8)#4,501 |
| 69. | 48067 | 51.0% | 32.5%(+18.5)#69 | 37.3%(+13.7)#4,536 |
| 70. | 48169 | 50.9% | 32.5%(+18.4)#70 | 37.3%(+13.6)#4,569 |
| 71. | 49129 | 50.9% | 32.5%(+18.4)#71 | 37.3%(+13.6)#4,591 |
| 72. | 49234 | 50.8% | 32.5%(+18.3)#72 | 37.3%(+13.5)#4,612 |
| 73. | 48116 | 50.7% | 32.5%(+18.2)#73 | 37.3%(+13.4)#4,626 |
| 74. | 48356 | 50.7% | 32.5%(+18.2)#74 | 37.3%(+13.4)#4,634 |
| 75. | 49083 | 50.7% | 32.5%(+18.2)#75 | 37.3%(+13.4)#4,635 |
| 76. | 48315 | 50.6% | 32.5%(+18.1)#76 | 37.3%(+13.3)#4,657 |
| 77. | 48191 | 50.4% | 32.5%(+17.9)#77 | 37.3%(+13.1)#4,723 |
| 78. | 48438 | 50.3% | 32.5%(+17.8)#78 | 37.3%(+13.0)#4,751 |
| 79. | 49690 | 50.3% | 32.5%(+17.8)#79 | 37.3%(+13.0)#4,752 |
| 80. | 48362 | 50.2% | 32.5%(+17.7)#80 | 37.3%(+12.9)#4,775 |
| 81. | 48316 | 49.9% | 32.5%(+17.4)#81 | 37.3%(+12.6)#4,884 |
| 82. | 48820 | 49.9% | 32.5%(+17.4)#82 | 37.3%(+12.6)#4,889 |
| 83. | 48462 | 49.9% | 32.5%(+17.4)#83 | 37.3%(+12.6)#4,892 |
| 84. | 48154 | 49.6% | 32.5%(+17.1)#84 | 37.3%(+12.3)#4,972 |
| 85. | 49453 | 49.3% | 32.5%(+16.8)#85 | 37.3%(+12.0)#5,092 |
| 86. | 49316 | 49.1% | 32.5%(+16.6)#86 | 37.3%(+11.8)#5,135 |
| 87. | 48144 | 49.1% | 32.5%(+16.6)#87 | 37.3%(+11.8)#5,141 |
| 88. | 49406 | 49.1% | 32.5%(+16.6)#88 | 37.3%(+11.8)#5,156 |
| 89. | 48895 | 49.0% | 32.5%(+16.5)#89 | 37.3%(+11.7)#5,175 |
| 90. | 48065 | 48.8% | 32.5%(+16.3)#90 | 37.3%(+11.5)#5,237 |
| 91. | 48028 | 48.8% | 32.5%(+16.3)#91 | 37.3%(+11.5)#5,250 |
| 92. | 48128 | 48.7% | 32.5%(+16.2)#92 | 37.3%(+11.4)#5,264 |
| 93. | 48063 | 48.7% | 32.5%(+16.2)#93 | 37.3%(+11.4)#5,272 |
| 94. | 48334 | 48.6% | 32.5%(+16.1)#94 | 37.3%(+11.3)#5,290 |
| 95. | 49796 | 48.6% | 32.5%(+16.1)#95 | 37.3%(+11.3)#5,305 |
| 96. | 49628 | 48.6% | 32.5%(+16.1)#96 | 37.3%(+11.3)#5,306 |
| 97. | 48428 | 48.5% | 32.5%(+16.0)#97 | 37.3%(+11.2)#5,327 |
| 98. | 49060 | 48.5% | 32.5%(+16.0)#98 | 37.3%(+11.2)#5,334 |
| 99. | 48094 | 48.2% | 32.5%(+15.7)#99 | 37.3%(+10.9)#5,423 |
| 100. | 48381 | 48.0% | 32.5%(+15.5)#100 | 37.3%(+10.7)#5,502 |
Common Questions
What are the Top 10 Zip Codes with the Highest Percentage of Households with Income Above $100,000 in Michigan?
Top 10 Zip Codes with the Highest Percentage of Households with Income Above $100,000 in Michigan are:
What zip code has the Highest Percentage of Households with Income Above $100,000 in Michigan?
49063 has the Highest Percentage of Households with Income Above $100,000 in Michigan with 100.0%.
What is the Percentage of Households with Income Above $100,000 in the State of Michigan?
Percentage of Households with Income Above $100,000 in Michigan is 32.5%.
What is the Percentage of Households with Income Above $100,000 in the United States?
Percentage of Households with Income Above $100,000 in the United States is 37.3%.