Zip Codes with the Highest Percentage of Households with Income Above $100,000 in Battle Creek, MI
RELATED REPORTS & OPTIONS
Household Income | $100k+
Battle Creek
Compare Zip Codes
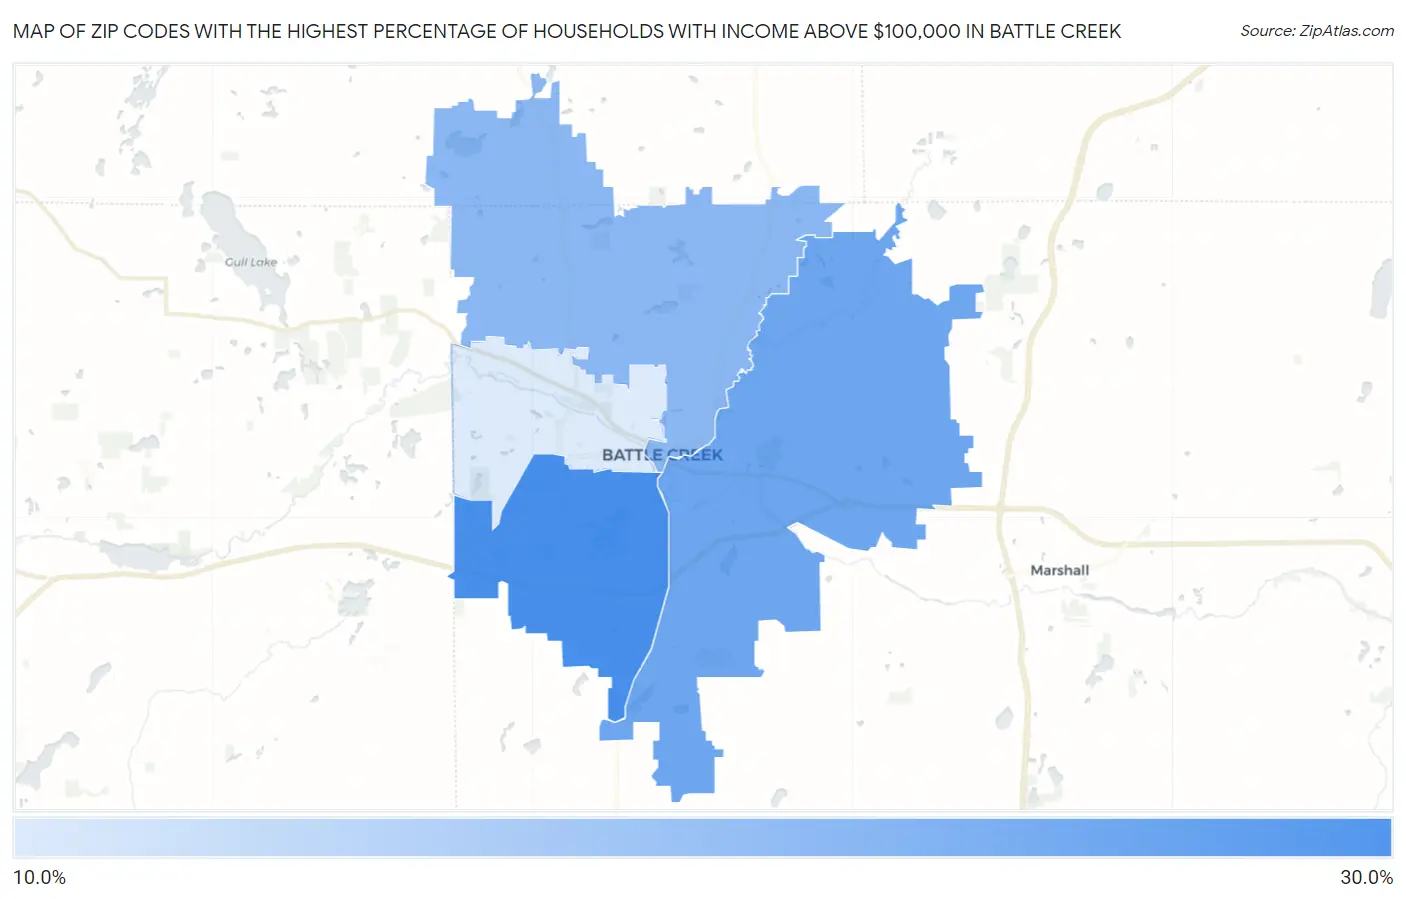
Map of Zip Codes with the Highest Percentage of Households with Income Above $100,000 in Battle Creek
11.6%
29.5%
Zip Codes with the Highest Percentage of Households with Income Above $100,000 in Battle Creek, MI
| Zip Code | Households with Income > $100k | vs State | vs National | |
| 1. | 49015 | 29.5% | 32.5%(-3.00)#420 | 37.3%(-7.80)#15,828 |
| 2. | 49014 | 24.7% | 32.5%(-7.80)#547 | 37.3%(-12.6)#20,009 |
| 3. | 49017 | 21.3% | 32.5%(-11.2)#652 | 37.3%(-16.0)#22,985 |
| 4. | 49037 | 11.6% | 32.5%(-20.9)#899 | 37.3%(-25.7)#29,182 |
1
Common Questions
What are the Top 3 Zip Codes with the Highest Percentage of Households with Income Above $100,000 in Battle Creek, MI?
Top 3 Zip Codes with the Highest Percentage of Households with Income Above $100,000 in Battle Creek, MI are:
What zip code has the Highest Percentage of Households with Income Above $100,000 in Battle Creek, MI?
49015 has the Highest Percentage of Households with Income Above $100,000 in Battle Creek, MI with 29.5%.
What is the Percentage of Households with Income Above $100,000 in Battle Creek, MI?
Percentage of Households with Income Above $100,000 in Battle Creek is 20.5%.
What is the Percentage of Households with Income Above $100,000 in Michigan?
Percentage of Households with Income Above $100,000 in Michigan is 32.5%.
What is the Percentage of Households with Income Above $100,000 in the United States?
Percentage of Households with Income Above $100,000 in the United States is 37.3%.