Saline, MI Map & Demographics
Saline Map
Saline Overview
$44,741
PER CAPITA INCOME
$111,977
AVG FAMILY INCOME
$88,388
AVG HOUSEHOLD INCOME
11.2%
WAGE / INCOME GAP [ % ]
88.8¢/ $1
WAGE / INCOME GAP [ $ ]
$10,892
FAMILY INCOME DEFICIT
0.38
INEQUALITY / GINI INDEX
8,973
TOTAL POPULATION
4,429
MALE POPULATION
4,544
FEMALE POPULATION
97.47
MALES / 100 FEMALES
102.60
FEMALES / 100 MALES
44.6
MEDIAN AGE
2.8
AVG FAMILY SIZE
2.4
AVG HOUSEHOLD SIZE
4,567
LABOR FORCE [ PEOPLE ]
61.3%
PERCENT IN LABOR FORCE
5.7%
UNEMPLOYMENT RATE
Saline Zip Codes
Saline Area Codes
Income in Saline
Income Overview in Saline
Per Capita Income in Saline is $44,741, while median incomes of families and households are $111,977 and $88,388 respectively.
| Characteristic | Number | Measure |
| Per Capita Income | 8,973 | $44,741 |
| Median Family Income | 2,425 | $111,977 |
| Mean Family Income | 2,425 | $126,381 |
| Median Household Income | 3,737 | $88,388 |
| Mean Household Income | 3,737 | $104,614 |
| Income Deficit | 2,425 | $10,892 |
| Wage / Income Gap (%) | 8,973 | 11.24% |
| Wage / Income Gap ($) | 8,973 | 88.76¢ per $1 |
| Gini / Inequality Index | 8,973 | 0.38 |
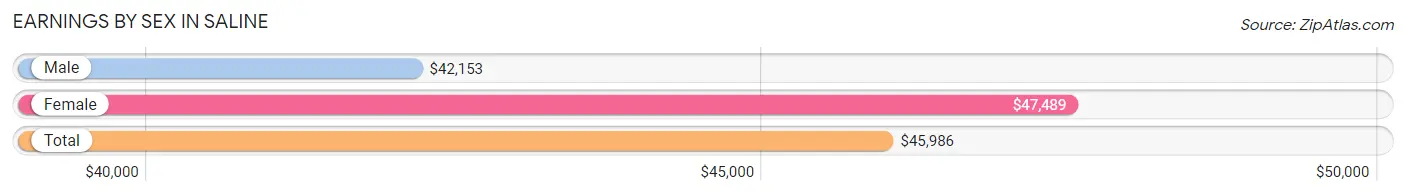
Earnings by Sex in Saline
Average Earnings in Saline are $45,986, $42,153 for men and $47,489 for women, a difference of 11.2%.
| Sex | Number | Average Earnings |
| Male | 2,737 (54.5%) | $42,153 |
| Female | 2,289 (45.5%) | $47,489 |
| Total | 5,026 (100.0%) | $45,986 |
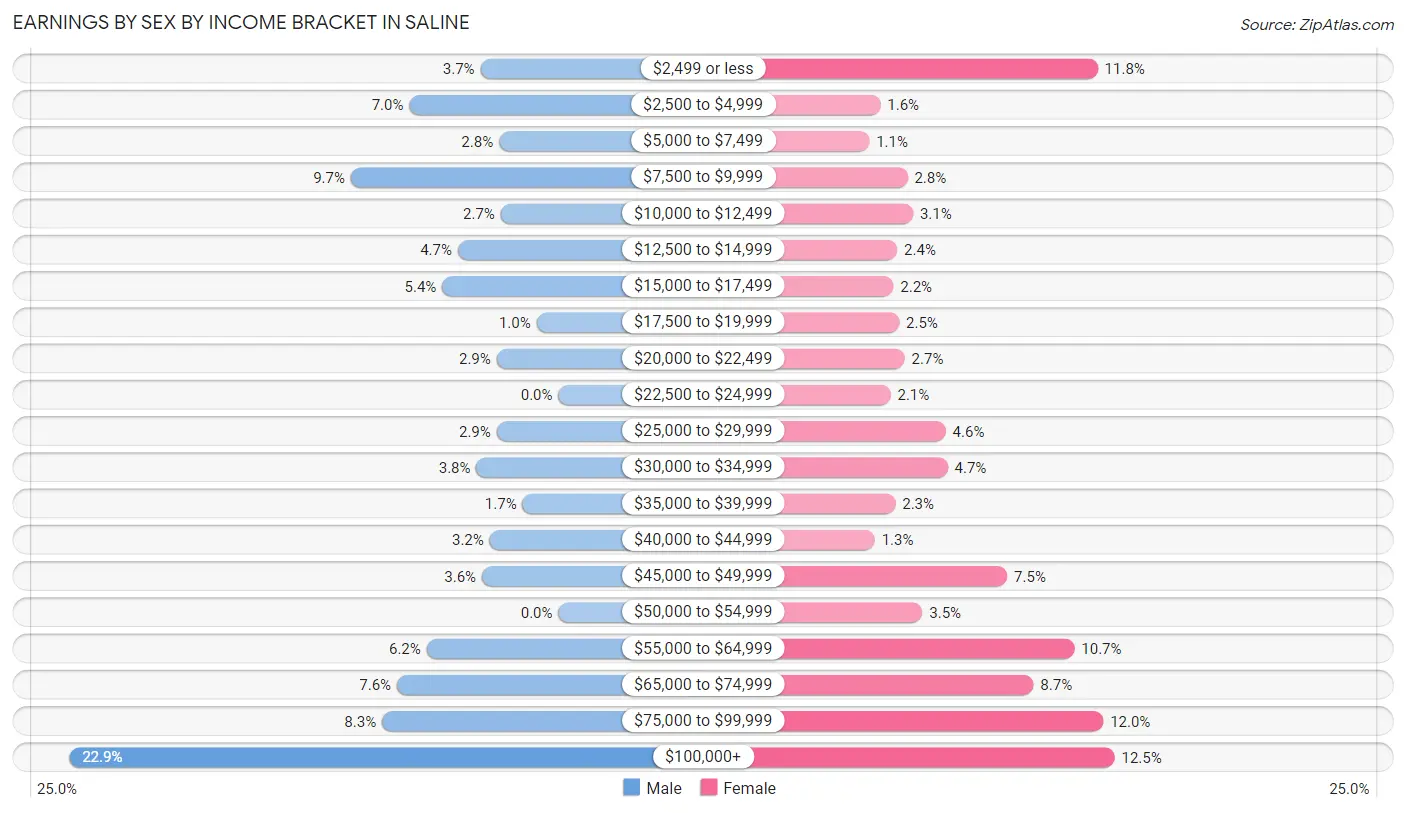
Earnings by Sex by Income Bracket in Saline
The most common earnings brackets in Saline are $100,000+ for men (627 | 22.9%) and $100,000+ for women (287 | 12.5%).
| Income | Male | Female |
| $2,499 or less | 100 (3.6%) | 269 (11.7%) |
| $2,500 to $4,999 | 191 (7.0%) | 36 (1.6%) |
| $5,000 to $7,499 | 76 (2.8%) | 24 (1.1%) |
| $7,500 to $9,999 | 266 (9.7%) | 65 (2.8%) |
| $10,000 to $12,499 | 74 (2.7%) | 71 (3.1%) |
| $12,500 to $14,999 | 129 (4.7%) | 54 (2.4%) |
| $15,000 to $17,499 | 149 (5.4%) | 50 (2.2%) |
| $17,500 to $19,999 | 28 (1.0%) | 56 (2.5%) |
| $20,000 to $22,499 | 79 (2.9%) | 62 (2.7%) |
| $22,500 to $24,999 | 0 (0.0%) | 47 (2.1%) |
| $25,000 to $29,999 | 79 (2.9%) | 106 (4.6%) |
| $30,000 to $34,999 | 105 (3.8%) | 108 (4.7%) |
| $35,000 to $39,999 | 46 (1.7%) | 52 (2.3%) |
| $40,000 to $44,999 | 88 (3.2%) | 30 (1.3%) |
| $45,000 to $49,999 | 98 (3.6%) | 172 (7.5%) |
| $50,000 to $54,999 | 0 (0.0%) | 81 (3.5%) |
| $55,000 to $64,999 | 169 (6.2%) | 244 (10.7%) |
| $65,000 to $74,999 | 207 (7.6%) | 200 (8.7%) |
| $75,000 to $99,999 | 226 (8.3%) | 275 (12.0%) |
| $100,000+ | 627 (22.9%) | 287 (12.5%) |
| Total | 2,737 (100.0%) | 2,289 (100.0%) |
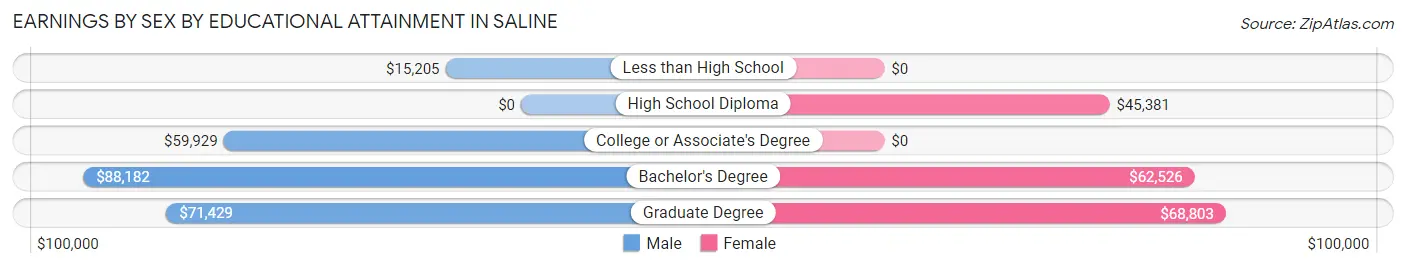
Earnings by Sex by Educational Attainment in Saline
Average earnings in Saline are $61,667 for men and $50,714 for women, a difference of 17.8%. Men with an educational attainment of bachelor's degree enjoy the highest average annual earnings of $88,182, while those with less than high school education earn the least with $15,205. Women with an educational attainment of graduate degree earn the most with the average annual earnings of $68,803, while those with high school diploma education have the smallest earnings of $45,381.
| Educational Attainment | Male Income | Female Income |
| Less than High School | $15,205 | $0 |
| High School Diploma | - | - |
| College or Associate's Degree | $59,929 | $0 |
| Bachelor's Degree | $88,182 | $62,526 |
| Graduate Degree | $71,429 | $68,803 |
| Total | $61,667 | $50,714 |
Family Income in Saline
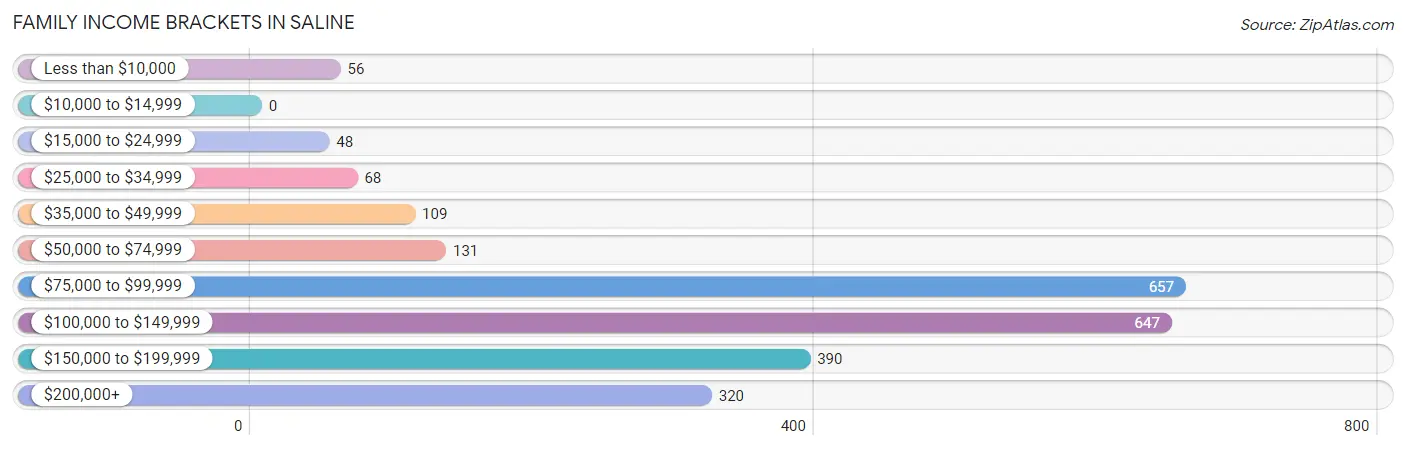
Family Income Brackets in Saline
According to the Saline family income data, there are 657 families falling into the $75,000 to $99,999 income range, which is the most common income bracket and makes up 27.1% of all families.
| Income Bracket | # Families | % Families |
| Less than $10,000 | 56 | 2.3% |
| $10,000 to $14,999 | 0 | 0.0% |
| $15,000 to $24,999 | 48 | 2.0% |
| $25,000 to $34,999 | 68 | 2.8% |
| $35,000 to $49,999 | 109 | 4.5% |
| $50,000 to $74,999 | 131 | 5.4% |
| $75,000 to $99,999 | 657 | 27.1% |
| $100,000 to $149,999 | 647 | 26.7% |
| $150,000 to $199,999 | 390 | 16.1% |
| $200,000+ | 320 | 13.2% |
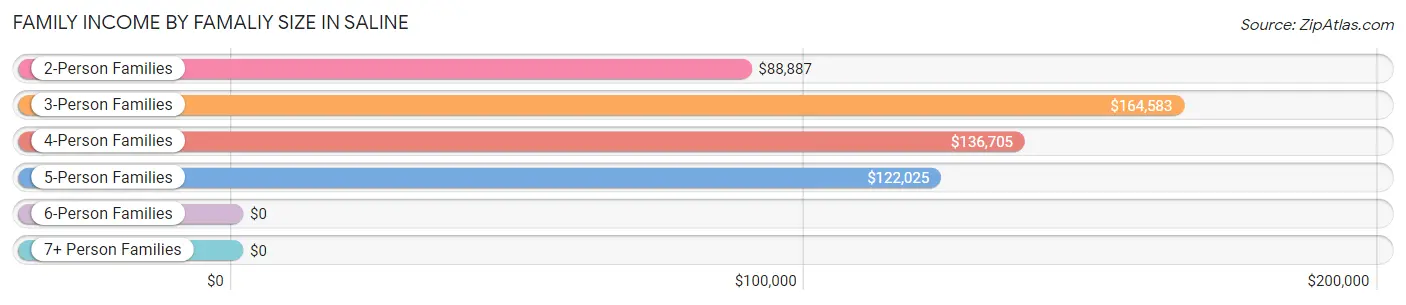
Family Income by Famaliy Size in Saline
3-person families (434 | 17.9%) account for the highest median family income in Saline with $164,583 per family, while 3-person families (434 | 17.9%) have the highest median income of $54,861 per family member.
| Income Bracket | # Families | Median Income |
| 2-Person Families | 1,323 (54.6%) | $88,887 |
| 3-Person Families | 434 (17.9%) | $164,583 |
| 4-Person Families | 500 (20.6%) | $136,705 |
| 5-Person Families | 135 (5.6%) | $122,025 |
| 6-Person Families | 33 (1.4%) | $0 |
| 7+ Person Families | 0 (0.0%) | $0 |
| Total | 2,425 (100.0%) | $111,977 |
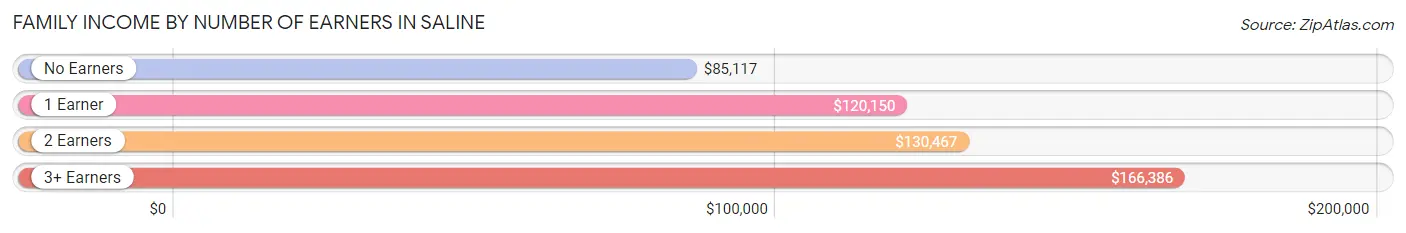
Family Income by Number of Earners in Saline
The median family income in Saline is $111,977, with families comprising 3+ earners (311) having the highest median family income of $166,386, while families with no earners (417) have the lowest median family income of $85,117, accounting for 12.8% and 17.2% of families, respectively.
| Number of Earners | # Families | Median Income |
| No Earners | 417 (17.2%) | $85,117 |
| 1 Earner | 654 (27.0%) | $120,150 |
| 2 Earners | 1,043 (43.0%) | $130,467 |
| 3+ Earners | 311 (12.8%) | $166,386 |
| Total | 2,425 (100.0%) | $111,977 |
Household Income in Saline
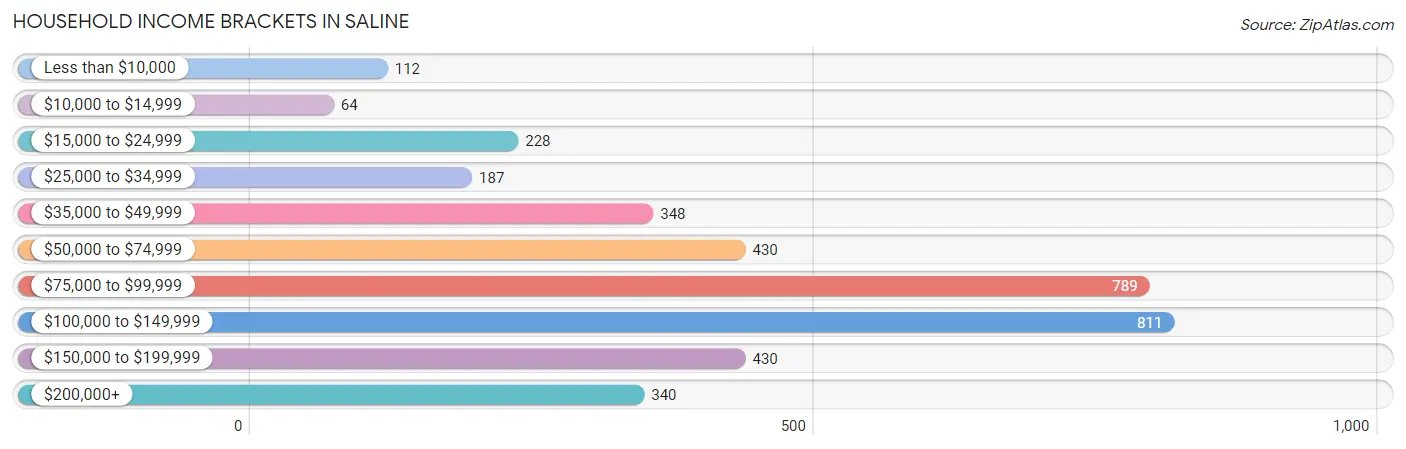
Household Income Brackets in Saline
With 811 households falling in the category, the $100,000 to $149,999 income range is the most frequent in Saline, accounting for 21.7% of all households. In contrast, only 64 households (1.7%) fall into the $10,000 to $14,999 income bracket, making it the least populous group.
| Income Bracket | # Households | % Households |
| Less than $10,000 | 112 | 3.0% |
| $10,000 to $14,999 | 64 | 1.7% |
| $15,000 to $24,999 | 228 | 6.1% |
| $25,000 to $34,999 | 187 | 5.0% |
| $35,000 to $49,999 | 348 | 9.3% |
| $50,000 to $74,999 | 430 | 11.5% |
| $75,000 to $99,999 | 789 | 21.1% |
| $100,000 to $149,999 | 811 | 21.7% |
| $150,000 to $199,999 | 430 | 11.5% |
| $200,000+ | 340 | 9.1% |
Household Income by Householder Age in Saline
The median household income in Saline is $88,388, with the highest median household income of $121,292 found in the 45 to 64 years age bracket for the primary householder. A total of 1,235 households (33.1%) fall into this category. Meanwhile, the 15 to 24 years age bracket for the primary householder has the lowest median household income of $41,449, with 125 households (3.3%) in this group.
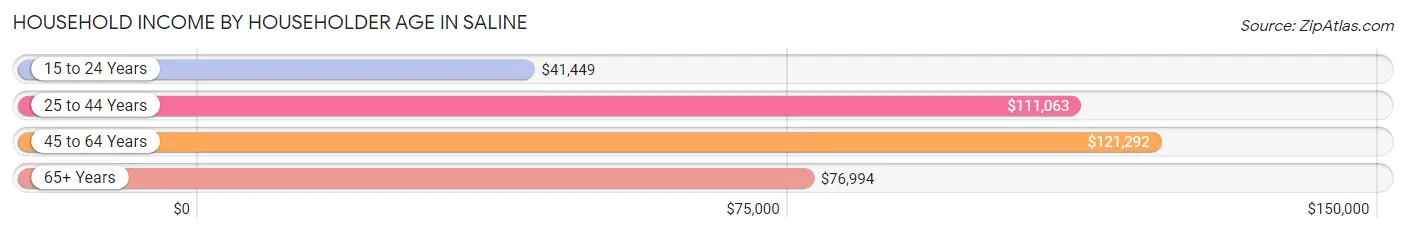
| Income Bracket | # Households | Median Income |
| 15 to 24 Years | 125 (3.3%) | $41,449 |
| 25 to 44 Years | 885 (23.7%) | $111,063 |
| 45 to 64 Years | 1,235 (33.1%) | $121,292 |
| 65+ Years | 1,492 (39.9%) | $76,994 |
| Total | 3,737 (100.0%) | $88,388 |
Poverty in Saline
Income Below Poverty by Sex and Age in Saline
With 4.6% poverty level for males and 5.6% for females among the residents of Saline, 12 to 14 year old males and 16 and 17 year old females are the most vulnerable to poverty, with 14 males (14.6%) and 14 females (19.2%) in their respective age groups living below the poverty level.
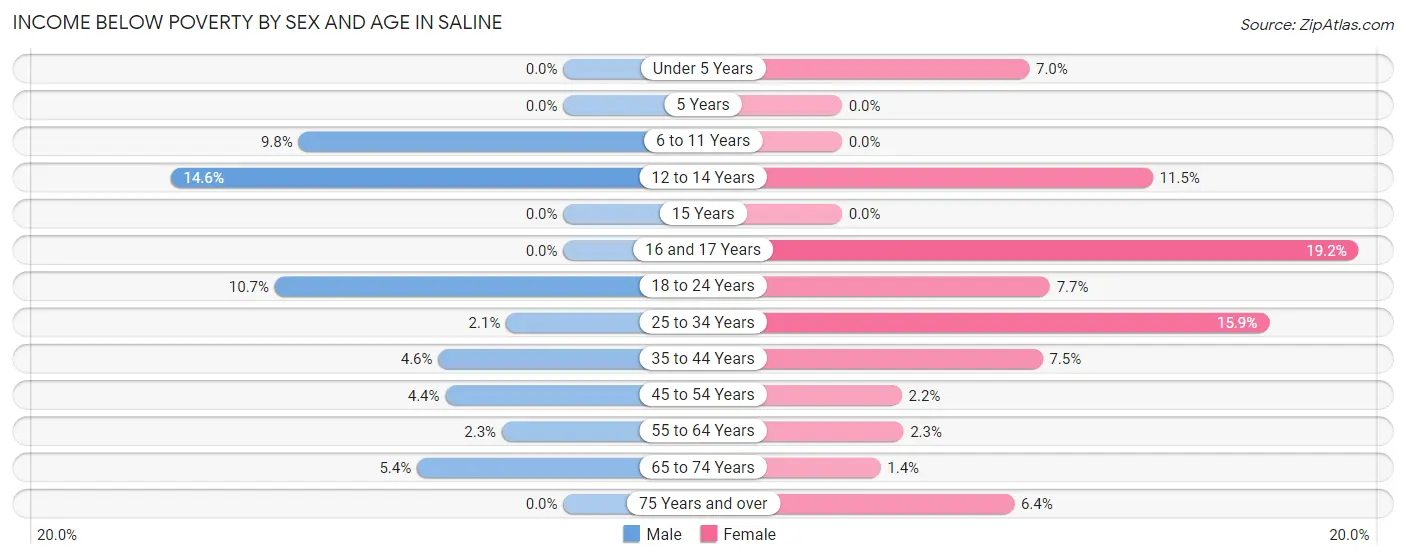
| Age Bracket | Male | Female |
| Under 5 Years | 0 (0.0%) | 26 (7.0%) |
| 5 Years | 0 (0.0%) | 0 (0.0%) |
| 6 to 11 Years | 35 (9.8%) | 0 (0.0%) |
| 12 to 14 Years | 14 (14.6%) | 15 (11.5%) |
| 15 Years | 0 (0.0%) | 0 (0.0%) |
| 16 and 17 Years | 0 (0.0%) | 14 (19.2%) |
| 18 to 24 Years | 50 (10.7%) | 19 (7.7%) |
| 25 to 34 Years | 9 (2.1%) | 59 (15.9%) |
| 35 to 44 Years | 28 (4.6%) | 51 (7.4%) |
| 45 to 54 Years | 18 (4.4%) | 13 (2.2%) |
| 55 to 64 Years | 14 (2.3%) | 10 (2.3%) |
| 65 to 74 Years | 36 (5.4%) | 10 (1.4%) |
| 75 Years and over | 0 (0.0%) | 31 (6.4%) |
| Total | 204 (4.6%) | 248 (5.6%) |
Income Above Poverty by Sex and Age in Saline
According to the poverty statistics in Saline, males aged under 5 years and females aged 5 years are the age groups that are most secure financially, with 100.0% of males and 100.0% of females in these age groups living above the poverty line.
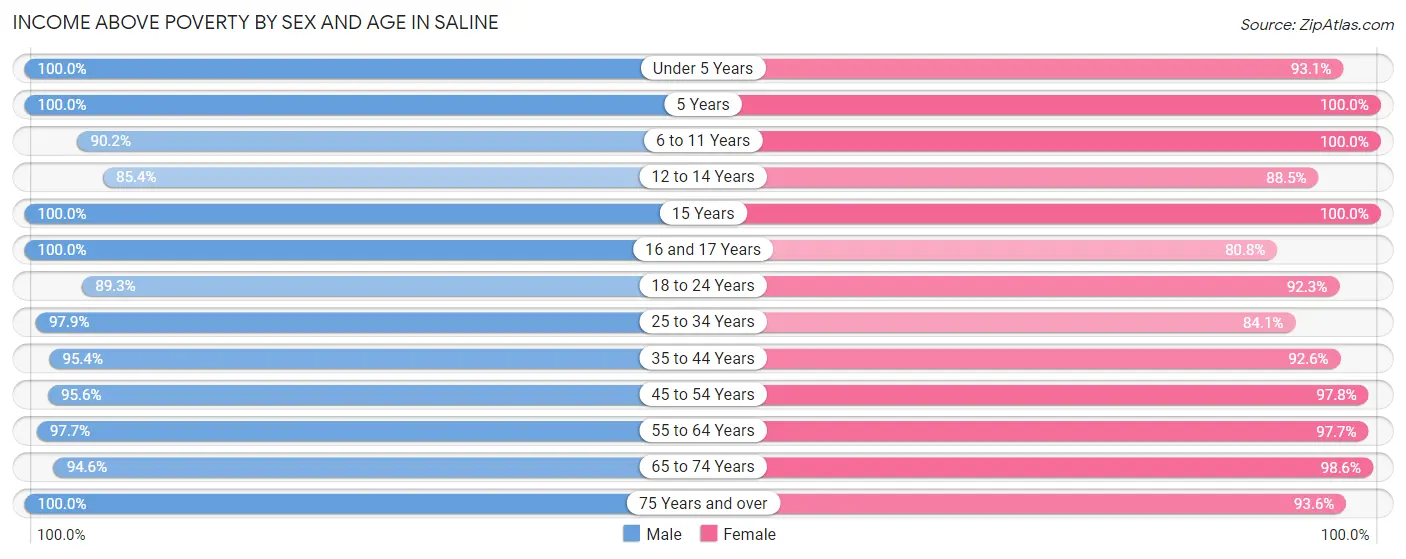
| Age Bracket | Male | Female |
| Under 5 Years | 234 (100.0%) | 348 (93.0%) |
| 5 Years | 18 (100.0%) | 49 (100.0%) |
| 6 to 11 Years | 321 (90.2%) | 226 (100.0%) |
| 12 to 14 Years | 82 (85.4%) | 115 (88.5%) |
| 15 Years | 7 (100.0%) | 33 (100.0%) |
| 16 and 17 Years | 120 (100.0%) | 59 (80.8%) |
| 18 to 24 Years | 417 (89.3%) | 227 (92.3%) |
| 25 to 34 Years | 416 (97.9%) | 313 (84.1%) |
| 35 to 44 Years | 576 (95.4%) | 634 (92.5%) |
| 45 to 54 Years | 393 (95.6%) | 573 (97.8%) |
| 55 to 64 Years | 601 (97.7%) | 429 (97.7%) |
| 65 to 74 Years | 627 (94.6%) | 691 (98.6%) |
| 75 Years and over | 376 (100.0%) | 454 (93.6%) |
| Total | 4,188 (95.4%) | 4,151 (94.4%) |
Income Below Poverty Among Married-Couple Families in Saline
The poverty statistics for married-couple families in Saline show that 2.2% or 43 of the total 1,992 families live below the poverty line. Families with 1 or 2 children have the highest poverty rate of 5.4%, comprising of 33 families. On the other hand, families with 3 or 4 children have the lowest poverty rate of 0.0%, which includes 0 families.
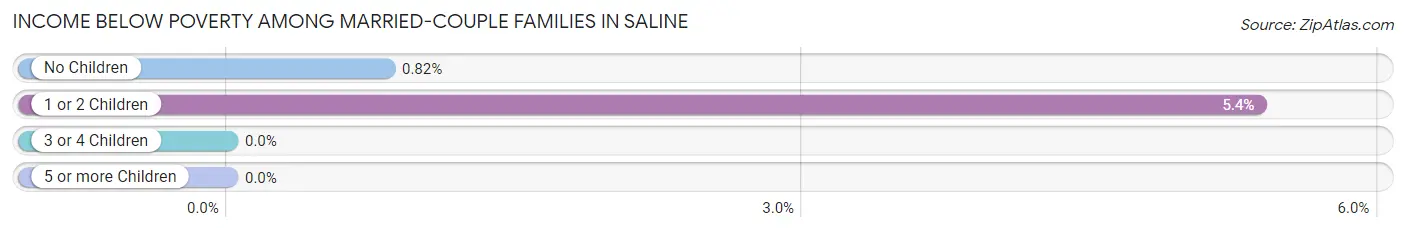
| Children | Above Poverty | Below Poverty |
| No Children | 1,214 (99.2%) | 10 (0.8%) |
| 1 or 2 Children | 582 (94.6%) | 33 (5.4%) |
| 3 or 4 Children | 153 (100.0%) | 0 (0.0%) |
| 5 or more Children | 0 (0.0%) | 0 (0.0%) |
| Total | 1,949 (97.8%) | 43 (2.2%) |
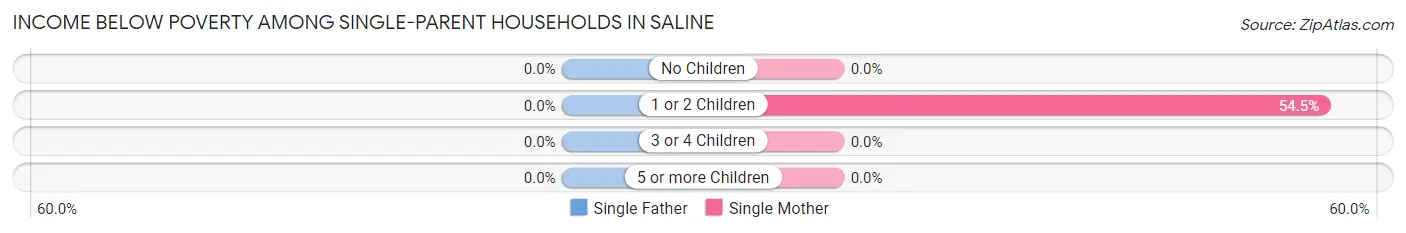
Income Below Poverty Among Single-Parent Households in Saline
| Children | Single Father | Single Mother |
| No Children | 0 (0.0%) | 0 (0.0%) |
| 1 or 2 Children | 0 (0.0%) | 61 (54.5%) |
| 3 or 4 Children | 0 (0.0%) | 0 (0.0%) |
| 5 or more Children | 0 (0.0%) | 0 (0.0%) |
| Total | 0 (0.0%) | 61 (19.1%) |
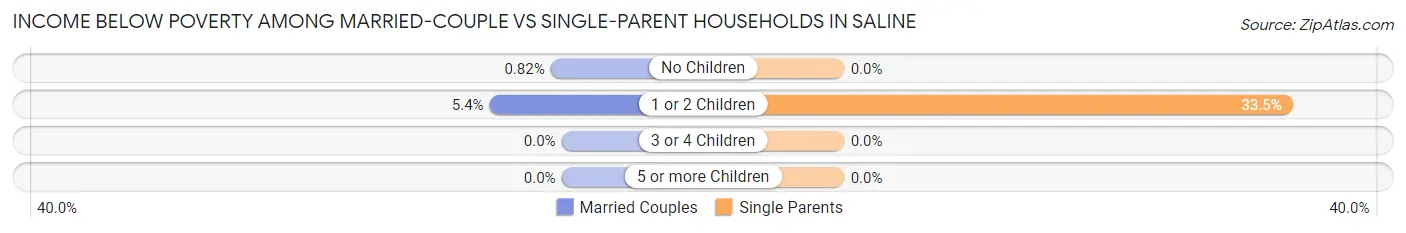
Income Below Poverty Among Married-Couple vs Single-Parent Households in Saline
The poverty data for Saline shows that 43 of the married-couple family households (2.2%) and 61 of the single-parent households (14.1%) are living below the poverty level. Within the married-couple family households, those with 1 or 2 children have the highest poverty rate, with 33 households (5.4%) falling below the poverty line. Among the single-parent households, those with 1 or 2 children have the highest poverty rate, with 61 household (33.5%) living below poverty.
| Children | Married-Couple Families | Single-Parent Households |
| No Children | 10 (0.8%) | 0 (0.0%) |
| 1 or 2 Children | 33 (5.4%) | 61 (33.5%) |
| 3 or 4 Children | 0 (0.0%) | 0 (0.0%) |
| 5 or more Children | 0 (0.0%) | 0 (0.0%) |
| Total | 43 (2.2%) | 61 (14.1%) |
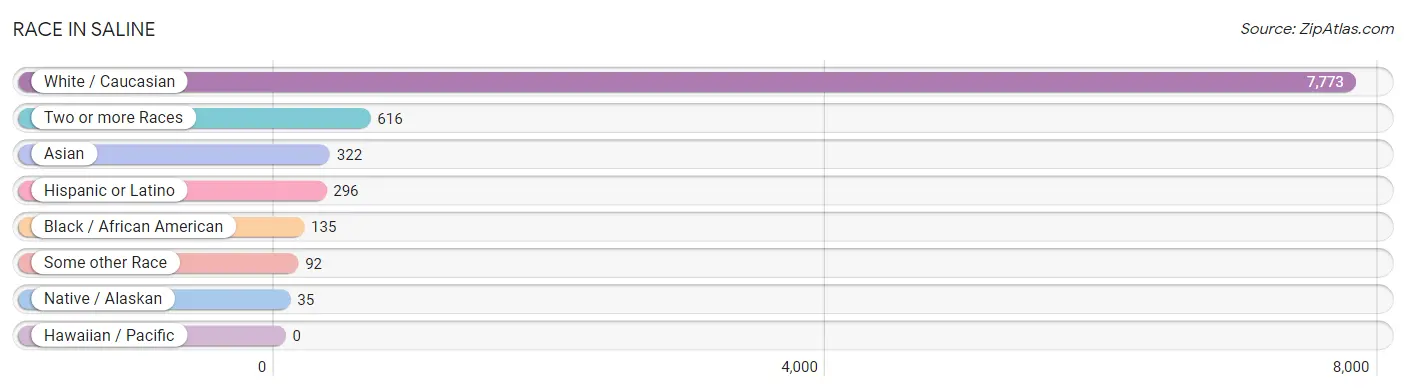
Race in Saline
The most populous races in Saline are White / Caucasian (7,773 | 86.6%), Two or more Races (616 | 6.9%), and Asian (322 | 3.6%).
| Race | # Population | % Population |
| Asian | 322 | 3.6% |
| Black / African American | 135 | 1.5% |
| Hawaiian / Pacific | 0 | 0.0% |
| Hispanic or Latino | 296 | 3.3% |
| Native / Alaskan | 35 | 0.4% |
| White / Caucasian | 7,773 | 86.6% |
| Two or more Races | 616 | 6.9% |
| Some other Race | 92 | 1.0% |
| Total | 8,973 | 100.0% |
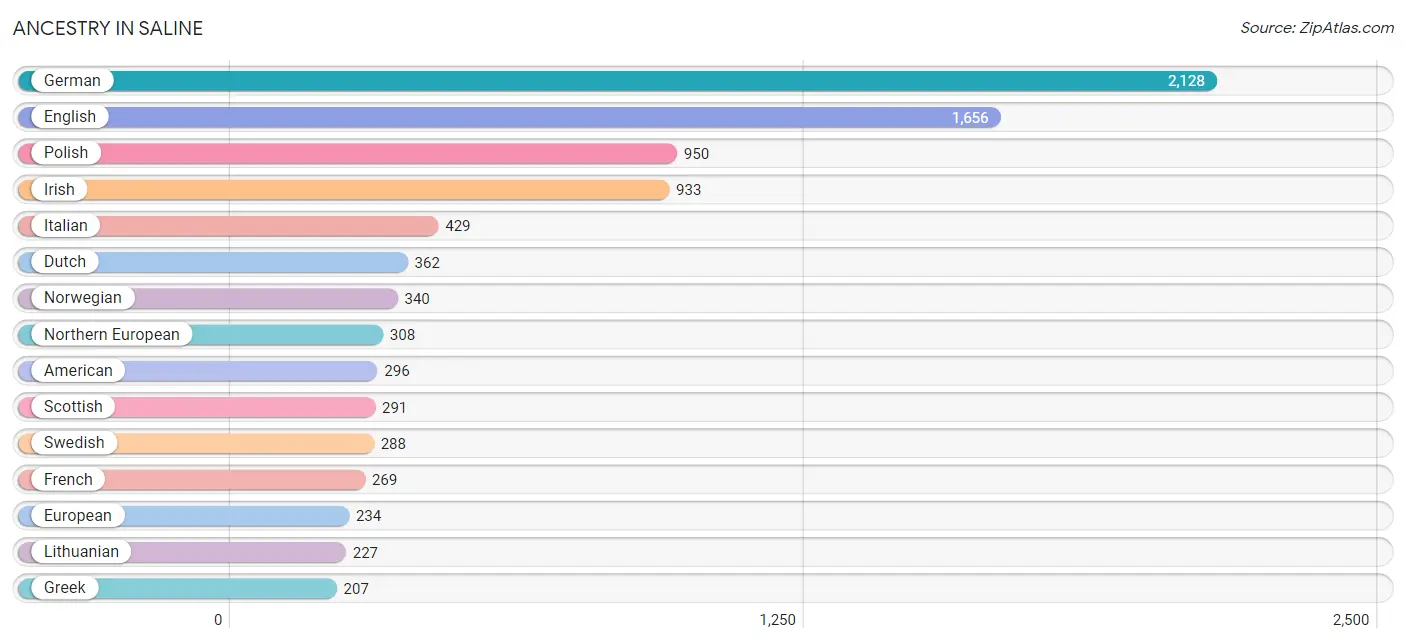
Ancestry in Saline
The most populous ancestries reported in Saline are German (2,128 | 23.7%), English (1,656 | 18.5%), Polish (950 | 10.6%), Irish (933 | 10.4%), and Italian (429 | 4.8%), together accounting for 67.9% of all Saline residents.
| Ancestry | # Population | % Population |
| African | 115 | 1.3% |
| American | 296 | 3.3% |
| Arab | 38 | 0.4% |
| Austrian | 92 | 1.0% |
| Belgian | 36 | 0.4% |
| Bhutanese | 47 | 0.5% |
| Brazilian | 20 | 0.2% |
| British | 127 | 1.4% |
| Canadian | 16 | 0.2% |
| Cherokee | 5 | 0.1% |
| Chippewa | 5 | 0.1% |
| Croatian | 18 | 0.2% |
| Czech | 97 | 1.1% |
| Czechoslovakian | 11 | 0.1% |
| Danish | 32 | 0.4% |
| Dutch | 362 | 4.0% |
| Eastern European | 8 | 0.1% |
| English | 1,656 | 18.5% |
| European | 234 | 2.6% |
| Finnish | 34 | 0.4% |
| French | 269 | 3.0% |
| French Canadian | 119 | 1.3% |
| German | 2,128 | 23.7% |
| Greek | 207 | 2.3% |
| Hungarian | 118 | 1.3% |
| Icelander | 34 | 0.4% |
| Indian (Asian) | 62 | 0.7% |
| Iranian | 24 | 0.3% |
| Iraqi | 18 | 0.2% |
| Irish | 933 | 10.4% |
| Italian | 429 | 4.8% |
| Korean | 80 | 0.9% |
| Lithuanian | 227 | 2.5% |
| Menominee | 5 | 0.1% |
| Mexican | 88 | 1.0% |
| Northern European | 308 | 3.4% |
| Norwegian | 340 | 3.8% |
| Peruvian | 13 | 0.1% |
| Polish | 950 | 10.6% |
| Puerto Rican | 33 | 0.4% |
| Romanian | 156 | 1.7% |
| Russian | 196 | 2.2% |
| Scotch-Irish | 27 | 0.3% |
| Scottish | 291 | 3.2% |
| Seminole | 8 | 0.1% |
| Slavic | 10 | 0.1% |
| Slovak | 7 | 0.1% |
| Slovene | 7 | 0.1% |
| South American | 175 | 1.9% |
| Sri Lankan | 112 | 1.3% |
| Subsaharan African | 115 | 1.3% |
| Swedish | 288 | 3.2% |
| Swiss | 46 | 0.5% |
| Thai | 96 | 1.1% |
| Ukrainian | 19 | 0.2% |
| Venezuelan | 8 | 0.1% |
| Welsh | 60 | 0.7% |
| Yugoslavian | 8 | 0.1% | View All 58 Rows |
Immigrants in Saline
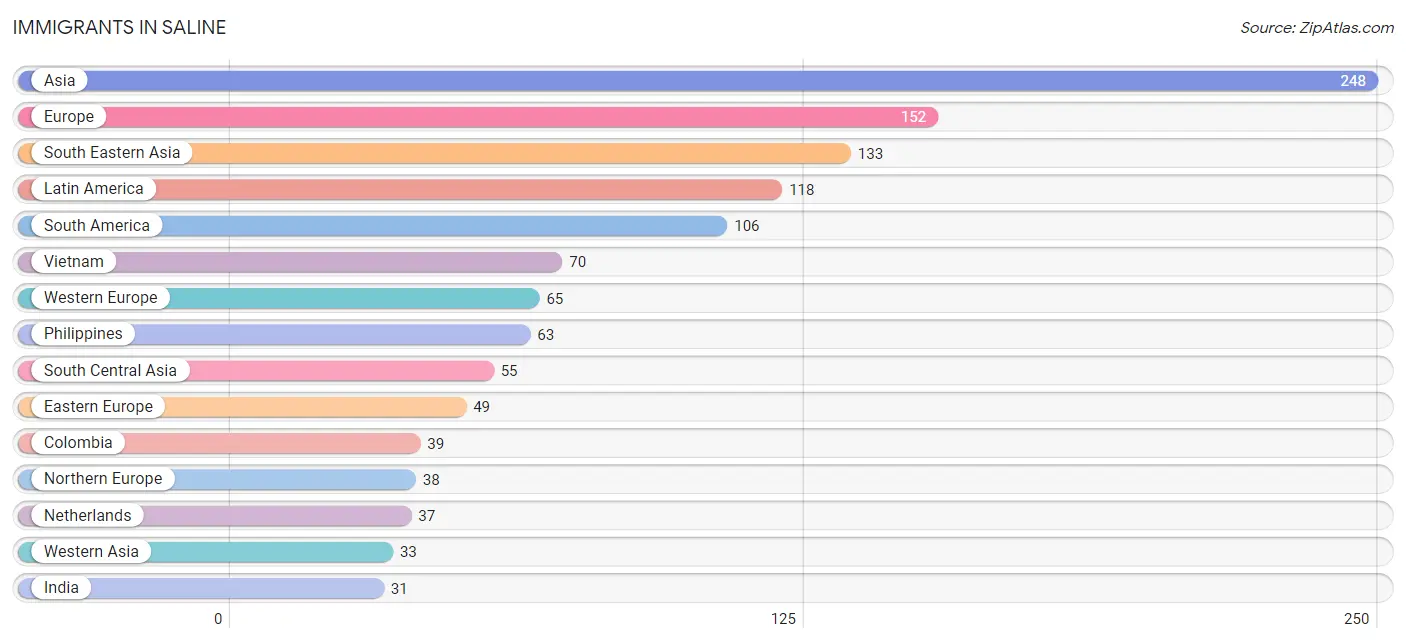
The most numerous immigrant groups reported in Saline came from Asia (248 | 2.8%), Europe (152 | 1.7%), South Eastern Asia (133 | 1.5%), Latin America (118 | 1.3%), and South America (106 | 1.2%), together accounting for 8.4% of all Saline residents.
| Immigration Origin | # Population | % Population |
| Africa | 14 | 0.2% |
| Asia | 248 | 2.8% |
| Brazil | 21 | 0.2% |
| Canada | 19 | 0.2% |
| Central America | 12 | 0.1% |
| China | 27 | 0.3% |
| Colombia | 39 | 0.4% |
| Eastern Africa | 7 | 0.1% |
| Eastern Asia | 27 | 0.3% |
| Eastern Europe | 49 | 0.5% |
| England | 10 | 0.1% |
| Europe | 152 | 1.7% |
| Germany | 22 | 0.3% |
| India | 31 | 0.4% |
| Iran | 24 | 0.3% |
| Iraq | 18 | 0.2% |
| Kenya | 7 | 0.1% |
| Latin America | 118 | 1.3% |
| Lebanon | 15 | 0.2% |
| Mexico | 12 | 0.1% |
| Netherlands | 37 | 0.4% |
| Northern Africa | 7 | 0.1% |
| Northern Europe | 38 | 0.4% |
| Philippines | 63 | 0.7% |
| Poland | 18 | 0.2% |
| Romania | 31 | 0.4% |
| South America | 106 | 1.2% |
| South Central Asia | 55 | 0.6% |
| South Eastern Asia | 133 | 1.5% |
| Switzerland | 6 | 0.1% |
| Venezuela | 8 | 0.1% |
| Vietnam | 70 | 0.8% |
| Western Asia | 33 | 0.4% |
| Western Europe | 65 | 0.7% | View All 34 Rows |
Sex and Age in Saline
Sex and Age in Saline
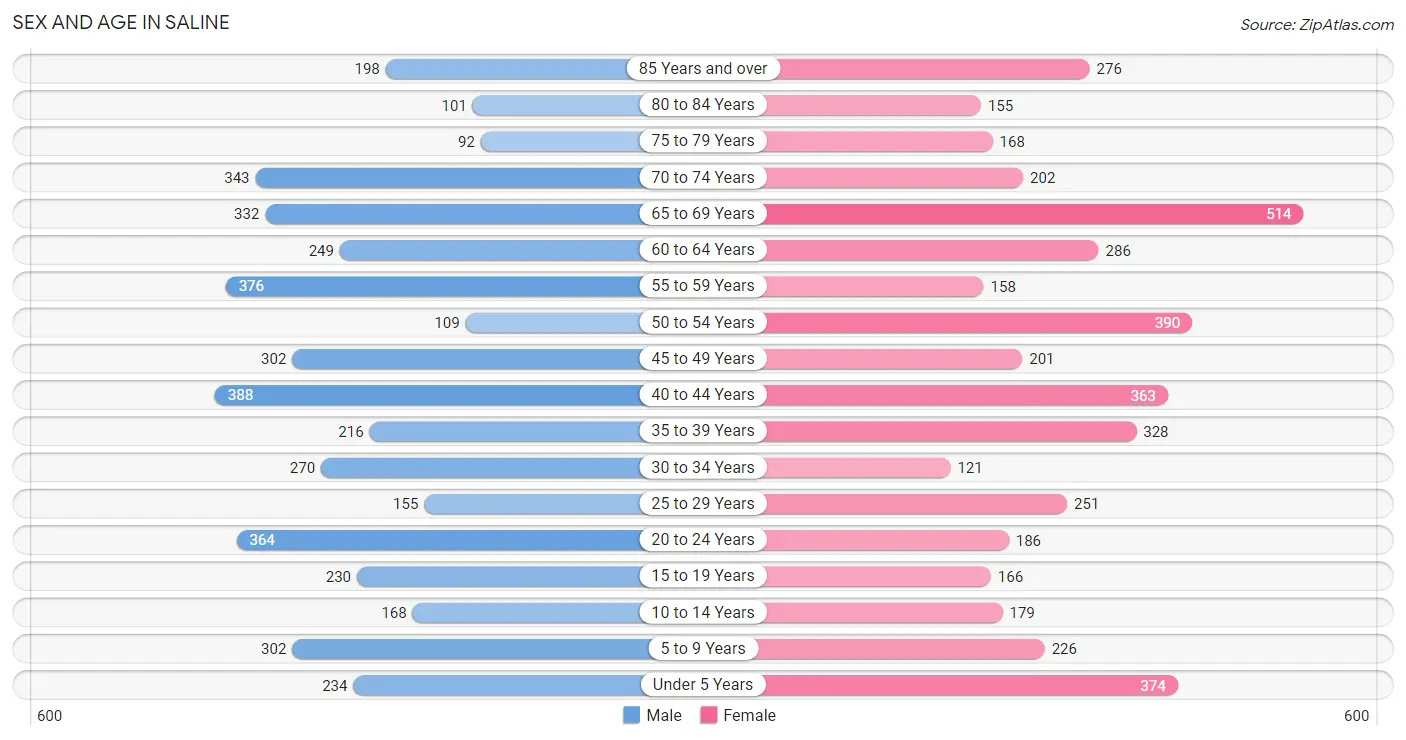
The most populous age groups in Saline are 40 to 44 Years (388 | 8.8%) for men and 65 to 69 Years (514 | 11.3%) for women.
| Age Bracket | Male | Female |
| Under 5 Years | 234 (5.3%) | 374 (8.2%) |
| 5 to 9 Years | 302 (6.8%) | 226 (5.0%) |
| 10 to 14 Years | 168 (3.8%) | 179 (3.9%) |
| 15 to 19 Years | 230 (5.2%) | 166 (3.6%) |
| 20 to 24 Years | 364 (8.2%) | 186 (4.1%) |
| 25 to 29 Years | 155 (3.5%) | 251 (5.5%) |
| 30 to 34 Years | 270 (6.1%) | 121 (2.7%) |
| 35 to 39 Years | 216 (4.9%) | 328 (7.2%) |
| 40 to 44 Years | 388 (8.8%) | 363 (8.0%) |
| 45 to 49 Years | 302 (6.8%) | 201 (4.4%) |
| 50 to 54 Years | 109 (2.5%) | 390 (8.6%) |
| 55 to 59 Years | 376 (8.5%) | 158 (3.5%) |
| 60 to 64 Years | 249 (5.6%) | 286 (6.3%) |
| 65 to 69 Years | 332 (7.5%) | 514 (11.3%) |
| 70 to 74 Years | 343 (7.7%) | 202 (4.4%) |
| 75 to 79 Years | 92 (2.1%) | 168 (3.7%) |
| 80 to 84 Years | 101 (2.3%) | 155 (3.4%) |
| 85 Years and over | 198 (4.5%) | 276 (6.1%) |
| Total | 4,429 (100.0%) | 4,544 (100.0%) |
Families and Households in Saline
Median Family Size in Saline
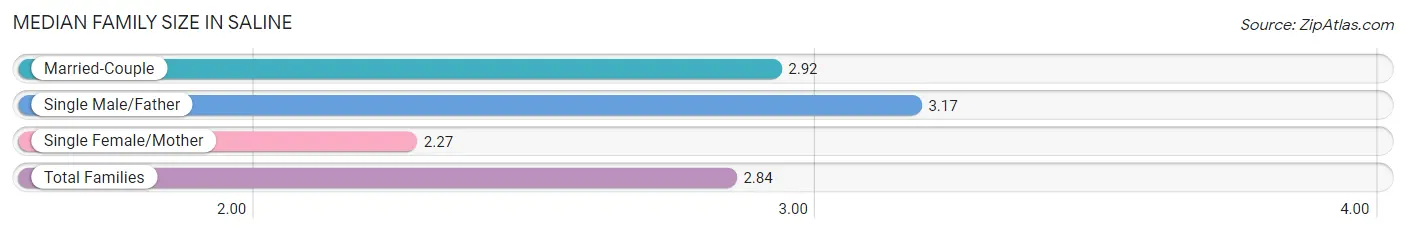
The median family size in Saline is 2.84 persons per family, with single male/father families (114 | 4.7%) accounting for the largest median family size of 3.17 persons per family. On the other hand, single female/mother families (319 | 13.2%) represent the smallest median family size with 2.27 persons per family.
| Family Type | # Families | Family Size |
| Married-Couple | 1,992 (82.1%) | 2.92 |
| Single Male/Father | 114 (4.7%) | 3.17 |
| Single Female/Mother | 319 (13.2%) | 2.27 |
| Total Families | 2,425 (100.0%) | 2.84 |
Median Household Size in Saline
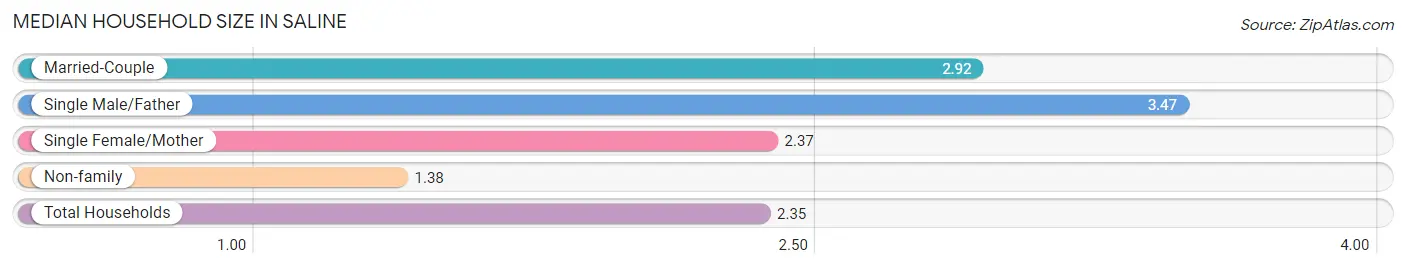
The median household size in Saline is 2.35 persons per household, with single male/father households (114 | 3.0%) accounting for the largest median household size of 3.47 persons per household. non-family households (1,312 | 35.1%) represent the smallest median household size with 1.38 persons per household.
| Household Type | # Households | Household Size |
| Married-Couple | 1,992 (53.3%) | 2.92 |
| Single Male/Father | 114 (3.0%) | 3.47 |
| Single Female/Mother | 319 (8.5%) | 2.37 |
| Non-family | 1,312 (35.1%) | 1.38 |
| Total Households | 3,737 (100.0%) | 2.35 |
Household Size by Marriage Status in Saline
Out of a total of 3,737 households in Saline, 2,425 (64.9%) are family households, while 1,312 (35.1%) are nonfamily households. The most numerous type of family households are 2-person households, comprising 1,323, and the most common type of nonfamily households are 1-person households, comprising 1,083.
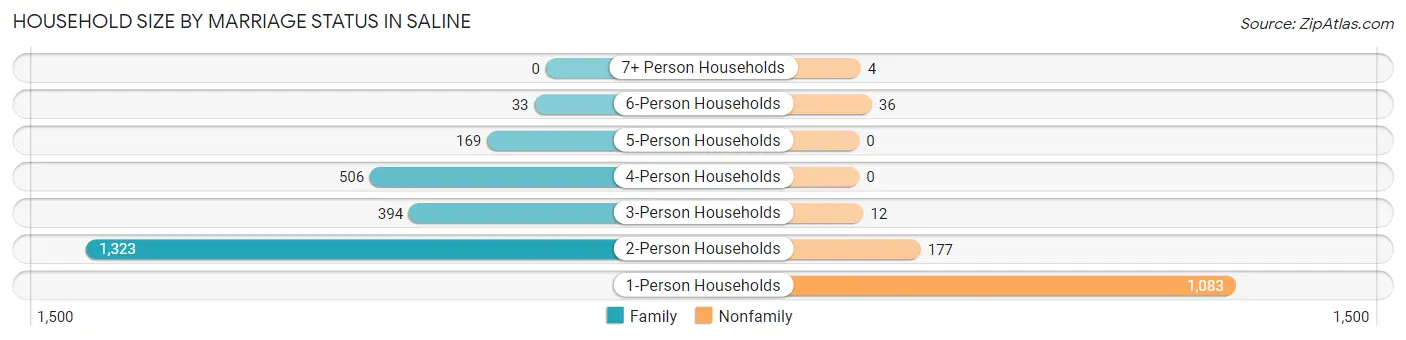
| Household Size | Family Households | Nonfamily Households |
| 1-Person Households | - | 1,083 (29.0%) |
| 2-Person Households | 1,323 (35.4%) | 177 (4.7%) |
| 3-Person Households | 394 (10.5%) | 12 (0.3%) |
| 4-Person Households | 506 (13.5%) | 0 (0.0%) |
| 5-Person Households | 169 (4.5%) | 0 (0.0%) |
| 6-Person Households | 33 (0.9%) | 36 (1.0%) |
| 7+ Person Households | 0 (0.0%) | 4 (0.1%) |
| Total | 2,425 (64.9%) | 1,312 (35.1%) |
Female Fertility in Saline
Fertility by Age in Saline
Average fertility rate in Saline is 82.0 births per 1,000 women. Women in the age bracket of 35 to 50 years have the highest fertility rate with 126.0 births per 1,000 women. Women in the age bracket of 35 to 50 years acount for 90.2% of all women with births.
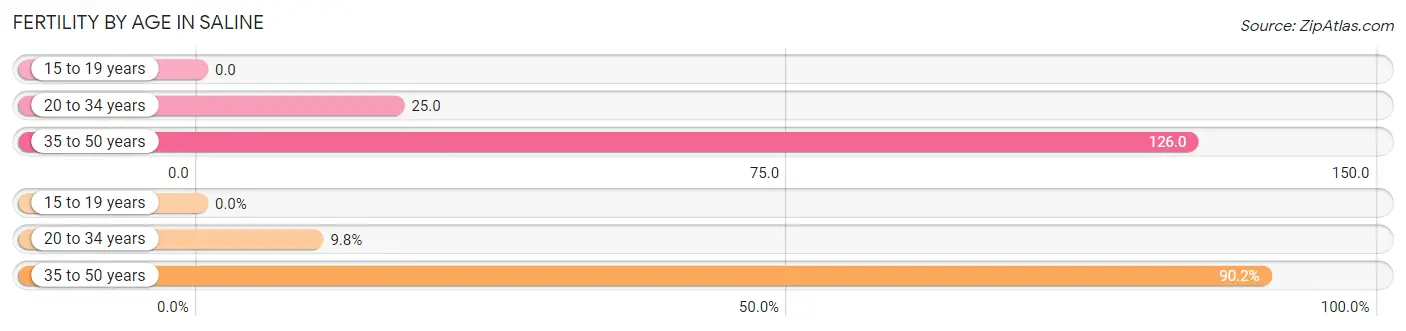
| Age Bracket | Women with Births | Births / 1,000 Women |
| 15 to 19 years | 0 (0.0%) | 0.0 |
| 20 to 34 years | 14 (9.8%) | 25.0 |
| 35 to 50 years | 129 (90.2%) | 126.0 |
| Total | 143 (100.0%) | 82.0 |
Fertility by Age by Marriage Status in Saline
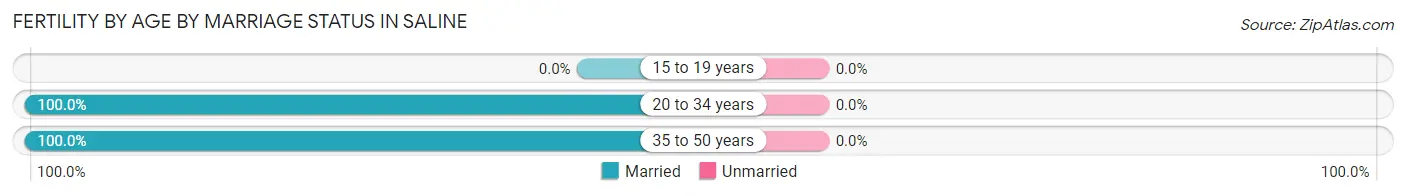
| Age Bracket | Married | Unmarried |
| 15 to 19 years | 0 (0.0%) | 0 (0.0%) |
| 20 to 34 years | 14 (100.0%) | 0 (0.0%) |
| 35 to 50 years | 129 (100.0%) | 0 (0.0%) |
| Total | 143 (100.0%) | 0 (0.0%) |
Fertility by Education in Saline
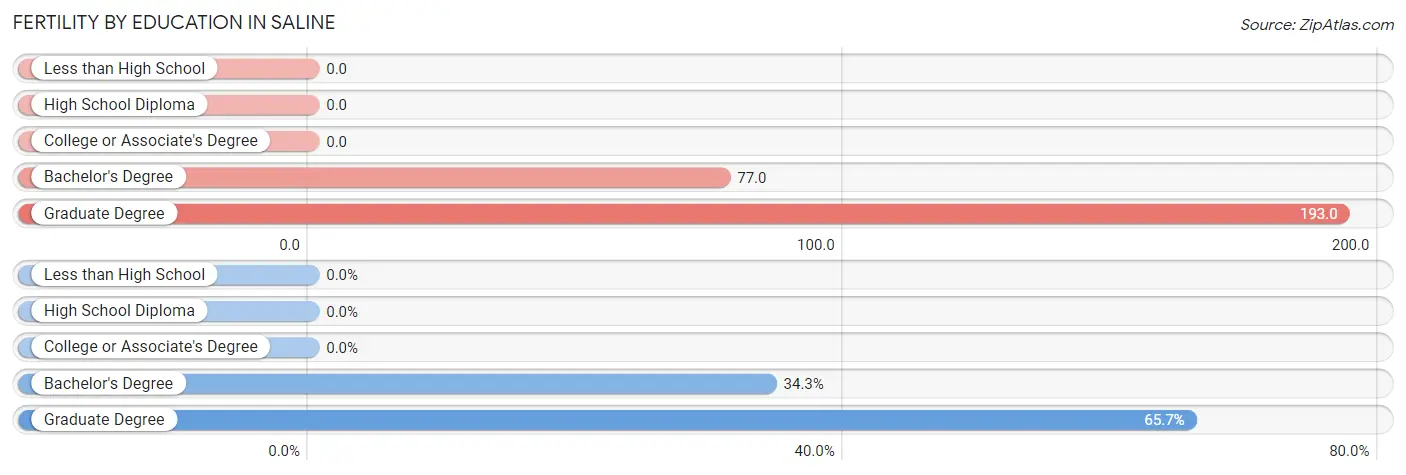
| Educational Attainment | Women with Births | Births / 1,000 Women |
| Less than High School | 0 (0.0%) | 0.0 |
| High School Diploma | 0 (0.0%) | 0.0 |
| College or Associate's Degree | 0 (0.0%) | 0.0 |
| Bachelor's Degree | 49 (34.3%) | 77.0 |
| Graduate Degree | 94 (65.7%) | 193.0 |
| Total | 143 (100.0%) | 82.0 |
Fertility by Education by Marriage Status in Saline
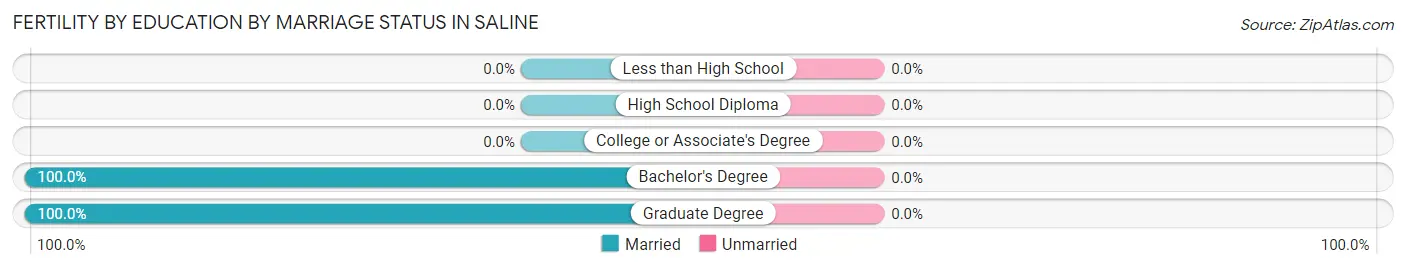
| Educational Attainment | Married | Unmarried |
| Less than High School | 0 (0.0%) | 0 (0.0%) |
| High School Diploma | 0 (0.0%) | 0 (0.0%) |
| College or Associate's Degree | 0 (0.0%) | 0 (0.0%) |
| Bachelor's Degree | 49 (100.0%) | 0 (0.0%) |
| Graduate Degree | 94 (100.0%) | 0 (0.0%) |
| Total | 143 (100.0%) | 0 (0.0%) |
Employment Characteristics in Saline
Employment by Class of Employer in Saline
Among the 4,278 employed individuals in Saline, private company employees (2,825 | 66.0%), not-for-profit organizations (532 | 12.4%), and state government employees (446 | 10.4%) make up the most common classes of employment.
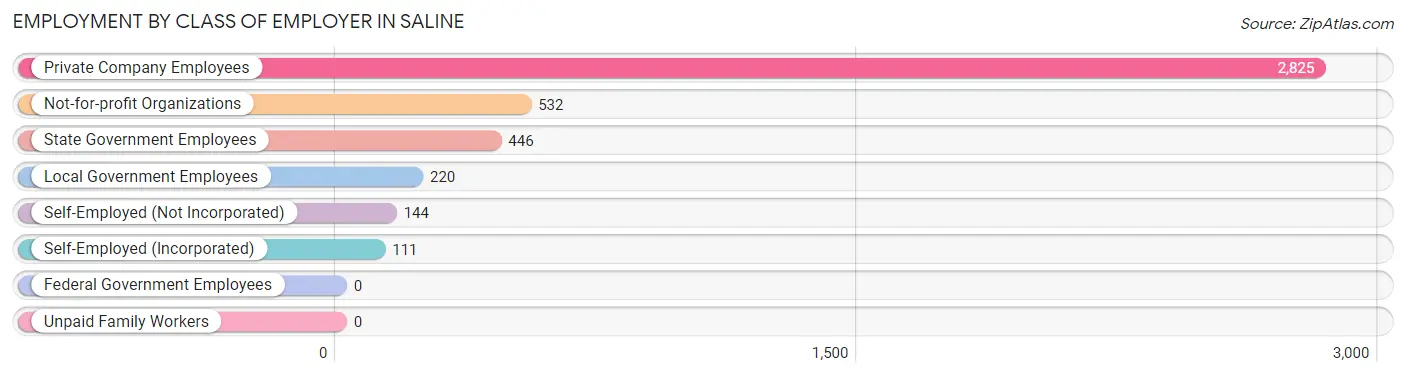
| Employer Class | # Employees | % Employees |
| Private Company Employees | 2,825 | 66.0% |
| Self-Employed (Incorporated) | 111 | 2.6% |
| Self-Employed (Not Incorporated) | 144 | 3.4% |
| Not-for-profit Organizations | 532 | 12.4% |
| Local Government Employees | 220 | 5.1% |
| State Government Employees | 446 | 10.4% |
| Federal Government Employees | 0 | 0.0% |
| Unpaid Family Workers | 0 | 0.0% |
| Total | 4,278 | 100.0% |
Employment Status by Age in Saline
According to the labor force statistics for Saline, out of the total population over 16 years of age (7,450), 61.3% or 4,567 individuals are in the labor force, with 5.7% or 260 of them unemployed. The age group with the highest labor force participation rate is 30 to 34 years, with 93.1% or 364 individuals in the labor force. Within the labor force, the 30 to 34 years age range has the highest percentage of unemployed individuals, with 15.4% or 56 of them being unemployed.
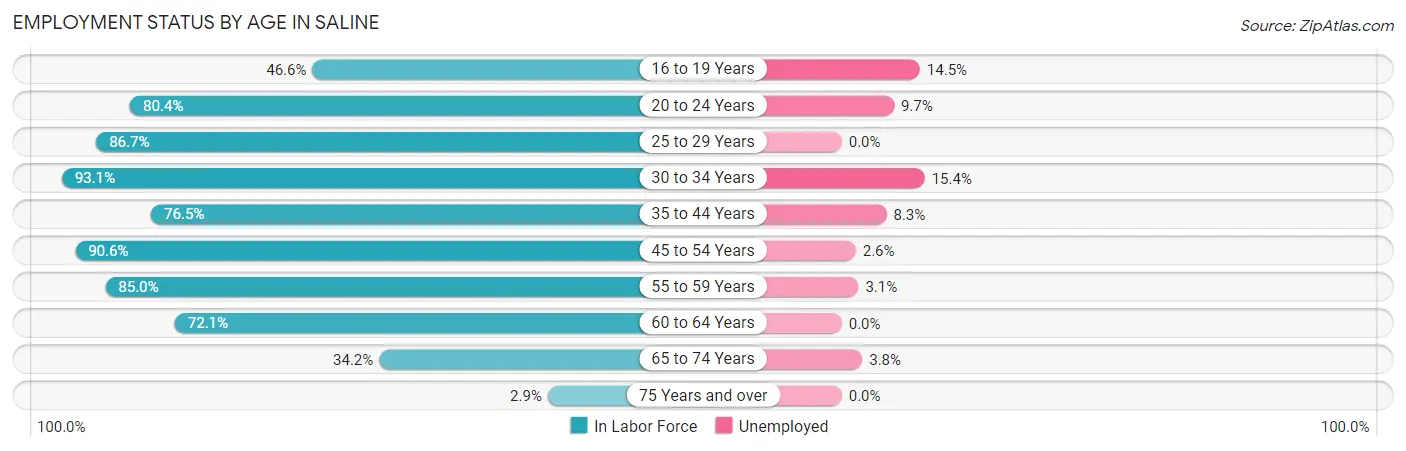
| Age Bracket | In Labor Force | Unemployed |
| 16 to 19 Years | 166 (46.6%) | 24 (14.5%) |
| 20 to 24 Years | 442 (80.4%) | 43 (9.7%) |
| 25 to 29 Years | 352 (86.7%) | 0 (0.0%) |
| 30 to 34 Years | 364 (93.1%) | 56 (15.4%) |
| 35 to 44 Years | 991 (76.5%) | 82 (8.3%) |
| 45 to 54 Years | 908 (90.6%) | 24 (2.6%) |
| 55 to 59 Years | 454 (85.0%) | 14 (3.1%) |
| 60 to 64 Years | 386 (72.1%) | 0 (0.0%) |
| 65 to 74 Years | 476 (34.2%) | 18 (3.8%) |
| 75 Years and over | 29 (2.9%) | 0 (0.0%) |
| Total | 4,567 (61.3%) | 260 (5.7%) |
Employment Status by Educational Attainment in Saline
According to labor force statistics for Saline, 83.0% of individuals (3,455) out of the total population between 25 and 64 years of age (4,163) are in the labor force, with 5.1% or 176 of them being unemployed. The group with the highest labor force participation rate are those with the educational attainment of college / associate degree, with 91.7% or 906 individuals in the labor force. Within the labor force, individuals with less than high school education have the highest percentage of unemployment, with 35.7% or 56 of them being unemployed.
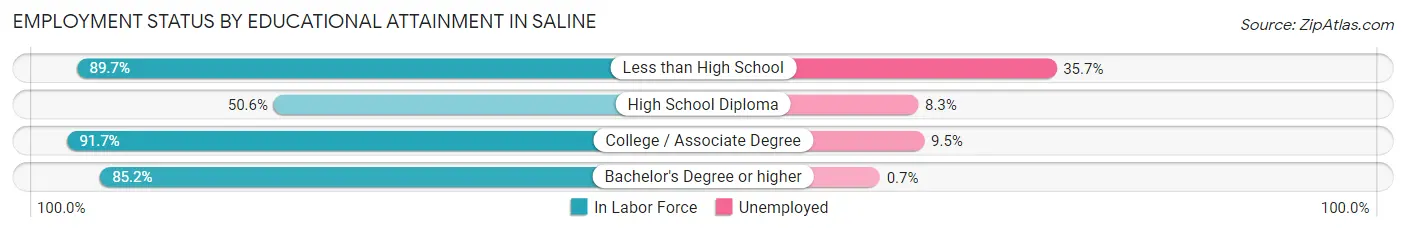
| Educational Attainment | In Labor Force | Unemployed |
| Less than High School | 157 (89.7%) | 62 (35.7%) |
| High School Diploma | 240 (50.6%) | 39 (8.3%) |
| College / Associate Degree | 906 (91.7%) | 94 (9.5%) |
| Bachelor's Degree or higher | 2,152 (85.2%) | 18 (0.7%) |
| Total | 3,455 (83.0%) | 212 (5.1%) |
Employment Occupations by Sex in Saline
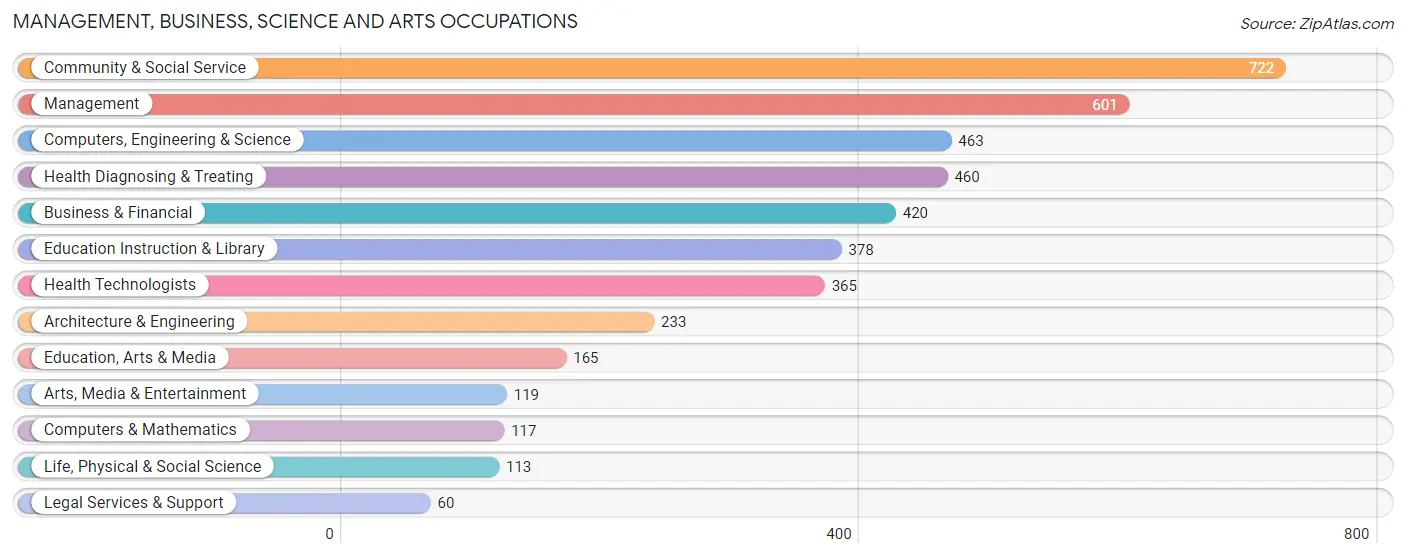
Management, Business, Science and Arts Occupations
The most common Management, Business, Science and Arts occupations in Saline are Community & Social Service (722 | 16.8%), Management (601 | 14.0%), Computers, Engineering & Science (463 | 10.7%), Health Diagnosing & Treating (460 | 10.7%), and Business & Financial (420 | 9.8%).
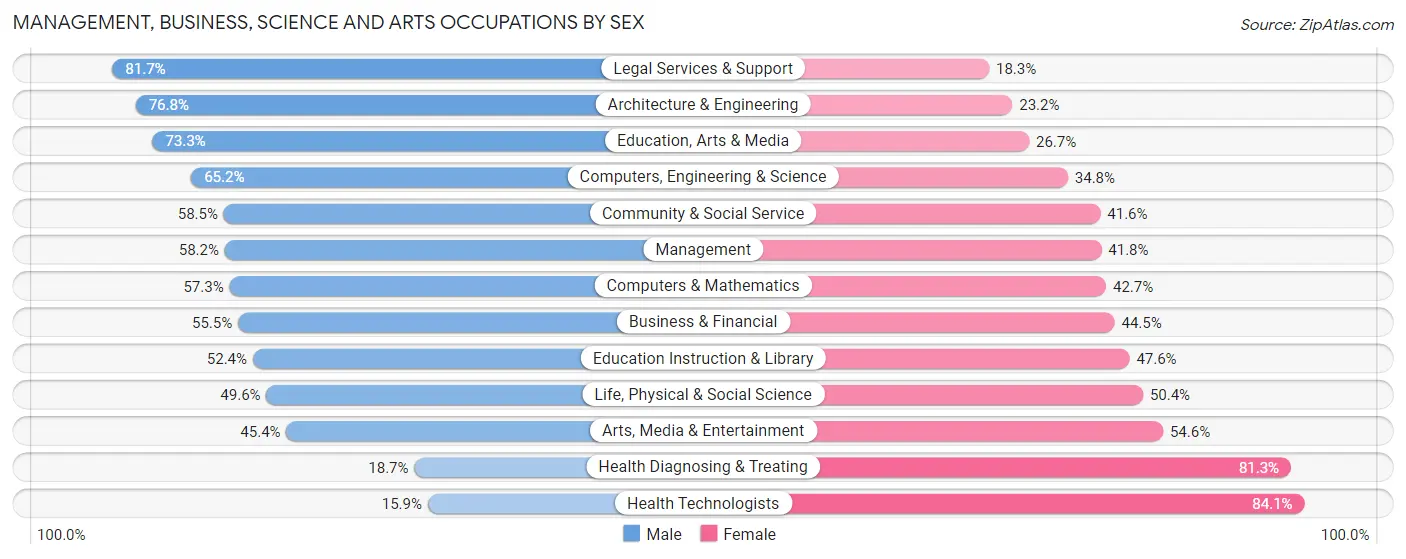
Management, Business, Science and Arts Occupations by Sex
Within the Management, Business, Science and Arts occupations in Saline, the most male-oriented occupations are Legal Services & Support (81.7%), Architecture & Engineering (76.8%), and Education, Arts & Media (73.3%), while the most female-oriented occupations are Health Technologists (84.1%), Health Diagnosing & Treating (81.3%), and Arts, Media & Entertainment (54.6%).
| Occupation | Male | Female |
| Management | 350 (58.2%) | 251 (41.8%) |
| Business & Financial | 233 (55.5%) | 187 (44.5%) |
| Computers, Engineering & Science | 302 (65.2%) | 161 (34.8%) |
| Computers & Mathematics | 67 (57.3%) | 50 (42.7%) |
| Architecture & Engineering | 179 (76.8%) | 54 (23.2%) |
| Life, Physical & Social Science | 56 (49.6%) | 57 (50.4%) |
| Community & Social Service | 422 (58.5%) | 300 (41.5%) |
| Education, Arts & Media | 121 (73.3%) | 44 (26.7%) |
| Legal Services & Support | 49 (81.7%) | 11 (18.3%) |
| Education Instruction & Library | 198 (52.4%) | 180 (47.6%) |
| Arts, Media & Entertainment | 54 (45.4%) | 65 (54.6%) |
| Health Diagnosing & Treating | 86 (18.7%) | 374 (81.3%) |
| Health Technologists | 58 (15.9%) | 307 (84.1%) |
| Total (Category) | 1,393 (52.2%) | 1,273 (47.7%) |
| Total (Overall) | 2,303 (53.5%) | 2,004 (46.5%) |
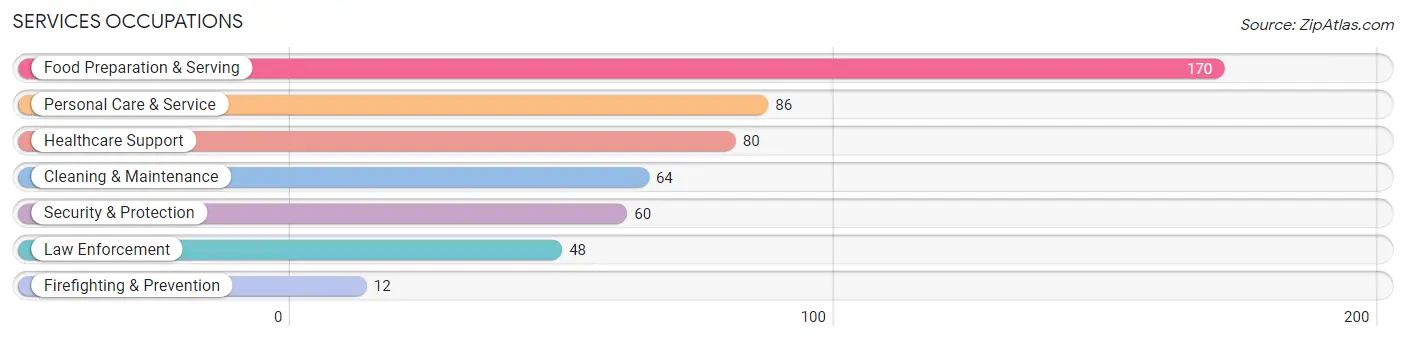
Services Occupations
The most common Services occupations in Saline are Food Preparation & Serving (170 | 4.0%), Personal Care & Service (86 | 2.0%), Healthcare Support (80 | 1.9%), Cleaning & Maintenance (64 | 1.5%), and Security & Protection (60 | 1.4%).
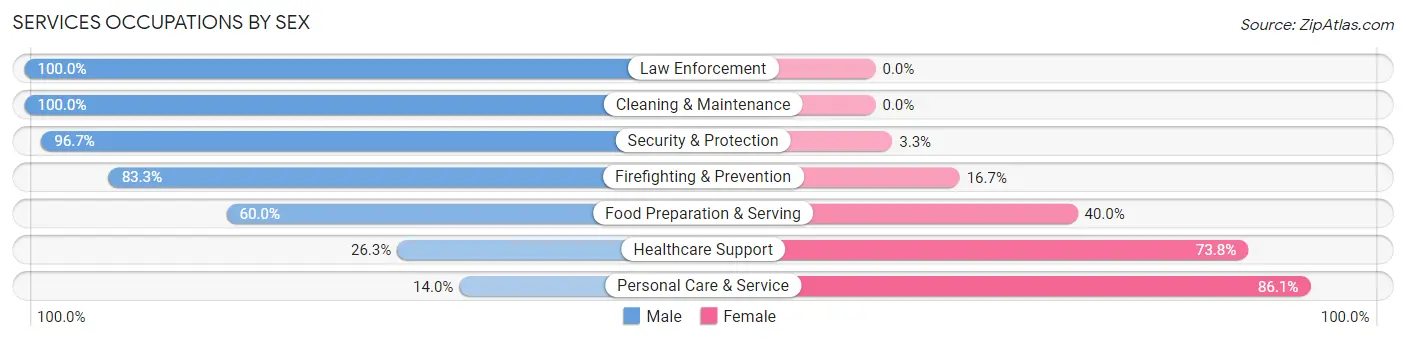
Services Occupations by Sex
Within the Services occupations in Saline, the most male-oriented occupations are Law Enforcement (100.0%), Cleaning & Maintenance (100.0%), and Security & Protection (96.7%), while the most female-oriented occupations are Personal Care & Service (86.1%), Healthcare Support (73.8%), and Food Preparation & Serving (40.0%).
| Occupation | Male | Female |
| Healthcare Support | 21 (26.3%) | 59 (73.8%) |
| Security & Protection | 58 (96.7%) | 2 (3.3%) |
| Firefighting & Prevention | 10 (83.3%) | 2 (16.7%) |
| Law Enforcement | 48 (100.0%) | 0 (0.0%) |
| Food Preparation & Serving | 102 (60.0%) | 68 (40.0%) |
| Cleaning & Maintenance | 64 (100.0%) | 0 (0.0%) |
| Personal Care & Service | 12 (14.0%) | 74 (86.1%) |
| Total (Category) | 257 (55.9%) | 203 (44.1%) |
| Total (Overall) | 2,303 (53.5%) | 2,004 (46.5%) |
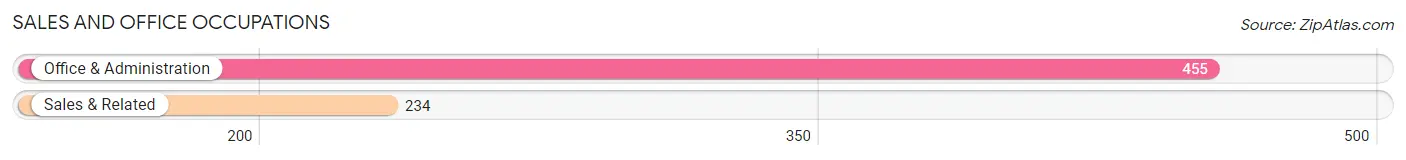
Sales and Office Occupations
The most common Sales and Office occupations in Saline are Office & Administration (455 | 10.6%), and Sales & Related (234 | 5.4%).
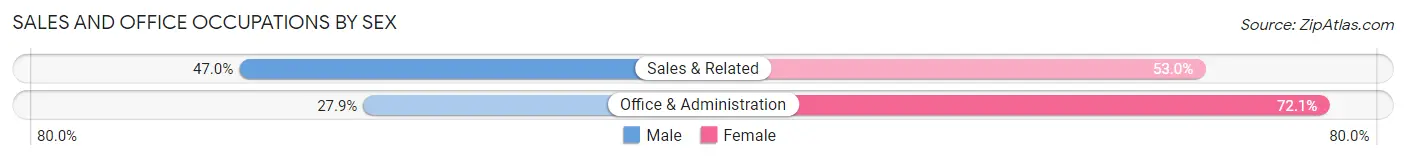
Sales and Office Occupations by Sex
| Occupation | Male | Female |
| Sales & Related | 110 (47.0%) | 124 (53.0%) |
| Office & Administration | 127 (27.9%) | 328 (72.1%) |
| Total (Category) | 237 (34.4%) | 452 (65.6%) |
| Total (Overall) | 2,303 (53.5%) | 2,004 (46.5%) |
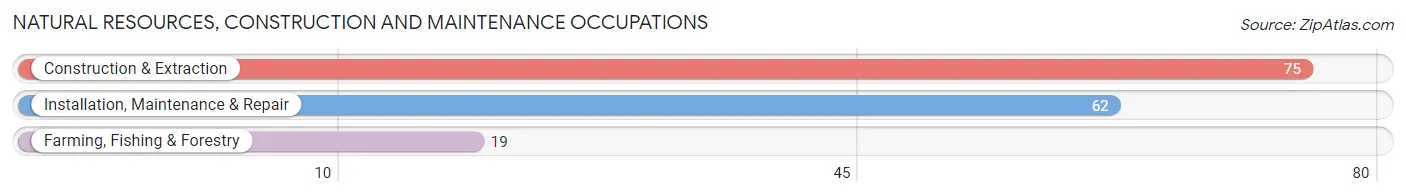
Natural Resources, Construction and Maintenance Occupations
The most common Natural Resources, Construction and Maintenance occupations in Saline are Construction & Extraction (75 | 1.7%), Installation, Maintenance & Repair (62 | 1.4%), and Farming, Fishing & Forestry (19 | 0.4%).
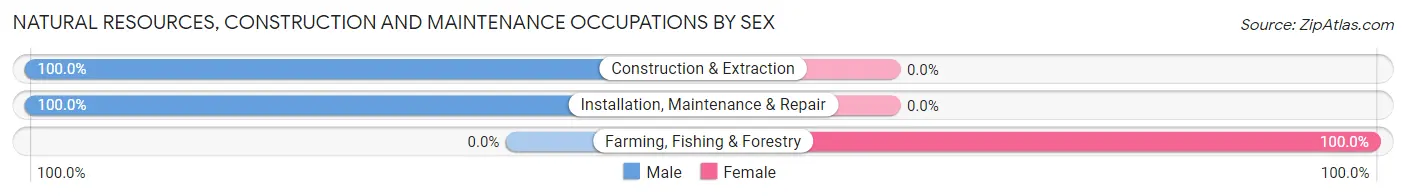
Natural Resources, Construction and Maintenance Occupations by Sex
| Occupation | Male | Female |
| Farming, Fishing & Forestry | 0 (0.0%) | 19 (100.0%) |
| Construction & Extraction | 75 (100.0%) | 0 (0.0%) |
| Installation, Maintenance & Repair | 62 (100.0%) | 0 (0.0%) |
| Total (Category) | 137 (87.8%) | 19 (12.2%) |
| Total (Overall) | 2,303 (53.5%) | 2,004 (46.5%) |
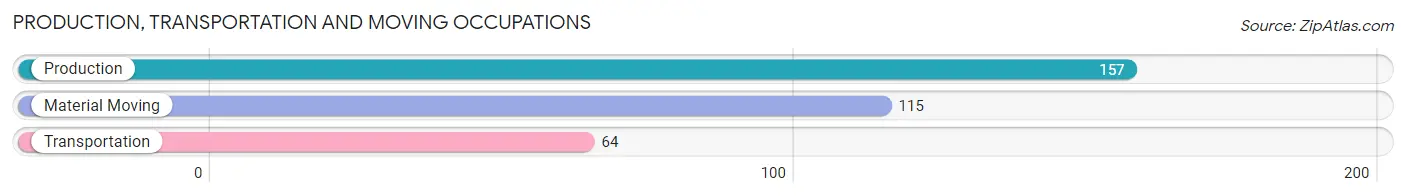
Production, Transportation and Moving Occupations
The most common Production, Transportation and Moving occupations in Saline are Production (157 | 3.6%), Material Moving (115 | 2.7%), and Transportation (64 | 1.5%).
Production, Transportation and Moving Occupations by Sex
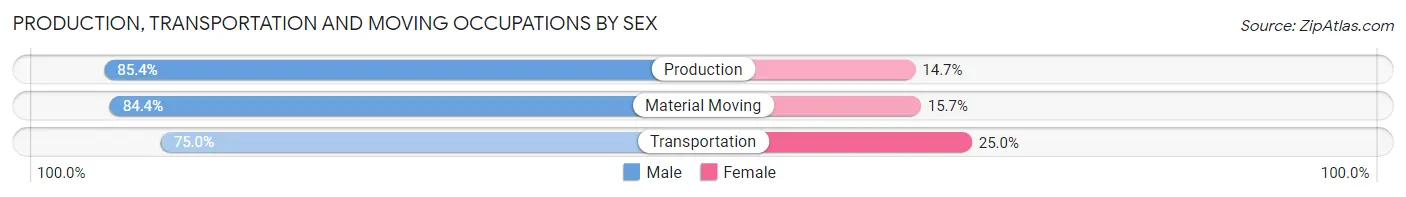
| Occupation | Male | Female |
| Production | 134 (85.4%) | 23 (14.6%) |
| Transportation | 48 (75.0%) | 16 (25.0%) |
| Material Moving | 97 (84.4%) | 18 (15.7%) |
| Total (Category) | 279 (83.0%) | 57 (17.0%) |
| Total (Overall) | 2,303 (53.5%) | 2,004 (46.5%) |
Employment Industries by Sex in Saline
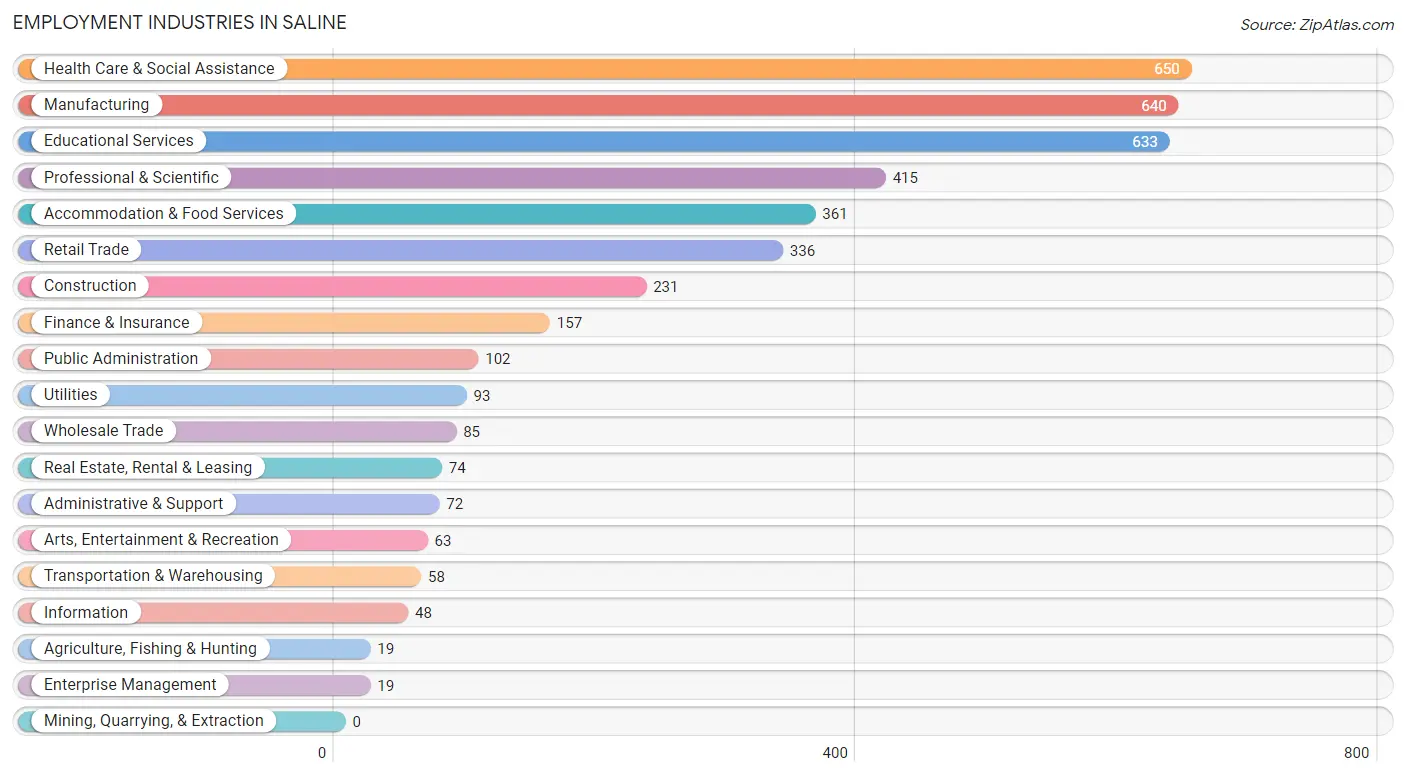
Employment Industries in Saline
The major employment industries in Saline include Health Care & Social Assistance (650 | 15.1%), Manufacturing (640 | 14.9%), Educational Services (633 | 14.7%), Professional & Scientific (415 | 9.6%), and Accommodation & Food Services (361 | 8.4%).
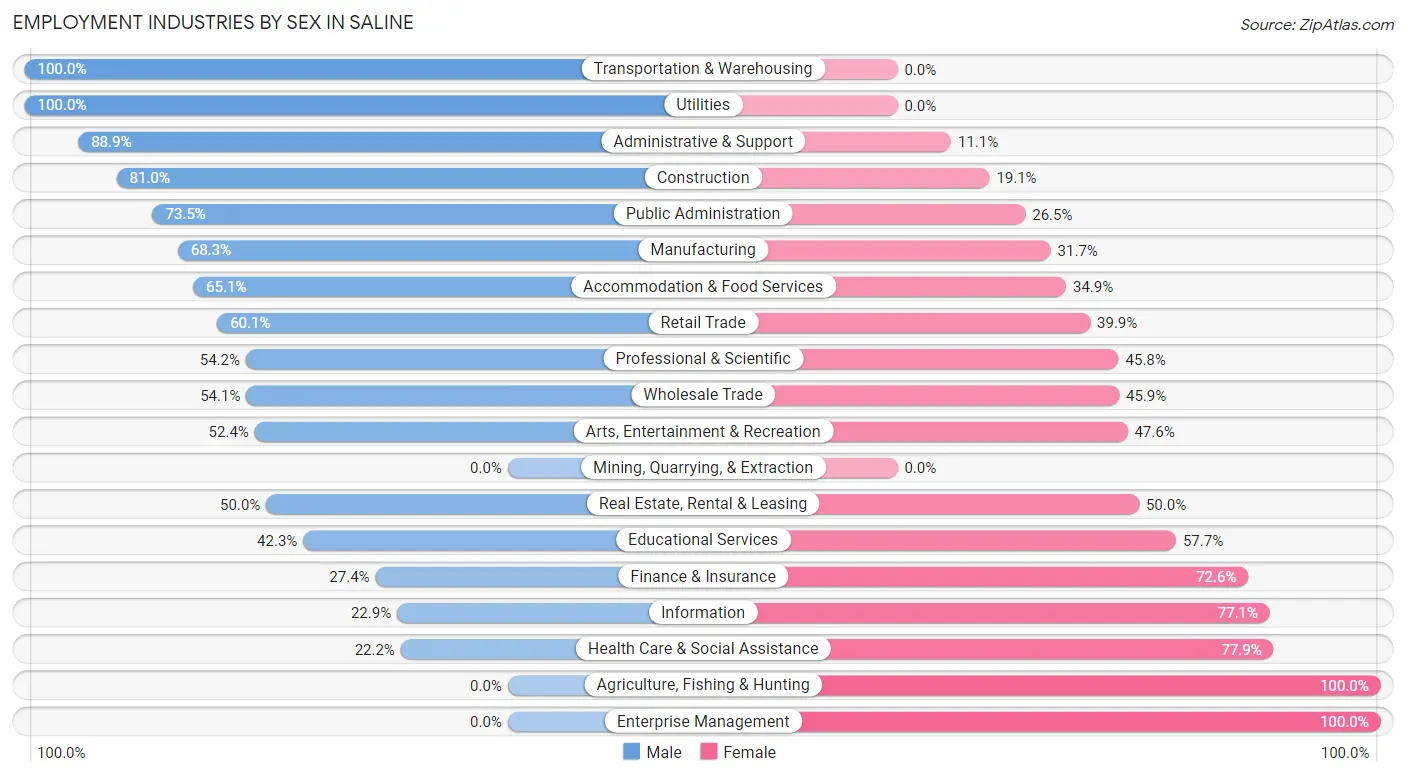
Employment Industries by Sex in Saline
The Saline industries that see more men than women are Transportation & Warehousing (100.0%), Utilities (100.0%), and Administrative & Support (88.9%), whereas the industries that tend to have a higher number of women are Agriculture, Fishing & Hunting (100.0%), Enterprise Management (100.0%), and Health Care & Social Assistance (77.8%).
| Industry | Male | Female |
| Agriculture, Fishing & Hunting | 0 (0.0%) | 19 (100.0%) |
| Mining, Quarrying, & Extraction | 0 (0.0%) | 0 (0.0%) |
| Construction | 187 (80.9%) | 44 (19.1%) |
| Manufacturing | 437 (68.3%) | 203 (31.7%) |
| Wholesale Trade | 46 (54.1%) | 39 (45.9%) |
| Retail Trade | 202 (60.1%) | 134 (39.9%) |
| Transportation & Warehousing | 58 (100.0%) | 0 (0.0%) |
| Utilities | 93 (100.0%) | 0 (0.0%) |
| Information | 11 (22.9%) | 37 (77.1%) |
| Finance & Insurance | 43 (27.4%) | 114 (72.6%) |
| Real Estate, Rental & Leasing | 37 (50.0%) | 37 (50.0%) |
| Professional & Scientific | 225 (54.2%) | 190 (45.8%) |
| Enterprise Management | 0 (0.0%) | 19 (100.0%) |
| Administrative & Support | 64 (88.9%) | 8 (11.1%) |
| Educational Services | 268 (42.3%) | 365 (57.7%) |
| Health Care & Social Assistance | 144 (22.2%) | 506 (77.8%) |
| Arts, Entertainment & Recreation | 33 (52.4%) | 30 (47.6%) |
| Accommodation & Food Services | 235 (65.1%) | 126 (34.9%) |
| Public Administration | 75 (73.5%) | 27 (26.5%) |
| Total | 2,303 (53.5%) | 2,004 (46.5%) |
Education in Saline
School Enrollment in Saline
The most common levels of schooling among the 1,811 students in Saline are high school (379 | 20.9%), college / undergraduate (351 | 19.4%), and elementary school (312 | 17.2%).
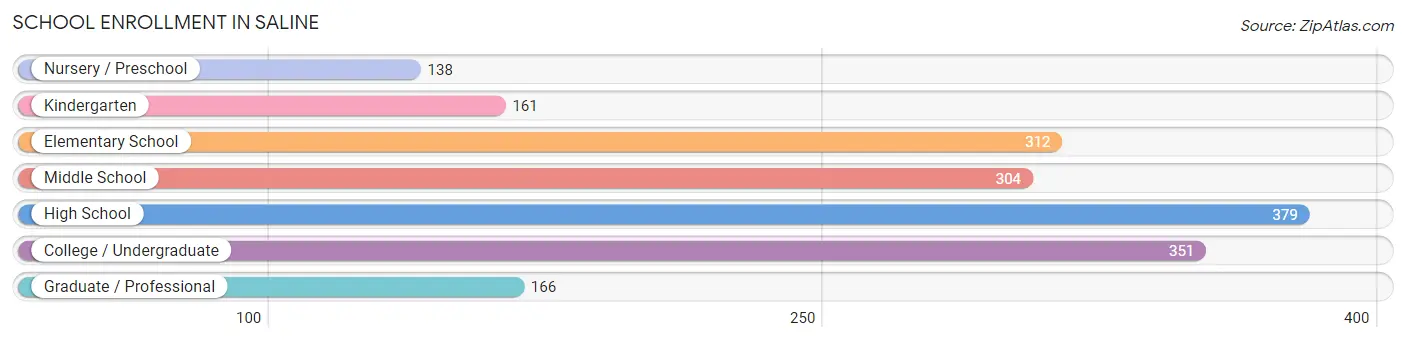
| School Level | # Students | % Students |
| Nursery / Preschool | 138 | 7.6% |
| Kindergarten | 161 | 8.9% |
| Elementary School | 312 | 17.2% |
| Middle School | 304 | 16.8% |
| High School | 379 | 20.9% |
| College / Undergraduate | 351 | 19.4% |
| Graduate / Professional | 166 | 9.2% |
| Total | 1,811 | 100.0% |
School Enrollment by Age by Funding Source in Saline
Out of a total of 1,811 students who are enrolled in schools in Saline, 217 (12.0%) attend a private institution, while the remaining 1,594 (88.0%) are enrolled in public schools. The age group of 3 to 4 year olds has the highest likelihood of being enrolled in private schools, with 61 (58.1% in the age bracket) enrolled. Conversely, the age group of 18 to 19 year olds has the lowest likelihood of being enrolled in a private school, with 139 (100.0% in the age bracket) attending a public institution.
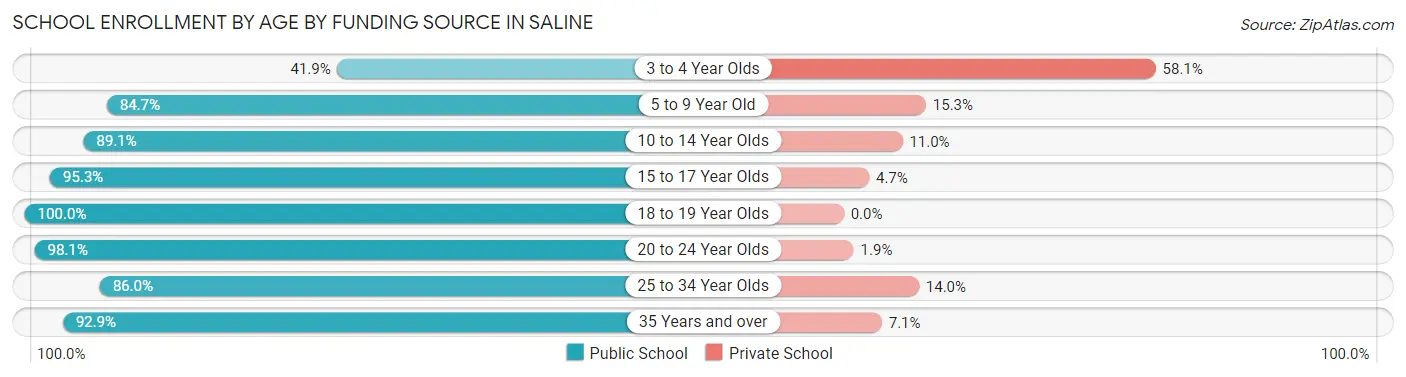
| Age Bracket | Public School | Private School |
| 3 to 4 Year Olds | 44 (41.9%) | 61 (58.1%) |
| 5 to 9 Year Old | 426 (84.7%) | 77 (15.3%) |
| 10 to 14 Year Olds | 309 (89.0%) | 38 (11.0%) |
| 15 to 17 Year Olds | 222 (95.3%) | 11 (4.7%) |
| 18 to 19 Year Olds | 139 (100.0%) | 0 (0.0%) |
| 20 to 24 Year Olds | 211 (98.1%) | 4 (1.9%) |
| 25 to 34 Year Olds | 86 (86.0%) | 14 (14.0%) |
| 35 Years and over | 157 (92.9%) | 12 (7.1%) |
| Total | 1,594 (88.0%) | 217 (12.0%) |
Educational Attainment by Field of Study in Saline
Business (661 | 15.3%), engineering (622 | 14.4%), science & technology (592 | 13.7%), education (401 | 9.3%), and liberal arts & history (373 | 8.6%) are the most common fields of study among 4,319 individuals in Saline who have obtained a bachelor's degree or higher.
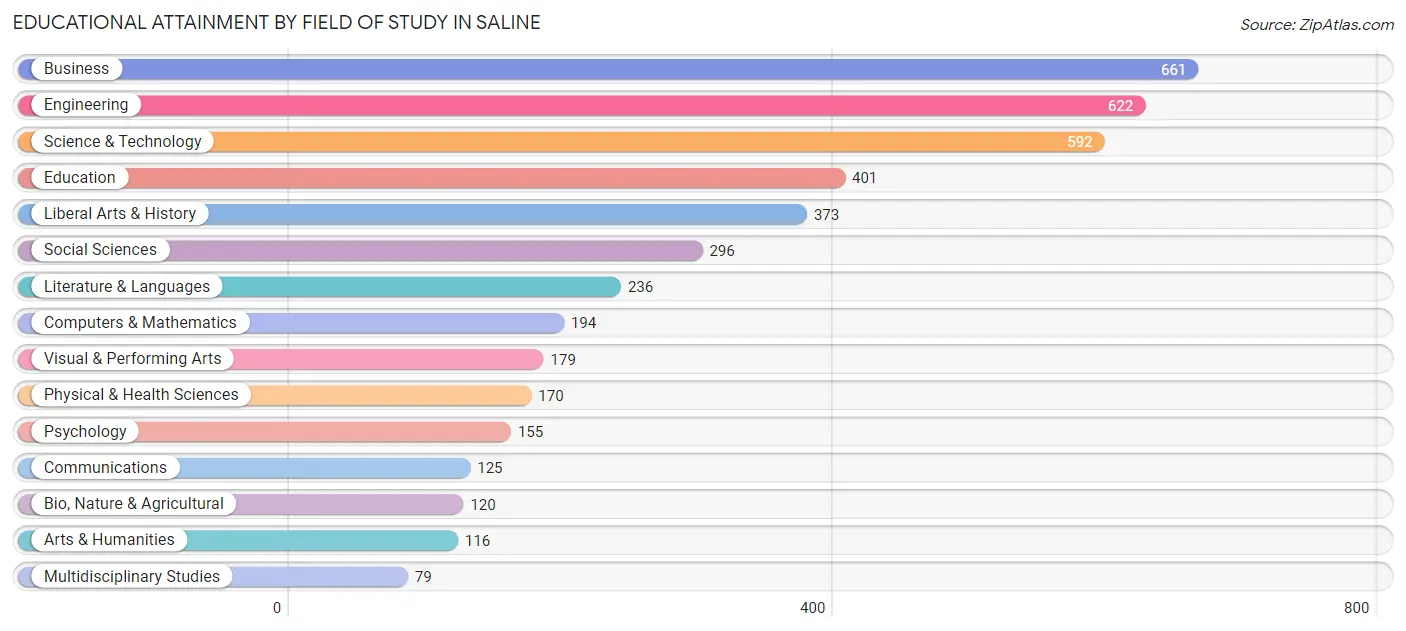
| Field of Study | # Graduates | % Graduates |
| Computers & Mathematics | 194 | 4.5% |
| Bio, Nature & Agricultural | 120 | 2.8% |
| Physical & Health Sciences | 170 | 3.9% |
| Psychology | 155 | 3.6% |
| Social Sciences | 296 | 6.9% |
| Engineering | 622 | 14.4% |
| Multidisciplinary Studies | 79 | 1.8% |
| Science & Technology | 592 | 13.7% |
| Business | 661 | 15.3% |
| Education | 401 | 9.3% |
| Literature & Languages | 236 | 5.5% |
| Liberal Arts & History | 373 | 8.6% |
| Visual & Performing Arts | 179 | 4.1% |
| Communications | 125 | 2.9% |
| Arts & Humanities | 116 | 2.7% |
| Total | 4,319 | 100.0% |
Transportation & Commute in Saline
Vehicle Availability by Sex in Saline
The most prevalent vehicle ownership categories in Saline are males with 2 vehicles (1,085, accounting for 47.1%) and females with 2 vehicles (891, making up 54.9%).
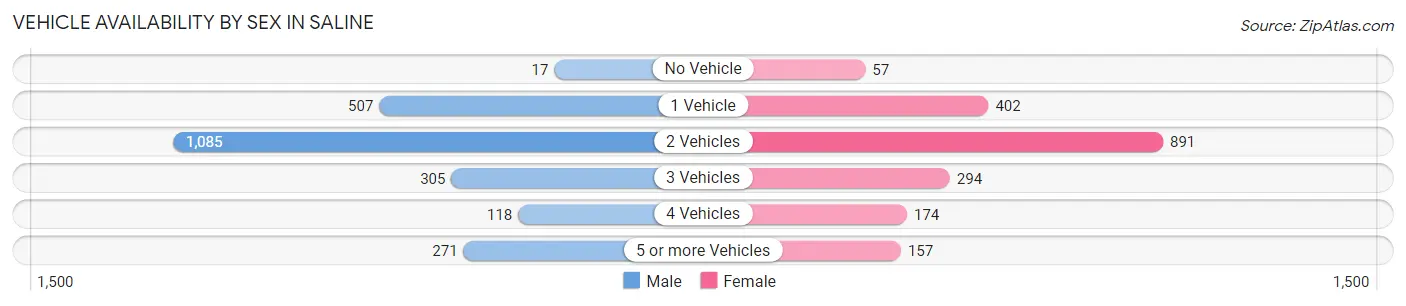
| Vehicles Available | Male | Female |
| No Vehicle | 17 (0.7%) | 57 (2.9%) |
| 1 Vehicle | 507 (22.0%) | 402 (20.3%) |
| 2 Vehicles | 1,085 (47.1%) | 891 (45.1%) |
| 3 Vehicles | 305 (13.2%) | 294 (14.9%) |
| 4 Vehicles | 118 (5.1%) | 174 (8.8%) |
| 5 or more Vehicles | 271 (11.8%) | 157 (8.0%) |
| Total | 2,303 (100.0%) | 1,975 (100.0%) |
Commute Time in Saline
The most frequently occuring commute durations in Saline are 20 to 24 minutes (614 commuters, 17.5%), 25 to 29 minutes (583 commuters, 16.7%), and 30 to 34 minutes (525 commuters, 15.0%).
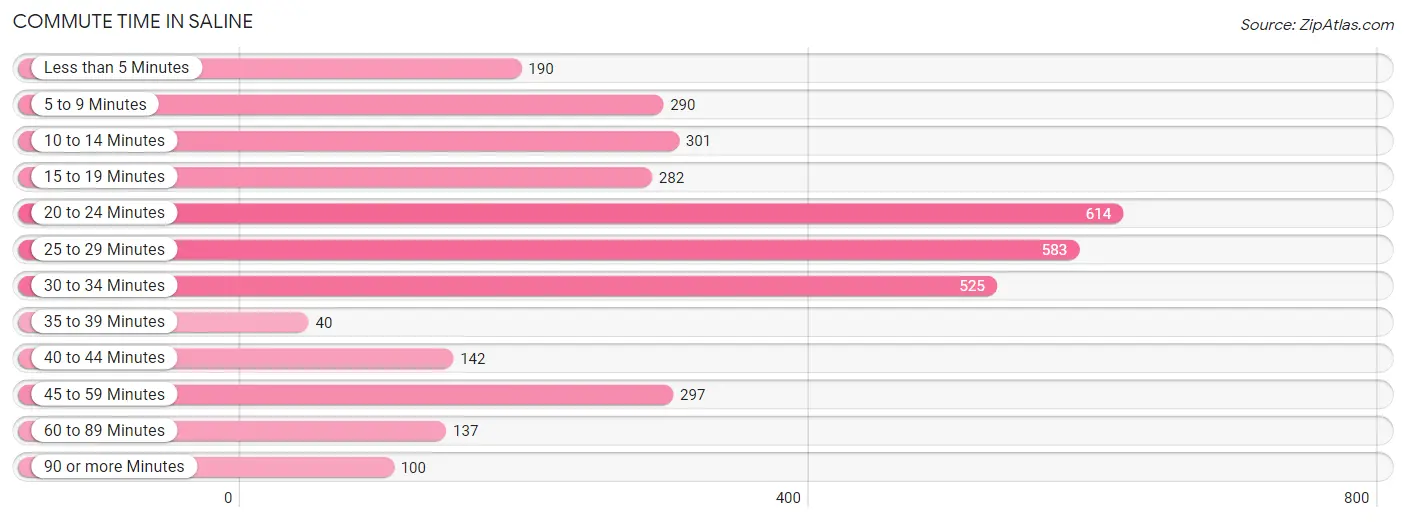
| Commute Time | # Commuters | % Commuters |
| Less than 5 Minutes | 190 | 5.4% |
| 5 to 9 Minutes | 290 | 8.3% |
| 10 to 14 Minutes | 301 | 8.6% |
| 15 to 19 Minutes | 282 | 8.1% |
| 20 to 24 Minutes | 614 | 17.5% |
| 25 to 29 Minutes | 583 | 16.7% |
| 30 to 34 Minutes | 525 | 15.0% |
| 35 to 39 Minutes | 40 | 1.1% |
| 40 to 44 Minutes | 142 | 4.1% |
| 45 to 59 Minutes | 297 | 8.5% |
| 60 to 89 Minutes | 137 | 3.9% |
| 90 or more Minutes | 100 | 2.9% |
Commute Time by Sex in Saline
The most common commute times in Saline are 20 to 24 minutes (298 commuters, 16.2%) for males and 20 to 24 minutes (316 commuters, 19.1%) for females.
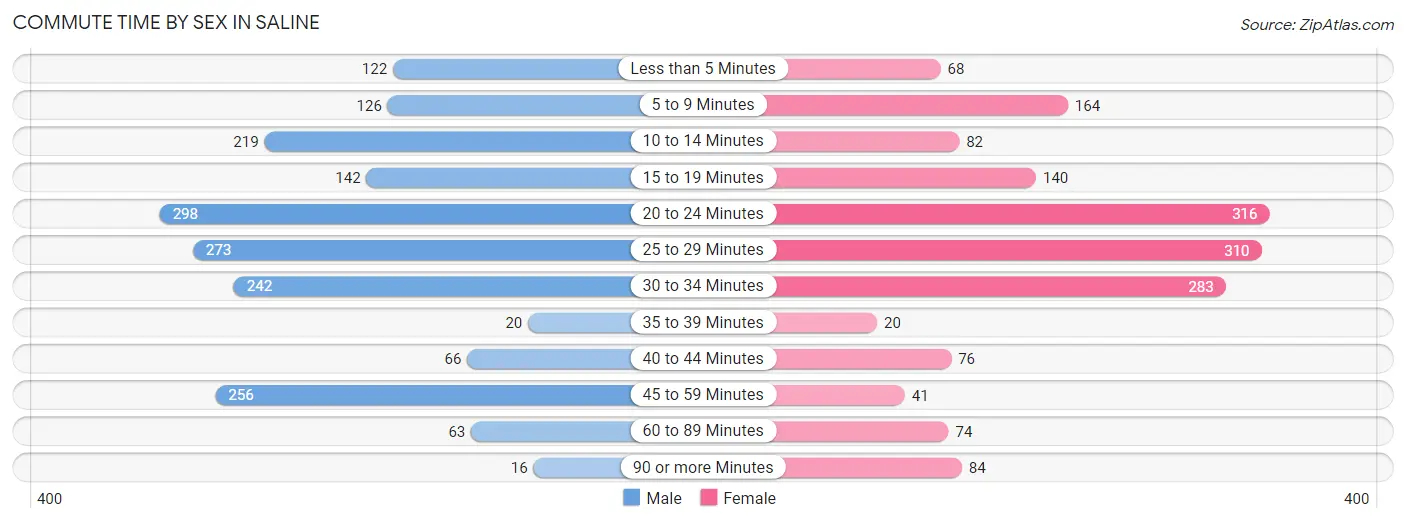
| Commute Time | Male | Female |
| Less than 5 Minutes | 122 (6.6%) | 68 (4.1%) |
| 5 to 9 Minutes | 126 (6.8%) | 164 (9.9%) |
| 10 to 14 Minutes | 219 (11.9%) | 82 (5.0%) |
| 15 to 19 Minutes | 142 (7.7%) | 140 (8.4%) |
| 20 to 24 Minutes | 298 (16.2%) | 316 (19.1%) |
| 25 to 29 Minutes | 273 (14.8%) | 310 (18.7%) |
| 30 to 34 Minutes | 242 (13.1%) | 283 (17.1%) |
| 35 to 39 Minutes | 20 (1.1%) | 20 (1.2%) |
| 40 to 44 Minutes | 66 (3.6%) | 76 (4.6%) |
| 45 to 59 Minutes | 256 (13.9%) | 41 (2.5%) |
| 60 to 89 Minutes | 63 (3.4%) | 74 (4.5%) |
| 90 or more Minutes | 16 (0.9%) | 84 (5.1%) |
Time of Departure to Work by Sex in Saline
The most frequent times of departure to work in Saline are 7:30 AM to 7:59 AM (307, 16.7%) for males and 6:30 AM to 6:59 AM (244, 14.7%) for females.
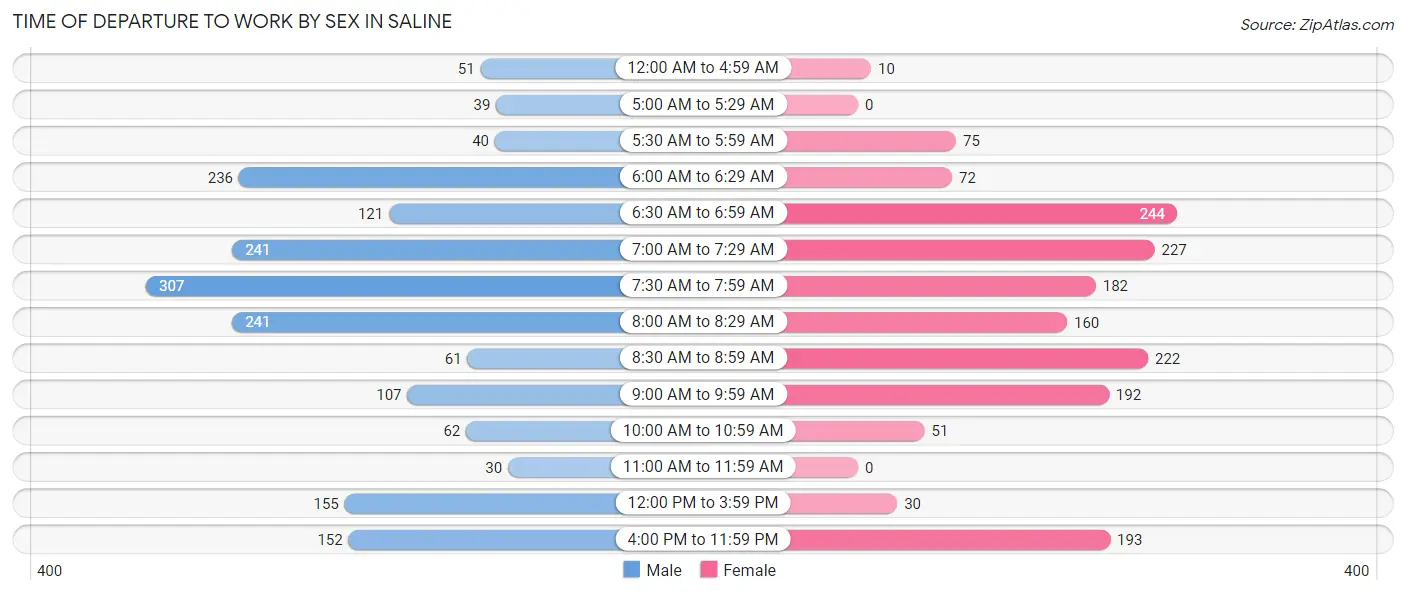
| Time of Departure | Male | Female |
| 12:00 AM to 4:59 AM | 51 (2.8%) | 10 (0.6%) |
| 5:00 AM to 5:29 AM | 39 (2.1%) | 0 (0.0%) |
| 5:30 AM to 5:59 AM | 40 (2.2%) | 75 (4.5%) |
| 6:00 AM to 6:29 AM | 236 (12.8%) | 72 (4.3%) |
| 6:30 AM to 6:59 AM | 121 (6.6%) | 244 (14.7%) |
| 7:00 AM to 7:29 AM | 241 (13.1%) | 227 (13.7%) |
| 7:30 AM to 7:59 AM | 307 (16.7%) | 182 (11.0%) |
| 8:00 AM to 8:29 AM | 241 (13.1%) | 160 (9.7%) |
| 8:30 AM to 8:59 AM | 61 (3.3%) | 222 (13.4%) |
| 9:00 AM to 9:59 AM | 107 (5.8%) | 192 (11.6%) |
| 10:00 AM to 10:59 AM | 62 (3.4%) | 51 (3.1%) |
| 11:00 AM to 11:59 AM | 30 (1.6%) | 0 (0.0%) |
| 12:00 PM to 3:59 PM | 155 (8.4%) | 30 (1.8%) |
| 4:00 PM to 11:59 PM | 152 (8.3%) | 193 (11.6%) |
| Total | 1,843 (100.0%) | 1,658 (100.0%) |
Housing Occupancy in Saline
Occupancy by Ownership in Saline
Of the total 3,737 dwellings in Saline, owner-occupied units account for 2,662 (71.2%), while renter-occupied units make up 1,075 (28.8%).
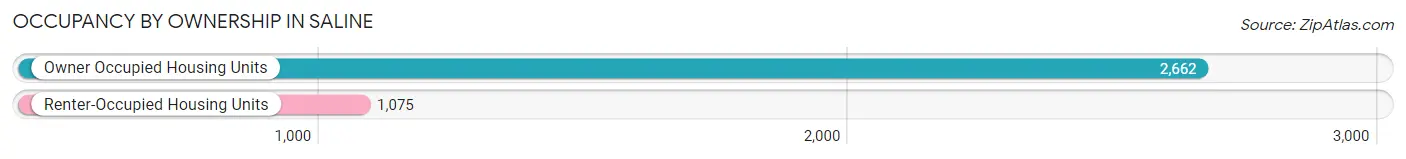
| Occupancy | # Housing Units | % Housing Units |
| Owner Occupied Housing Units | 2,662 | 71.2% |
| Renter-Occupied Housing Units | 1,075 | 28.8% |
| Total Occupied Housing Units | 3,737 | 100.0% |
Occupancy by Household Size in Saline
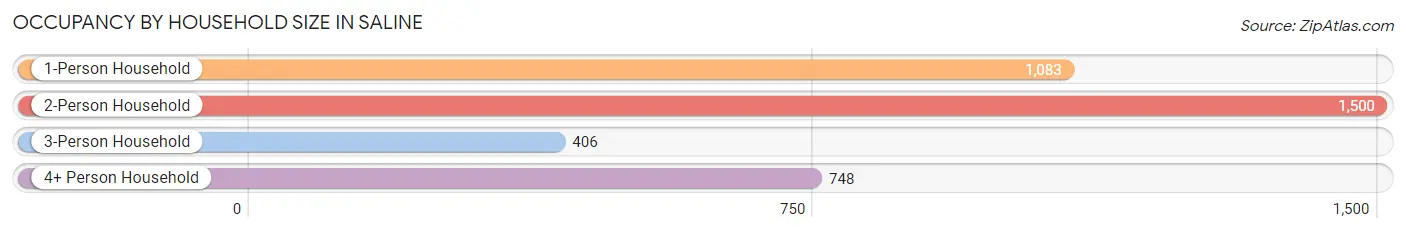
| Household Size | # Housing Units | % Housing Units |
| 1-Person Household | 1,083 | 29.0% |
| 2-Person Household | 1,500 | 40.1% |
| 3-Person Household | 406 | 10.9% |
| 4+ Person Household | 748 | 20.0% |
| Total Housing Units | 3,737 | 100.0% |
Occupancy by Ownership by Household Size in Saline
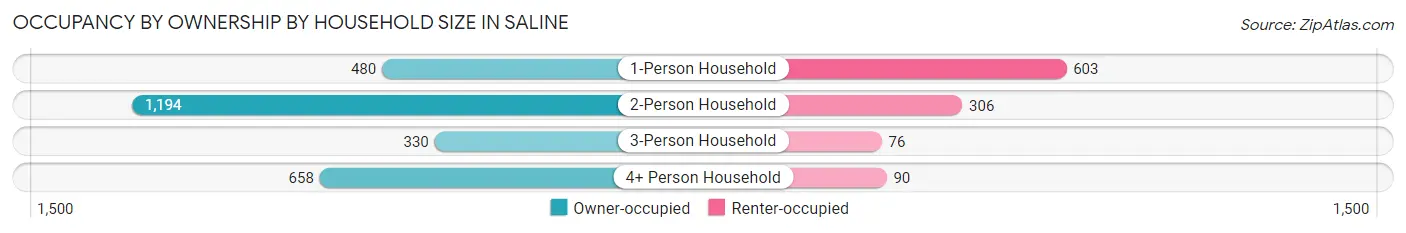
| Household Size | Owner-occupied | Renter-occupied |
| 1-Person Household | 480 (44.3%) | 603 (55.7%) |
| 2-Person Household | 1,194 (79.6%) | 306 (20.4%) |
| 3-Person Household | 330 (81.3%) | 76 (18.7%) |
| 4+ Person Household | 658 (88.0%) | 90 (12.0%) |
| Total Housing Units | 2,662 (71.2%) | 1,075 (28.8%) |
Occupancy by Educational Attainment in Saline
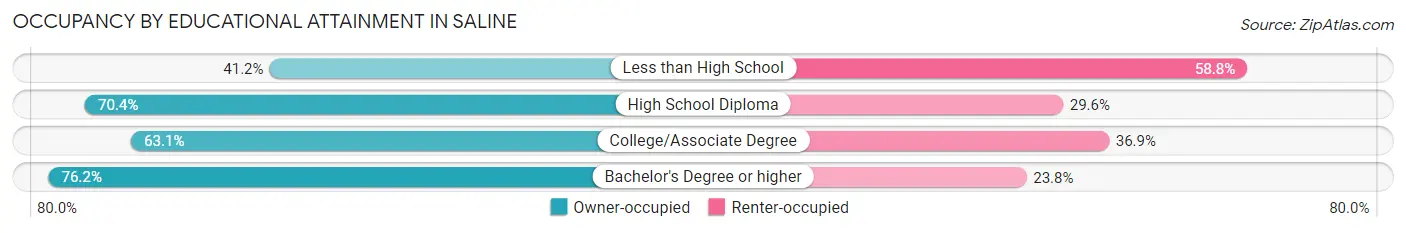
| Household Size | Owner-occupied | Renter-occupied |
| Less than High School | 14 (41.2%) | 20 (58.8%) |
| High School Diploma | 176 (70.4%) | 74 (29.6%) |
| College/Associate Degree | 766 (63.1%) | 448 (36.9%) |
| Bachelor's Degree or higher | 1,706 (76.2%) | 533 (23.8%) |
Occupancy by Age of Householder in Saline
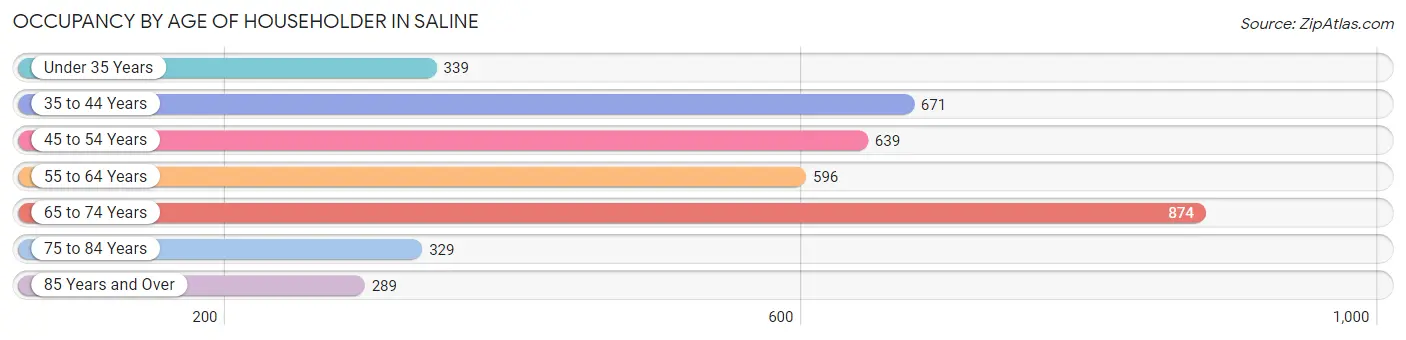
| Age Bracket | # Households | % Households |
| Under 35 Years | 339 | 9.1% |
| 35 to 44 Years | 671 | 18.0% |
| 45 to 54 Years | 639 | 17.1% |
| 55 to 64 Years | 596 | 16.0% |
| 65 to 74 Years | 874 | 23.4% |
| 75 to 84 Years | 329 | 8.8% |
| 85 Years and Over | 289 | 7.7% |
| Total | 3,737 | 100.0% |
Housing Finances in Saline
Median Income by Occupancy in Saline
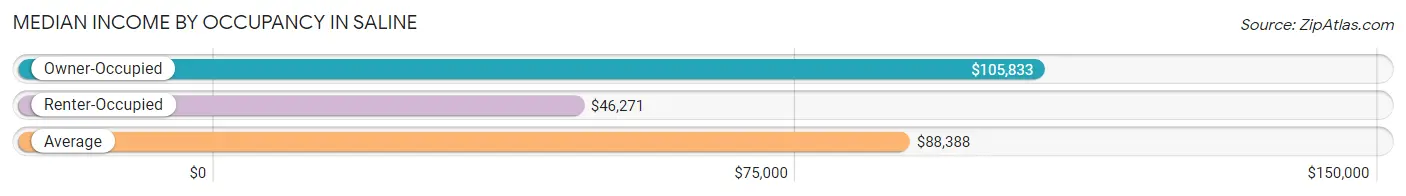
| Occupancy Type | # Households | Median Income |
| Owner-Occupied | 2,662 (71.2%) | $105,833 |
| Renter-Occupied | 1,075 (28.8%) | $46,271 |
| Average | 3,737 (100.0%) | $88,388 |
Occupancy by Householder Income Bracket in Saline
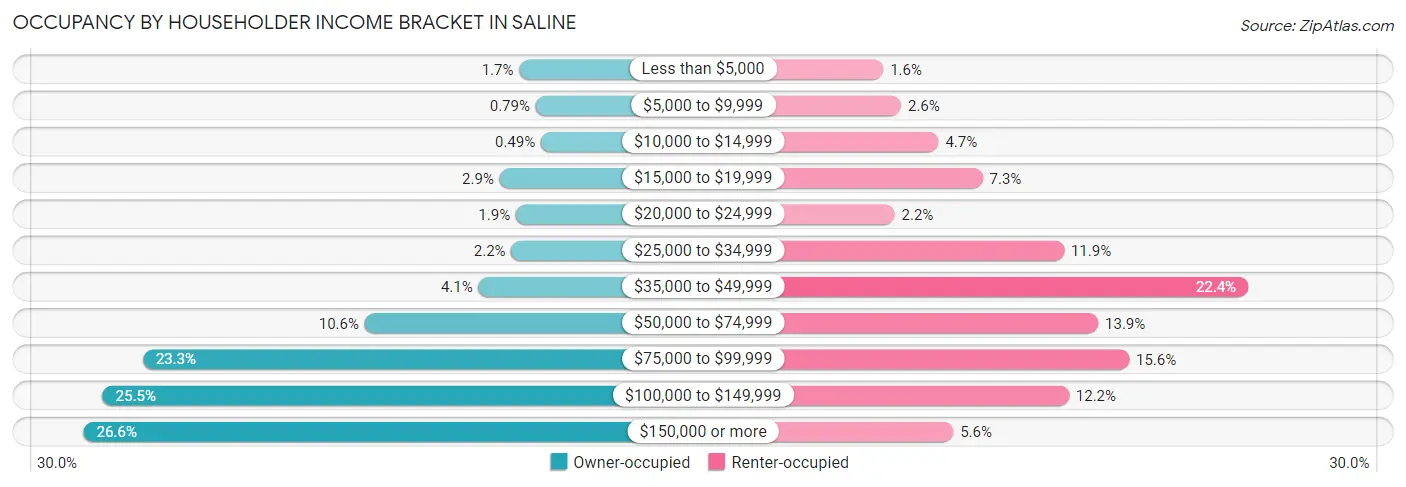
| Income Bracket | Owner-occupied | Renter-occupied |
| Less than $5,000 | 46 (1.7%) | 17 (1.6%) |
| $5,000 to $9,999 | 21 (0.8%) | 28 (2.6%) |
| $10,000 to $14,999 | 13 (0.5%) | 51 (4.7%) |
| $15,000 to $19,999 | 76 (2.9%) | 78 (7.3%) |
| $20,000 to $24,999 | 51 (1.9%) | 24 (2.2%) |
| $25,000 to $34,999 | 58 (2.2%) | 128 (11.9%) |
| $35,000 to $49,999 | 108 (4.1%) | 241 (22.4%) |
| $50,000 to $74,999 | 281 (10.6%) | 149 (13.9%) |
| $75,000 to $99,999 | 619 (23.3%) | 168 (15.6%) |
| $100,000 to $149,999 | 680 (25.5%) | 131 (12.2%) |
| $150,000 or more | 709 (26.6%) | 60 (5.6%) |
| Total | 2,662 (100.0%) | 1,075 (100.0%) |
Monthly Housing Cost Tiers in Saline
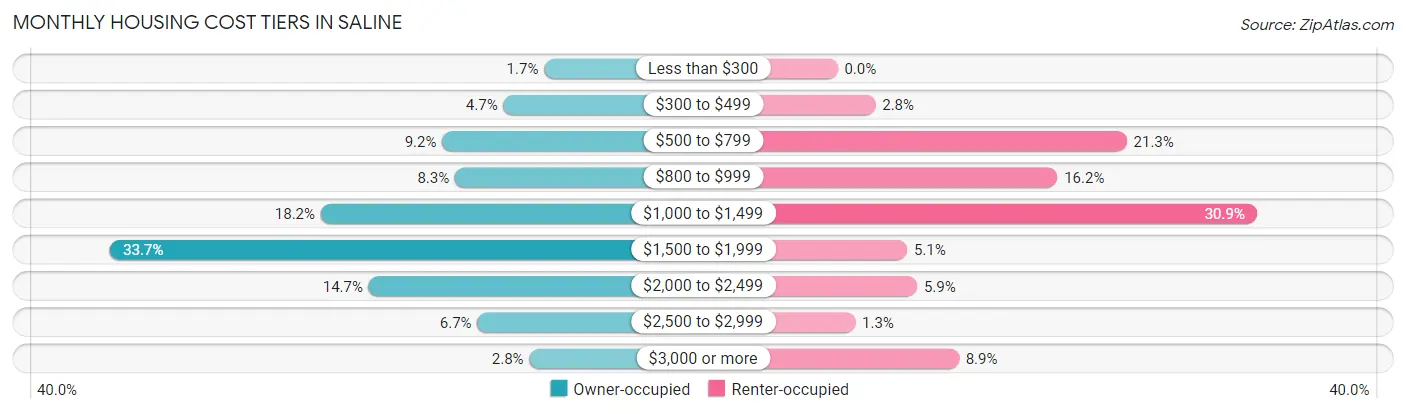
| Monthly Cost | Owner-occupied | Renter-occupied |
| Less than $300 | 46 (1.7%) | 0 (0.0%) |
| $300 to $499 | 126 (4.7%) | 30 (2.8%) |
| $500 to $799 | 246 (9.2%) | 229 (21.3%) |
| $800 to $999 | 221 (8.3%) | 174 (16.2%) |
| $1,000 to $1,499 | 484 (18.2%) | 332 (30.9%) |
| $1,500 to $1,999 | 897 (33.7%) | 55 (5.1%) |
| $2,000 to $2,499 | 390 (14.6%) | 63 (5.9%) |
| $2,500 to $2,999 | 177 (6.7%) | 14 (1.3%) |
| $3,000 or more | 75 (2.8%) | 96 (8.9%) |
| Total | 2,662 (100.0%) | 1,075 (100.0%) |
Physical Housing Characteristics in Saline
Housing Structures in Saline
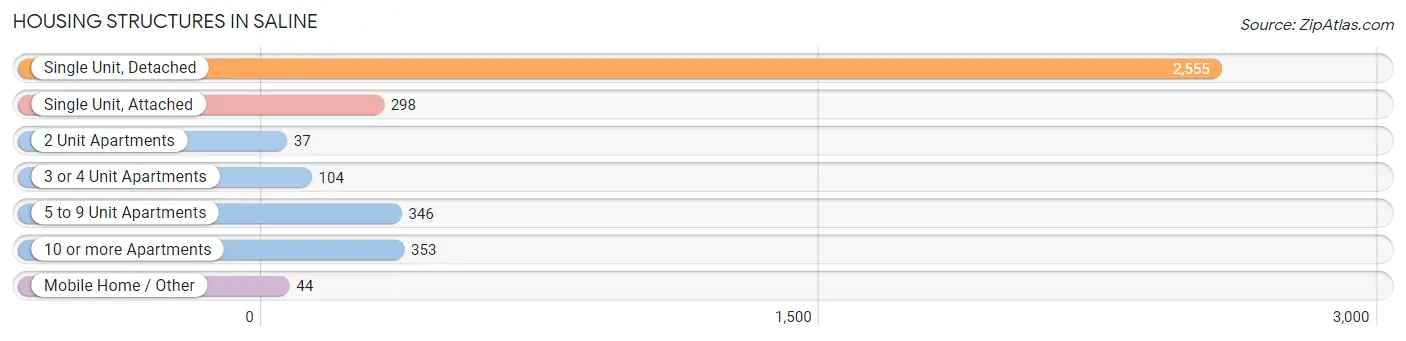
| Structure Type | # Housing Units | % Housing Units |
| Single Unit, Detached | 2,555 | 68.4% |
| Single Unit, Attached | 298 | 8.0% |
| 2 Unit Apartments | 37 | 1.0% |
| 3 or 4 Unit Apartments | 104 | 2.8% |
| 5 to 9 Unit Apartments | 346 | 9.3% |
| 10 or more Apartments | 353 | 9.5% |
| Mobile Home / Other | 44 | 1.2% |
| Total | 3,737 | 100.0% |
Housing Structures by Occupancy in Saline
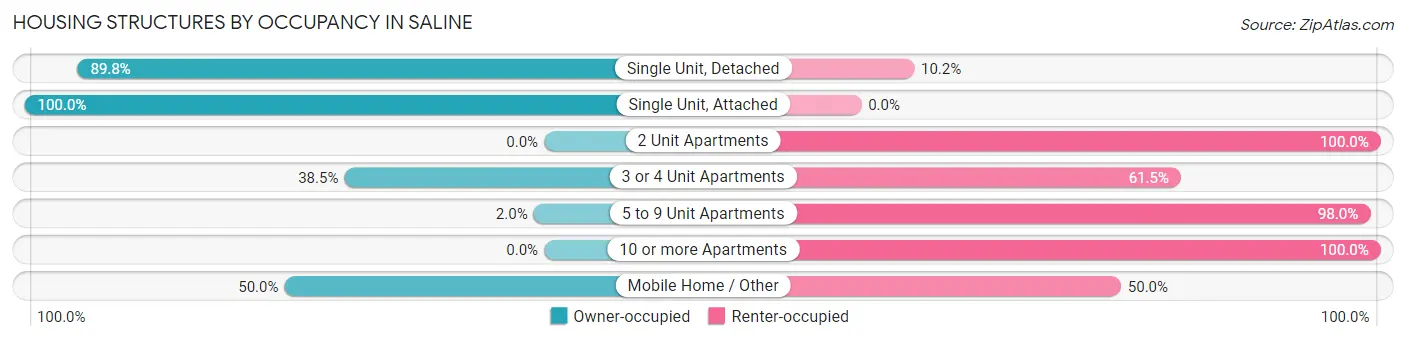
| Structure Type | Owner-occupied | Renter-occupied |
| Single Unit, Detached | 2,295 (89.8%) | 260 (10.2%) |
| Single Unit, Attached | 298 (100.0%) | 0 (0.0%) |
| 2 Unit Apartments | 0 (0.0%) | 37 (100.0%) |
| 3 or 4 Unit Apartments | 40 (38.5%) | 64 (61.5%) |
| 5 to 9 Unit Apartments | 7 (2.0%) | 339 (98.0%) |
| 10 or more Apartments | 0 (0.0%) | 353 (100.0%) |
| Mobile Home / Other | 22 (50.0%) | 22 (50.0%) |
| Total | 2,662 (71.2%) | 1,075 (28.8%) |
Housing Structures by Number of Rooms in Saline
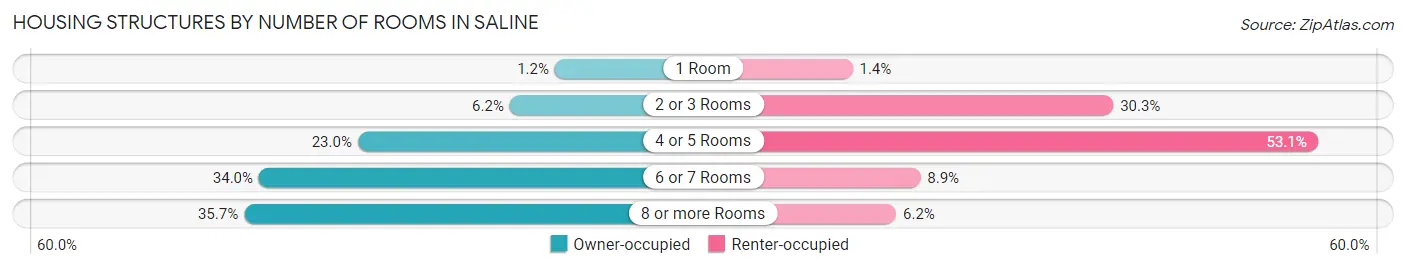
| Number of Rooms | Owner-occupied | Renter-occupied |
| 1 Room | 31 (1.2%) | 15 (1.4%) |
| 2 or 3 Rooms | 164 (6.2%) | 326 (30.3%) |
| 4 or 5 Rooms | 613 (23.0%) | 571 (53.1%) |
| 6 or 7 Rooms | 905 (34.0%) | 96 (8.9%) |
| 8 or more Rooms | 949 (35.6%) | 67 (6.2%) |
| Total | 2,662 (100.0%) | 1,075 (100.0%) |
Housing Structure by Heating Type in Saline
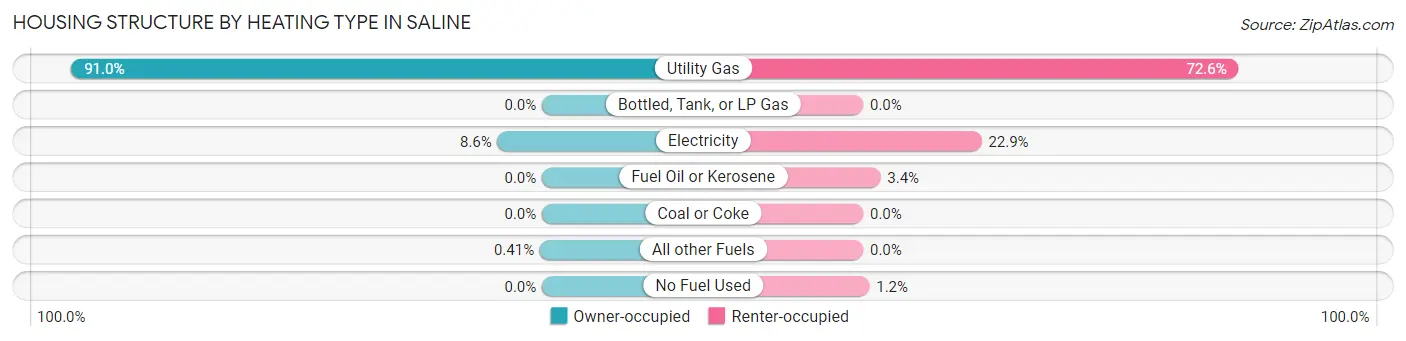
| Heating Type | Owner-occupied | Renter-occupied |
| Utility Gas | 2,422 (91.0%) | 780 (72.6%) |
| Bottled, Tank, or LP Gas | 0 (0.0%) | 0 (0.0%) |
| Electricity | 229 (8.6%) | 246 (22.9%) |
| Fuel Oil or Kerosene | 0 (0.0%) | 36 (3.4%) |
| Coal or Coke | 0 (0.0%) | 0 (0.0%) |
| All other Fuels | 11 (0.4%) | 0 (0.0%) |
| No Fuel Used | 0 (0.0%) | 13 (1.2%) |
| Total | 2,662 (100.0%) | 1,075 (100.0%) |
Household Vehicle Usage in Saline
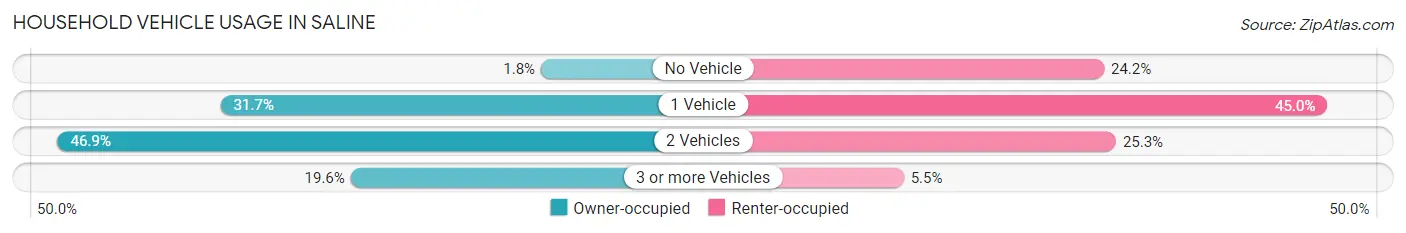
| Vehicles per Household | Owner-occupied | Renter-occupied |
| No Vehicle | 48 (1.8%) | 260 (24.2%) |
| 1 Vehicle | 844 (31.7%) | 484 (45.0%) |
| 2 Vehicles | 1,249 (46.9%) | 272 (25.3%) |
| 3 or more Vehicles | 521 (19.6%) | 59 (5.5%) |
| Total | 2,662 (100.0%) | 1,075 (100.0%) |
Real Estate & Mortgages in Saline
Real Estate and Mortgage Overview in Saline
| Characteristic | Without Mortgage | With Mortgage |
| Housing Units | 804 | 1,858 |
| Median Property Value | $316,300 | $295,900 |
| Median Household Income | $91,750 | $590 |
| Monthly Housing Costs | $795 | $75 |
| Real Estate Taxes | $5,163 | $16 |
Property Value by Mortgage Status in Saline
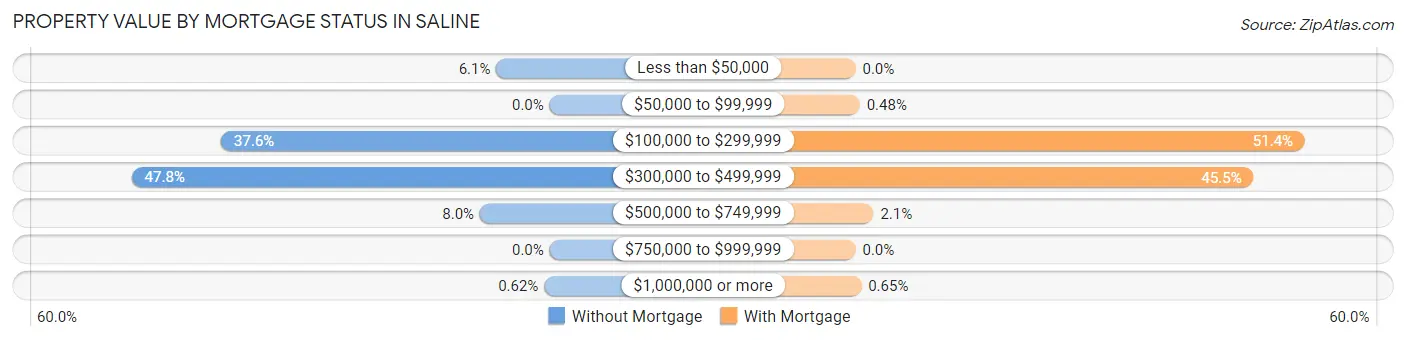
| Property Value | Without Mortgage | With Mortgage |
| Less than $50,000 | 49 (6.1%) | 0 (0.0%) |
| $50,000 to $99,999 | 0 (0.0%) | 9 (0.5%) |
| $100,000 to $299,999 | 302 (37.6%) | 954 (51.3%) |
| $300,000 to $499,999 | 384 (47.8%) | 845 (45.5%) |
| $500,000 to $749,999 | 64 (8.0%) | 38 (2.1%) |
| $750,000 to $999,999 | 0 (0.0%) | 0 (0.0%) |
| $1,000,000 or more | 5 (0.6%) | 12 (0.6%) |
| Total | 804 (100.0%) | 1,858 (100.0%) |
Household Income by Mortgage Status in Saline
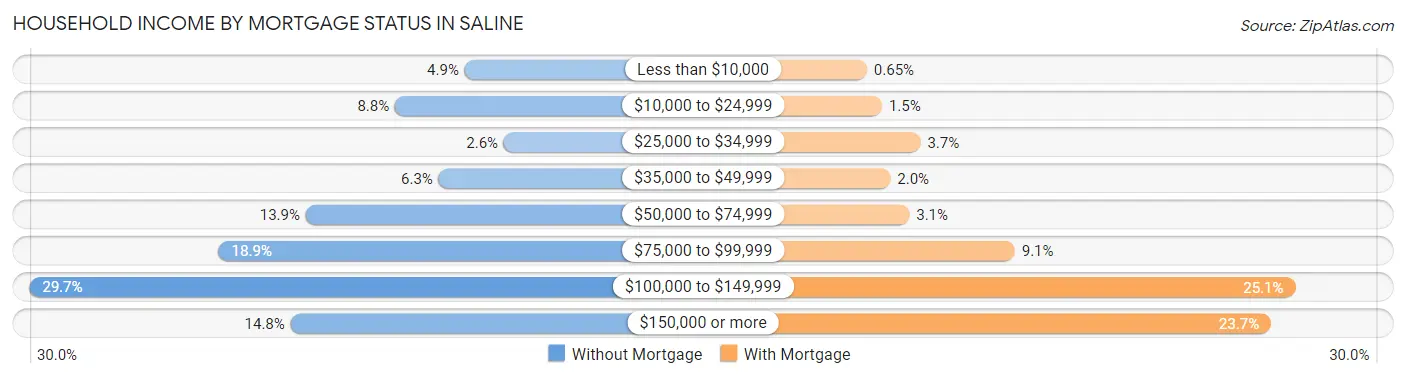
| Household Income | Without Mortgage | With Mortgage |
| Less than $10,000 | 39 (4.9%) | 12 (0.6%) |
| $10,000 to $24,999 | 71 (8.8%) | 28 (1.5%) |
| $25,000 to $34,999 | 21 (2.6%) | 69 (3.7%) |
| $35,000 to $49,999 | 51 (6.3%) | 37 (2.0%) |
| $50,000 to $74,999 | 112 (13.9%) | 57 (3.1%) |
| $75,000 to $99,999 | 152 (18.9%) | 169 (9.1%) |
| $100,000 to $149,999 | 239 (29.7%) | 467 (25.1%) |
| $150,000 or more | 119 (14.8%) | 441 (23.7%) |
| Total | 804 (100.0%) | 1,858 (100.0%) |
Property Value to Household Income Ratio in Saline
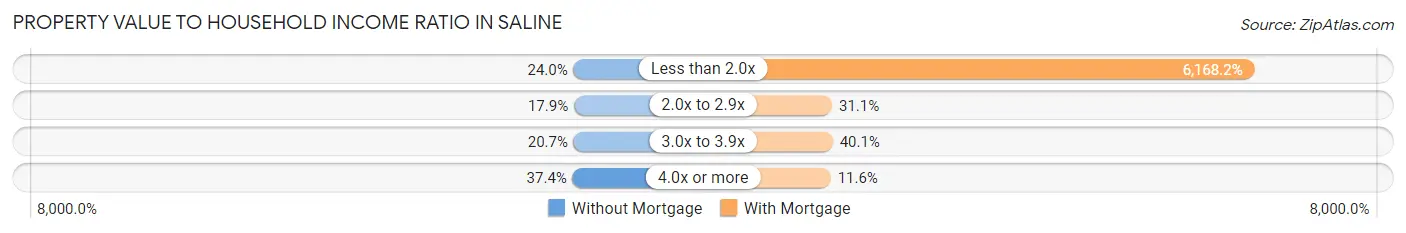
| Value-to-Income Ratio | Without Mortgage | With Mortgage |
| Less than 2.0x | 193 (24.0%) | 114,605 (6,168.2%) |
| 2.0x to 2.9x | 144 (17.9%) | 578 (31.1%) |
| 3.0x to 3.9x | 166 (20.6%) | 745 (40.1%) |
| 4.0x or more | 301 (37.4%) | 216 (11.6%) |
| Total | 804 (100.0%) | 1,858 (100.0%) |
Real Estate Taxes by Mortgage Status in Saline
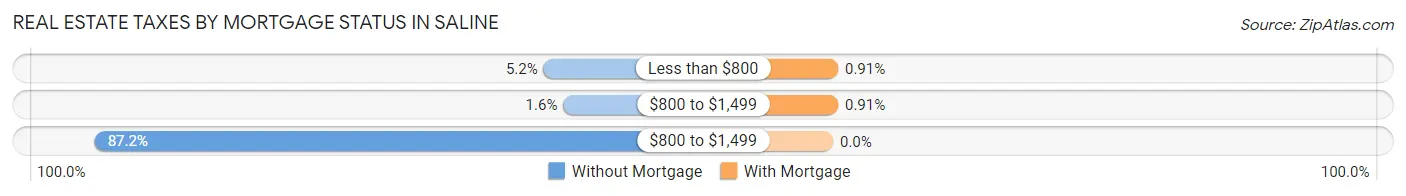
| Property Taxes | Without Mortgage | With Mortgage |
| Less than $800 | 42 (5.2%) | 17 (0.9%) |
| $800 to $1,499 | 13 (1.6%) | 17 (0.9%) |
| $800 to $1,499 | 701 (87.2%) | 0 (0.0%) |
| Total | 804 (100.0%) | 1,858 (100.0%) |
Health & Disability in Saline
Health Insurance Coverage by Age in Saline
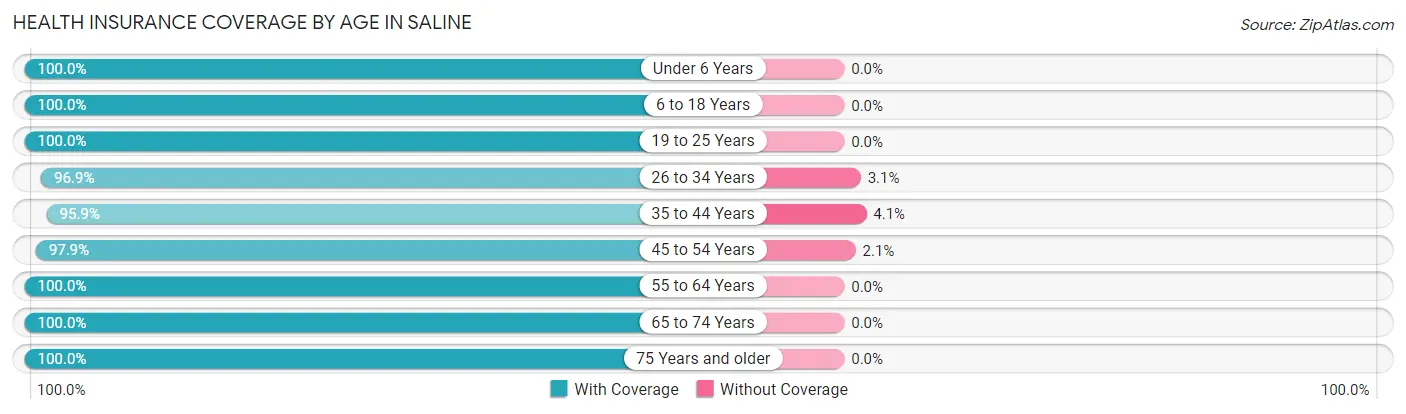
| Age Bracket | With Coverage | Without Coverage |
| Under 6 Years | 675 (100.0%) | 0 (0.0%) |
| 6 to 18 Years | 1,171 (100.0%) | 0 (0.0%) |
| 19 to 25 Years | 599 (100.0%) | 0 (0.0%) |
| 26 to 34 Years | 757 (96.9%) | 24 (3.1%) |
| 35 to 44 Years | 1,236 (95.9%) | 53 (4.1%) |
| 45 to 54 Years | 976 (97.9%) | 21 (2.1%) |
| 55 to 64 Years | 1,054 (100.0%) | 0 (0.0%) |
| 65 to 74 Years | 1,364 (100.0%) | 0 (0.0%) |
| 75 Years and older | 861 (100.0%) | 0 (0.0%) |
| Total | 8,693 (98.9%) | 98 (1.1%) |
Health Insurance Coverage by Citizenship Status in Saline
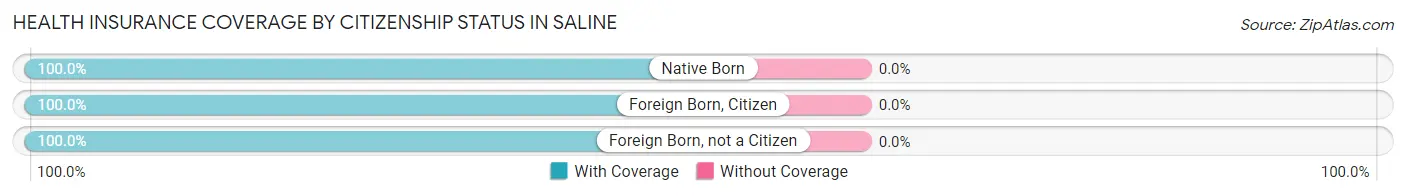
| Citizenship Status | With Coverage | Without Coverage |
| Native Born | 675 (100.0%) | 0 (0.0%) |
| Foreign Born, Citizen | 1,171 (100.0%) | 0 (0.0%) |
| Foreign Born, not a Citizen | 599 (100.0%) | 0 (0.0%) |
Health Insurance Coverage by Household Income in Saline
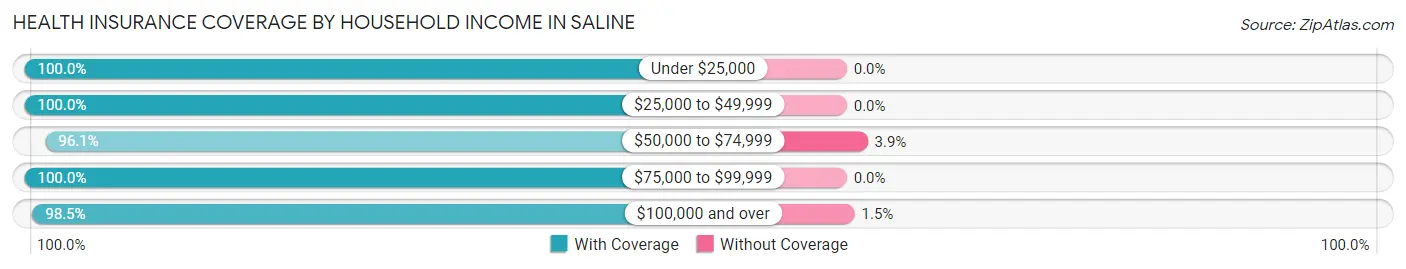
| Household Income | With Coverage | Without Coverage |
| Under $25,000 | 560 (100.0%) | 0 (0.0%) |
| $25,000 to $49,999 | 882 (100.0%) | 0 (0.0%) |
| $50,000 to $74,999 | 616 (96.1%) | 25 (3.9%) |
| $75,000 to $99,999 | 1,713 (100.0%) | 0 (0.0%) |
| $100,000 and over | 4,922 (98.5%) | 73 (1.5%) |
Public vs Private Health Insurance Coverage by Age in Saline
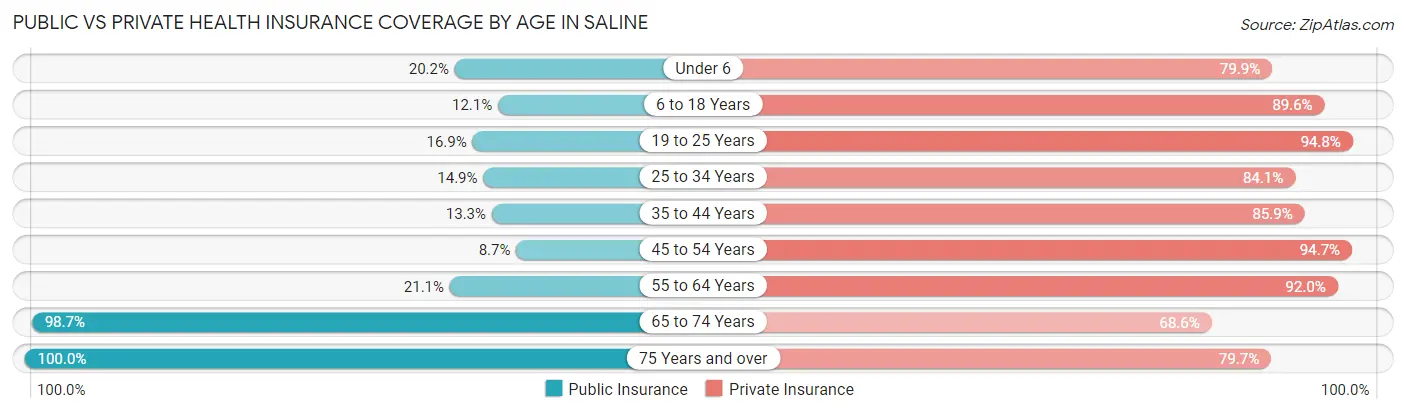
| Age Bracket | Public Insurance | Private Insurance |
| Under 6 | 136 (20.2%) | 539 (79.8%) |
| 6 to 18 Years | 142 (12.1%) | 1,049 (89.6%) |
| 19 to 25 Years | 101 (16.9%) | 568 (94.8%) |
| 25 to 34 Years | 116 (14.8%) | 657 (84.1%) |
| 35 to 44 Years | 171 (13.3%) | 1,107 (85.9%) |
| 45 to 54 Years | 87 (8.7%) | 944 (94.7%) |
| 55 to 64 Years | 222 (21.1%) | 970 (92.0%) |
| 65 to 74 Years | 1,346 (98.7%) | 936 (68.6%) |
| 75 Years and over | 861 (100.0%) | 686 (79.7%) |
| Total | 3,182 (36.2%) | 7,456 (84.8%) |
Disability Status by Sex by Age in Saline
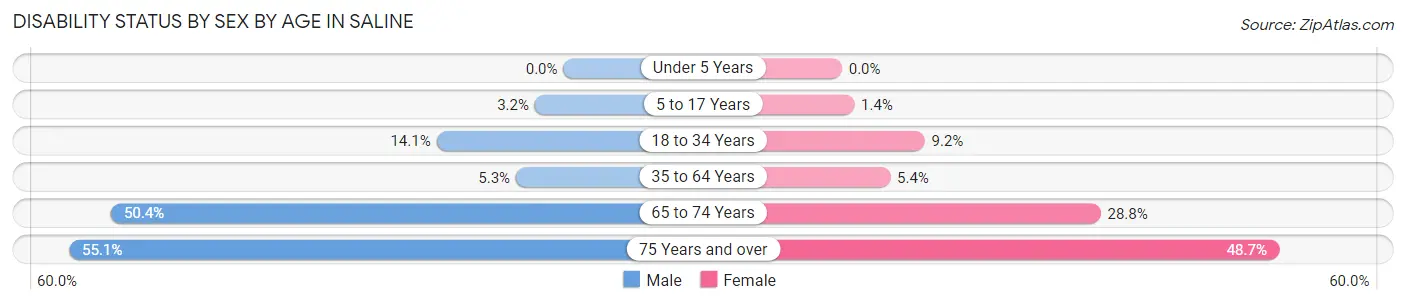
| Age Bracket | Male | Female |
| Under 5 Years | 0 (0.0%) | 0 (0.0%) |
| 5 to 17 Years | 19 (3.2%) | 7 (1.4%) |
| 18 to 34 Years | 126 (14.1%) | 57 (9.2%) |
| 35 to 64 Years | 86 (5.3%) | 92 (5.4%) |
| 65 to 74 Years | 334 (50.4%) | 202 (28.8%) |
| 75 Years and over | 207 (55.0%) | 236 (48.7%) |
Disability Class by Sex by Age in Saline
Disability Class: Hearing Difficulty
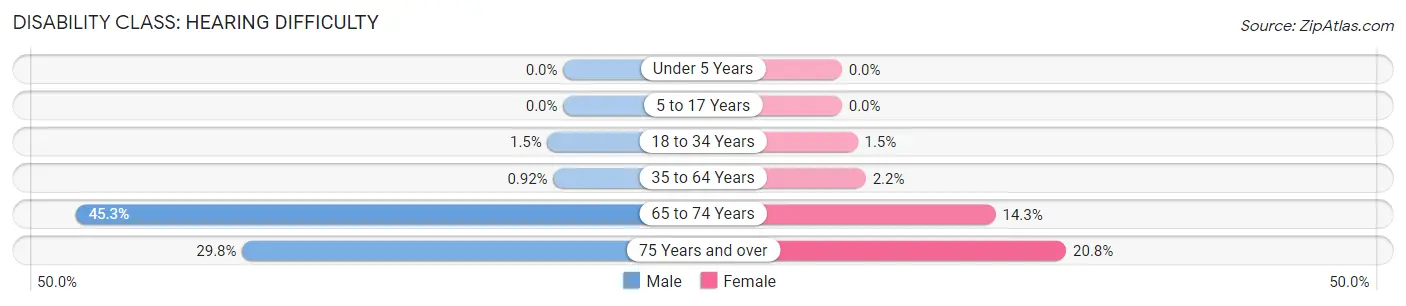
| Age Bracket | Male | Female |
| Under 5 Years | 0 (0.0%) | 0 (0.0%) |
| 5 to 17 Years | 0 (0.0%) | 0 (0.0%) |
| 18 to 34 Years | 13 (1.5%) | 9 (1.5%) |
| 35 to 64 Years | 15 (0.9%) | 38 (2.2%) |
| 65 to 74 Years | 300 (45.3%) | 100 (14.3%) |
| 75 Years and over | 112 (29.8%) | 101 (20.8%) |
Disability Class: Vision Difficulty
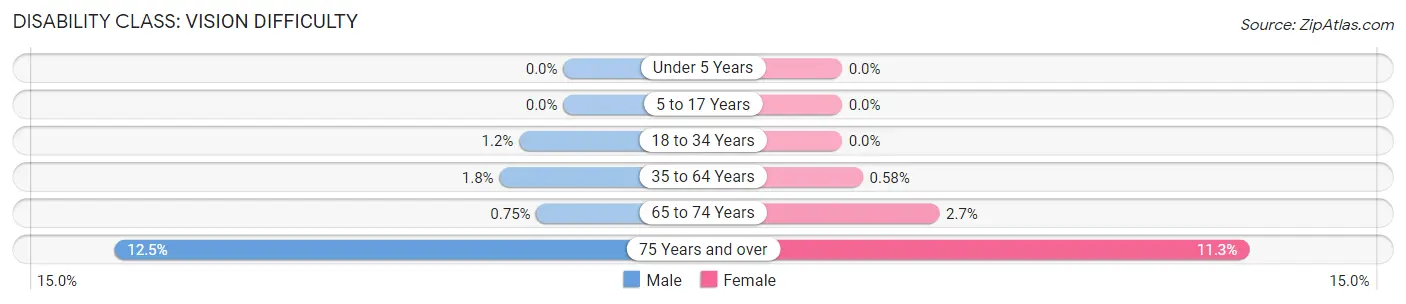
| Age Bracket | Male | Female |
| Under 5 Years | 0 (0.0%) | 0 (0.0%) |
| 5 to 17 Years | 0 (0.0%) | 0 (0.0%) |
| 18 to 34 Years | 11 (1.2%) | 0 (0.0%) |
| 35 to 64 Years | 29 (1.8%) | 10 (0.6%) |
| 65 to 74 Years | 5 (0.7%) | 19 (2.7%) |
| 75 Years and over | 47 (12.5%) | 55 (11.3%) |
Disability Class: Cognitive Difficulty
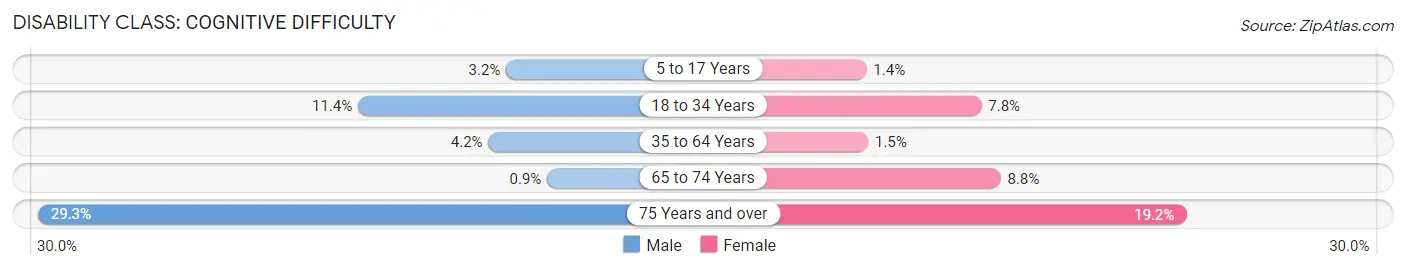
| Age Bracket | Male | Female |
| 5 to 17 Years | 19 (3.2%) | 7 (1.4%) |
| 18 to 34 Years | 102 (11.4%) | 48 (7.8%) |
| 35 to 64 Years | 68 (4.2%) | 25 (1.5%) |
| 65 to 74 Years | 6 (0.9%) | 62 (8.8%) |
| 75 Years and over | 110 (29.3%) | 93 (19.2%) |
Disability Class: Ambulatory Difficulty
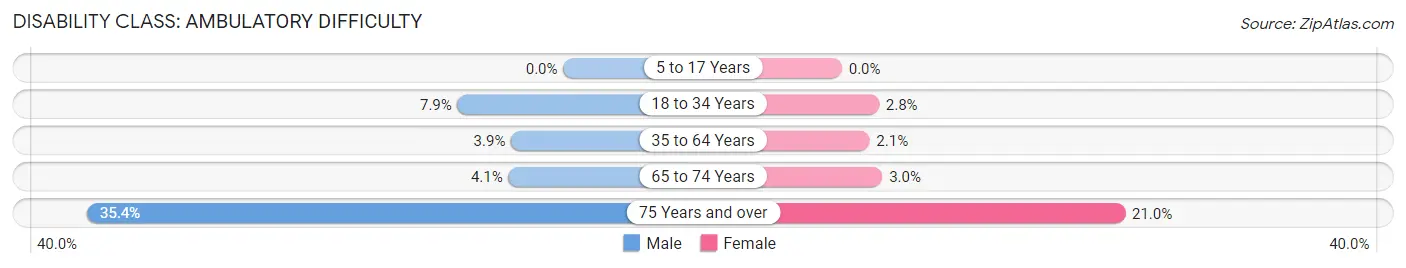
| Age Bracket | Male | Female |
| 5 to 17 Years | 0 (0.0%) | 0 (0.0%) |
| 18 to 34 Years | 70 (7.9%) | 17 (2.8%) |
| 35 to 64 Years | 63 (3.9%) | 35 (2.1%) |
| 65 to 74 Years | 27 (4.1%) | 21 (3.0%) |
| 75 Years and over | 133 (35.4%) | 102 (21.0%) |
Disability Class: Self-Care Difficulty
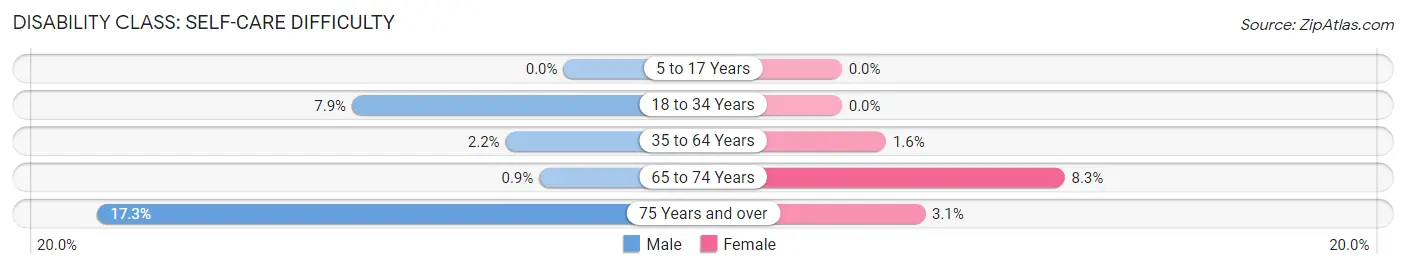
| Age Bracket | Male | Female |
| 5 to 17 Years | 0 (0.0%) | 0 (0.0%) |
| 18 to 34 Years | 70 (7.9%) | 0 (0.0%) |
| 35 to 64 Years | 35 (2.1%) | 28 (1.6%) |
| 65 to 74 Years | 6 (0.9%) | 58 (8.3%) |
| 75 Years and over | 65 (17.3%) | 15 (3.1%) |
Technology Access in Saline
Computing Device Access in Saline
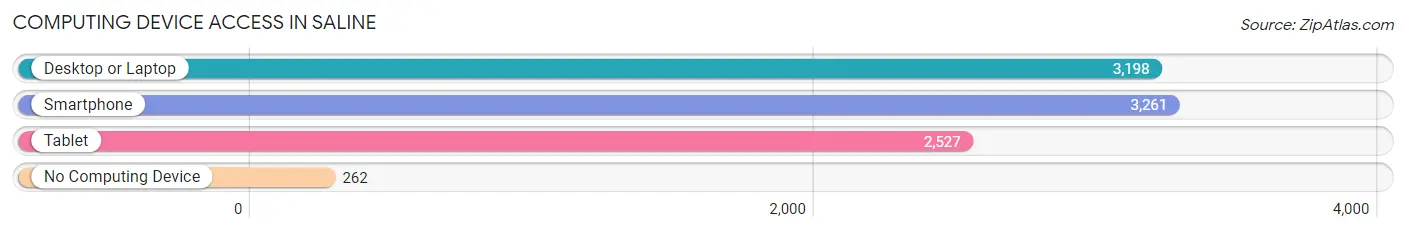
| Device Type | # Households | % Households |
| Desktop or Laptop | 3,198 | 85.6% |
| Smartphone | 3,261 | 87.3% |
| Tablet | 2,527 | 67.6% |
| No Computing Device | 262 | 7.0% |
| Total | 3,737 | 100.0% |
Internet Access in Saline
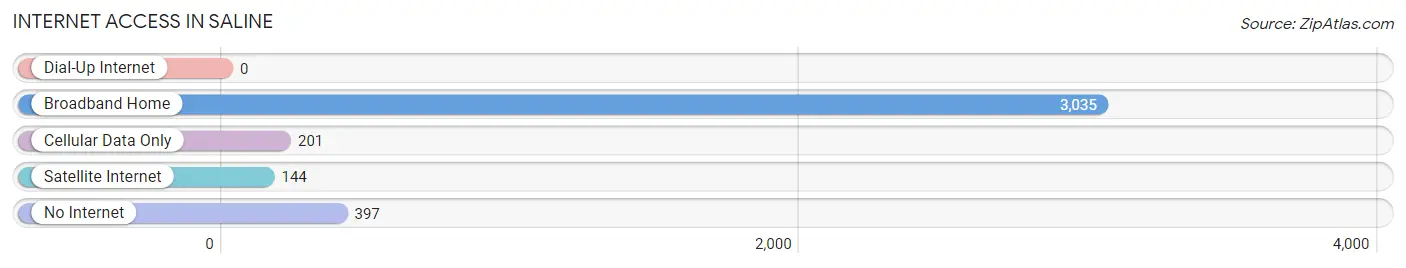
| Internet Type | # Households | % Households |
| Dial-Up Internet | 0 | 0.0% |
| Broadband Home | 3,035 | 81.2% |
| Cellular Data Only | 201 | 5.4% |
| Satellite Internet | 144 | 3.8% |
| No Internet | 397 | 10.6% |
| Total | 3,737 | 100.0% |
Saline Summary
Saline, Michigan is a small city located in Washtenaw County, Michigan. It is situated about 8 miles south of Ann Arbor and about 40 miles west of Detroit. The city has a population of 8,810 as of the 2010 census.
History
The area that is now Saline was first settled in 1824 by a group of settlers from New York. The settlement was originally called Salt Springs, due to the presence of salt springs in the area. The name was changed to Saline in 1832, after the Saline River, which runs through the city.
In 1835 the first post office was established in Saline The city was incorporated in 1867
Geography
Saline is located at 42° 4' N, 83° 48' W. It is situated in the Huron River watershed, and is bordered by the cities of Ann Arbor, Ypsilanti, and Milan. The city covers an area of 4.2 square miles, and has a population density of 2,072 people per square mile.
Economy
The economy of Saline is largely based on manufacturing and retail. The city is home to several manufacturing companies, including Saline Fabricating, Inc., Saline Tool & Die, and Saline Automotive.
Retail is also an important part of the local economy. The city is home to several shopping centers, including the Saline Shopping Center, the Saline Marketplace, and the Saline Towne Center.
Demographics
As of the 2010 census, the population of Saline was 8,810. The racial makeup of the city was 92.3% White, 3.2% African American, 0.3% Native American, 1.7% Asian, 0.1% Pacific Islander, 0.9% from other races, and 1.6% from two or more races. Hispanic or Latino of any race were 3.2% of the population.
The median household income in Saline was $60,945 in 2010. The median age of the city was 40.3 years.
Conclusion
Saline, Michigan is a small city located in Washtenaw County, Michigan. It has a population of 8,810 as of the 2010 census. The city's economy is largely based on manufacturing and retail. The racial makeup of the city is 92.3% White, 3.2% African American, 0.3% Native American, 1.7% Asian, 0.1% Pacific Islander, 0.9% from other races, and 1.6% from two or more races. The median household income in Saline was $60,945 in 2010.
Common Questions
What is Per Capita Income in Saline?
Per Capita income in Saline is $44,741.
What is the Median Family Income in Saline?
Median Family Income in Saline is $111,977.
What is the Median Household income in Saline?
Median Household Income in Saline is $88,388.
What is Income or Wage Gap in Saline?
Income or Wage Gap in Saline is 11.2%.
Women in Saline earn 88.8 cents for every dollar earned by a man.
What is Family Income Deficit in Saline?
Family Income Deficit in Saline is $10,892.
Families that are below poverty line in Saline earn $10,892 less on average than the poverty threshold level.
What is Inequality or Gini Index in Saline?
Inequality or Gini Index in Saline is 0.38.
What is the Total Population of Saline?
Total Population of Saline is 8,973.
What is the Total Male Population of Saline?
Total Male Population of Saline is 4,429.
What is the Total Female Population of Saline?
Total Female Population of Saline is 4,544.
What is the Ratio of Males per 100 Females in Saline?
There are 97.47 Males per 100 Females in Saline.
What is the Ratio of Females per 100 Males in Saline?
There are 102.60 Females per 100 Males in Saline.
What is the Median Population Age in Saline?
Median Population Age in Saline is 44.6 Years.
What is the Average Family Size in Saline
Average Family Size in Saline is 2.8 People.
What is the Average Household Size in Saline
Average Household Size in Saline is 2.4 People.
How Large is the Labor Force in Saline?
There are 4,567 People in the Labor Forcein in Saline.
What is the Percentage of People in the Labor Force in Saline?
61.3% of People are in the Labor Force in Saline.
What is the Unemployment Rate in Saline?
Unemployment Rate in Saline is 5.7%.