Zip Codes with the Highest Percentage of Households with Income Above $100,000 in Highland, MI
RELATED REPORTS & OPTIONS
Household Income | $100k+
Highland
Compare Zip Codes
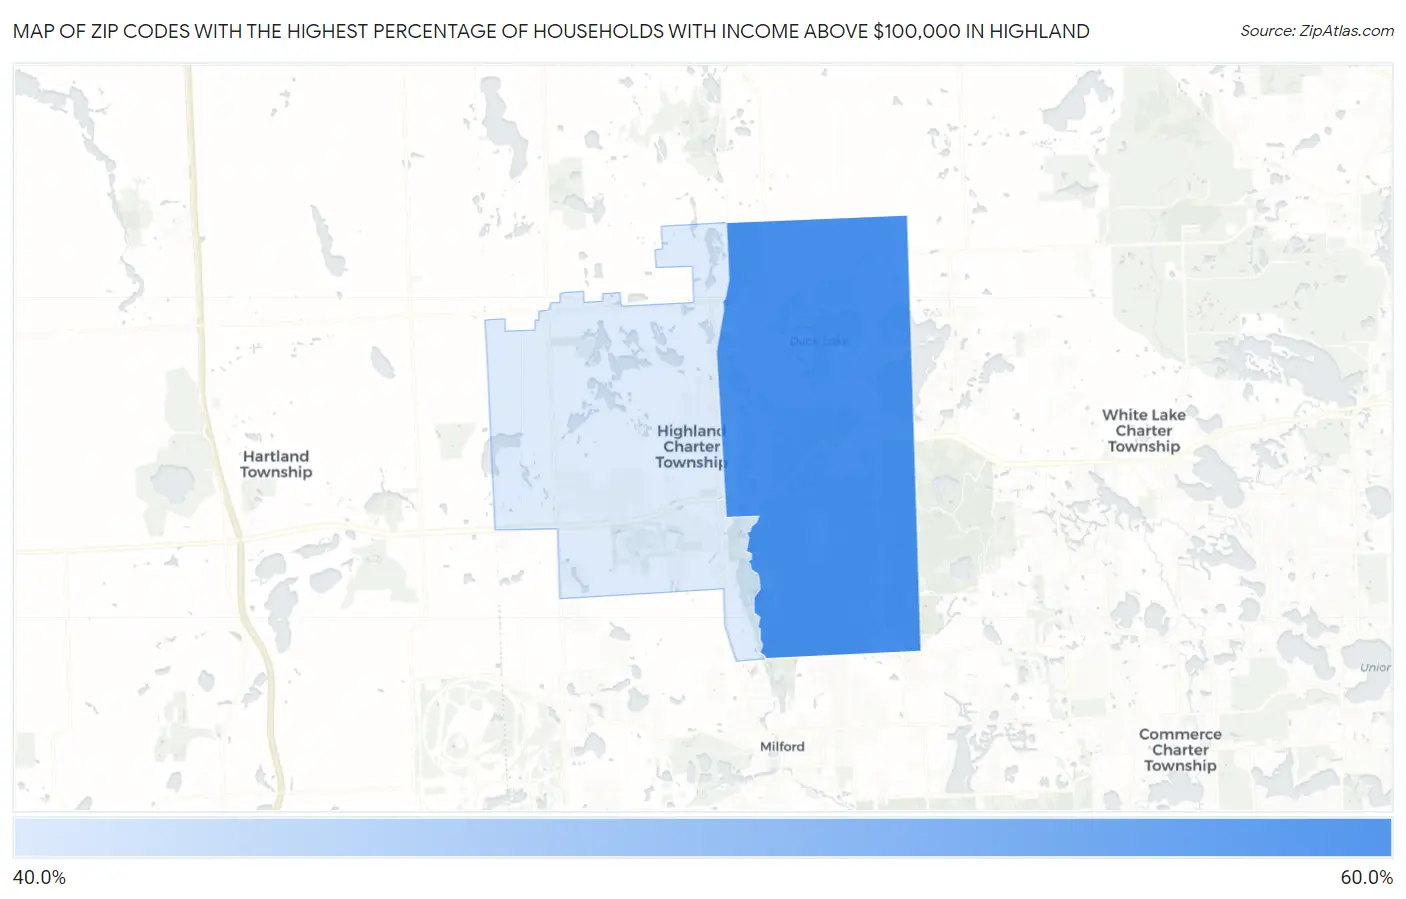
Map of Zip Codes with the Highest Percentage of Households with Income Above $100,000 in Highland
47.0%
50.7%
Zip Codes with the Highest Percentage of Households with Income Above $100,000 in Highland, MI
| Zip Code | Households with Income > $100k | vs State | vs National | |
| 1. | 48356 | 50.7% | 32.5%(+18.2)#74 | 37.3%(+13.4)#4,634 |
| 2. | 48357 | 47.0% | 32.5%(+14.5)#115 | 37.3%(+9.70)#5,830 |
1
Common Questions
What are the Top Zip Codes with the Highest Percentage of Households with Income Above $100,000 in Highland, MI?
Top Zip Codes with the Highest Percentage of Households with Income Above $100,000 in Highland, MI are:
What zip code has the Highest Percentage of Households with Income Above $100,000 in Highland, MI?
48356 has the Highest Percentage of Households with Income Above $100,000 in Highland, MI with 50.7%.
What is the Percentage of Households with Income Above $100,000 in Michigan?
Percentage of Households with Income Above $100,000 in Michigan is 32.5%.
What is the Percentage of Households with Income Above $100,000 in the United States?
Percentage of Households with Income Above $100,000 in the United States is 37.3%.