Twin Lake, MI Map & Demographics
Twin Lake Map
Twin Lake Overview
$44,633
PER CAPITA INCOME
$82,344
AVG FAMILY INCOME
$78,322
AVG HOUSEHOLD INCOME
40.4%
WAGE / INCOME GAP [ % ]
59.6¢/ $1
WAGE / INCOME GAP [ $ ]
0.40
INEQUALITY / GINI INDEX
1,885
TOTAL POPULATION
1,013
MALE POPULATION
872
FEMALE POPULATION
116.17
MALES / 100 FEMALES
86.08
FEMALES / 100 MALES
46.3
MEDIAN AGE
2.7
AVG FAMILY SIZE
2.4
AVG HOUSEHOLD SIZE
1,025
LABOR FORCE [ PEOPLE ]
63.7%
PERCENT IN LABOR FORCE
21.1%
UNEMPLOYMENT RATE
Twin Lake Zip Codes
Twin Lake Area Codes
Income in Twin Lake
Income Overview in Twin Lake
Per Capita Income in Twin Lake is $44,633, while median incomes of families and households are $82,344 and $78,322 respectively.
| Characteristic | Number | Measure |
| Per Capita Income | 1,885 | $44,633 |
| Median Family Income | 607 | $82,344 |
| Mean Family Income | 607 | $117,811 |
| Median Household Income | 797 | $78,322 |
| Mean Household Income | 797 | $104,561 |
| Income Deficit | 607 | $0 |
| Wage / Income Gap (%) | 1,885 | 40.37% |
| Wage / Income Gap ($) | 1,885 | 59.63¢ per $1 |
| Gini / Inequality Index | 1,885 | 0.40 |
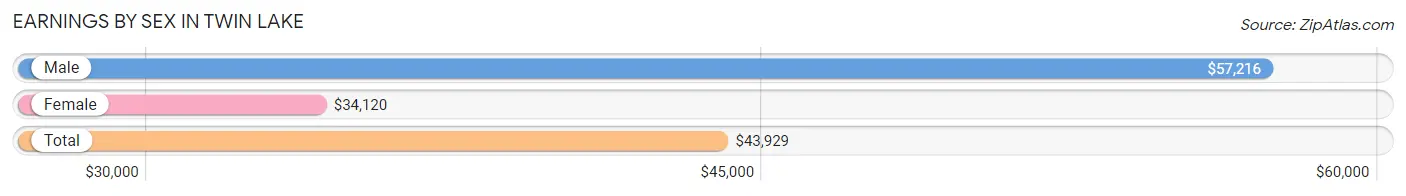
Earnings by Sex in Twin Lake
Average Earnings in Twin Lake are $43,929, $57,216 for men and $34,120 for women, a difference of 40.4%.
| Sex | Number | Average Earnings |
| Male | 449 (51.1%) | $57,216 |
| Female | 429 (48.9%) | $34,120 |
| Total | 878 (100.0%) | $43,929 |
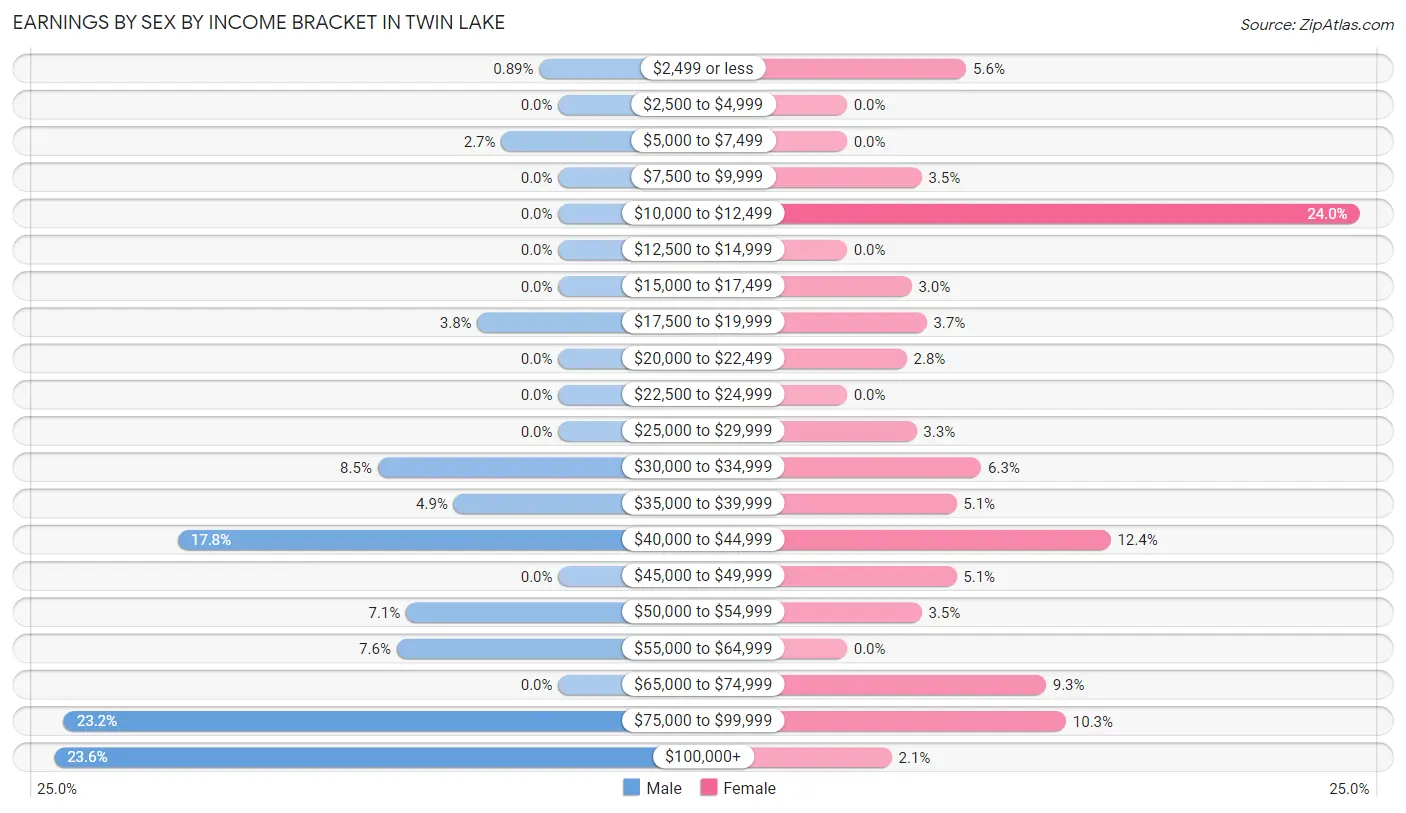
Earnings by Sex by Income Bracket in Twin Lake
The most common earnings brackets in Twin Lake are $100,000+ for men (106 | 23.6%) and $10,000 to $12,499 for women (103 | 24.0%).
| Income | Male | Female |
| $2,499 or less | 4 (0.9%) | 24 (5.6%) |
| $2,500 to $4,999 | 0 (0.0%) | 0 (0.0%) |
| $5,000 to $7,499 | 12 (2.7%) | 0 (0.0%) |
| $7,500 to $9,999 | 0 (0.0%) | 15 (3.5%) |
| $10,000 to $12,499 | 0 (0.0%) | 103 (24.0%) |
| $12,500 to $14,999 | 0 (0.0%) | 0 (0.0%) |
| $15,000 to $17,499 | 0 (0.0%) | 13 (3.0%) |
| $17,500 to $19,999 | 17 (3.8%) | 16 (3.7%) |
| $20,000 to $22,499 | 0 (0.0%) | 12 (2.8%) |
| $22,500 to $24,999 | 0 (0.0%) | 0 (0.0%) |
| $25,000 to $29,999 | 0 (0.0%) | 14 (3.3%) |
| $30,000 to $34,999 | 38 (8.5%) | 27 (6.3%) |
| $35,000 to $39,999 | 22 (4.9%) | 22 (5.1%) |
| $40,000 to $44,999 | 80 (17.8%) | 53 (12.3%) |
| $45,000 to $49,999 | 0 (0.0%) | 22 (5.1%) |
| $50,000 to $54,999 | 32 (7.1%) | 15 (3.5%) |
| $55,000 to $64,999 | 34 (7.6%) | 0 (0.0%) |
| $65,000 to $74,999 | 0 (0.0%) | 40 (9.3%) |
| $75,000 to $99,999 | 104 (23.2%) | 44 (10.3%) |
| $100,000+ | 106 (23.6%) | 9 (2.1%) |
| Total | 449 (100.0%) | 429 (100.0%) |
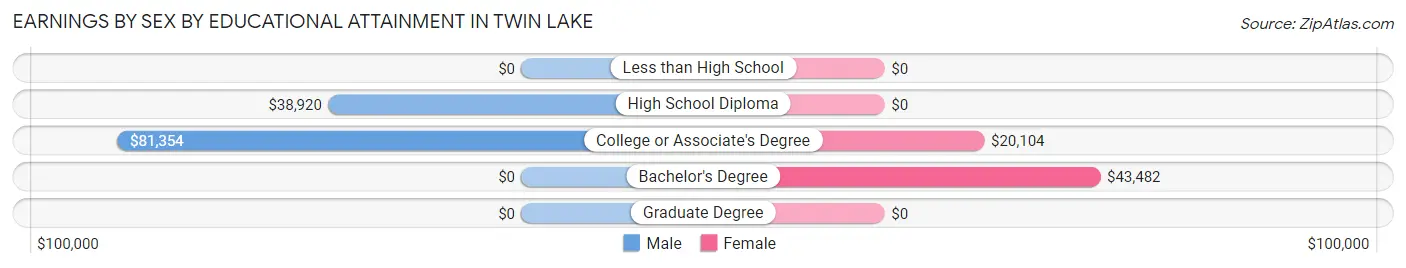
Earnings by Sex by Educational Attainment in Twin Lake
Average earnings in Twin Lake are $58,229 for men and $40,160 for women, a difference of 31.0%. Men with an educational attainment of college or associate's degree enjoy the highest average annual earnings of $81,354, while those with high school diploma education earn the least with $38,920. Women with an educational attainment of bachelor's degree earn the most with the average annual earnings of $43,482, while those with college or associate's degree education have the smallest earnings of $20,104.
| Educational Attainment | Male Income | Female Income |
| Less than High School | - | - |
| High School Diploma | $38,920 | $0 |
| College or Associate's Degree | $81,354 | $20,104 |
| Bachelor's Degree | - | - |
| Graduate Degree | - | - |
| Total | $58,229 | $40,160 |
Family Income in Twin Lake
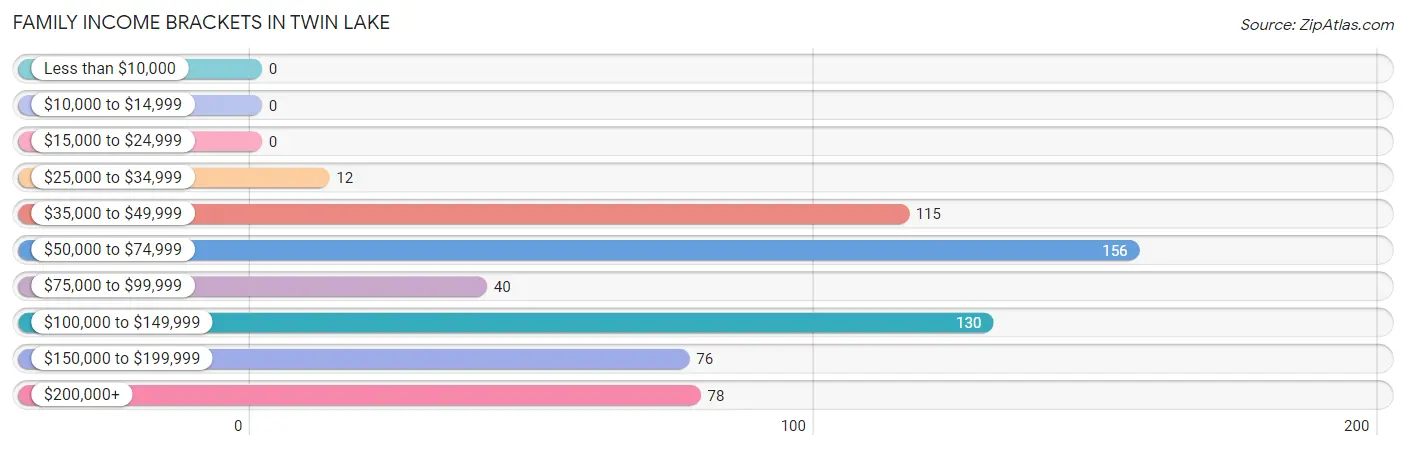
Family Income Brackets in Twin Lake
According to the Twin Lake family income data, there are 156 families falling into the $50,000 to $74,999 income range, which is the most common income bracket and makes up 25.7% of all families.
| Income Bracket | # Families | % Families |
| Less than $10,000 | 0 | 0.0% |
| $10,000 to $14,999 | 0 | 0.0% |
| $15,000 to $24,999 | 0 | 0.0% |
| $25,000 to $34,999 | 12 | 2.0% |
| $35,000 to $49,999 | 115 | 18.9% |
| $50,000 to $74,999 | 156 | 25.7% |
| $75,000 to $99,999 | 40 | 6.6% |
| $100,000 to $149,999 | 130 | 21.4% |
| $150,000 to $199,999 | 76 | 12.5% |
| $200,000+ | 78 | 12.9% |
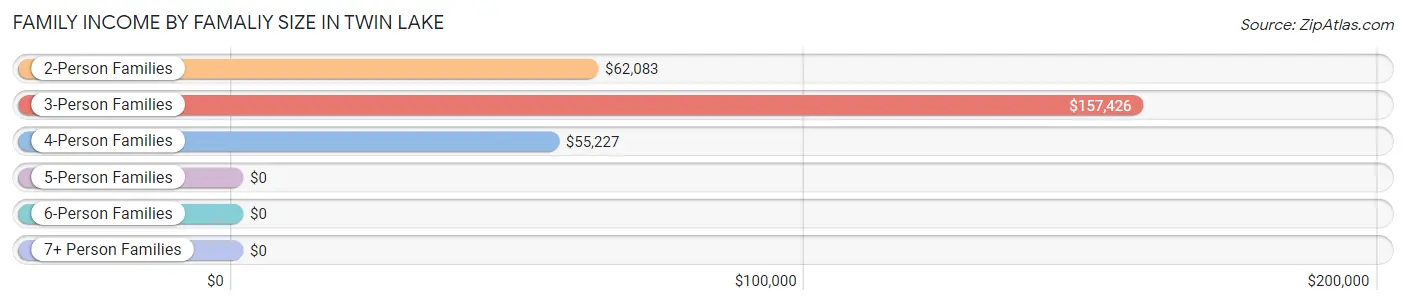
Family Income by Famaliy Size in Twin Lake
3-person families (181 | 29.8%) account for the highest median family income in Twin Lake with $157,426 per family, while 3-person families (181 | 29.8%) have the highest median income of $52,475 per family member.
| Income Bracket | # Families | Median Income |
| 2-Person Families | 320 (52.7%) | $62,083 |
| 3-Person Families | 181 (29.8%) | $157,426 |
| 4-Person Families | 106 (17.5%) | $55,227 |
| 5-Person Families | 0 (0.0%) | $0 |
| 6-Person Families | 0 (0.0%) | $0 |
| 7+ Person Families | 0 (0.0%) | $0 |
| Total | 607 (100.0%) | $82,344 |
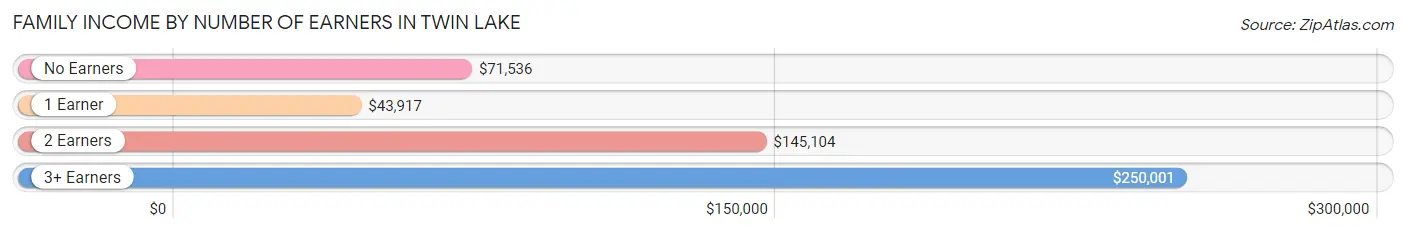
Family Income by Number of Earners in Twin Lake
The median family income in Twin Lake is $82,344, with families comprising 3+ earners (107) having the highest median family income of $250,001, while families with 1 earner (115) have the lowest median family income of $43,917, accounting for 17.6% and 19.0% of families, respectively.
| Number of Earners | # Families | Median Income |
| No Earners | 205 (33.8%) | $71,536 |
| 1 Earner | 115 (19.0%) | $43,917 |
| 2 Earners | 180 (29.6%) | $145,104 |
| 3+ Earners | 107 (17.6%) | $250,001 |
| Total | 607 (100.0%) | $82,344 |
Household Income in Twin Lake
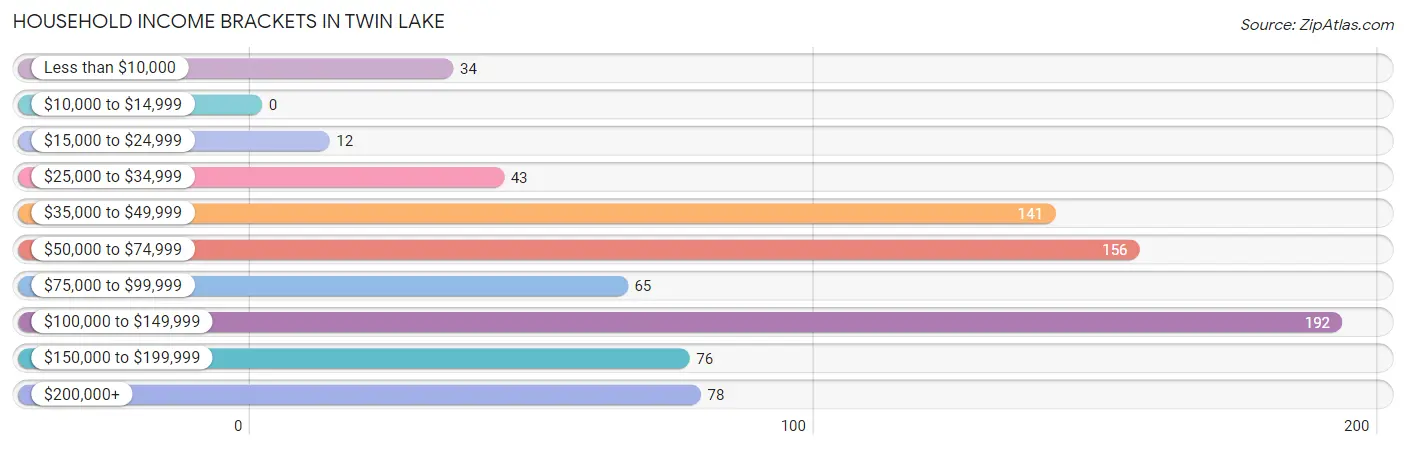
Household Income Brackets in Twin Lake
With 192 households falling in the category, the $100,000 to $149,999 income range is the most frequent in Twin Lake, accounting for 24.1% of all households.
| Income Bracket | # Households | % Households |
| Less than $10,000 | 34 | 4.3% |
| $10,000 to $14,999 | 0 | 0.0% |
| $15,000 to $24,999 | 12 | 1.5% |
| $25,000 to $34,999 | 43 | 5.4% |
| $35,000 to $49,999 | 141 | 17.7% |
| $50,000 to $74,999 | 156 | 19.6% |
| $75,000 to $99,999 | 65 | 8.2% |
| $100,000 to $149,999 | 192 | 24.1% |
| $150,000 to $199,999 | 76 | 9.5% |
| $200,000+ | 78 | 9.8% |
Household Income by Householder Age in Twin Lake
The median household income in Twin Lake is $78,322, with the highest median household income of $122,431 found in the 45 to 64 years age bracket for the primary householder. A total of 297 households (37.3%) fall into this category.
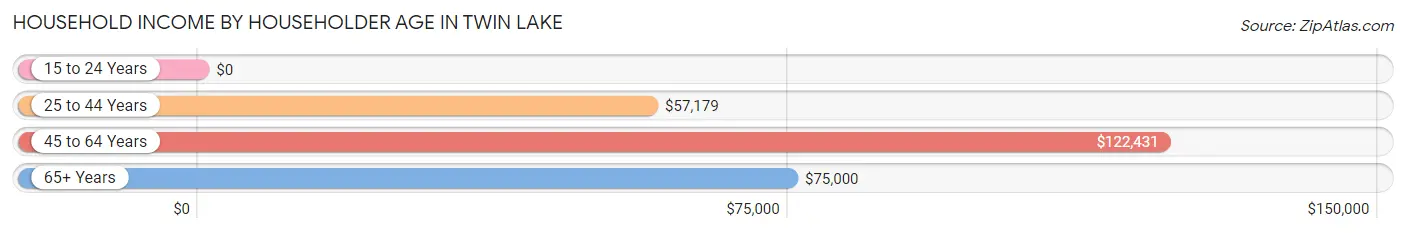
| Income Bracket | # Households | Median Income |
| 15 to 24 Years | 0 (0.0%) | $0 |
| 25 to 44 Years | 248 (31.1%) | $57,179 |
| 45 to 64 Years | 297 (37.3%) | $122,431 |
| 65+ Years | 252 (31.6%) | $75,000 |
| Total | 797 (100.0%) | $78,322 |
Poverty in Twin Lake
Income Below Poverty by Sex and Age in Twin Lake
With 3.4% poverty level for males and 2.3% for females among the residents of Twin Lake, 55 to 64 year old males and 65 to 74 year old females are the most vulnerable to poverty, with 34 males (20.1%) and 20 females (11.7%) in their respective age groups living below the poverty level.
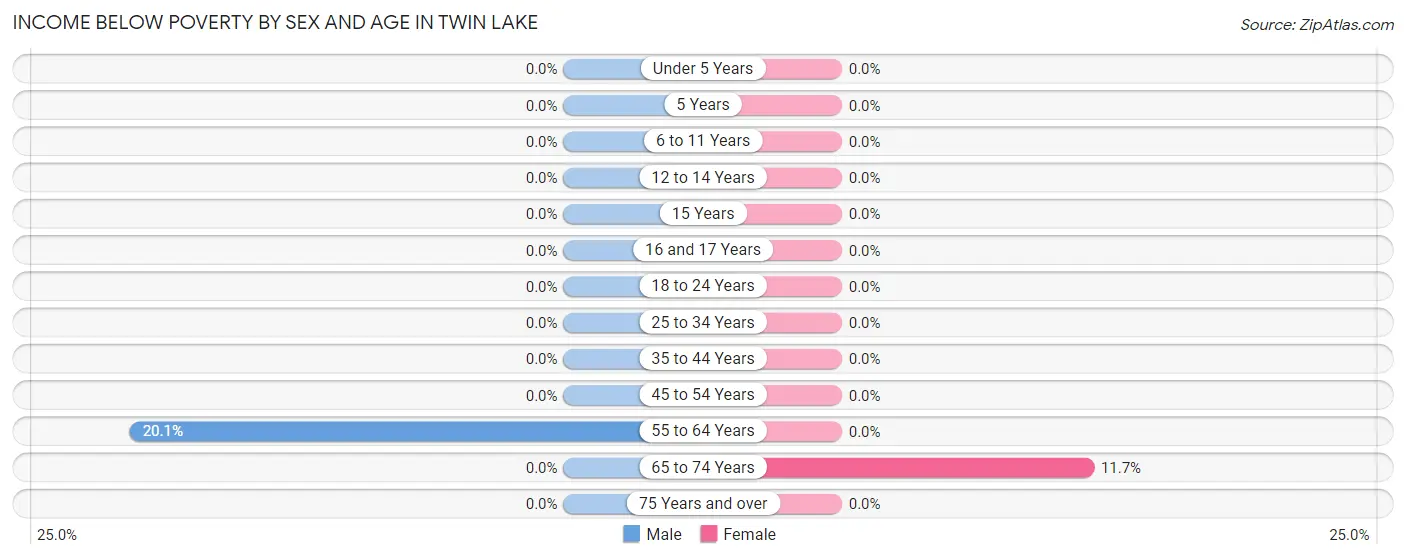
| Age Bracket | Male | Female |
| Under 5 Years | 0 (0.0%) | 0 (0.0%) |
| 5 Years | 0 (0.0%) | 0 (0.0%) |
| 6 to 11 Years | 0 (0.0%) | 0 (0.0%) |
| 12 to 14 Years | 0 (0.0%) | 0 (0.0%) |
| 15 Years | 0 (0.0%) | 0 (0.0%) |
| 16 and 17 Years | 0 (0.0%) | 0 (0.0%) |
| 18 to 24 Years | 0 (0.0%) | 0 (0.0%) |
| 25 to 34 Years | 0 (0.0%) | 0 (0.0%) |
| 35 to 44 Years | 0 (0.0%) | 0 (0.0%) |
| 45 to 54 Years | 0 (0.0%) | 0 (0.0%) |
| 55 to 64 Years | 34 (20.1%) | 0 (0.0%) |
| 65 to 74 Years | 0 (0.0%) | 20 (11.7%) |
| 75 Years and over | 0 (0.0%) | 0 (0.0%) |
| Total | 34 (3.4%) | 20 (2.3%) |
Income Above Poverty by Sex and Age in Twin Lake
According to the poverty statistics in Twin Lake, males aged under 5 years and females aged under 5 years are the age groups that are most secure financially, with 100.0% of males and 100.0% of females in these age groups living above the poverty line.
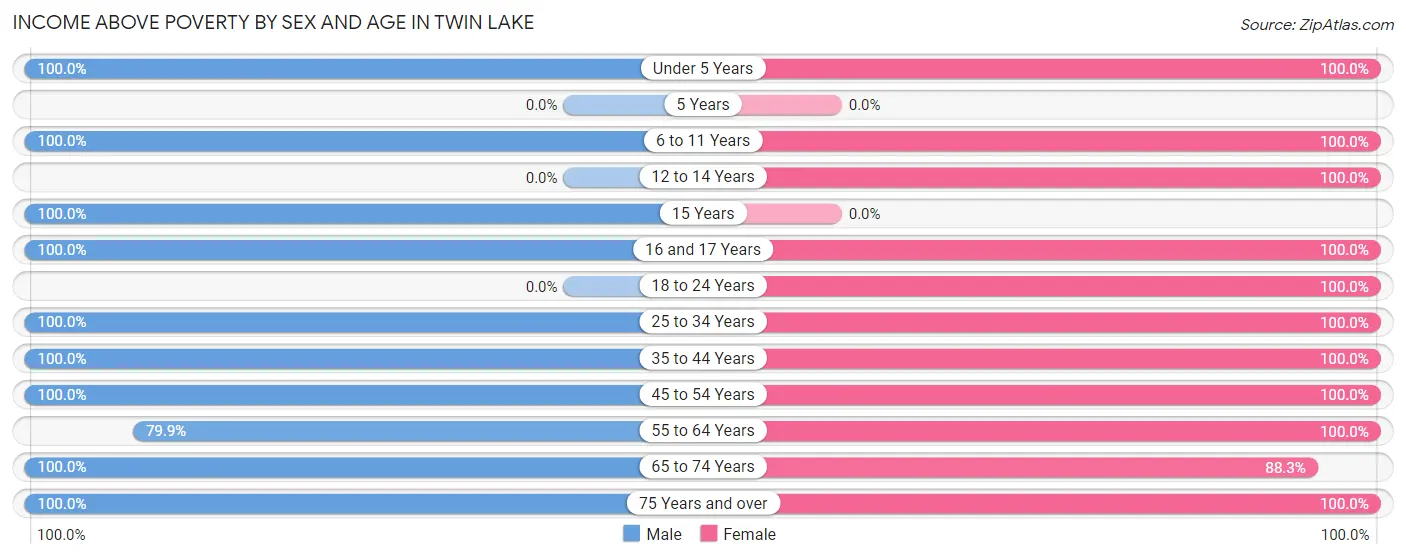
| Age Bracket | Male | Female |
| Under 5 Years | 62 (100.0%) | 50 (100.0%) |
| 5 Years | 0 (0.0%) | 0 (0.0%) |
| 6 to 11 Years | 66 (100.0%) | 17 (100.0%) |
| 12 to 14 Years | 0 (0.0%) | 34 (100.0%) |
| 15 Years | 47 (100.0%) | 0 (0.0%) |
| 16 and 17 Years | 12 (100.0%) | 24 (100.0%) |
| 18 to 24 Years | 0 (0.0%) | 105 (100.0%) |
| 25 to 34 Years | 159 (100.0%) | 98 (100.0%) |
| 35 to 44 Years | 128 (100.0%) | 129 (100.0%) |
| 45 to 54 Years | 143 (100.0%) | 99 (100.0%) |
| 55 to 64 Years | 135 (79.9%) | 110 (100.0%) |
| 65 to 74 Years | 125 (100.0%) | 151 (88.3%) |
| 75 Years and over | 102 (100.0%) | 35 (100.0%) |
| Total | 979 (96.6%) | 852 (97.7%) |
Income Below Poverty Among Married-Couple Families in Twin Lake
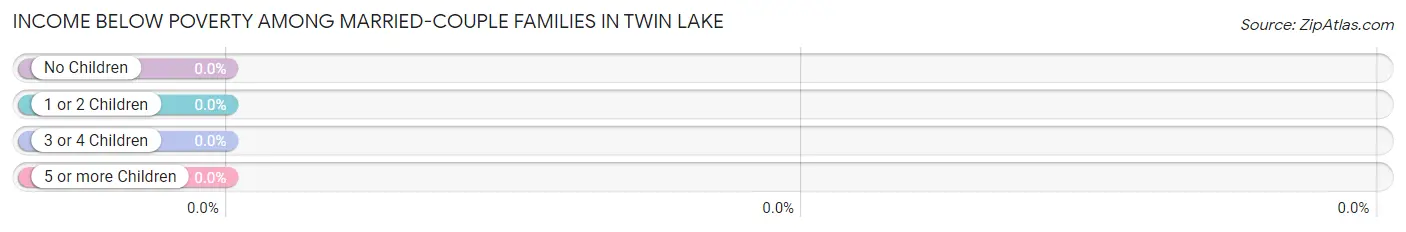
| Children | Above Poverty | Below Poverty |
| No Children | 343 (100.0%) | 0 (0.0%) |
| 1 or 2 Children | 145 (100.0%) | 0 (0.0%) |
| 3 or 4 Children | 0 (0.0%) | 0 (0.0%) |
| 5 or more Children | 0 (0.0%) | 0 (0.0%) |
| Total | 488 (100.0%) | 0 (0.0%) |
Income Below Poverty Among Single-Parent Households in Twin Lake
| Children | Single Father | Single Mother |
| No Children | 0 (0.0%) | 0 (0.0%) |
| 1 or 2 Children | 0 (0.0%) | 0 (0.0%) |
| 3 or 4 Children | 0 (0.0%) | 0 (0.0%) |
| 5 or more Children | 0 (0.0%) | 0 (0.0%) |
| Total | 0 (0.0%) | 0 (0.0%) |
Income Below Poverty Among Married-Couple vs Single-Parent Households in Twin Lake
| Children | Married-Couple Families | Single-Parent Households |
| No Children | 0 (0.0%) | 0 (0.0%) |
| 1 or 2 Children | 0 (0.0%) | 0 (0.0%) |
| 3 or 4 Children | 0 (0.0%) | 0 (0.0%) |
| 5 or more Children | 0 (0.0%) | 0 (0.0%) |
| Total | 0 (0.0%) | 0 (0.0%) |
Race in Twin Lake
The most populous races in Twin Lake are White / Caucasian (1,698 | 90.1%), Two or more Races (155 | 8.2%), and Hispanic or Latino (107 | 5.7%).
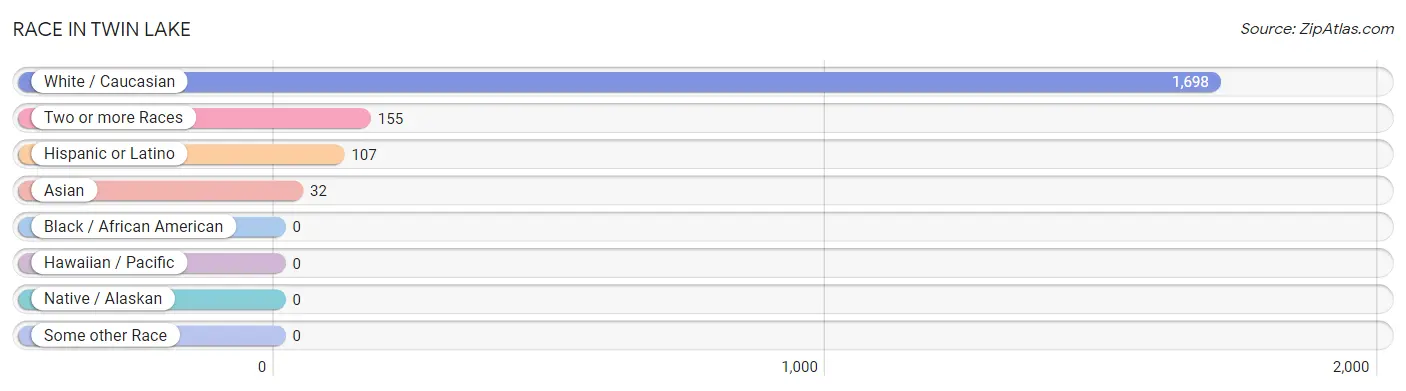
| Race | # Population | % Population |
| Asian | 32 | 1.7% |
| Black / African American | 0 | 0.0% |
| Hawaiian / Pacific | 0 | 0.0% |
| Hispanic or Latino | 107 | 5.7% |
| Native / Alaskan | 0 | 0.0% |
| White / Caucasian | 1,698 | 90.1% |
| Two or more Races | 155 | 8.2% |
| Some other Race | 0 | 0.0% |
| Total | 1,885 | 100.0% |
Ancestry in Twin Lake
The most populous ancestries reported in Twin Lake are German (534 | 28.3%), Dutch (492 | 26.1%), English (325 | 17.2%), American (152 | 8.1%), and Burmese (98 | 5.2%), together accounting for 84.9% of all Twin Lake residents.
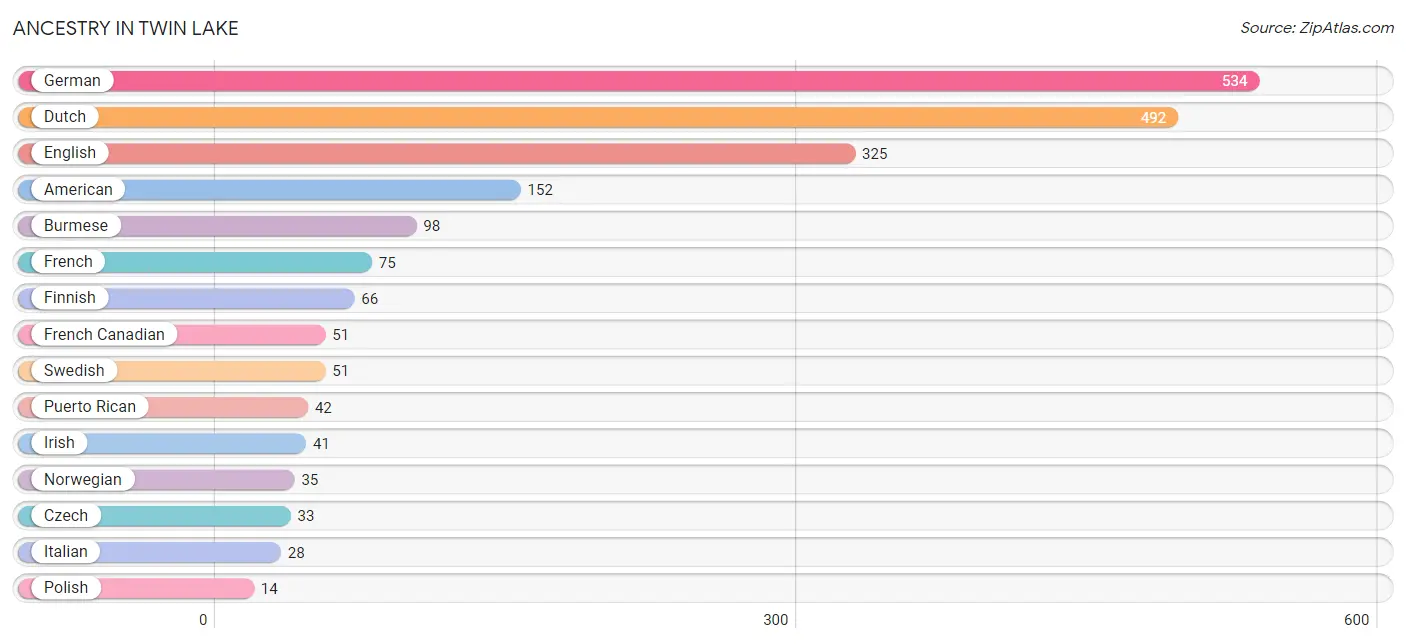
| Ancestry | # Population | % Population |
| American | 152 | 8.1% |
| Burmese | 98 | 5.2% |
| Czech | 33 | 1.8% |
| Dutch | 492 | 26.1% |
| English | 325 | 17.2% |
| Finnish | 66 | 3.5% |
| French | 75 | 4.0% |
| French Canadian | 51 | 2.7% |
| German | 534 | 28.3% |
| Indian (Asian) | 8 | 0.4% |
| Irish | 41 | 2.2% |
| Italian | 28 | 1.5% |
| Norwegian | 35 | 1.9% |
| Polish | 14 | 0.7% |
| Puerto Rican | 42 | 2.2% |
| Scottish | 13 | 0.7% |
| Spanish | 4 | 0.2% |
| Swedish | 51 | 2.7% | View All 18 Rows |
Immigrants in Twin Lake
The most numerous immigrant groups reported in Twin Lake came from Asia (32 | 1.7%), Eastern Asia (32 | 1.7%), Korea (24 | 1.3%), Europe (13 | 0.7%), and Italy (13 | 0.7%), together accounting for 6.1% of all Twin Lake residents.
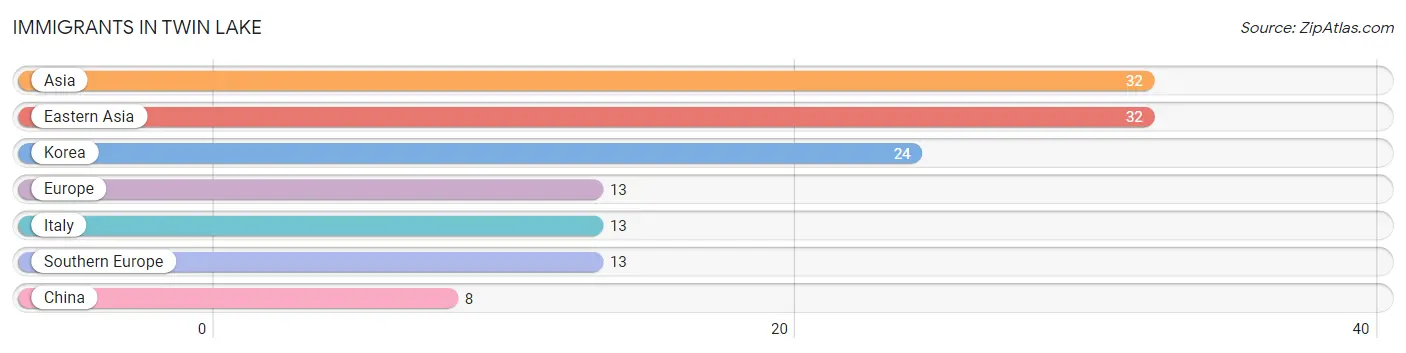
| Immigration Origin | # Population | % Population |
| Asia | 32 | 1.7% |
| China | 8 | 0.4% |
| Eastern Asia | 32 | 1.7% |
| Europe | 13 | 0.7% |
| Italy | 13 | 0.7% |
| Korea | 24 | 1.3% |
| Southern Europe | 13 | 0.7% | View All 7 Rows |
Sex and Age in Twin Lake
Sex and Age in Twin Lake
The most populous age groups in Twin Lake are 30 to 34 Years (127 | 12.5%) for men and 15 to 19 Years (98 | 11.2%) for women.
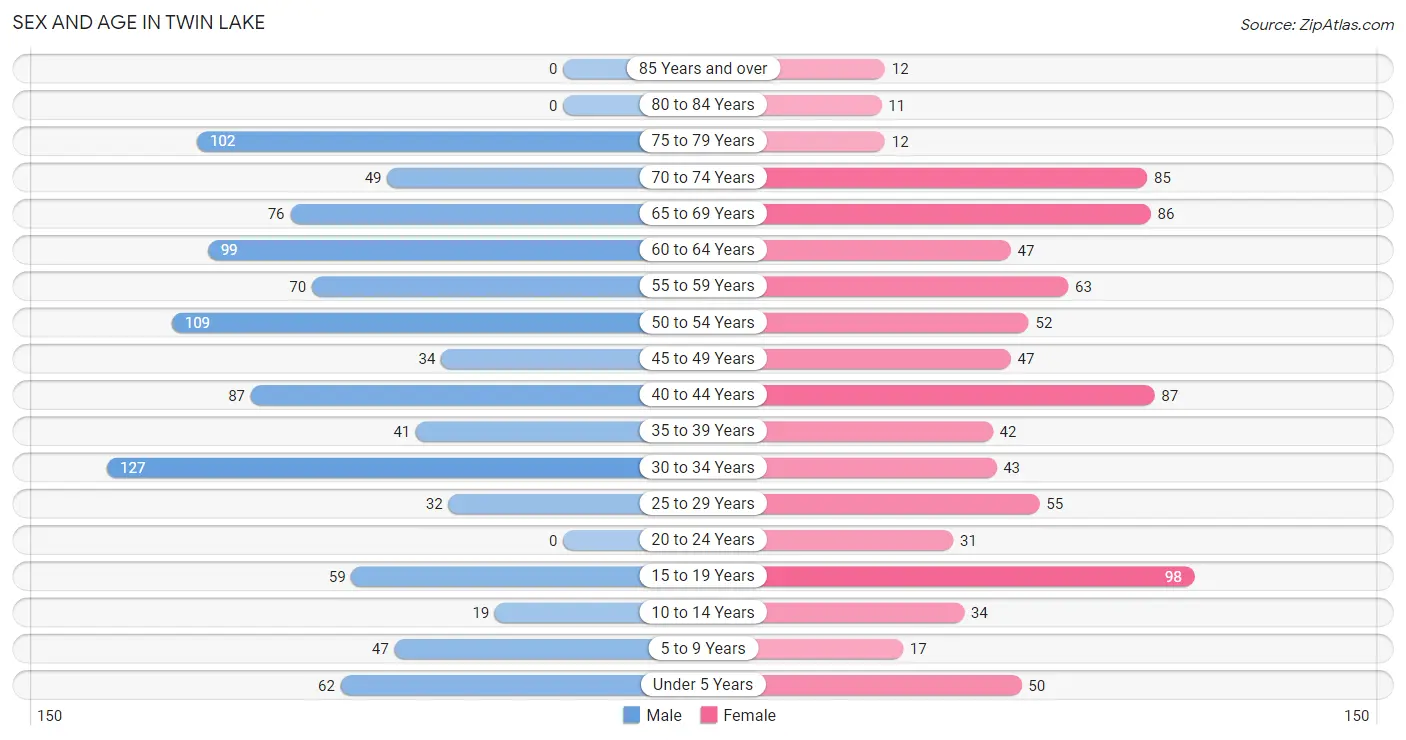
| Age Bracket | Male | Female |
| Under 5 Years | 62 (6.1%) | 50 (5.7%) |
| 5 to 9 Years | 47 (4.6%) | 17 (1.9%) |
| 10 to 14 Years | 19 (1.9%) | 34 (3.9%) |
| 15 to 19 Years | 59 (5.8%) | 98 (11.2%) |
| 20 to 24 Years | 0 (0.0%) | 31 (3.6%) |
| 25 to 29 Years | 32 (3.2%) | 55 (6.3%) |
| 30 to 34 Years | 127 (12.5%) | 43 (4.9%) |
| 35 to 39 Years | 41 (4.1%) | 42 (4.8%) |
| 40 to 44 Years | 87 (8.6%) | 87 (10.0%) |
| 45 to 49 Years | 34 (3.4%) | 47 (5.4%) |
| 50 to 54 Years | 109 (10.8%) | 52 (6.0%) |
| 55 to 59 Years | 70 (6.9%) | 63 (7.2%) |
| 60 to 64 Years | 99 (9.8%) | 47 (5.4%) |
| 65 to 69 Years | 76 (7.5%) | 86 (9.9%) |
| 70 to 74 Years | 49 (4.8%) | 85 (9.8%) |
| 75 to 79 Years | 102 (10.1%) | 12 (1.4%) |
| 80 to 84 Years | 0 (0.0%) | 11 (1.3%) |
| 85 Years and over | 0 (0.0%) | 12 (1.4%) |
| Total | 1,013 (100.0%) | 872 (100.0%) |
Families and Households in Twin Lake
Median Family Size in Twin Lake
The median family size in Twin Lake is 2.70 persons per family, with single female/mother families (24 | 4.0%) accounting for the largest median family size of 4.08 persons per family. On the other hand, single male/father families (95 | 15.7%) represent the smallest median family size with 1.99 persons per family.
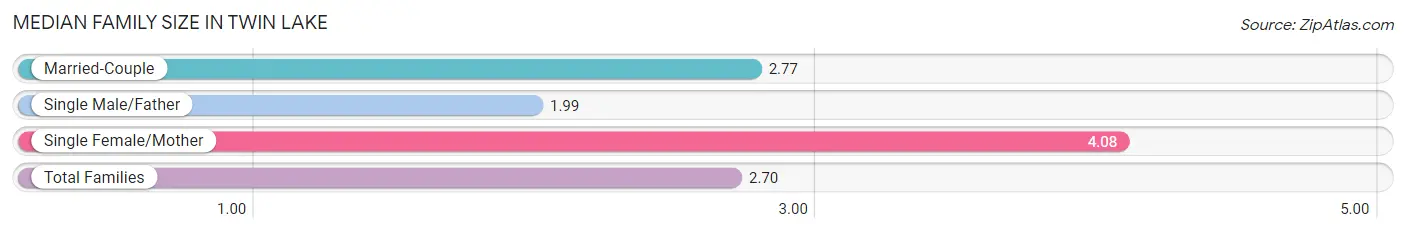
| Family Type | # Families | Family Size |
| Married-Couple | 488 (80.4%) | 2.77 |
| Single Male/Father | 95 (15.7%) | 1.99 |
| Single Female/Mother | 24 (4.0%) | 4.08 |
| Total Families | 607 (100.0%) | 2.70 |
Median Household Size in Twin Lake
The median household size in Twin Lake is 2.37 persons per household, with single female/mother households (24 | 3.0%) accounting for the largest median household size of 4.08 persons per household. non-family households (190 | 23.8%) represent the smallest median household size with 1.17 persons per household.
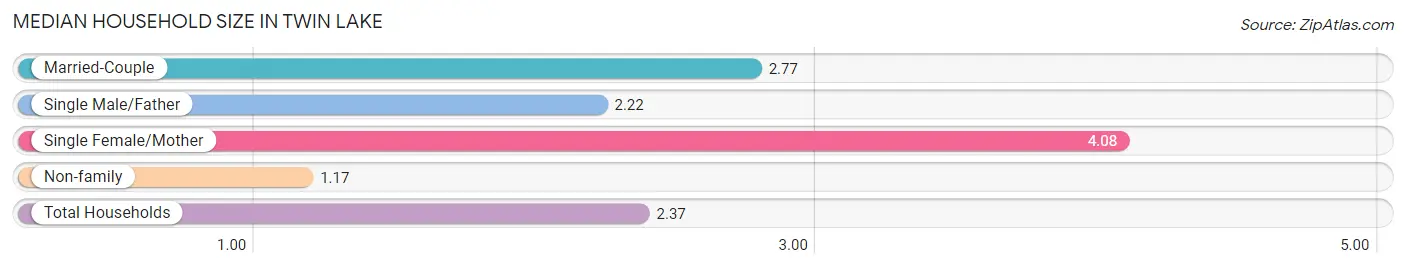
| Household Type | # Households | Household Size |
| Married-Couple | 488 (61.2%) | 2.77 |
| Single Male/Father | 95 (11.9%) | 2.22 |
| Single Female/Mother | 24 (3.0%) | 4.08 |
| Non-family | 190 (23.8%) | 1.17 |
| Total Households | 797 (100.0%) | 2.37 |
Household Size by Marriage Status in Twin Lake
Out of a total of 797 households in Twin Lake, 607 (76.2%) are family households, while 190 (23.8%) are nonfamily households. The most numerous type of family households are 2-person households, comprising 295, and the most common type of nonfamily households are 1-person households, comprising 156.
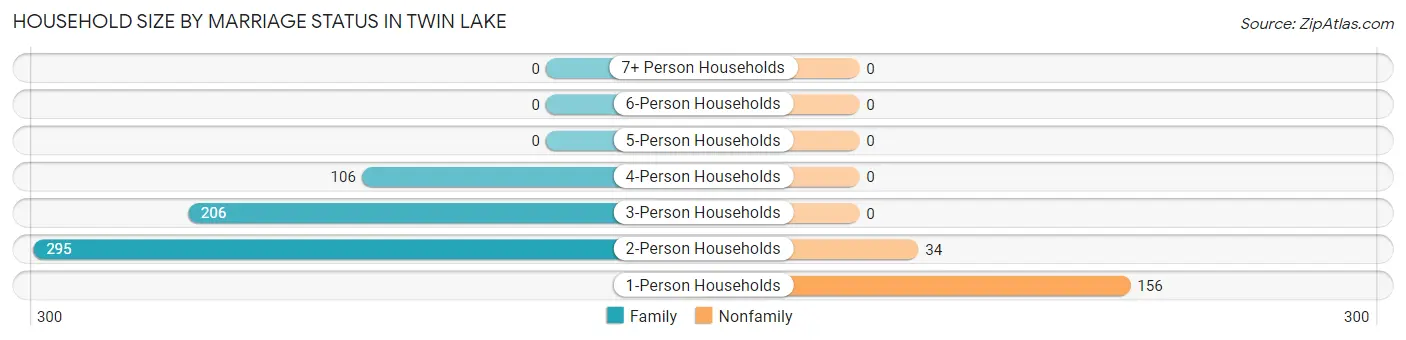
| Household Size | Family Households | Nonfamily Households |
| 1-Person Households | - | 156 (19.6%) |
| 2-Person Households | 295 (37.0%) | 34 (4.3%) |
| 3-Person Households | 206 (25.9%) | 0 (0.0%) |
| 4-Person Households | 106 (13.3%) | 0 (0.0%) |
| 5-Person Households | 0 (0.0%) | 0 (0.0%) |
| 6-Person Households | 0 (0.0%) | 0 (0.0%) |
| 7+ Person Households | 0 (0.0%) | 0 (0.0%) |
| Total | 607 (76.2%) | 190 (23.8%) |
Female Fertility in Twin Lake
Fertility by Age in Twin Lake
| Age Bracket | Women with Births | Births / 1,000 Women |
| 15 to 19 years | 0 (0.0%) | 0.0 |
| 20 to 34 years | 0 (0.0%) | 0.0 |
| 35 to 50 years | 0 (0.0%) | 0.0 |
| Total | 0 (0.0%) | 0.0 |
Fertility by Age by Marriage Status in Twin Lake
| Age Bracket | Married | Unmarried |
| 15 to 19 years | 0 (0.0%) | 0 (0.0%) |
| 20 to 34 years | 0 (0.0%) | 0 (0.0%) |
| 35 to 50 years | 0 (0.0%) | 0 (0.0%) |
| Total | 0 (0.0%) | 0 (0.0%) |
Fertility by Education in Twin Lake
| Educational Attainment | Women with Births | Births / 1,000 Women |
| Less than High School | 0 (0.0%) | 0.0 |
| High School Diploma | 0 (0.0%) | 0.0 |
| College or Associate's Degree | 0 (0.0%) | 0.0 |
| Bachelor's Degree | 0 (0.0%) | 0.0 |
| Graduate Degree | 0 (0.0%) | 0.0 |
| Total | 0 (0.0%) | 0.0 |
Fertility by Education by Marriage Status in Twin Lake
| Educational Attainment | Married | Unmarried |
| Less than High School | 0 (0.0%) | 0 (0.0%) |
| High School Diploma | 0 (0.0%) | 0 (0.0%) |
| College or Associate's Degree | 0 (0.0%) | 0 (0.0%) |
| Bachelor's Degree | 0 (0.0%) | 0 (0.0%) |
| Graduate Degree | 0 (0.0%) | 0 (0.0%) |
| Total | 0 (0.0%) | 0 (0.0%) |
Employment Characteristics in Twin Lake
Employment by Class of Employer in Twin Lake
Among the 809 employed individuals in Twin Lake, private company employees (635 | 78.5%), state government employees (37 | 4.6%), and self-employed (not incorporated) (33 | 4.1%) make up the most common classes of employment.
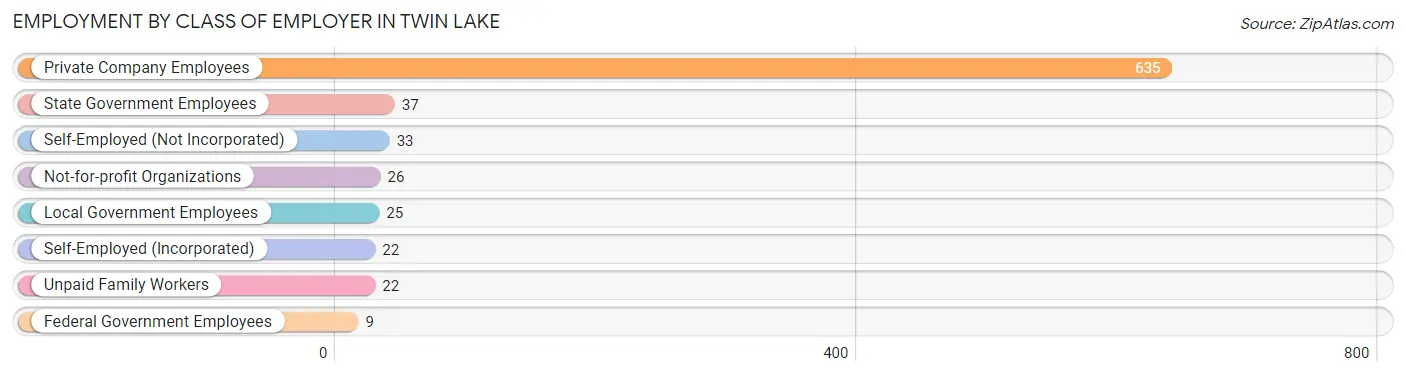
| Employer Class | # Employees | % Employees |
| Private Company Employees | 635 | 78.5% |
| Self-Employed (Incorporated) | 22 | 2.7% |
| Self-Employed (Not Incorporated) | 33 | 4.1% |
| Not-for-profit Organizations | 26 | 3.2% |
| Local Government Employees | 25 | 3.1% |
| State Government Employees | 37 | 4.6% |
| Federal Government Employees | 9 | 1.1% |
| Unpaid Family Workers | 22 | 2.7% |
| Total | 809 | 100.0% |
Employment Status by Age in Twin Lake
According to the labor force statistics for Twin Lake, out of the total population over 16 years of age (1,609), 63.7% or 1,025 individuals are in the labor force, with 21.1% or 216 of them unemployed. The age group with the highest labor force participation rate is 16 to 19 years, with 100.0% or 110 individuals in the labor force. Within the labor force, the 65 to 74 years age range has the highest percentage of unemployed individuals, with 100.0% or 13 of them being unemployed.
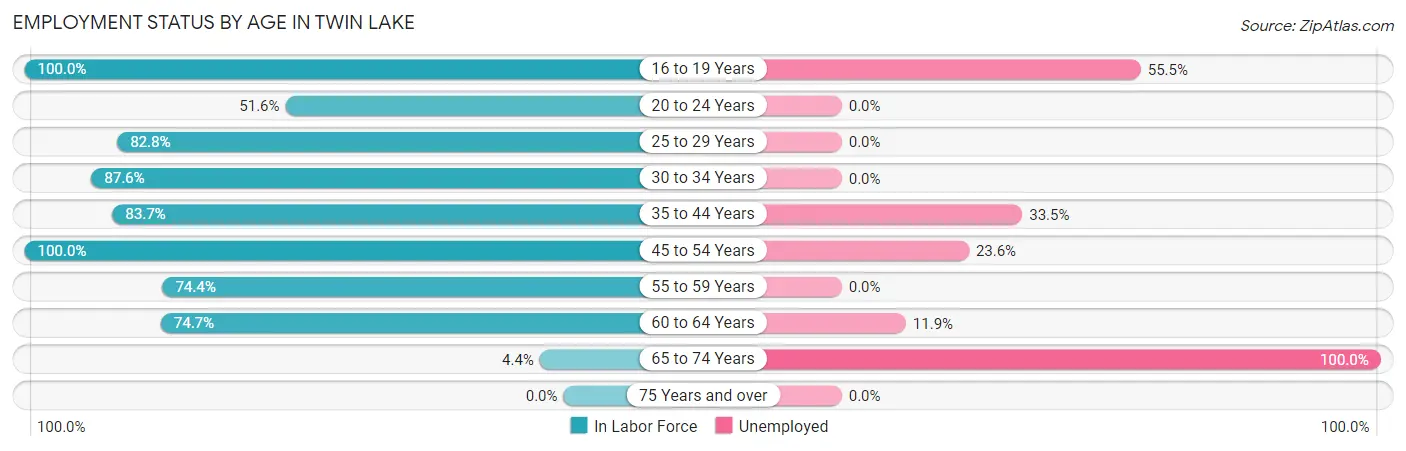
| Age Bracket | In Labor Force | Unemployed |
| 16 to 19 Years | 110 (100.0%) | 61 (55.5%) |
| 20 to 24 Years | 16 (51.6%) | 0 (0.0%) |
| 25 to 29 Years | 72 (82.8%) | 0 (0.0%) |
| 30 to 34 Years | 149 (87.6%) | 0 (0.0%) |
| 35 to 44 Years | 215 (83.7%) | 72 (33.5%) |
| 45 to 54 Years | 242 (100.0%) | 57 (23.6%) |
| 55 to 59 Years | 99 (74.4%) | 0 (0.0%) |
| 60 to 64 Years | 109 (74.7%) | 13 (11.9%) |
| 65 to 74 Years | 13 (4.4%) | 13 (100.0%) |
| 75 Years and over | 0 (0.0%) | 0 (0.0%) |
| Total | 1,025 (63.7%) | 216 (21.1%) |
Employment Status by Educational Attainment in Twin Lake
According to labor force statistics for Twin Lake, 85.6% of individuals (886) out of the total population between 25 and 64 years of age (1,035) are in the labor force, with 16.0% or 142 of them being unemployed. The group with the highest labor force participation rate are those with the educational attainment of bachelor's degree or higher, with 100.0% or 258 individuals in the labor force. Within the labor force, individuals with high school diploma education have the highest percentage of unemployment, with 34.4% or 72 of them being unemployed.
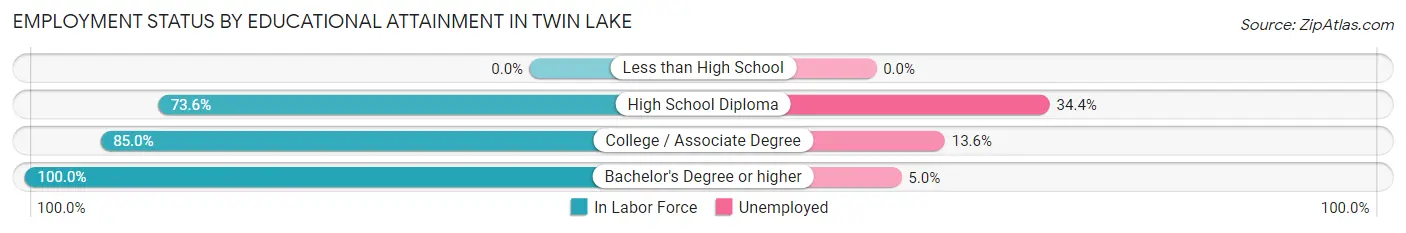
| Educational Attainment | In Labor Force | Unemployed |
| Less than High School | 0 (0.0%) | 0 (0.0%) |
| High School Diploma | 209 (73.6%) | 98 (34.4%) |
| College / Associate Degree | 419 (85.0%) | 67 (13.6%) |
| Bachelor's Degree or higher | 258 (100.0%) | 13 (5.0%) |
| Total | 886 (85.6%) | 166 (16.0%) |
Employment Occupations by Sex in Twin Lake
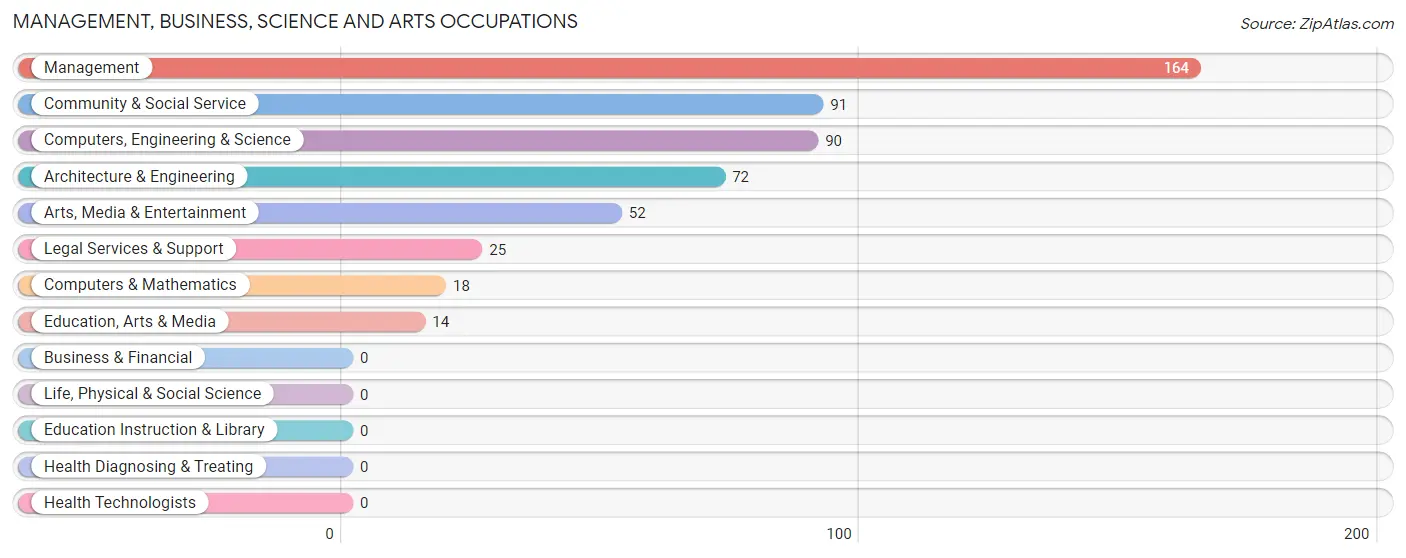
Management, Business, Science and Arts Occupations
The most common Management, Business, Science and Arts occupations in Twin Lake are Management (164 | 20.3%), Community & Social Service (91 | 11.3%), Computers, Engineering & Science (90 | 11.1%), Architecture & Engineering (72 | 8.9%), and Arts, Media & Entertainment (52 | 6.4%).
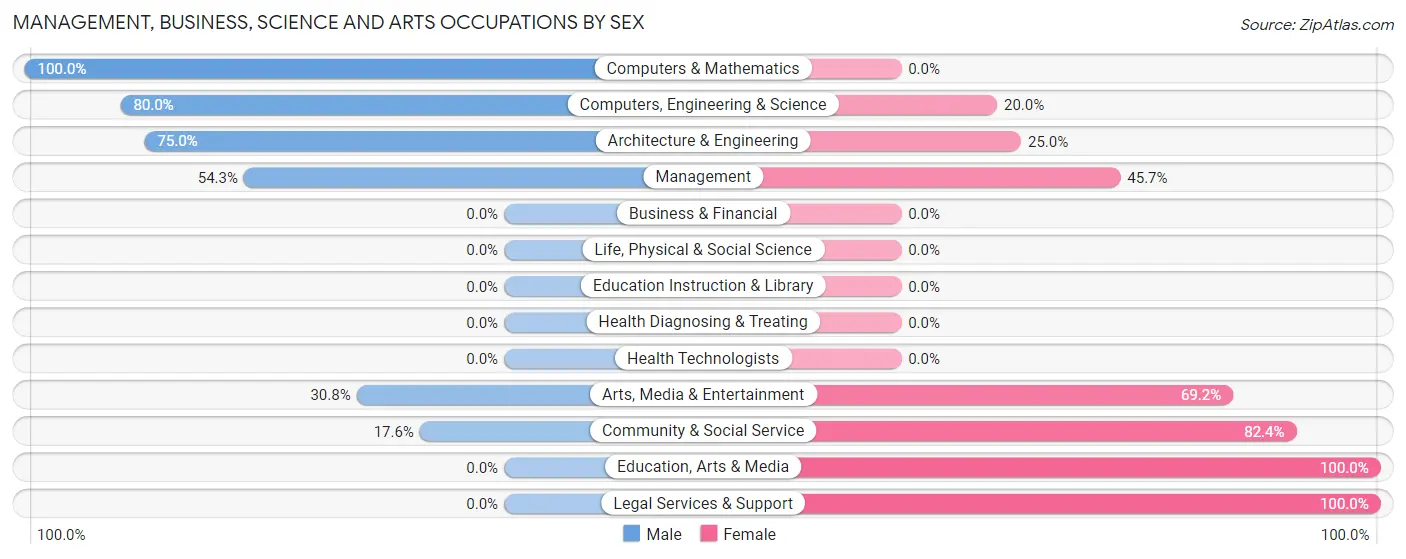
Management, Business, Science and Arts Occupations by Sex
Within the Management, Business, Science and Arts occupations in Twin Lake, the most male-oriented occupations are Computers & Mathematics (100.0%), Computers, Engineering & Science (80.0%), and Architecture & Engineering (75.0%), while the most female-oriented occupations are Education, Arts & Media (100.0%), Legal Services & Support (100.0%), and Community & Social Service (82.4%).
| Occupation | Male | Female |
| Management | 89 (54.3%) | 75 (45.7%) |
| Business & Financial | 0 (0.0%) | 0 (0.0%) |
| Computers, Engineering & Science | 72 (80.0%) | 18 (20.0%) |
| Computers & Mathematics | 18 (100.0%) | 0 (0.0%) |
| Architecture & Engineering | 54 (75.0%) | 18 (25.0%) |
| Life, Physical & Social Science | 0 (0.0%) | 0 (0.0%) |
| Community & Social Service | 16 (17.6%) | 75 (82.4%) |
| Education, Arts & Media | 0 (0.0%) | 14 (100.0%) |
| Legal Services & Support | 0 (0.0%) | 25 (100.0%) |
| Education Instruction & Library | 0 (0.0%) | 0 (0.0%) |
| Arts, Media & Entertainment | 16 (30.8%) | 36 (69.2%) |
| Health Diagnosing & Treating | 0 (0.0%) | 0 (0.0%) |
| Health Technologists | 0 (0.0%) | 0 (0.0%) |
| Total (Category) | 177 (51.3%) | 168 (48.7%) |
| Total (Overall) | 407 (50.3%) | 402 (49.7%) |
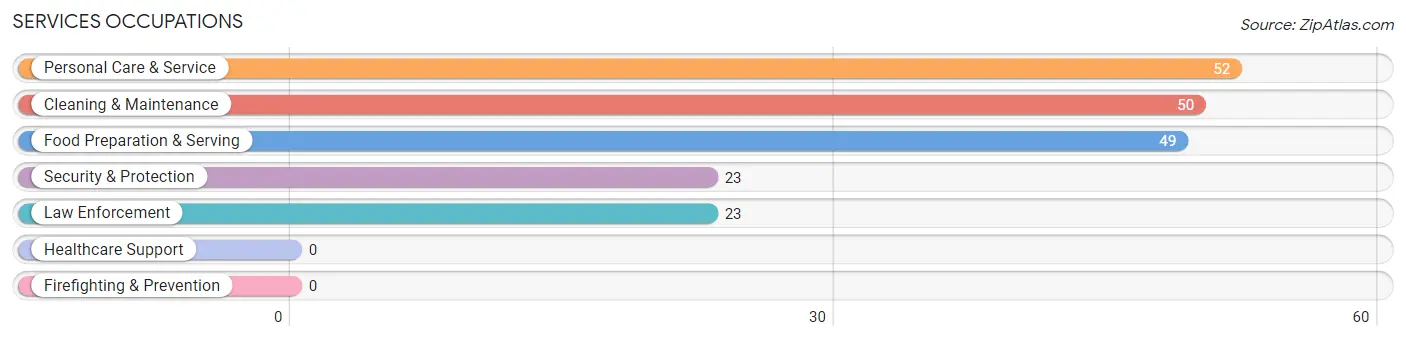
Services Occupations
The most common Services occupations in Twin Lake are Personal Care & Service (52 | 6.4%), Cleaning & Maintenance (50 | 6.2%), Food Preparation & Serving (49 | 6.1%), Security & Protection (23 | 2.8%), and Law Enforcement (23 | 2.8%).
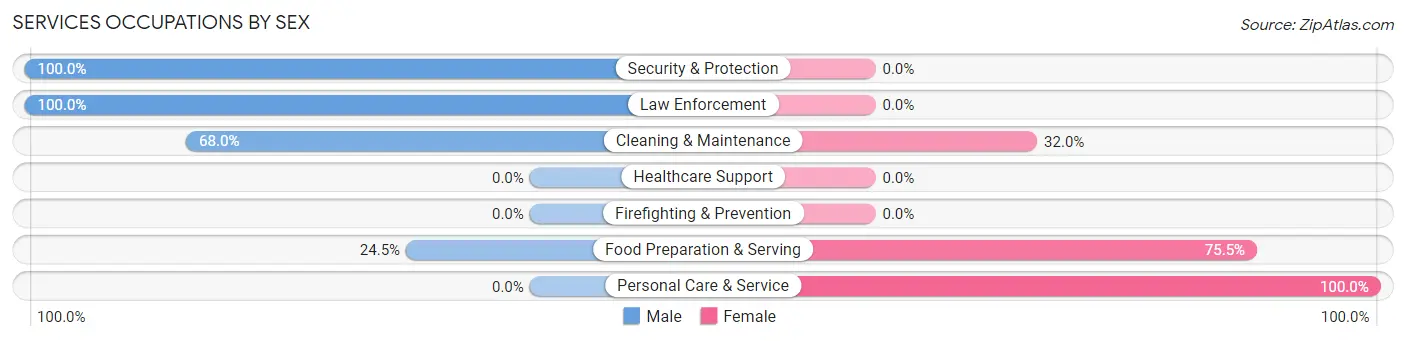
Services Occupations by Sex
Within the Services occupations in Twin Lake, the most male-oriented occupations are Security & Protection (100.0%), Law Enforcement (100.0%), and Cleaning & Maintenance (68.0%), while the most female-oriented occupations are Personal Care & Service (100.0%), Food Preparation & Serving (75.5%), and Cleaning & Maintenance (32.0%).
| Occupation | Male | Female |
| Healthcare Support | 0 (0.0%) | 0 (0.0%) |
| Security & Protection | 23 (100.0%) | 0 (0.0%) |
| Firefighting & Prevention | 0 (0.0%) | 0 (0.0%) |
| Law Enforcement | 23 (100.0%) | 0 (0.0%) |
| Food Preparation & Serving | 12 (24.5%) | 37 (75.5%) |
| Cleaning & Maintenance | 34 (68.0%) | 16 (32.0%) |
| Personal Care & Service | 0 (0.0%) | 52 (100.0%) |
| Total (Category) | 69 (39.7%) | 105 (60.3%) |
| Total (Overall) | 407 (50.3%) | 402 (49.7%) |
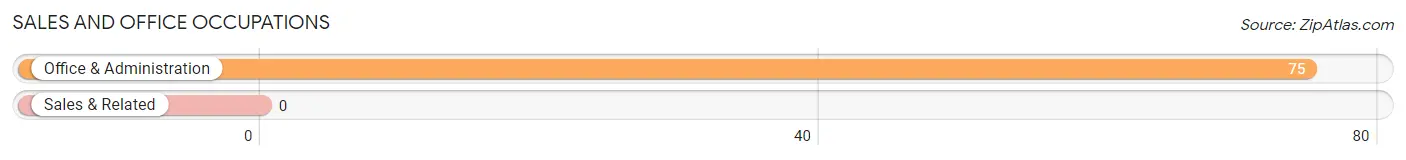
Sales and Office Occupations
The most common Sales and Office occupations in Twin Lake are , and Office & Administration (75 | 9.3%).
Sales and Office Occupations by Sex
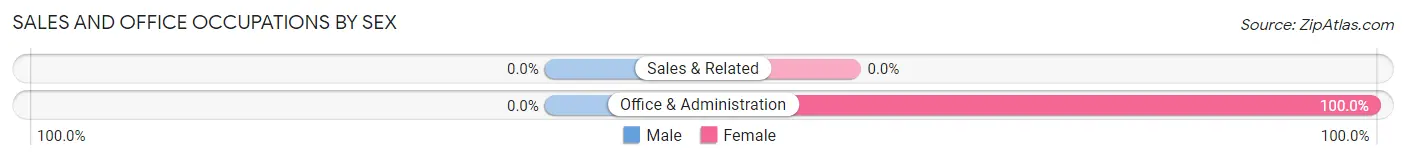
| Occupation | Male | Female |
| Sales & Related | 0 (0.0%) | 0 (0.0%) |
| Office & Administration | 0 (0.0%) | 75 (100.0%) |
| Total (Category) | 0 (0.0%) | 75 (100.0%) |
| Total (Overall) | 407 (50.3%) | 402 (49.7%) |
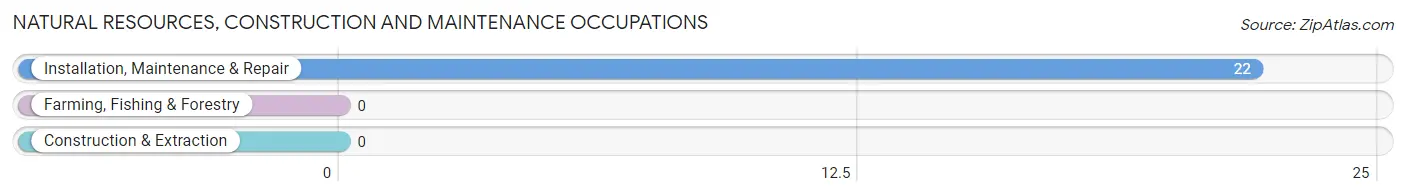
Natural Resources, Construction and Maintenance Occupations
The most common Natural Resources, Construction and Maintenance occupations in Twin Lake are , and Installation, Maintenance & Repair (22 | 2.7%).
Natural Resources, Construction and Maintenance Occupations by Sex
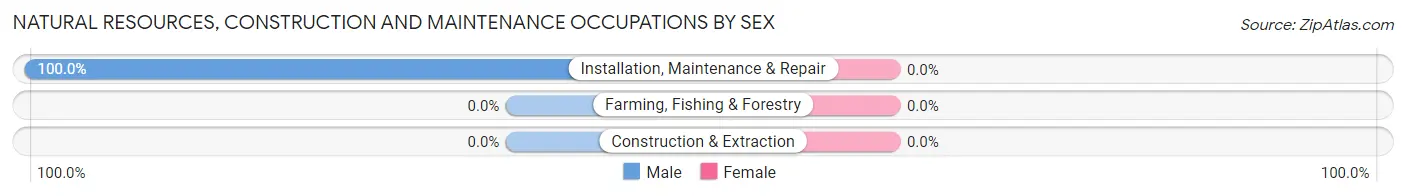
| Occupation | Male | Female |
| Farming, Fishing & Forestry | 0 (0.0%) | 0 (0.0%) |
| Construction & Extraction | 0 (0.0%) | 0 (0.0%) |
| Installation, Maintenance & Repair | 22 (100.0%) | 0 (0.0%) |
| Total (Category) | 22 (100.0%) | 0 (0.0%) |
| Total (Overall) | 407 (50.3%) | 402 (49.7%) |
Production, Transportation and Moving Occupations
The most common Production, Transportation and Moving occupations in Twin Lake are Production (176 | 21.8%), and Material Moving (17 | 2.1%).
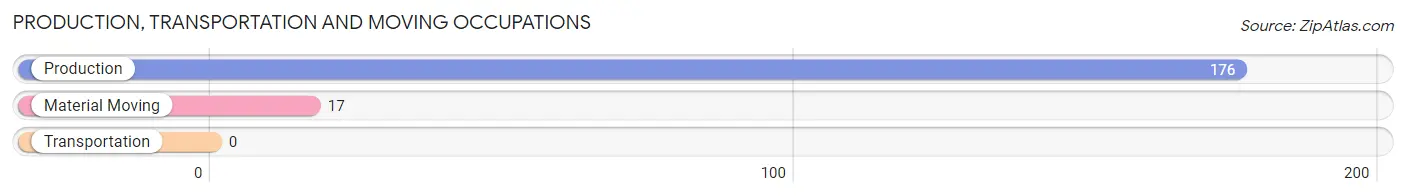
Production, Transportation and Moving Occupations by Sex
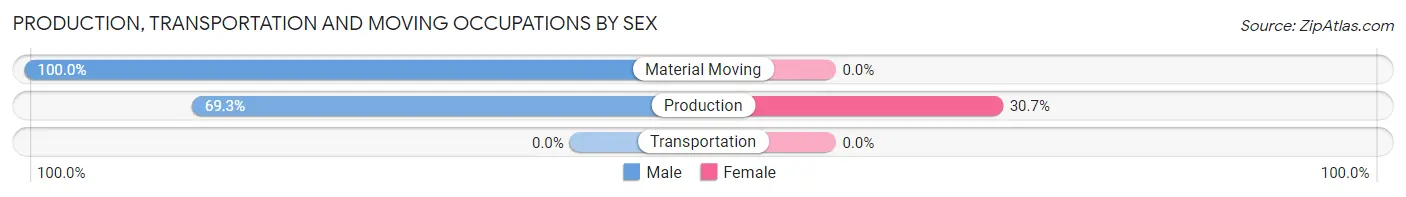
| Occupation | Male | Female |
| Production | 122 (69.3%) | 54 (30.7%) |
| Transportation | 0 (0.0%) | 0 (0.0%) |
| Material Moving | 17 (100.0%) | 0 (0.0%) |
| Total (Category) | 139 (72.0%) | 54 (28.0%) |
| Total (Overall) | 407 (50.3%) | 402 (49.7%) |
Employment Industries by Sex in Twin Lake
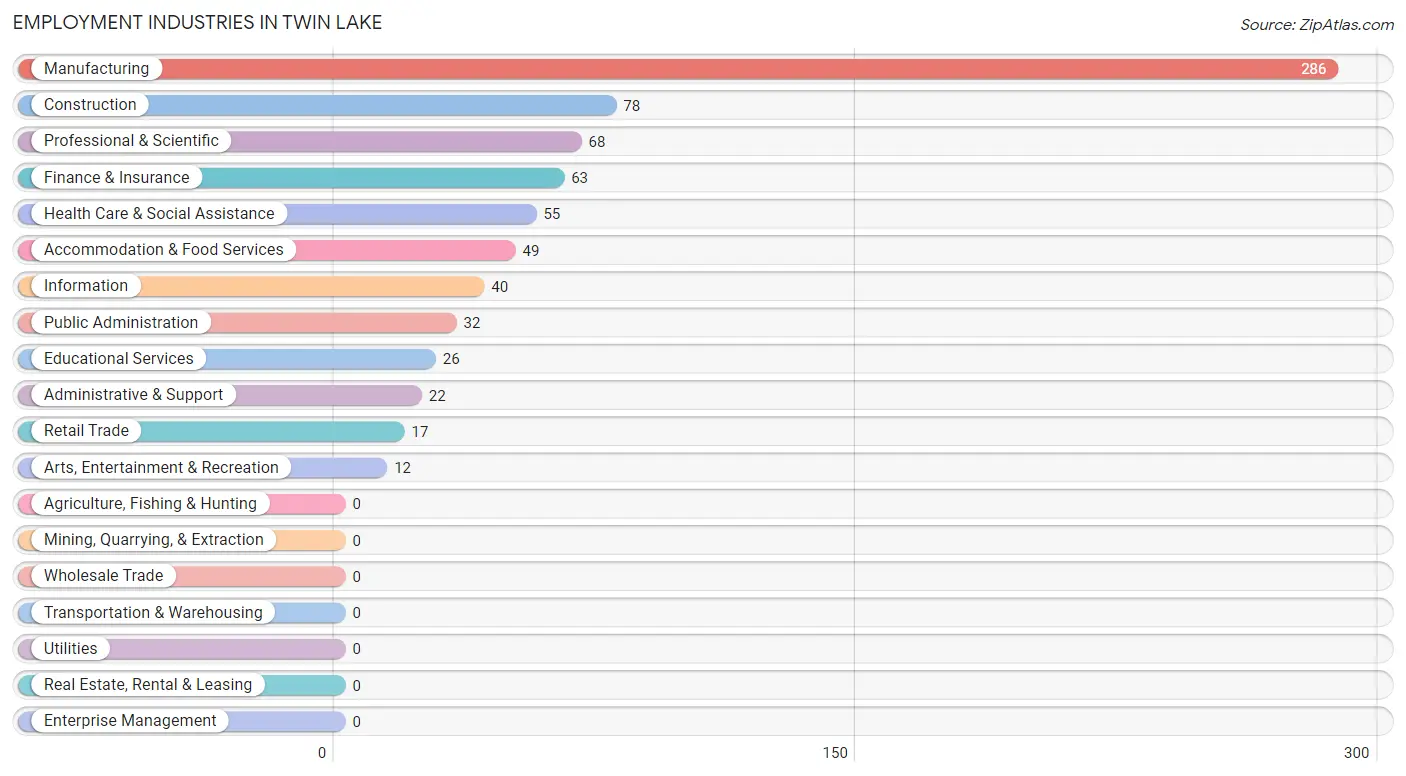
Employment Industries in Twin Lake
The major employment industries in Twin Lake include Manufacturing (286 | 35.3%), Construction (78 | 9.6%), Professional & Scientific (68 | 8.4%), Finance & Insurance (63 | 7.8%), and Health Care & Social Assistance (55 | 6.8%).
Employment Industries by Sex in Twin Lake
The Twin Lake industries that see more men than women are Construction (100.0%), Retail Trade (100.0%), and Information (100.0%), whereas the industries that tend to have a higher number of women are Finance & Insurance (100.0%), Educational Services (100.0%), and Health Care & Social Assistance (100.0%).
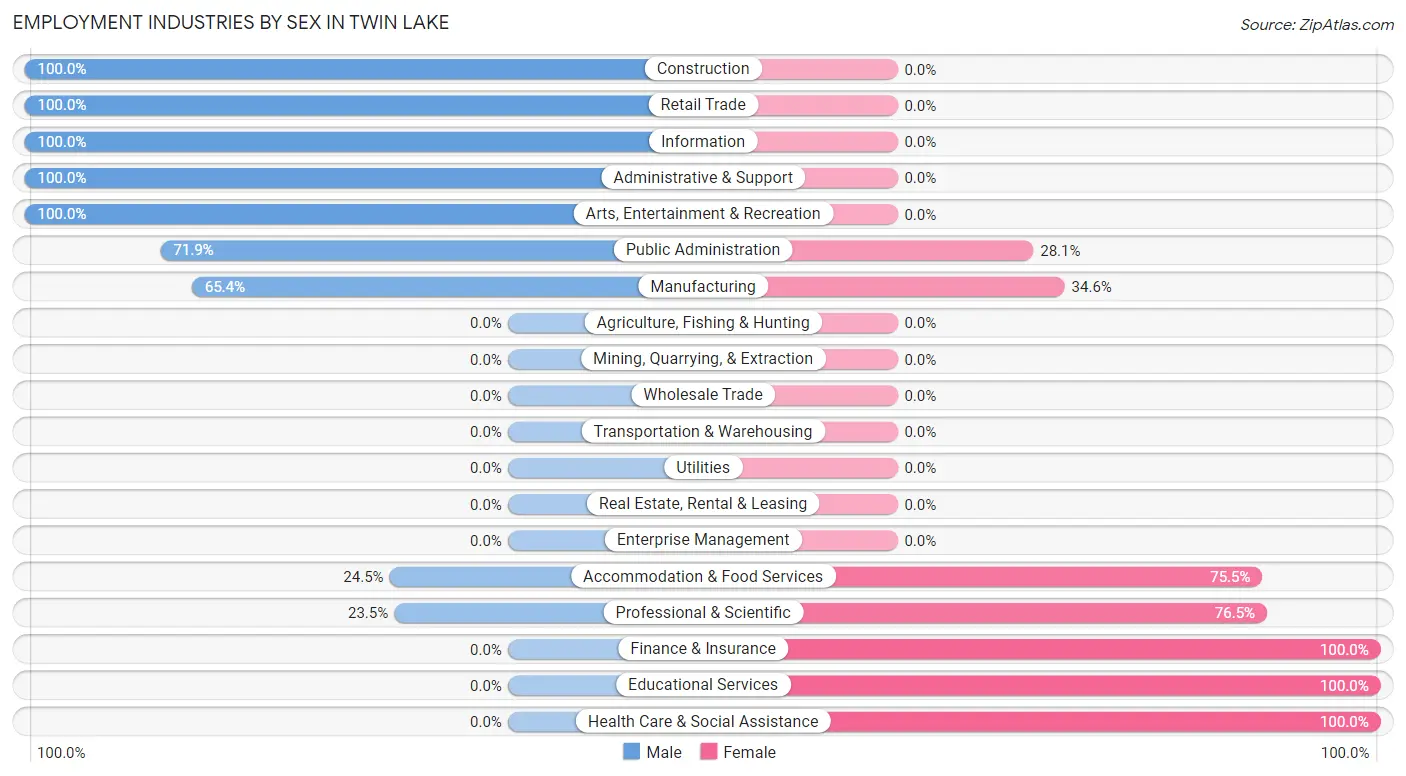
| Industry | Male | Female |
| Agriculture, Fishing & Hunting | 0 (0.0%) | 0 (0.0%) |
| Mining, Quarrying, & Extraction | 0 (0.0%) | 0 (0.0%) |
| Construction | 78 (100.0%) | 0 (0.0%) |
| Manufacturing | 187 (65.4%) | 99 (34.6%) |
| Wholesale Trade | 0 (0.0%) | 0 (0.0%) |
| Retail Trade | 17 (100.0%) | 0 (0.0%) |
| Transportation & Warehousing | 0 (0.0%) | 0 (0.0%) |
| Utilities | 0 (0.0%) | 0 (0.0%) |
| Information | 40 (100.0%) | 0 (0.0%) |
| Finance & Insurance | 0 (0.0%) | 63 (100.0%) |
| Real Estate, Rental & Leasing | 0 (0.0%) | 0 (0.0%) |
| Professional & Scientific | 16 (23.5%) | 52 (76.5%) |
| Enterprise Management | 0 (0.0%) | 0 (0.0%) |
| Administrative & Support | 22 (100.0%) | 0 (0.0%) |
| Educational Services | 0 (0.0%) | 26 (100.0%) |
| Health Care & Social Assistance | 0 (0.0%) | 55 (100.0%) |
| Arts, Entertainment & Recreation | 12 (100.0%) | 0 (0.0%) |
| Accommodation & Food Services | 12 (24.5%) | 37 (75.5%) |
| Public Administration | 23 (71.9%) | 9 (28.1%) |
| Total | 407 (50.3%) | 402 (49.7%) |
Education in Twin Lake
School Enrollment in Twin Lake
The most common levels of schooling among the 355 students in Twin Lake are college / undergraduate (155 | 43.7%), middle school (72 | 20.3%), and high school (64 | 18.0%).
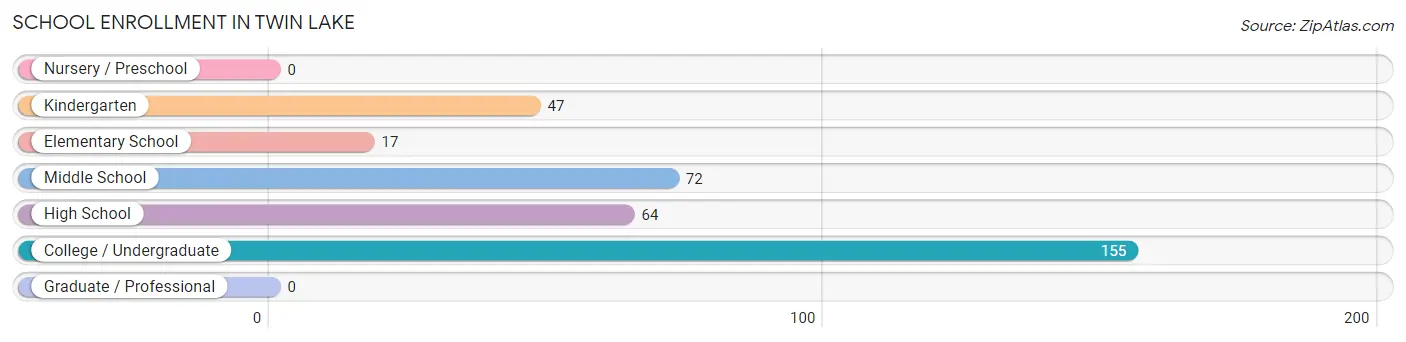
| School Level | # Students | % Students |
| Nursery / Preschool | 0 | 0.0% |
| Kindergarten | 47 | 13.2% |
| Elementary School | 17 | 4.8% |
| Middle School | 72 | 20.3% |
| High School | 64 | 18.0% |
| College / Undergraduate | 155 | 43.7% |
| Graduate / Professional | 0 | 0.0% |
| Total | 355 | 100.0% |
School Enrollment by Age by Funding Source in Twin Lake
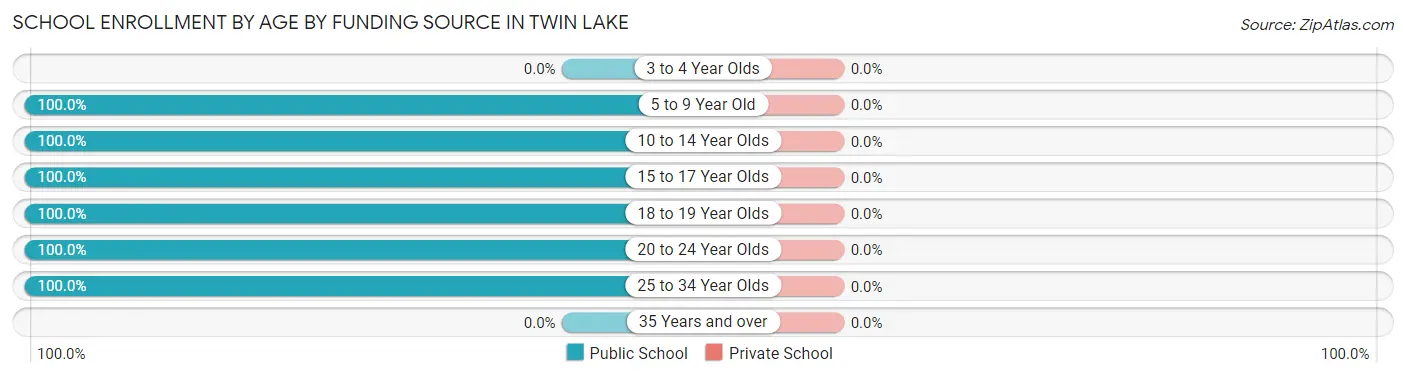
| Age Bracket | Public School | Private School |
| 3 to 4 Year Olds | 0 (0.0%) | 0 (0.0%) |
| 5 to 9 Year Old | 64 (100.0%) | 0 (0.0%) |
| 10 to 14 Year Olds | 53 (100.0%) | 0 (0.0%) |
| 15 to 17 Year Olds | 83 (100.0%) | 0 (0.0%) |
| 18 to 19 Year Olds | 61 (100.0%) | 0 (0.0%) |
| 20 to 24 Year Olds | 31 (100.0%) | 0 (0.0%) |
| 25 to 34 Year Olds | 63 (100.0%) | 0 (0.0%) |
| 35 Years and over | 0 (0.0%) | 0 (0.0%) |
| Total | 355 (100.0%) | 0 (0.0%) |
Educational Attainment by Field of Study in Twin Lake
Business (94 | 17.6%), arts & humanities (77 | 14.4%), engineering (64 | 12.0%), education (54 | 10.1%), and science & technology (46 | 8.6%) are the most common fields of study among 535 individuals in Twin Lake who have obtained a bachelor's degree or higher.
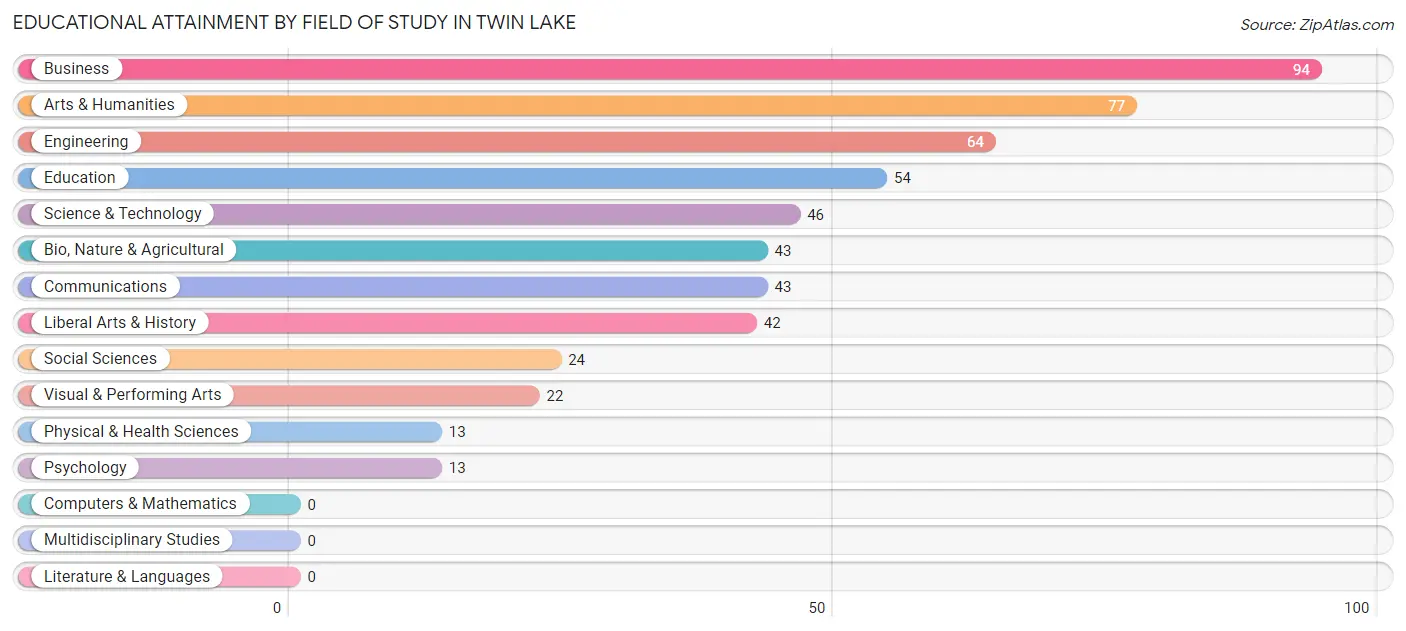
| Field of Study | # Graduates | % Graduates |
| Computers & Mathematics | 0 | 0.0% |
| Bio, Nature & Agricultural | 43 | 8.0% |
| Physical & Health Sciences | 13 | 2.4% |
| Psychology | 13 | 2.4% |
| Social Sciences | 24 | 4.5% |
| Engineering | 64 | 12.0% |
| Multidisciplinary Studies | 0 | 0.0% |
| Science & Technology | 46 | 8.6% |
| Business | 94 | 17.6% |
| Education | 54 | 10.1% |
| Literature & Languages | 0 | 0.0% |
| Liberal Arts & History | 42 | 7.9% |
| Visual & Performing Arts | 22 | 4.1% |
| Communications | 43 | 8.0% |
| Arts & Humanities | 77 | 14.4% |
| Total | 535 | 100.0% |
Transportation & Commute in Twin Lake
Vehicle Availability by Sex in Twin Lake
The most prevalent vehicle ownership categories in Twin Lake are males with 3 vehicles (218, accounting for 53.6%) and females with 3 vehicles (183, making up 54.2%).
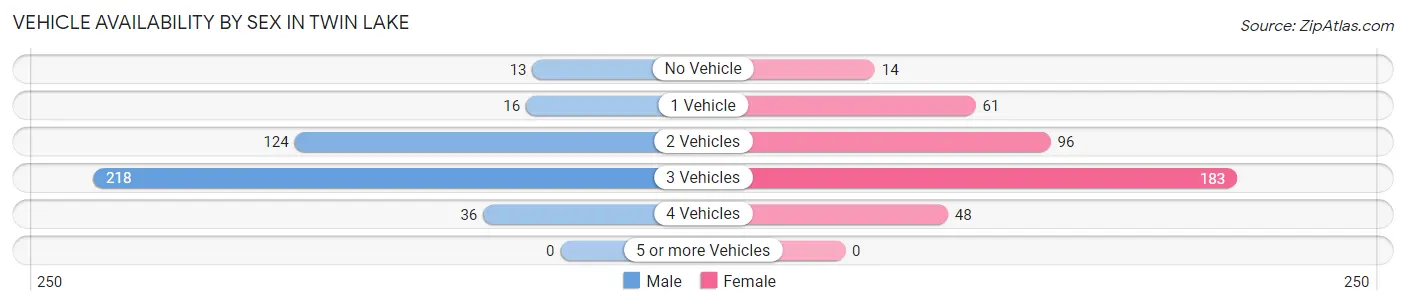
| Vehicles Available | Male | Female |
| No Vehicle | 13 (3.2%) | 14 (3.5%) |
| 1 Vehicle | 16 (3.9%) | 61 (15.2%) |
| 2 Vehicles | 124 (30.5%) | 96 (23.9%) |
| 3 Vehicles | 218 (53.6%) | 183 (45.5%) |
| 4 Vehicles | 36 (8.8%) | 48 (11.9%) |
| 5 or more Vehicles | 0 (0.0%) | 0 (0.0%) |
| Total | 407 (100.0%) | 402 (100.0%) |
Commute Time in Twin Lake
The most frequently occuring commute durations in Twin Lake are 20 to 24 minutes (287 commuters, 39.9%), 15 to 19 minutes (110 commuters, 15.3%), and 30 to 34 minutes (103 commuters, 14.3%).
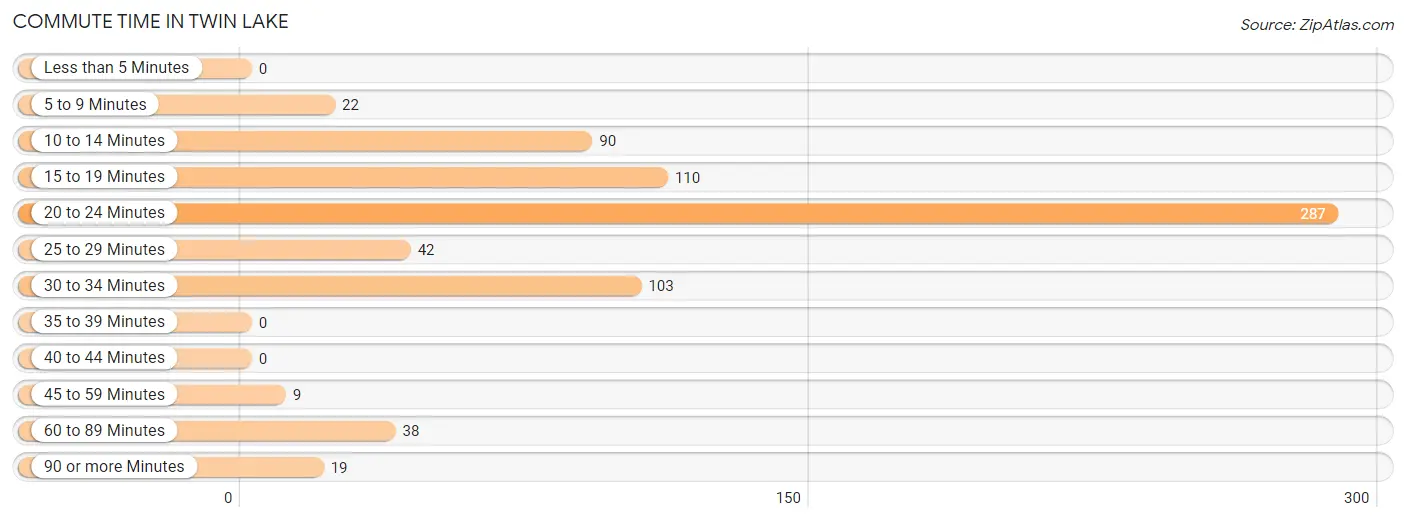
| Commute Time | # Commuters | % Commuters |
| Less than 5 Minutes | 0 | 0.0% |
| 5 to 9 Minutes | 22 | 3.1% |
| 10 to 14 Minutes | 90 | 12.5% |
| 15 to 19 Minutes | 110 | 15.3% |
| 20 to 24 Minutes | 287 | 39.9% |
| 25 to 29 Minutes | 42 | 5.8% |
| 30 to 34 Minutes | 103 | 14.3% |
| 35 to 39 Minutes | 0 | 0.0% |
| 40 to 44 Minutes | 0 | 0.0% |
| 45 to 59 Minutes | 9 | 1.3% |
| 60 to 89 Minutes | 38 | 5.3% |
| 90 or more Minutes | 19 | 2.6% |
Commute Time by Sex in Twin Lake
The most common commute times in Twin Lake are 20 to 24 minutes (124 commuters, 34.8%) for males and 20 to 24 minutes (163 commuters, 44.8%) for females.
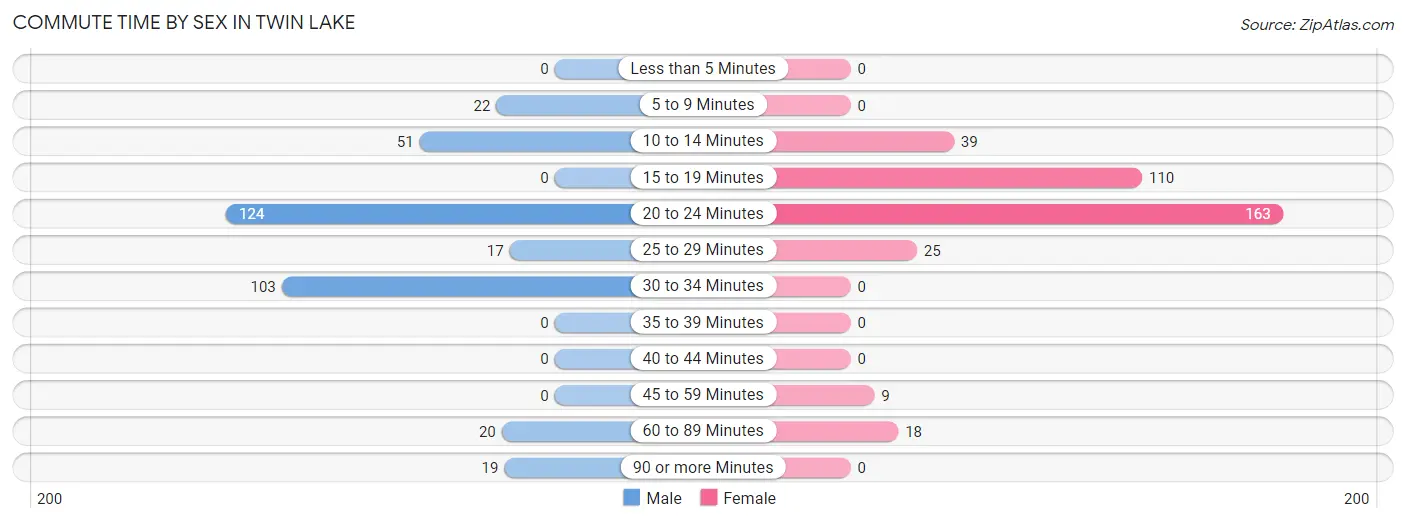
| Commute Time | Male | Female |
| Less than 5 Minutes | 0 (0.0%) | 0 (0.0%) |
| 5 to 9 Minutes | 22 (6.2%) | 0 (0.0%) |
| 10 to 14 Minutes | 51 (14.3%) | 39 (10.7%) |
| 15 to 19 Minutes | 0 (0.0%) | 110 (30.2%) |
| 20 to 24 Minutes | 124 (34.8%) | 163 (44.8%) |
| 25 to 29 Minutes | 17 (4.8%) | 25 (6.9%) |
| 30 to 34 Minutes | 103 (28.9%) | 0 (0.0%) |
| 35 to 39 Minutes | 0 (0.0%) | 0 (0.0%) |
| 40 to 44 Minutes | 0 (0.0%) | 0 (0.0%) |
| 45 to 59 Minutes | 0 (0.0%) | 9 (2.5%) |
| 60 to 89 Minutes | 20 (5.6%) | 18 (5.0%) |
| 90 or more Minutes | 19 (5.3%) | 0 (0.0%) |
Time of Departure to Work by Sex in Twin Lake
The most frequent times of departure to work in Twin Lake are 5:30 AM to 5:59 AM (76, 21.3%) for males and 7:30 AM to 7:59 AM (154, 42.3%) for females.
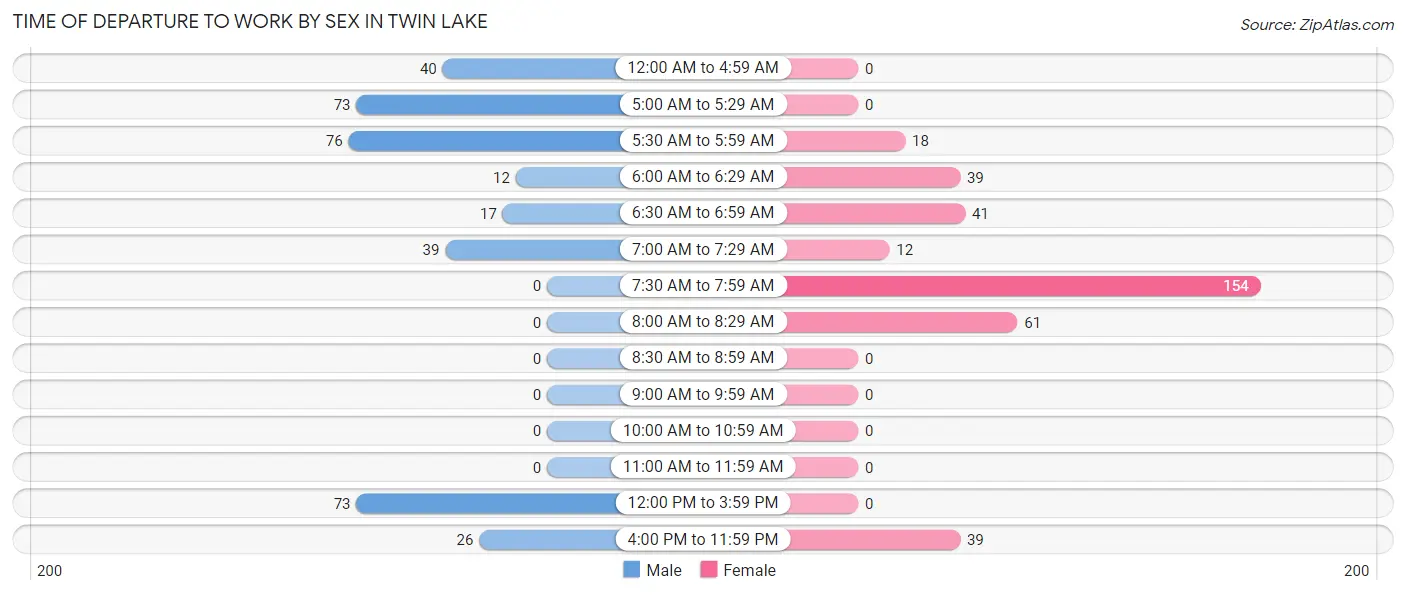
| Time of Departure | Male | Female |
| 12:00 AM to 4:59 AM | 40 (11.2%) | 0 (0.0%) |
| 5:00 AM to 5:29 AM | 73 (20.5%) | 0 (0.0%) |
| 5:30 AM to 5:59 AM | 76 (21.3%) | 18 (5.0%) |
| 6:00 AM to 6:29 AM | 12 (3.4%) | 39 (10.7%) |
| 6:30 AM to 6:59 AM | 17 (4.8%) | 41 (11.3%) |
| 7:00 AM to 7:29 AM | 39 (11.0%) | 12 (3.3%) |
| 7:30 AM to 7:59 AM | 0 (0.0%) | 154 (42.3%) |
| 8:00 AM to 8:29 AM | 0 (0.0%) | 61 (16.8%) |
| 8:30 AM to 8:59 AM | 0 (0.0%) | 0 (0.0%) |
| 9:00 AM to 9:59 AM | 0 (0.0%) | 0 (0.0%) |
| 10:00 AM to 10:59 AM | 0 (0.0%) | 0 (0.0%) |
| 11:00 AM to 11:59 AM | 0 (0.0%) | 0 (0.0%) |
| 12:00 PM to 3:59 PM | 73 (20.5%) | 0 (0.0%) |
| 4:00 PM to 11:59 PM | 26 (7.3%) | 39 (10.7%) |
| Total | 356 (100.0%) | 364 (100.0%) |
Housing Occupancy in Twin Lake
Occupancy by Ownership in Twin Lake
Of the total 797 dwellings in Twin Lake, owner-occupied units account for 763 (95.7%), while renter-occupied units make up 34 (4.3%).
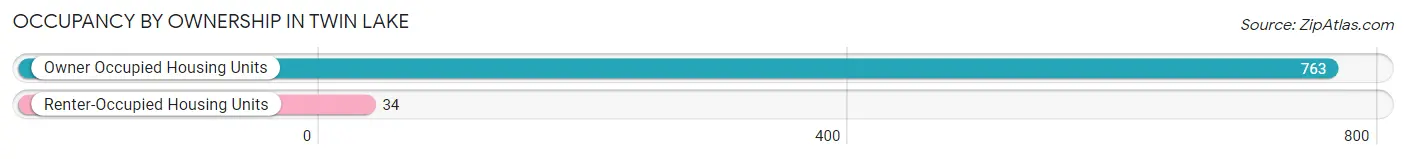
| Occupancy | # Housing Units | % Housing Units |
| Owner Occupied Housing Units | 763 | 95.7% |
| Renter-Occupied Housing Units | 34 | 4.3% |
| Total Occupied Housing Units | 797 | 100.0% |
Occupancy by Household Size in Twin Lake
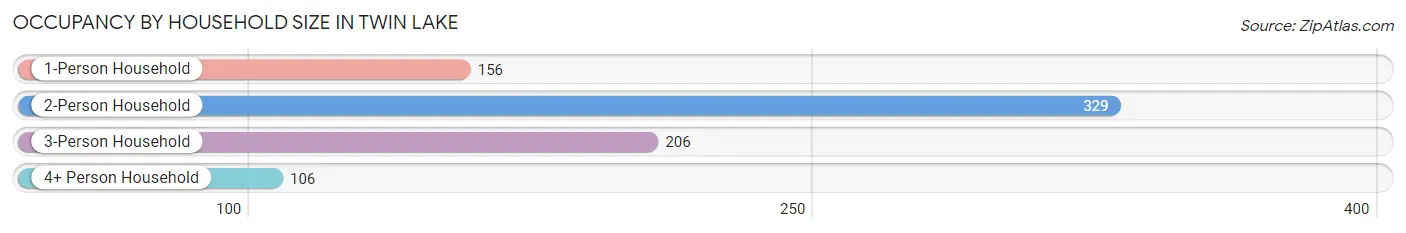
| Household Size | # Housing Units | % Housing Units |
| 1-Person Household | 156 | 19.6% |
| 2-Person Household | 329 | 41.3% |
| 3-Person Household | 206 | 25.9% |
| 4+ Person Household | 106 | 13.3% |
| Total Housing Units | 797 | 100.0% |
Occupancy by Ownership by Household Size in Twin Lake
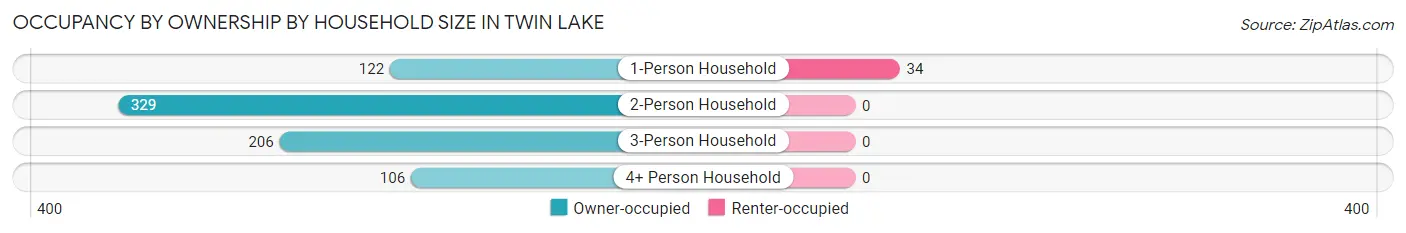
| Household Size | Owner-occupied | Renter-occupied |
| 1-Person Household | 122 (78.2%) | 34 (21.8%) |
| 2-Person Household | 329 (100.0%) | 0 (0.0%) |
| 3-Person Household | 206 (100.0%) | 0 (0.0%) |
| 4+ Person Household | 106 (100.0%) | 0 (0.0%) |
| Total Housing Units | 763 (95.7%) | 34 (4.3%) |
Occupancy by Educational Attainment in Twin Lake
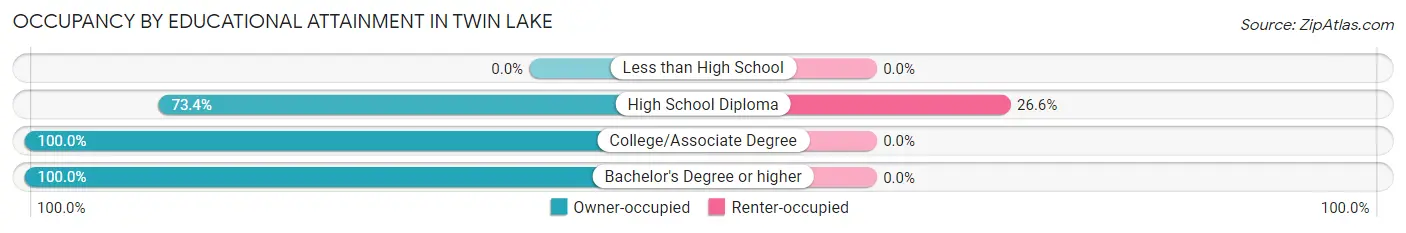
| Household Size | Owner-occupied | Renter-occupied |
| Less than High School | 0 (0.0%) | 0 (0.0%) |
| High School Diploma | 94 (73.4%) | 34 (26.6%) |
| College/Associate Degree | 408 (100.0%) | 0 (0.0%) |
| Bachelor's Degree or higher | 261 (100.0%) | 0 (0.0%) |
Occupancy by Age of Householder in Twin Lake
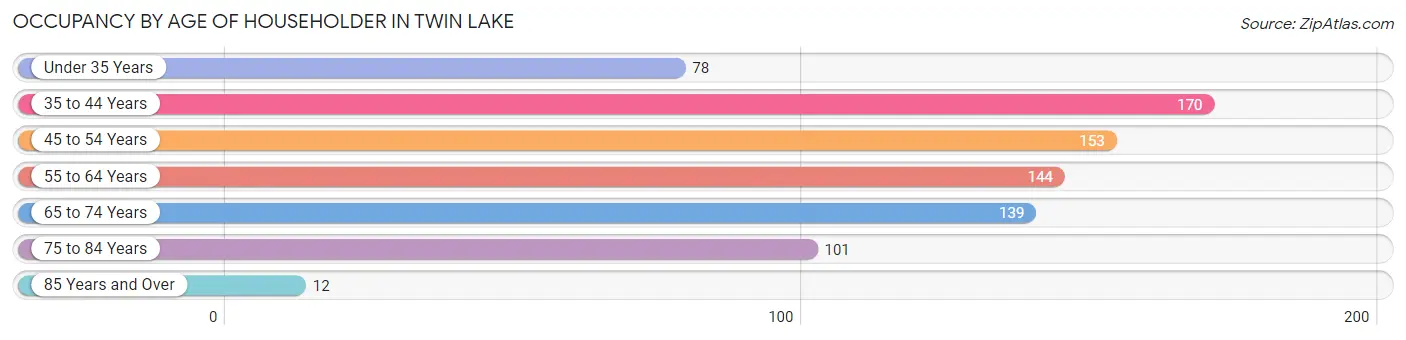
| Age Bracket | # Households | % Households |
| Under 35 Years | 78 | 9.8% |
| 35 to 44 Years | 170 | 21.3% |
| 45 to 54 Years | 153 | 19.2% |
| 55 to 64 Years | 144 | 18.1% |
| 65 to 74 Years | 139 | 17.4% |
| 75 to 84 Years | 101 | 12.7% |
| 85 Years and Over | 12 | 1.5% |
| Total | 797 | 100.0% |
Housing Finances in Twin Lake
Median Income by Occupancy in Twin Lake
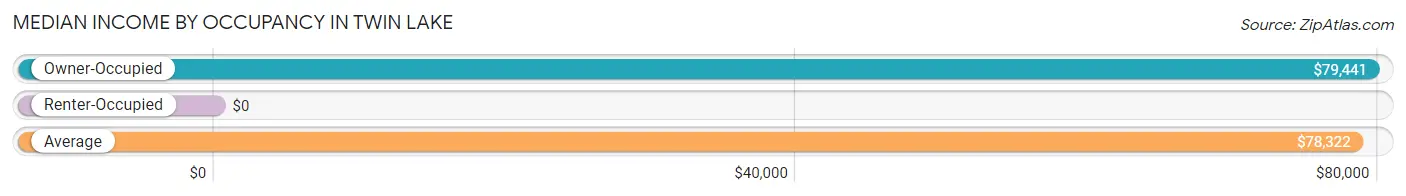
| Occupancy Type | # Households | Median Income |
| Owner-Occupied | 763 (95.7%) | $79,441 |
| Renter-Occupied | 34 (4.3%) | $0 |
| Average | 797 (100.0%) | $78,322 |
Occupancy by Householder Income Bracket in Twin Lake
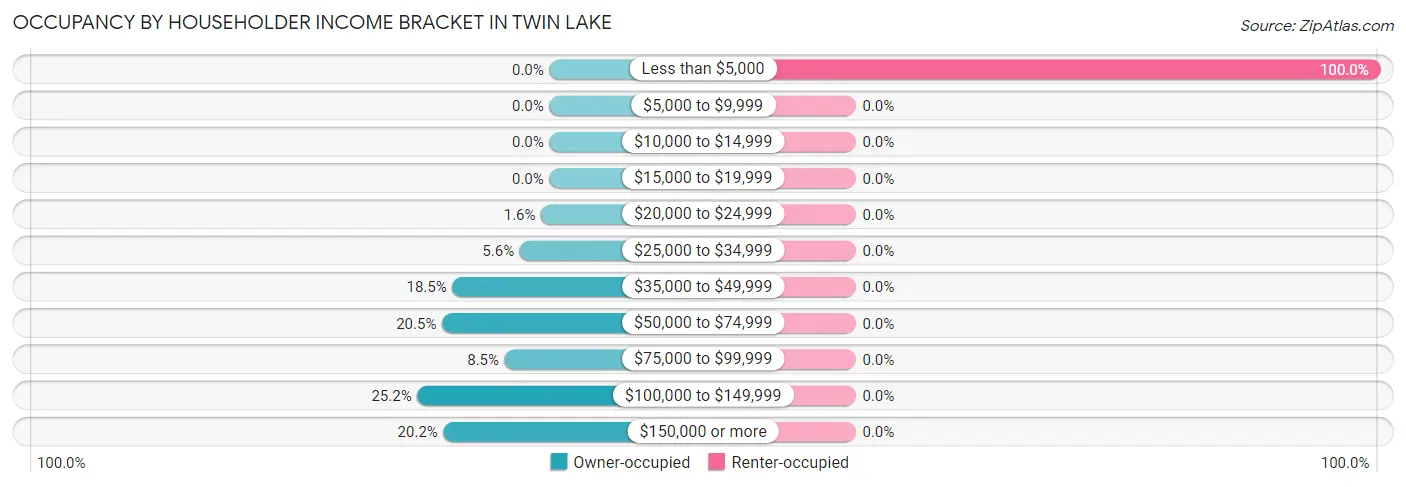
| Income Bracket | Owner-occupied | Renter-occupied |
| Less than $5,000 | 0 (0.0%) | 34 (100.0%) |
| $5,000 to $9,999 | 0 (0.0%) | 0 (0.0%) |
| $10,000 to $14,999 | 0 (0.0%) | 0 (0.0%) |
| $15,000 to $19,999 | 0 (0.0%) | 0 (0.0%) |
| $20,000 to $24,999 | 12 (1.6%) | 0 (0.0%) |
| $25,000 to $34,999 | 43 (5.6%) | 0 (0.0%) |
| $35,000 to $49,999 | 141 (18.5%) | 0 (0.0%) |
| $50,000 to $74,999 | 156 (20.4%) | 0 (0.0%) |
| $75,000 to $99,999 | 65 (8.5%) | 0 (0.0%) |
| $100,000 to $149,999 | 192 (25.2%) | 0 (0.0%) |
| $150,000 or more | 154 (20.2%) | 0 (0.0%) |
| Total | 763 (100.0%) | 34 (100.0%) |
Monthly Housing Cost Tiers in Twin Lake
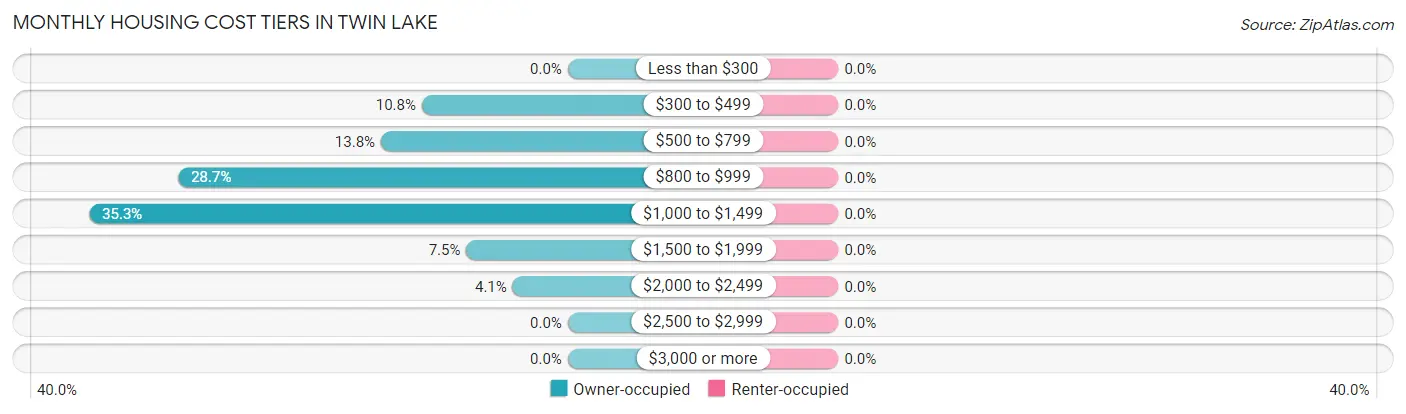
| Monthly Cost | Owner-occupied | Renter-occupied |
| Less than $300 | 0 (0.0%) | 0 (0.0%) |
| $300 to $499 | 82 (10.7%) | 0 (0.0%) |
| $500 to $799 | 105 (13.8%) | 0 (0.0%) |
| $800 to $999 | 219 (28.7%) | 0 (0.0%) |
| $1,000 to $1,499 | 269 (35.3%) | 0 (0.0%) |
| $1,500 to $1,999 | 57 (7.5%) | 0 (0.0%) |
| $2,000 to $2,499 | 31 (4.1%) | 0 (0.0%) |
| $2,500 to $2,999 | 0 (0.0%) | 0 (0.0%) |
| $3,000 or more | 0 (0.0%) | 0 (0.0%) |
| Total | 763 (100.0%) | 34 (100.0%) |
Physical Housing Characteristics in Twin Lake
Housing Structures in Twin Lake
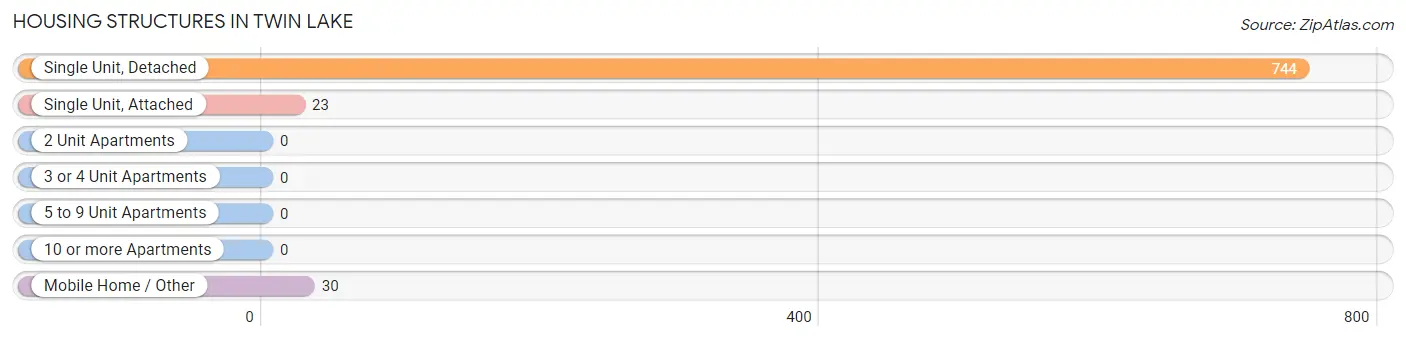
| Structure Type | # Housing Units | % Housing Units |
| Single Unit, Detached | 744 | 93.3% |
| Single Unit, Attached | 23 | 2.9% |
| 2 Unit Apartments | 0 | 0.0% |
| 3 or 4 Unit Apartments | 0 | 0.0% |
| 5 to 9 Unit Apartments | 0 | 0.0% |
| 10 or more Apartments | 0 | 0.0% |
| Mobile Home / Other | 30 | 3.8% |
| Total | 797 | 100.0% |
Housing Structures by Occupancy in Twin Lake
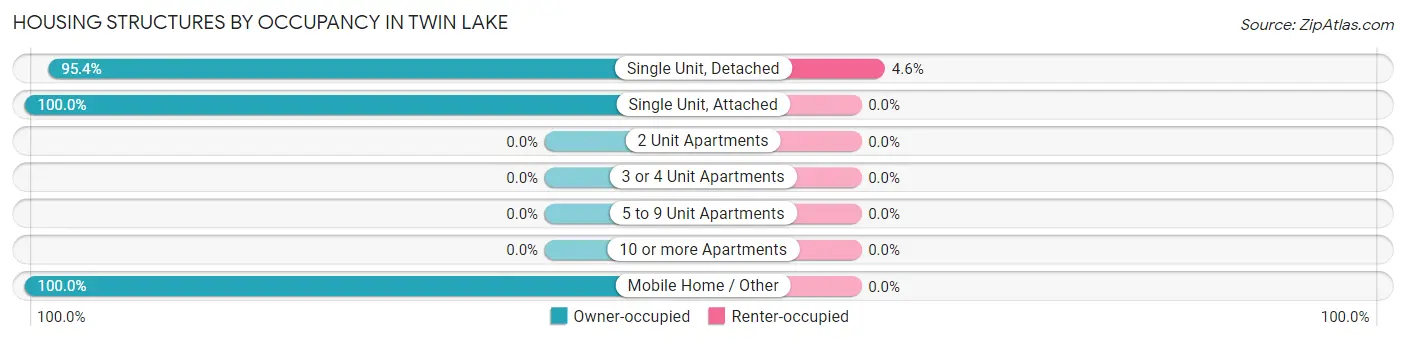
| Structure Type | Owner-occupied | Renter-occupied |
| Single Unit, Detached | 710 (95.4%) | 34 (4.6%) |
| Single Unit, Attached | 23 (100.0%) | 0 (0.0%) |
| 2 Unit Apartments | 0 (0.0%) | 0 (0.0%) |
| 3 or 4 Unit Apartments | 0 (0.0%) | 0 (0.0%) |
| 5 to 9 Unit Apartments | 0 (0.0%) | 0 (0.0%) |
| 10 or more Apartments | 0 (0.0%) | 0 (0.0%) |
| Mobile Home / Other | 30 (100.0%) | 0 (0.0%) |
| Total | 763 (95.7%) | 34 (4.3%) |
Housing Structures by Number of Rooms in Twin Lake
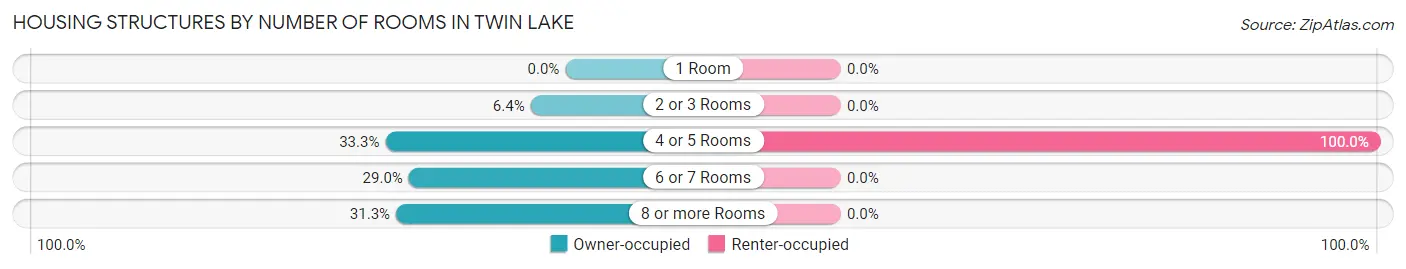
| Number of Rooms | Owner-occupied | Renter-occupied |
| 1 Room | 0 (0.0%) | 0 (0.0%) |
| 2 or 3 Rooms | 49 (6.4%) | 0 (0.0%) |
| 4 or 5 Rooms | 254 (33.3%) | 34 (100.0%) |
| 6 or 7 Rooms | 221 (29.0%) | 0 (0.0%) |
| 8 or more Rooms | 239 (31.3%) | 0 (0.0%) |
| Total | 763 (100.0%) | 34 (100.0%) |
Housing Structure by Heating Type in Twin Lake
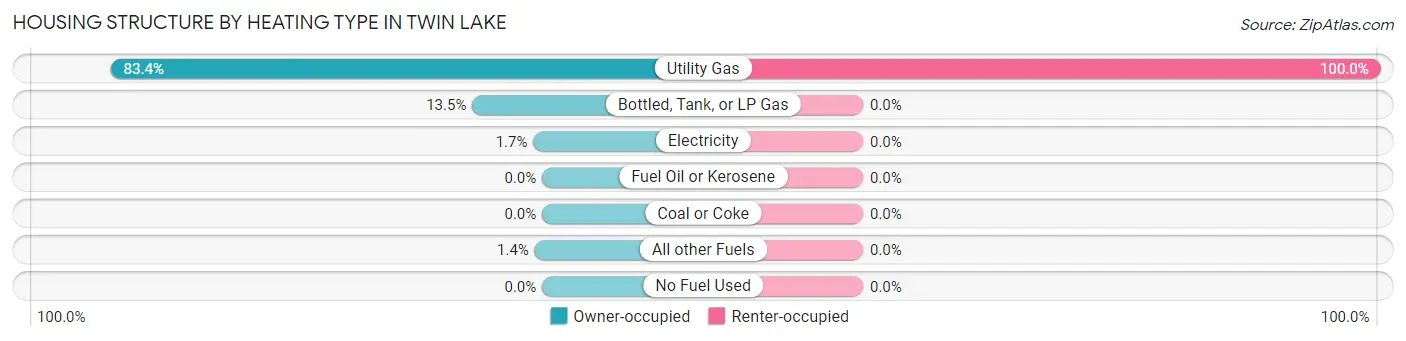
| Heating Type | Owner-occupied | Renter-occupied |
| Utility Gas | 636 (83.4%) | 34 (100.0%) |
| Bottled, Tank, or LP Gas | 103 (13.5%) | 0 (0.0%) |
| Electricity | 13 (1.7%) | 0 (0.0%) |
| Fuel Oil or Kerosene | 0 (0.0%) | 0 (0.0%) |
| Coal or Coke | 0 (0.0%) | 0 (0.0%) |
| All other Fuels | 11 (1.4%) | 0 (0.0%) |
| No Fuel Used | 0 (0.0%) | 0 (0.0%) |
| Total | 763 (100.0%) | 34 (100.0%) |
Household Vehicle Usage in Twin Lake
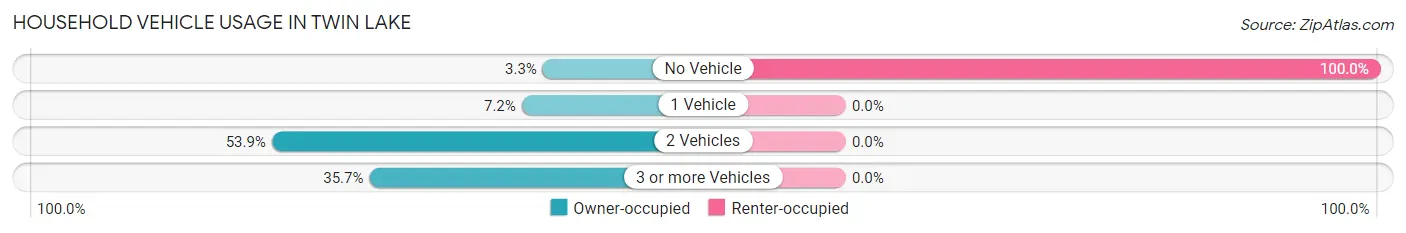
| Vehicles per Household | Owner-occupied | Renter-occupied |
| No Vehicle | 25 (3.3%) | 34 (100.0%) |
| 1 Vehicle | 55 (7.2%) | 0 (0.0%) |
| 2 Vehicles | 411 (53.9%) | 0 (0.0%) |
| 3 or more Vehicles | 272 (35.6%) | 0 (0.0%) |
| Total | 763 (100.0%) | 34 (100.0%) |
Real Estate & Mortgages in Twin Lake
Real Estate and Mortgage Overview in Twin Lake
| Characteristic | Without Mortgage | With Mortgage |
| Housing Units | 254 | 509 |
| Median Property Value | $320,200 | $147,900 |
| Median Household Income | $99,605 | $76 |
| Monthly Housing Costs | $683 | $0 |
| Real Estate Taxes | $3,301 | $37 |
Property Value by Mortgage Status in Twin Lake
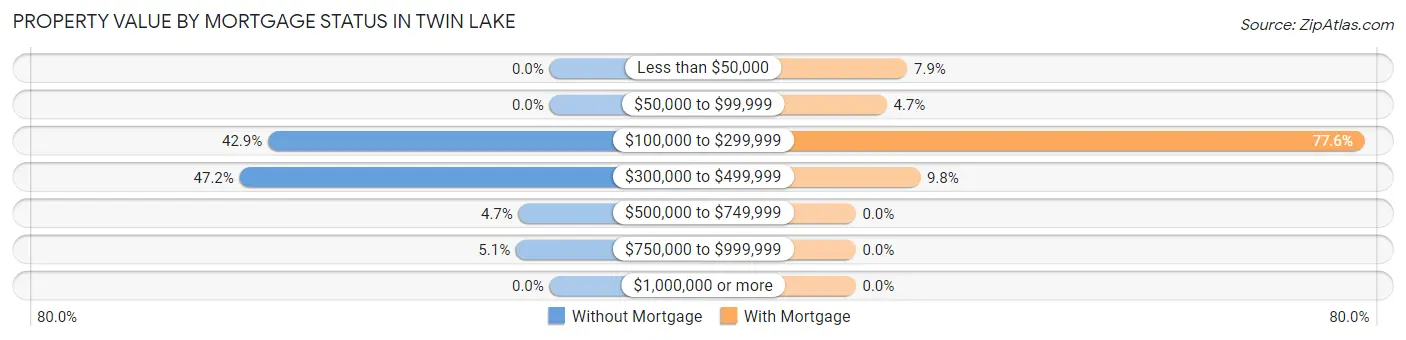
| Property Value | Without Mortgage | With Mortgage |
| Less than $50,000 | 0 (0.0%) | 40 (7.9%) |
| $50,000 to $99,999 | 0 (0.0%) | 24 (4.7%) |
| $100,000 to $299,999 | 109 (42.9%) | 395 (77.6%) |
| $300,000 to $499,999 | 120 (47.2%) | 50 (9.8%) |
| $500,000 to $749,999 | 12 (4.7%) | 0 (0.0%) |
| $750,000 to $999,999 | 13 (5.1%) | 0 (0.0%) |
| $1,000,000 or more | 0 (0.0%) | 0 (0.0%) |
| Total | 254 (100.0%) | 509 (100.0%) |
Household Income by Mortgage Status in Twin Lake
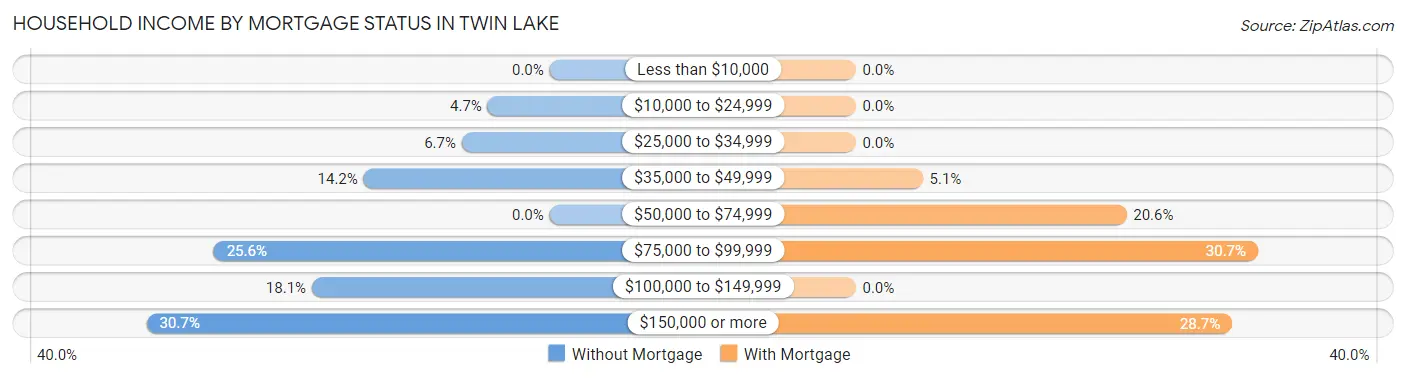
| Household Income | Without Mortgage | With Mortgage |
| Less than $10,000 | 0 (0.0%) | 0 (0.0%) |
| $10,000 to $24,999 | 12 (4.7%) | 0 (0.0%) |
| $25,000 to $34,999 | 17 (6.7%) | 0 (0.0%) |
| $35,000 to $49,999 | 36 (14.2%) | 26 (5.1%) |
| $50,000 to $74,999 | 0 (0.0%) | 105 (20.6%) |
| $75,000 to $99,999 | 65 (25.6%) | 156 (30.6%) |
| $100,000 to $149,999 | 46 (18.1%) | 0 (0.0%) |
| $150,000 or more | 78 (30.7%) | 146 (28.7%) |
| Total | 254 (100.0%) | 509 (100.0%) |
Property Value to Household Income Ratio in Twin Lake
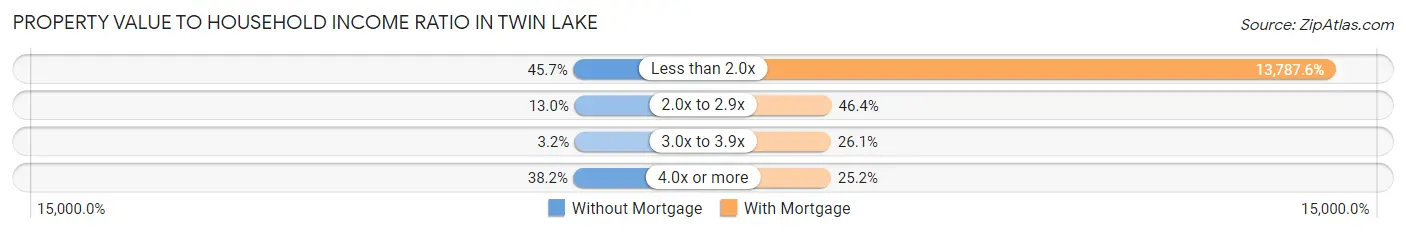
| Value-to-Income Ratio | Without Mortgage | With Mortgage |
| Less than 2.0x | 116 (45.7%) | 70,179 (13,787.6%) |
| 2.0x to 2.9x | 33 (13.0%) | 236 (46.4%) |
| 3.0x to 3.9x | 8 (3.2%) | 133 (26.1%) |
| 4.0x or more | 97 (38.2%) | 128 (25.2%) |
| Total | 254 (100.0%) | 509 (100.0%) |
Real Estate Taxes by Mortgage Status in Twin Lake
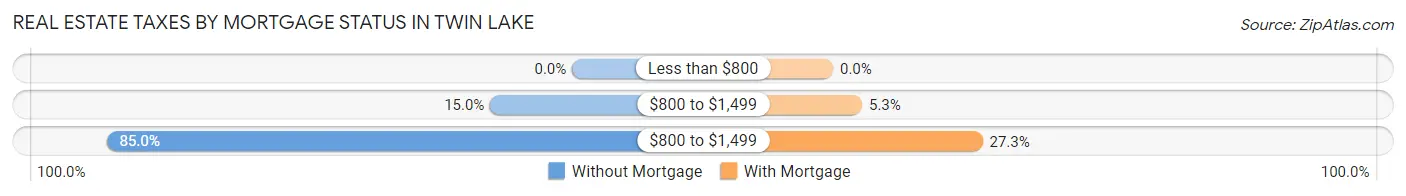
| Property Taxes | Without Mortgage | With Mortgage |
| Less than $800 | 0 (0.0%) | 0 (0.0%) |
| $800 to $1,499 | 38 (15.0%) | 27 (5.3%) |
| $800 to $1,499 | 216 (85.0%) | 139 (27.3%) |
| Total | 254 (100.0%) | 509 (100.0%) |
Health & Disability in Twin Lake
Health Insurance Coverage by Age in Twin Lake
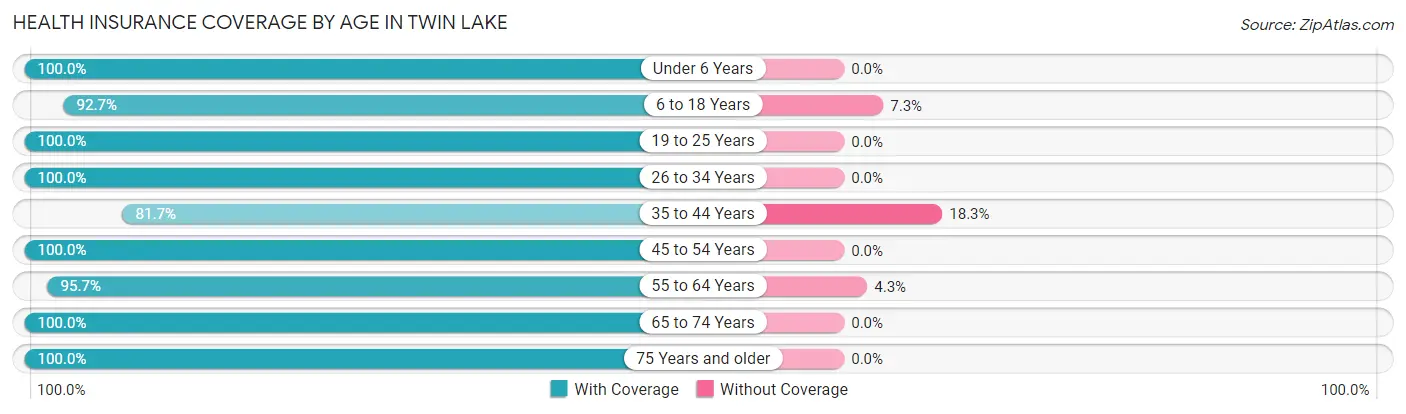
| Age Bracket | With Coverage | Without Coverage |
| Under 6 Years | 112 (100.0%) | 0 (0.0%) |
| 6 to 18 Years | 242 (92.7%) | 19 (7.3%) |
| 19 to 25 Years | 61 (100.0%) | 0 (0.0%) |
| 26 to 34 Years | 240 (100.0%) | 0 (0.0%) |
| 35 to 44 Years | 210 (81.7%) | 47 (18.3%) |
| 45 to 54 Years | 242 (100.0%) | 0 (0.0%) |
| 55 to 64 Years | 267 (95.7%) | 12 (4.3%) |
| 65 to 74 Years | 296 (100.0%) | 0 (0.0%) |
| 75 Years and older | 137 (100.0%) | 0 (0.0%) |
| Total | 1,807 (95.9%) | 78 (4.1%) |
Health Insurance Coverage by Citizenship Status in Twin Lake
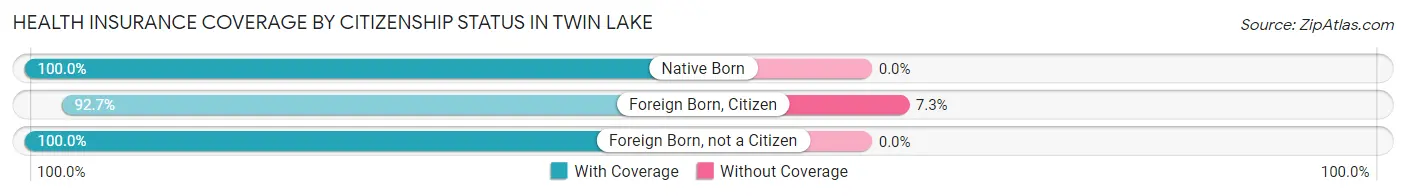
| Citizenship Status | With Coverage | Without Coverage |
| Native Born | 112 (100.0%) | 0 (0.0%) |
| Foreign Born, Citizen | 242 (92.7%) | 19 (7.3%) |
| Foreign Born, not a Citizen | 61 (100.0%) | 0 (0.0%) |
Health Insurance Coverage by Household Income in Twin Lake
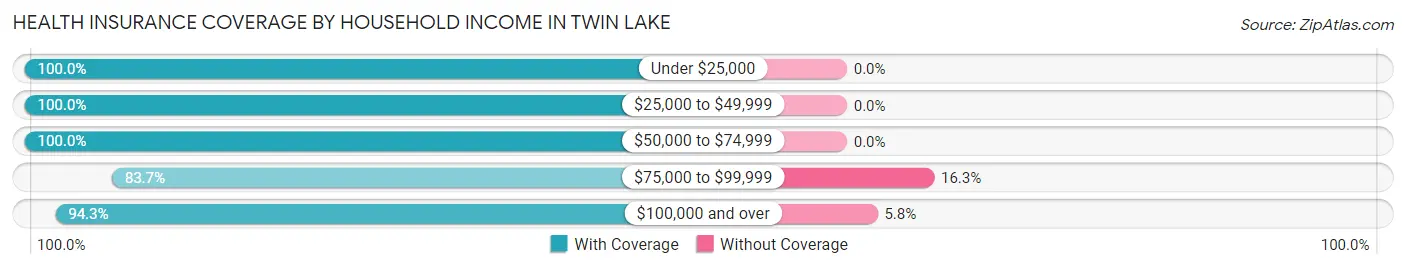
| Household Income | With Coverage | Without Coverage |
| Under $25,000 | 46 (100.0%) | 0 (0.0%) |
| $25,000 to $49,999 | 400 (100.0%) | 0 (0.0%) |
| $50,000 to $74,999 | 364 (100.0%) | 0 (0.0%) |
| $75,000 to $99,999 | 128 (83.7%) | 25 (16.3%) |
| $100,000 and over | 869 (94.3%) | 53 (5.8%) |
Public vs Private Health Insurance Coverage by Age in Twin Lake
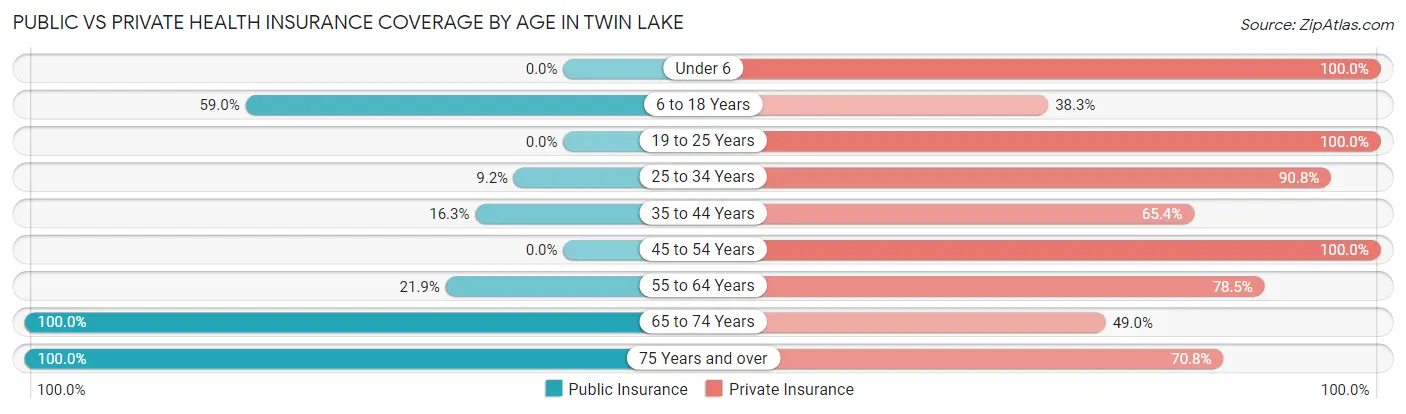
| Age Bracket | Public Insurance | Private Insurance |
| Under 6 | 0 (0.0%) | 112 (100.0%) |
| 6 to 18 Years | 154 (59.0%) | 100 (38.3%) |
| 19 to 25 Years | 0 (0.0%) | 61 (100.0%) |
| 25 to 34 Years | 22 (9.2%) | 218 (90.8%) |
| 35 to 44 Years | 42 (16.3%) | 168 (65.4%) |
| 45 to 54 Years | 0 (0.0%) | 242 (100.0%) |
| 55 to 64 Years | 61 (21.9%) | 219 (78.5%) |
| 65 to 74 Years | 296 (100.0%) | 145 (49.0%) |
| 75 Years and over | 137 (100.0%) | 97 (70.8%) |
| Total | 712 (37.8%) | 1,362 (72.3%) |
Disability Status by Sex by Age in Twin Lake
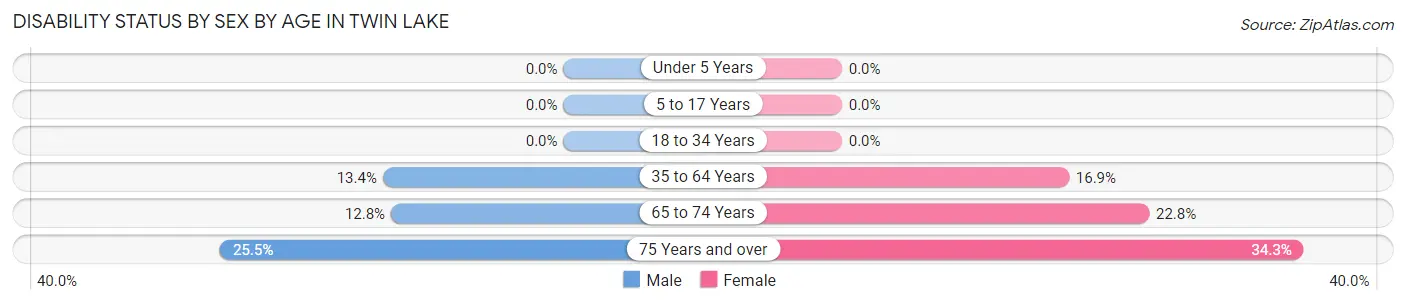
| Age Bracket | Male | Female |
| Under 5 Years | 0 (0.0%) | 0 (0.0%) |
| 5 to 17 Years | 0 (0.0%) | 0 (0.0%) |
| 18 to 34 Years | 0 (0.0%) | 0 (0.0%) |
| 35 to 64 Years | 59 (13.4%) | 57 (16.9%) |
| 65 to 74 Years | 16 (12.8%) | 39 (22.8%) |
| 75 Years and over | 26 (25.5%) | 12 (34.3%) |
Disability Class by Sex by Age in Twin Lake
Disability Class: Hearing Difficulty
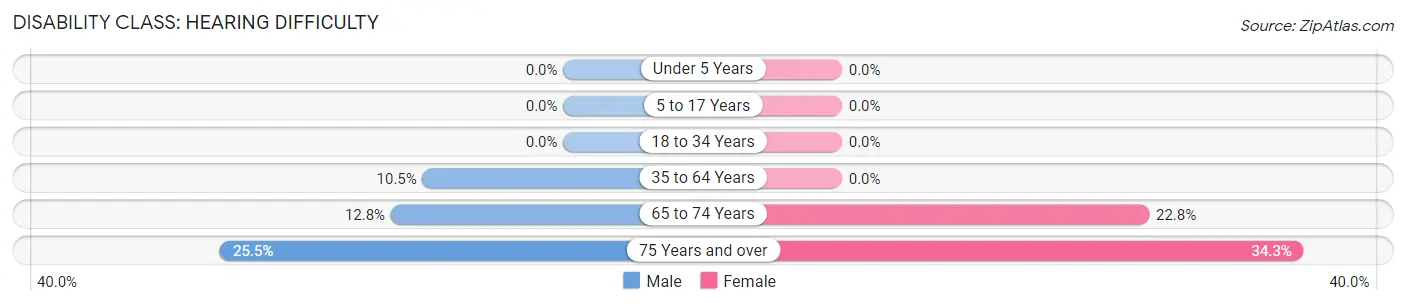
| Age Bracket | Male | Female |
| Under 5 Years | 0 (0.0%) | 0 (0.0%) |
| 5 to 17 Years | 0 (0.0%) | 0 (0.0%) |
| 18 to 34 Years | 0 (0.0%) | 0 (0.0%) |
| 35 to 64 Years | 46 (10.4%) | 0 (0.0%) |
| 65 to 74 Years | 16 (12.8%) | 39 (22.8%) |
| 75 Years and over | 26 (25.5%) | 12 (34.3%) |
Disability Class: Vision Difficulty
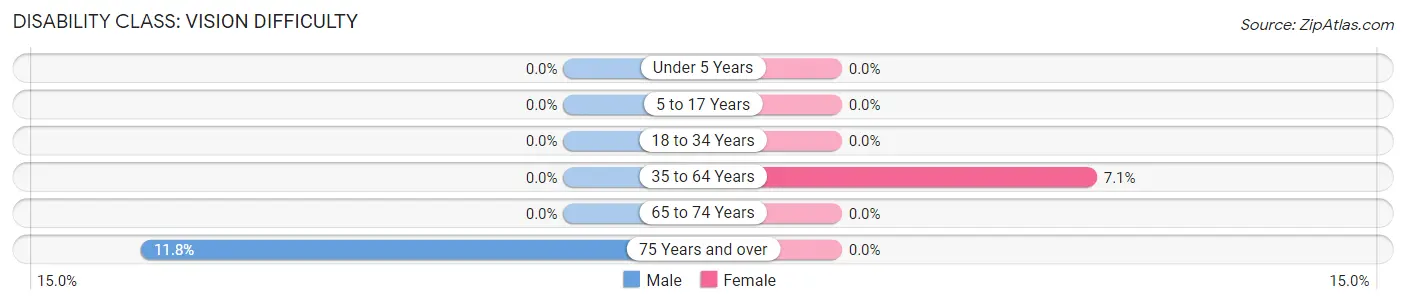
| Age Bracket | Male | Female |
| Under 5 Years | 0 (0.0%) | 0 (0.0%) |
| 5 to 17 Years | 0 (0.0%) | 0 (0.0%) |
| 18 to 34 Years | 0 (0.0%) | 0 (0.0%) |
| 35 to 64 Years | 0 (0.0%) | 24 (7.1%) |
| 65 to 74 Years | 0 (0.0%) | 0 (0.0%) |
| 75 Years and over | 12 (11.8%) | 0 (0.0%) |
Disability Class: Cognitive Difficulty
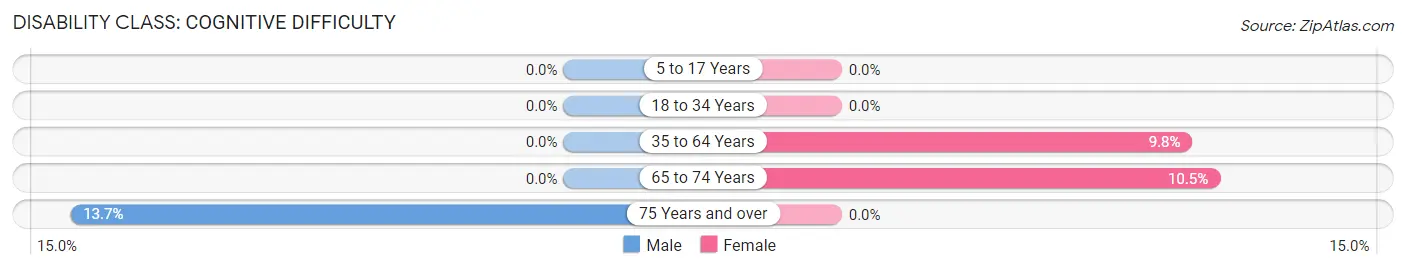
| Age Bracket | Male | Female |
| 5 to 17 Years | 0 (0.0%) | 0 (0.0%) |
| 18 to 34 Years | 0 (0.0%) | 0 (0.0%) |
| 35 to 64 Years | 0 (0.0%) | 33 (9.8%) |
| 65 to 74 Years | 0 (0.0%) | 18 (10.5%) |
| 75 Years and over | 14 (13.7%) | 0 (0.0%) |
Disability Class: Ambulatory Difficulty
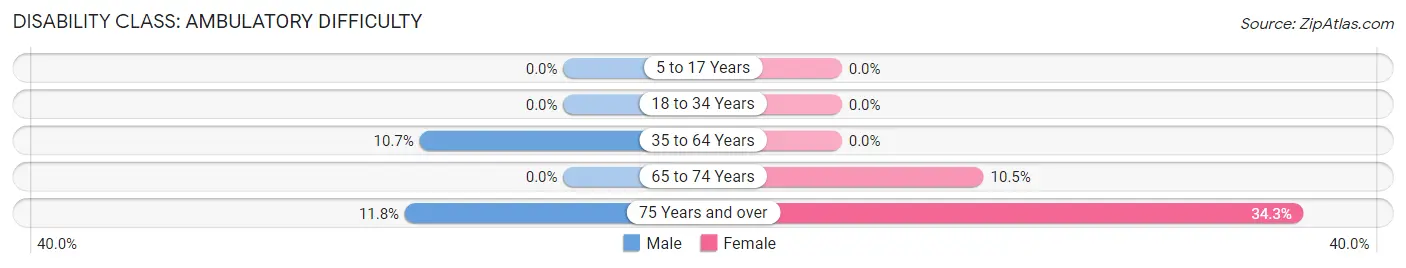
| Age Bracket | Male | Female |
| 5 to 17 Years | 0 (0.0%) | 0 (0.0%) |
| 18 to 34 Years | 0 (0.0%) | 0 (0.0%) |
| 35 to 64 Years | 47 (10.7%) | 0 (0.0%) |
| 65 to 74 Years | 0 (0.0%) | 18 (10.5%) |
| 75 Years and over | 12 (11.8%) | 12 (34.3%) |
Disability Class: Self-Care Difficulty
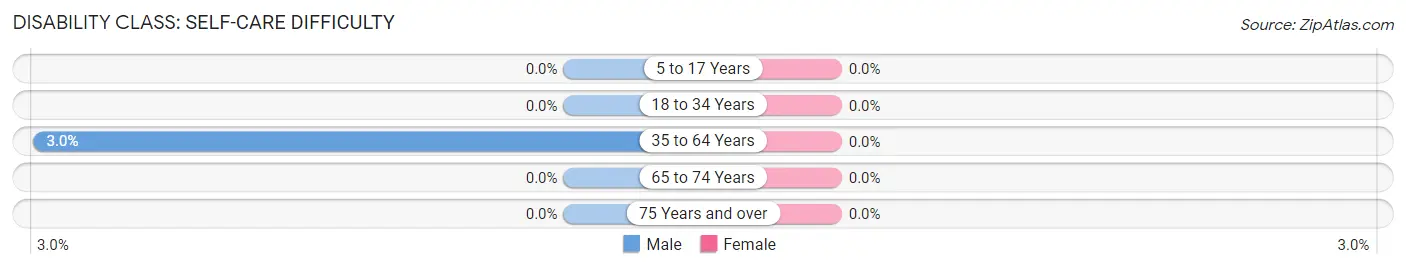
| Age Bracket | Male | Female |
| 5 to 17 Years | 0 (0.0%) | 0 (0.0%) |
| 18 to 34 Years | 0 (0.0%) | 0 (0.0%) |
| 35 to 64 Years | 13 (2.9%) | 0 (0.0%) |
| 65 to 74 Years | 0 (0.0%) | 0 (0.0%) |
| 75 Years and over | 0 (0.0%) | 0 (0.0%) |
Technology Access in Twin Lake
Computing Device Access in Twin Lake
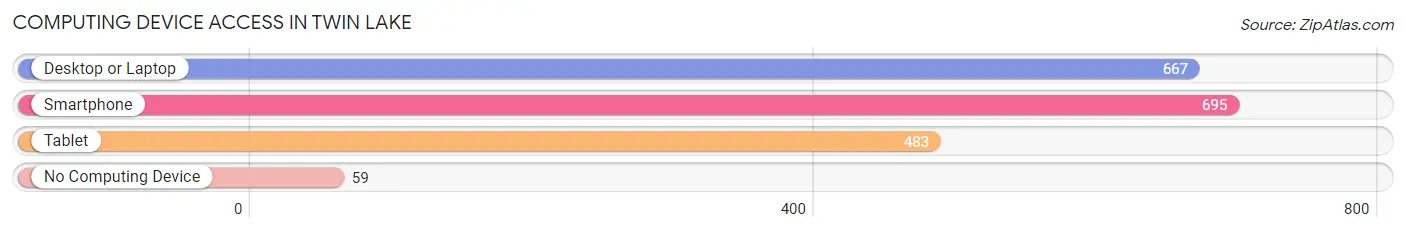
| Device Type | # Households | % Households |
| Desktop or Laptop | 667 | 83.7% |
| Smartphone | 695 | 87.2% |
| Tablet | 483 | 60.6% |
| No Computing Device | 59 | 7.4% |
| Total | 797 | 100.0% |
Internet Access in Twin Lake
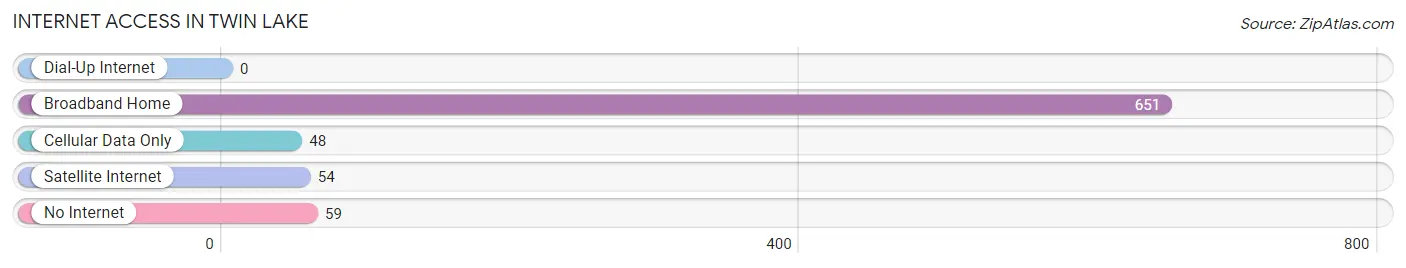
| Internet Type | # Households | % Households |
| Dial-Up Internet | 0 | 0.0% |
| Broadband Home | 651 | 81.7% |
| Cellular Data Only | 48 | 6.0% |
| Satellite Internet | 54 | 6.8% |
| No Internet | 59 | 7.4% |
| Total | 797 | 100.0% |
Twin Lake Summary
Twin Lake is a small village located in Muskegon County, Michigan. It is situated on the eastern shore of Muskegon Lake, approximately 10 miles north of Muskegon. The village has a population of 1,845 people, according to the 2010 census.
Geography
Twin Lake is located in the Muskegon River Valley, which is part of the larger Great Lakes region. The village is situated on the eastern shore of Muskegon Lake, which is part of the Muskegon River watershed. The village is surrounded by rolling hills and wooded areas, and is located approximately 10 miles north of Muskegon.
History
Twin Lake was first settled in the early 1800s by settlers from New York and Pennsylvania. The village was originally known as “Twin Lakes” due to its location on two small lakes, which were later combined into one. The village was officially incorporated in 1891.
In the early 1900s, Twin Lake was a popular summer resort destination for wealthy families from Chicago and Detroit. The village was home to several large resorts, including the Twin Lake Hotel, which was built in 1906. The hotel was destroyed by fire in the 1950s.
Economy
Twin Lake’s economy is largely based on tourism and agriculture. The village is home to several small businesses, including restaurants, shops, and a marina. The village also has a small manufacturing sector, which produces furniture, wood products, and other items.
Demographics
According to the 2010 census, Twin Lake has a population of 1,845 people. The population is predominantly white (94.3%), with small percentages of African American (2.2%), Hispanic (1.3%), and Asian (1.2%) residents. The median household income is $41,944, and the median age is 43.
Conclusion
Twin Lake is a small village located in Muskegon County, Michigan. It is situated on the eastern shore of Muskegon Lake, approximately 10 miles north of Muskegon. The village has a population of 1,845 people, according to the 2010 census. Twin Lake’s economy is largely based on tourism and agriculture, and the village is home to several small businesses. The population is predominantly white, with small percentages of African American, Hispanic, and Asian residents.
Common Questions
What is Per Capita Income in Twin Lake?
Per Capita income in Twin Lake is $44,633.
What is the Median Family Income in Twin Lake?
Median Family Income in Twin Lake is $82,344.
What is the Median Household income in Twin Lake?
Median Household Income in Twin Lake is $78,322.
What is Income or Wage Gap in Twin Lake?
Income or Wage Gap in Twin Lake is 40.4%.
Women in Twin Lake earn 59.6 cents for every dollar earned by a man.
What is Inequality or Gini Index in Twin Lake?
Inequality or Gini Index in Twin Lake is 0.40.
What is the Total Population of Twin Lake?
Total Population of Twin Lake is 1,885.
What is the Total Male Population of Twin Lake?
Total Male Population of Twin Lake is 1,013.
What is the Total Female Population of Twin Lake?
Total Female Population of Twin Lake is 872.
What is the Ratio of Males per 100 Females in Twin Lake?
There are 116.17 Males per 100 Females in Twin Lake.
What is the Ratio of Females per 100 Males in Twin Lake?
There are 86.08 Females per 100 Males in Twin Lake.
What is the Median Population Age in Twin Lake?
Median Population Age in Twin Lake is 46.3 Years.
What is the Average Family Size in Twin Lake
Average Family Size in Twin Lake is 2.7 People.
What is the Average Household Size in Twin Lake
Average Household Size in Twin Lake is 2.4 People.
How Large is the Labor Force in Twin Lake?
There are 1,025 People in the Labor Forcein in Twin Lake.
What is the Percentage of People in the Labor Force in Twin Lake?
63.7% of People are in the Labor Force in Twin Lake.
What is the Unemployment Rate in Twin Lake?
Unemployment Rate in Twin Lake is 21.1%.