Filer City, MI Map & Demographics
Filer City Map
Filer City Overview
$29,440
PER CAPITA INCOME
$100,208
AVG FAMILY INCOME
$84,250
AVG HOUSEHOLD INCOME
83.3%
WAGE / INCOME GAP [ % ]
16.7¢/ $1
WAGE / INCOME GAP [ $ ]
0.26
INEQUALITY / GINI INDEX
172
TOTAL POPULATION
62
MALE POPULATION
110
FEMALE POPULATION
56.36
MALES / 100 FEMALES
177.42
FEMALES / 100 MALES
43.6
MEDIAN AGE
3.2
AVG FAMILY SIZE
3.0
AVG HOUSEHOLD SIZE
117
LABOR FORCE [ PEOPLE ]
75.0%
PERCENT IN LABOR FORCE
6.8%
UNEMPLOYMENT RATE
Filer City Zip Codes
Filer City Area Codes
Income in Filer City
Income Overview in Filer City
Per Capita Income in Filer City is $29,440, while median incomes of families and households are $100,208 and $84,250 respectively.
| Characteristic | Number | Measure |
| Per Capita Income | 172 | $29,440 |
| Median Family Income | 52 | $100,208 |
| Mean Family Income | 52 | $82,948 |
| Median Household Income | 57 | $84,250 |
| Mean Household Income | 57 | $77,033 |
| Income Deficit | 52 | $0 |
| Wage / Income Gap (%) | 172 | 83.32% |
| Wage / Income Gap ($) | 172 | 16.68¢ per $1 |
| Gini / Inequality Index | 172 | 0.26 |
Earnings by Sex in Filer City
Average Earnings in Filer City are $17,000, $73,750 for men and $12,303 for women, a difference of 83.3%.
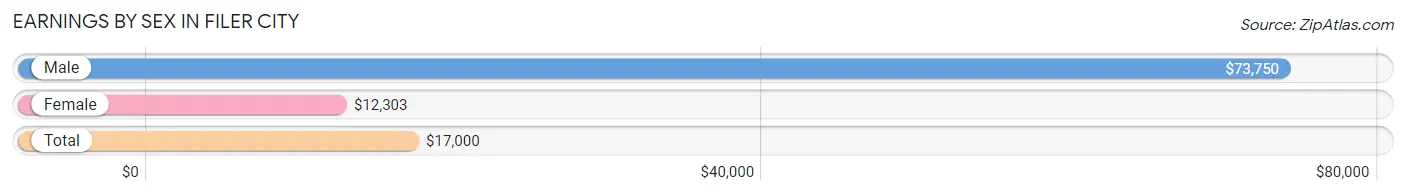
| Sex | Number | Average Earnings |
| Male | 43 (37.1%) | $73,750 |
| Female | 73 (62.9%) | $12,303 |
| Total | 116 (100.0%) | $17,000 |
Earnings by Sex by Income Bracket in Filer City
The most common earnings brackets in Filer City are $65,000 to $74,999 for men (13 | 30.2%) and $10,000 to $12,499 for women (19 | 26.0%).
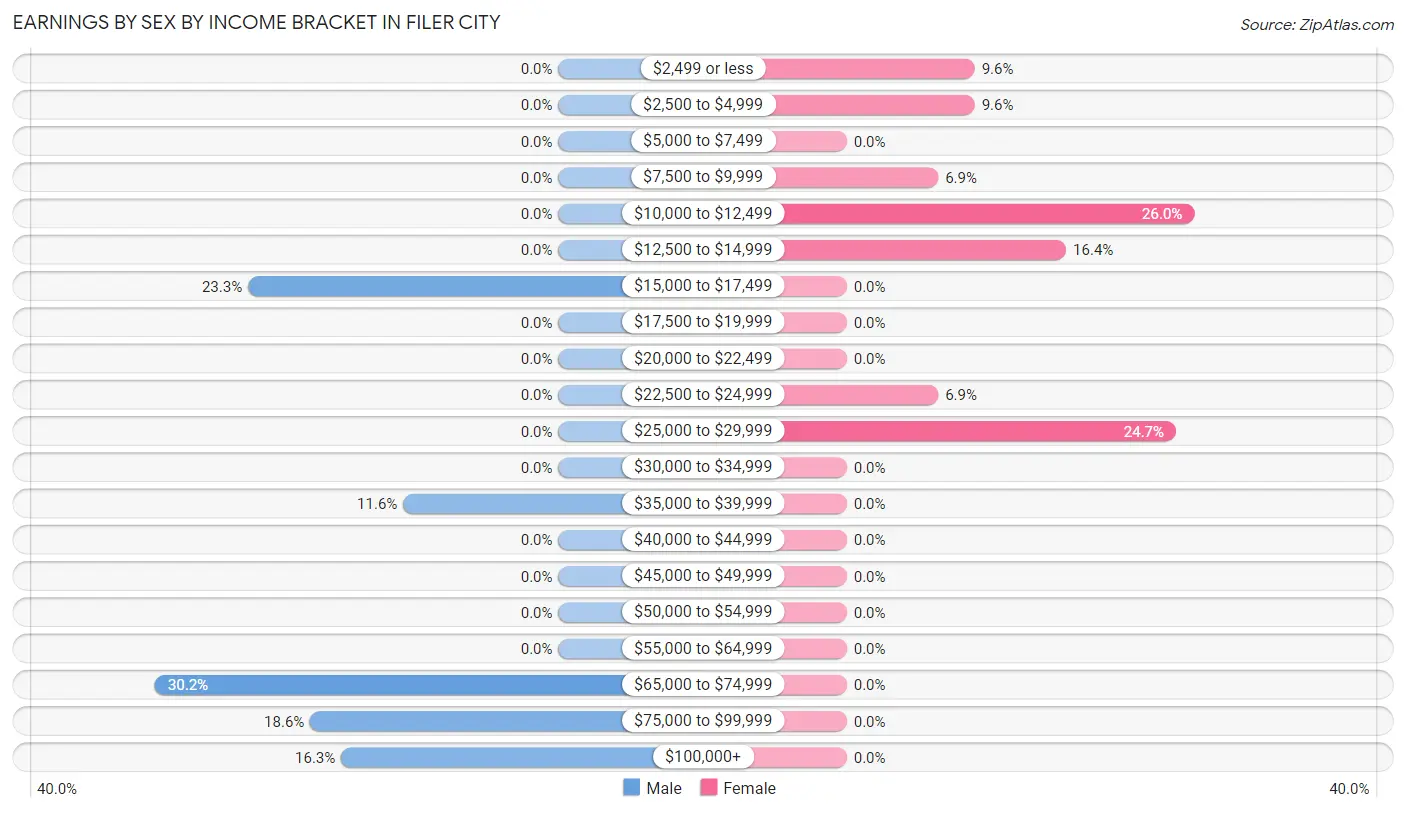
| Income | Male | Female |
| $2,499 or less | 0 (0.0%) | 7 (9.6%) |
| $2,500 to $4,999 | 0 (0.0%) | 7 (9.6%) |
| $5,000 to $7,499 | 0 (0.0%) | 0 (0.0%) |
| $7,500 to $9,999 | 0 (0.0%) | 5 (6.9%) |
| $10,000 to $12,499 | 0 (0.0%) | 19 (26.0%) |
| $12,500 to $14,999 | 0 (0.0%) | 12 (16.4%) |
| $15,000 to $17,499 | 10 (23.3%) | 0 (0.0%) |
| $17,500 to $19,999 | 0 (0.0%) | 0 (0.0%) |
| $20,000 to $22,499 | 0 (0.0%) | 0 (0.0%) |
| $22,500 to $24,999 | 0 (0.0%) | 5 (6.9%) |
| $25,000 to $29,999 | 0 (0.0%) | 18 (24.7%) |
| $30,000 to $34,999 | 0 (0.0%) | 0 (0.0%) |
| $35,000 to $39,999 | 5 (11.6%) | 0 (0.0%) |
| $40,000 to $44,999 | 0 (0.0%) | 0 (0.0%) |
| $45,000 to $49,999 | 0 (0.0%) | 0 (0.0%) |
| $50,000 to $54,999 | 0 (0.0%) | 0 (0.0%) |
| $55,000 to $64,999 | 0 (0.0%) | 0 (0.0%) |
| $65,000 to $74,999 | 13 (30.2%) | 0 (0.0%) |
| $75,000 to $99,999 | 8 (18.6%) | 0 (0.0%) |
| $100,000+ | 7 (16.3%) | 0 (0.0%) |
| Total | 43 (100.0%) | 73 (100.0%) |
Earnings by Sex by Educational Attainment in Filer City
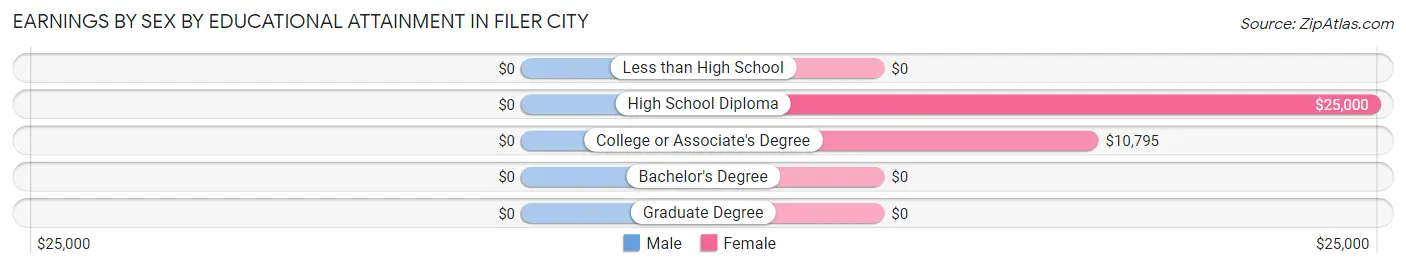
| Educational Attainment | Male Income | Female Income |
| Less than High School | - | - |
| High School Diploma | - | - |
| College or Associate's Degree | - | - |
| Bachelor's Degree | - | - |
| Graduate Degree | - | - |
| Total | $73,750 | $13,750 |
Family Income in Filer City
Family Income Brackets in Filer City
According to the Filer City family income data, there are 27 families falling into the $100,000 to $149,999 income range, which is the most common income bracket and makes up 51.9% of all families.
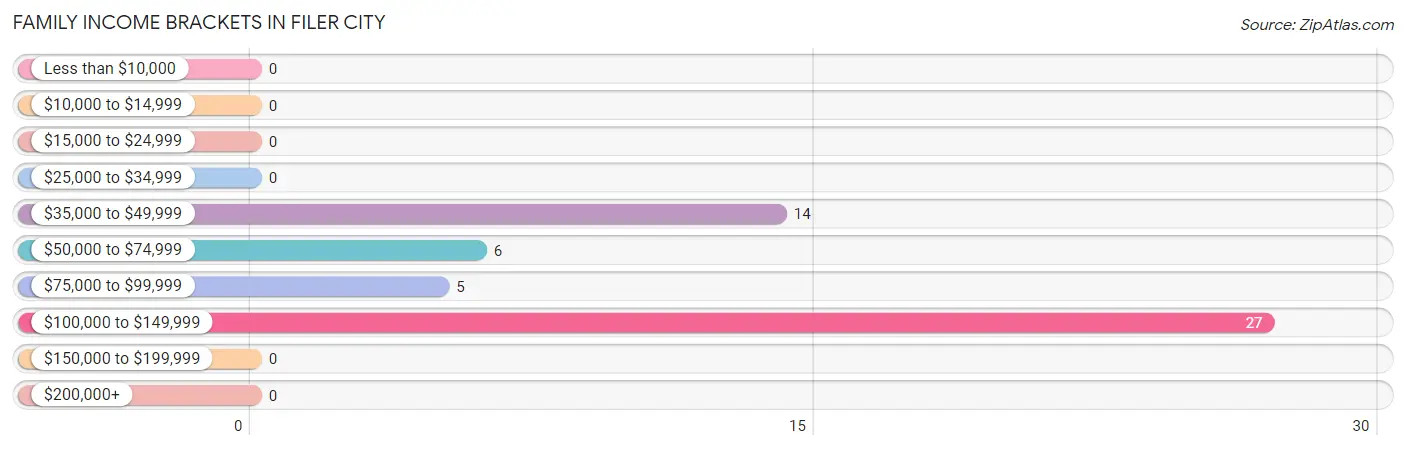
| Income Bracket | # Families | % Families |
| Less than $10,000 | 0 | 0.0% |
| $10,000 to $14,999 | 0 | 0.0% |
| $15,000 to $24,999 | 0 | 0.0% |
| $25,000 to $34,999 | 0 | 0.0% |
| $35,000 to $49,999 | 14 | 26.9% |
| $50,000 to $74,999 | 6 | 11.5% |
| $75,000 to $99,999 | 5 | 9.6% |
| $100,000 to $149,999 | 27 | 51.9% |
| $150,000 to $199,999 | 0 | 0.0% |
| $200,000+ | 0 | 0.0% |
Family Income by Famaliy Size in Filer City
| Income Bracket | # Families | Median Income |
| 2-Person Families | 25 (48.1%) | $0 |
| 3-Person Families | 12 (23.1%) | $0 |
| 4-Person Families | 15 (28.8%) | $0 |
| 5-Person Families | 0 (0.0%) | $0 |
| 6-Person Families | 0 (0.0%) | $0 |
| 7+ Person Families | 0 (0.0%) | $0 |
| Total | 52 (100.0%) | $100,208 |
Family Income by Number of Earners in Filer City
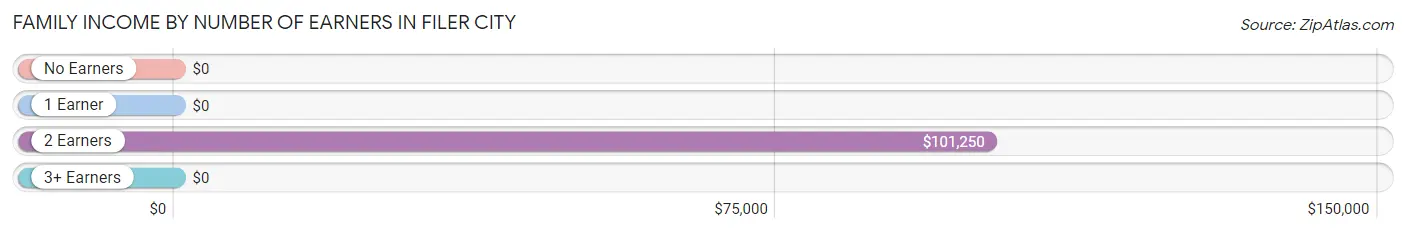
| Number of Earners | # Families | Median Income |
| No Earners | 6 (11.5%) | $0 |
| 1 Earner | 12 (23.1%) | $0 |
| 2 Earners | 21 (40.4%) | $101,250 |
| 3+ Earners | 13 (25.0%) | $0 |
| Total | 52 (100.0%) | $100,208 |
Household Income in Filer City
Household Income Brackets in Filer City
With 27 households falling in the category, the $100,000 to $149,999 income range is the most frequent in Filer City, accounting for 47.4% of all households.
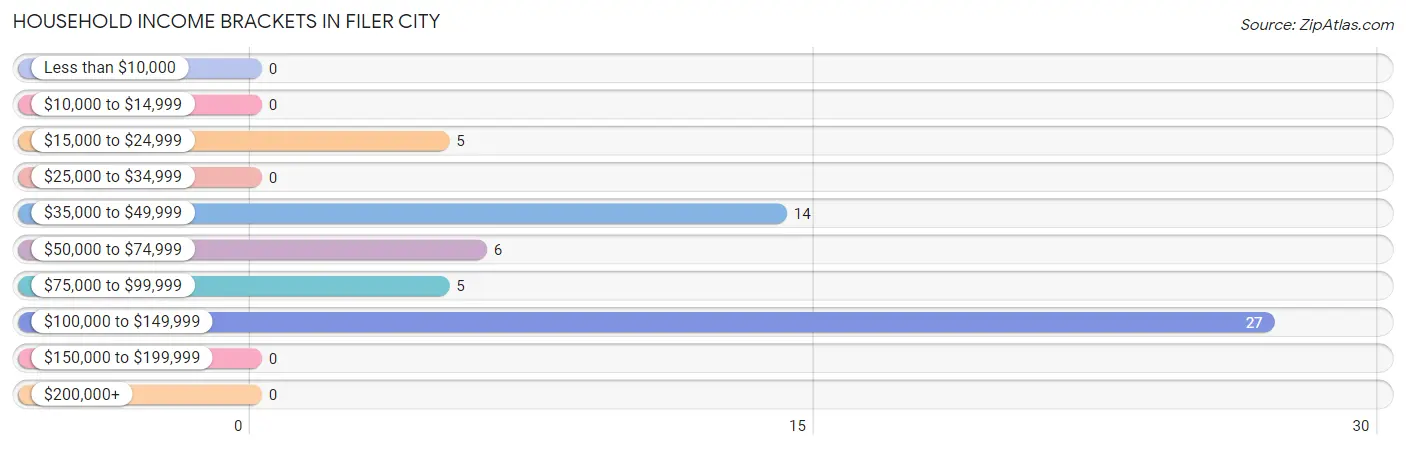
| Income Bracket | # Households | % Households |
| Less than $10,000 | 0 | 0.0% |
| $10,000 to $14,999 | 0 | 0.0% |
| $15,000 to $24,999 | 5 | 8.8% |
| $25,000 to $34,999 | 0 | 0.0% |
| $35,000 to $49,999 | 14 | 24.6% |
| $50,000 to $74,999 | 6 | 10.5% |
| $75,000 to $99,999 | 5 | 8.8% |
| $100,000 to $149,999 | 27 | 47.4% |
| $150,000 to $199,999 | 0 | 0.0% |
| $200,000+ | 0 | 0.0% |
Household Income by Householder Age in Filer City
The median household income in Filer City is $84,250, with the highest median household income of $111,429 found in the 25 to 44 years age bracket for the primary householder. A total of 22 households (38.6%) fall into this category.
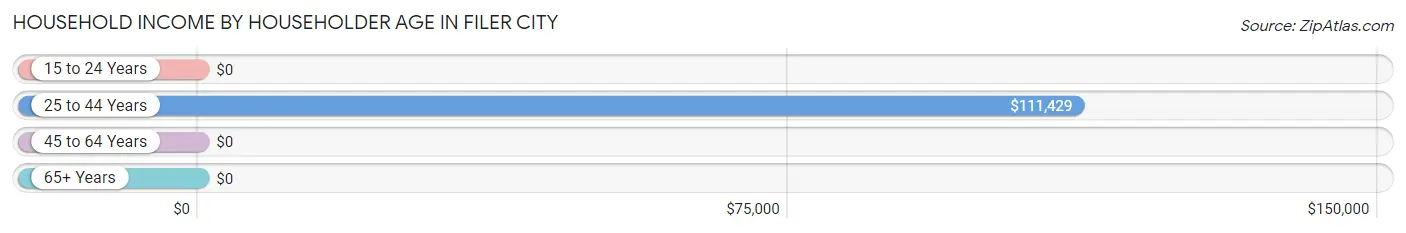
| Income Bracket | # Households | Median Income |
| 15 to 24 Years | 0 (0.0%) | $0 |
| 25 to 44 Years | 22 (38.6%) | $111,429 |
| 45 to 64 Years | 5 (8.8%) | $0 |
| 65+ Years | 30 (52.6%) | $0 |
| Total | 57 (100.0%) | $84,250 |
Poverty in Filer City
Income Below Poverty by Sex and Age in Filer City
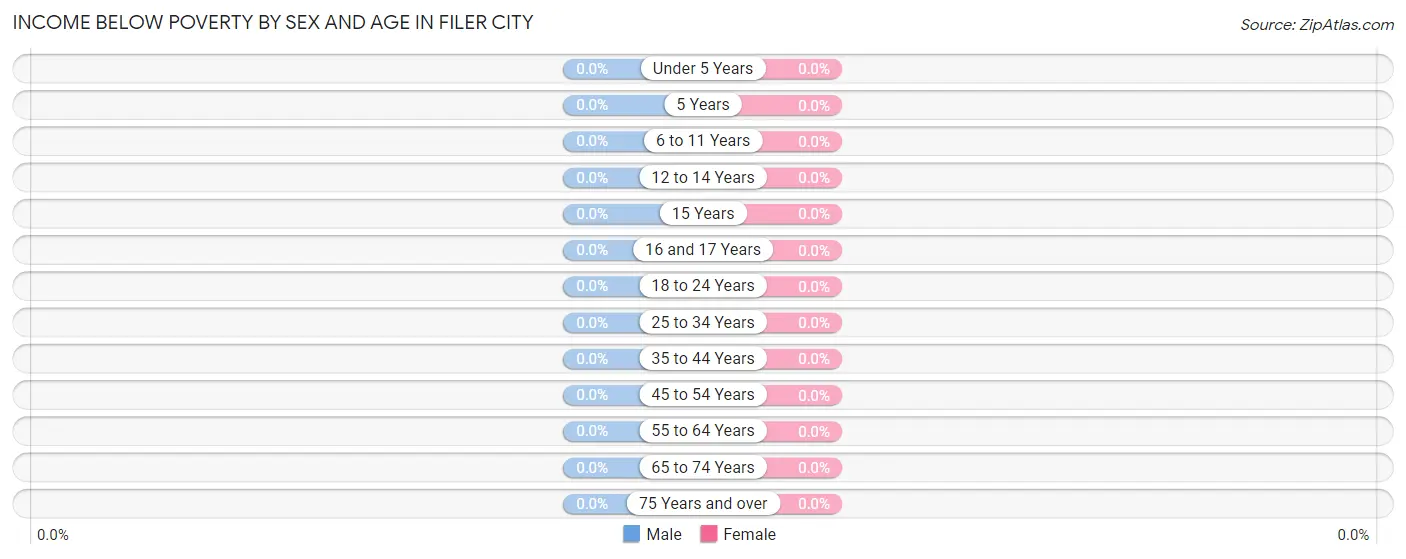
| Age Bracket | Male | Female |
| Under 5 Years | 0 (0.0%) | 0 (0.0%) |
| 5 Years | 0 (0.0%) | 0 (0.0%) |
| 6 to 11 Years | 0 (0.0%) | 0 (0.0%) |
| 12 to 14 Years | 0 (0.0%) | 0 (0.0%) |
| 15 Years | 0 (0.0%) | 0 (0.0%) |
| 16 and 17 Years | 0 (0.0%) | 0 (0.0%) |
| 18 to 24 Years | 0 (0.0%) | 0 (0.0%) |
| 25 to 34 Years | 0 (0.0%) | 0 (0.0%) |
| 35 to 44 Years | 0 (0.0%) | 0 (0.0%) |
| 45 to 54 Years | 0 (0.0%) | 0 (0.0%) |
| 55 to 64 Years | 0 (0.0%) | 0 (0.0%) |
| 65 to 74 Years | 0 (0.0%) | 0 (0.0%) |
| 75 Years and over | 0 (0.0%) | 0 (0.0%) |
| Total | 0 (0.0%) | 0 (0.0%) |
Income Above Poverty by Sex and Age in Filer City
According to the poverty statistics in Filer City, males aged 18 to 24 years and females aged 6 to 11 years are the age groups that are most secure financially, with 100.0% of males and 100.0% of females in these age groups living above the poverty line.
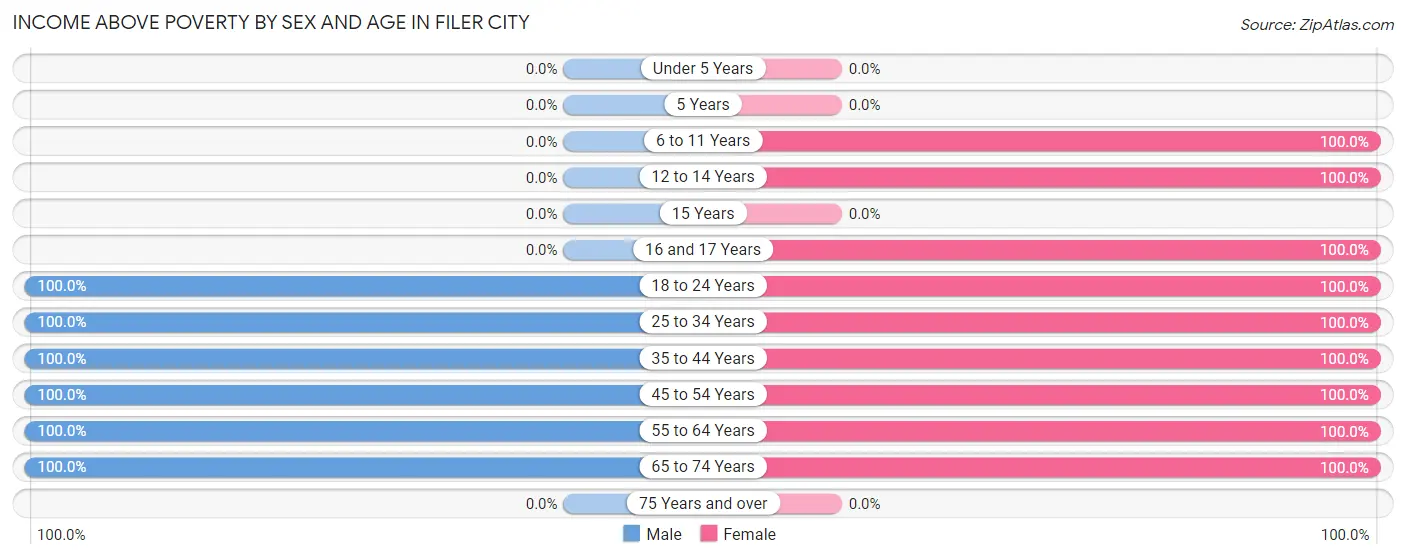
| Age Bracket | Male | Female |
| Under 5 Years | 0 (0.0%) | 0 (0.0%) |
| 5 Years | 0 (0.0%) | 0 (0.0%) |
| 6 to 11 Years | 0 (0.0%) | 8 (100.0%) |
| 12 to 14 Years | 0 (0.0%) | 8 (100.0%) |
| 15 Years | 0 (0.0%) | 0 (0.0%) |
| 16 and 17 Years | 0 (0.0%) | 7 (100.0%) |
| 18 to 24 Years | 8 (100.0%) | 8 (100.0%) |
| 25 to 34 Years | 13 (100.0%) | 7 (100.0%) |
| 35 to 44 Years | 15 (100.0%) | 26 (100.0%) |
| 45 to 54 Years | 10 (100.0%) | 10 (100.0%) |
| 55 to 64 Years | 5 (100.0%) | 5 (100.0%) |
| 65 to 74 Years | 11 (100.0%) | 31 (100.0%) |
| 75 Years and over | 0 (0.0%) | 0 (0.0%) |
| Total | 62 (100.0%) | 110 (100.0%) |
Income Below Poverty Among Married-Couple Families in Filer City
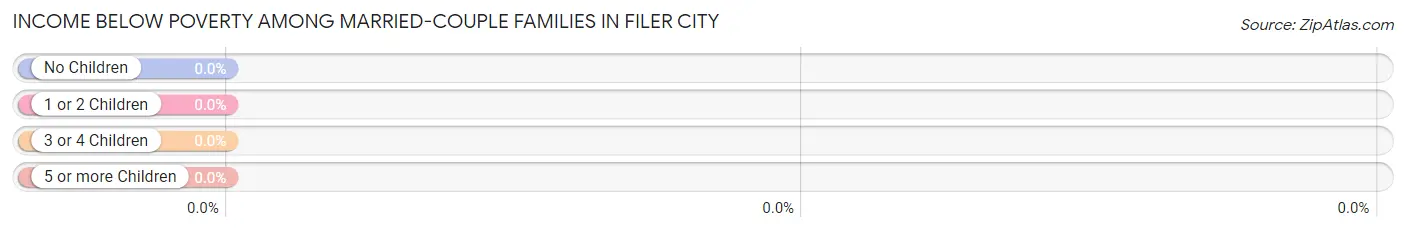
| Children | Above Poverty | Below Poverty |
| No Children | 23 (100.0%) | 0 (0.0%) |
| 1 or 2 Children | 15 (100.0%) | 0 (0.0%) |
| 3 or 4 Children | 0 (0.0%) | 0 (0.0%) |
| 5 or more Children | 0 (0.0%) | 0 (0.0%) |
| Total | 38 (100.0%) | 0 (0.0%) |
Income Below Poverty Among Single-Parent Households in Filer City
| Children | Single Father | Single Mother |
| No Children | 0 (0.0%) | 0 (0.0%) |
| 1 or 2 Children | 0 (0.0%) | 0 (0.0%) |
| 3 or 4 Children | 0 (0.0%) | 0 (0.0%) |
| 5 or more Children | 0 (0.0%) | 0 (0.0%) |
| Total | 0 (0.0%) | 0 (0.0%) |
Income Below Poverty Among Married-Couple vs Single-Parent Households in Filer City
| Children | Married-Couple Families | Single-Parent Households |
| No Children | 0 (0.0%) | 0 (0.0%) |
| 1 or 2 Children | 0 (0.0%) | 0 (0.0%) |
| 3 or 4 Children | 0 (0.0%) | 0 (0.0%) |
| 5 or more Children | 0 (0.0%) | 0 (0.0%) |
| Total | 0 (0.0%) | 0 (0.0%) |
Race in Filer City
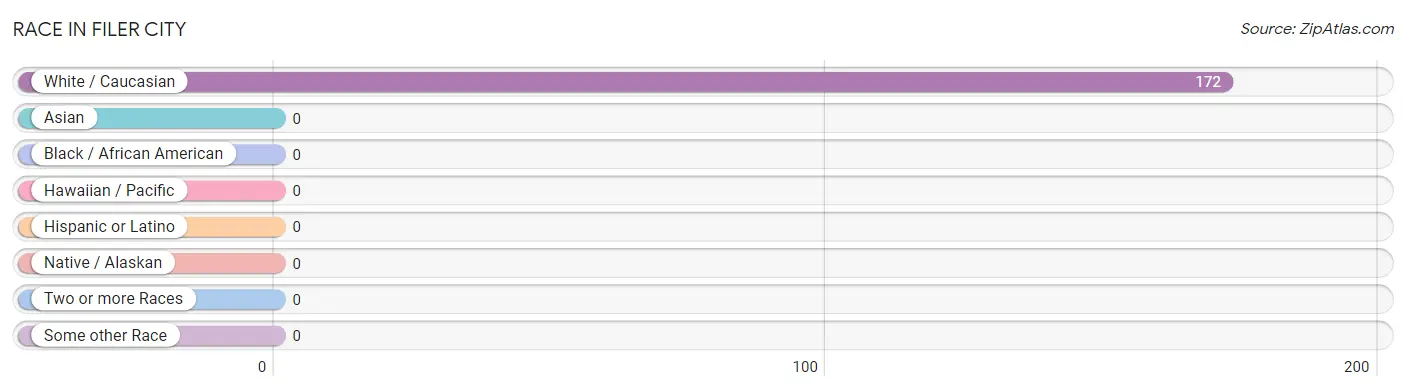
The most populous races in Filer City are , and White / Caucasian (172 | 100.0%).
| Race | # Population | % Population |
| Asian | 0 | 0.0% |
| Black / African American | 0 | 0.0% |
| Hawaiian / Pacific | 0 | 0.0% |
| Hispanic or Latino | 0 | 0.0% |
| Native / Alaskan | 0 | 0.0% |
| White / Caucasian | 172 | 100.0% |
| Two or more Races | 0 | 0.0% |
| Some other Race | 0 | 0.0% |
| Total | 172 | 100.0% |
Ancestry in Filer City
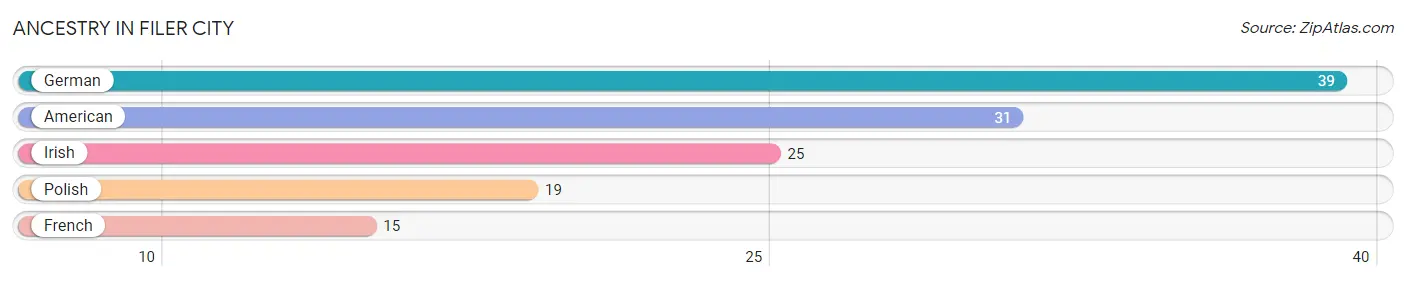
The most populous ancestries reported in Filer City are German (39 | 22.7%), American (31 | 18.0%), Irish (25 | 14.5%), Polish (19 | 11.1%), and French (15 | 8.7%), together accounting for 75.0% of all Filer City residents.
| Ancestry | # Population | % Population |
| American | 31 | 18.0% |
| French | 15 | 8.7% |
| German | 39 | 22.7% |
| Irish | 25 | 14.5% |
| Polish | 19 | 11.1% | View All 5 Rows |
Immigrants in Filer City

| Immigration Origin | # Population | % Population | View All 0 Rows |
Sex and Age in Filer City
Sex and Age in Filer City
The most populous age groups in Filer City are 35 to 39 Years (15 | 24.2%) for men and 65 to 69 Years (19 | 17.3%) for women.
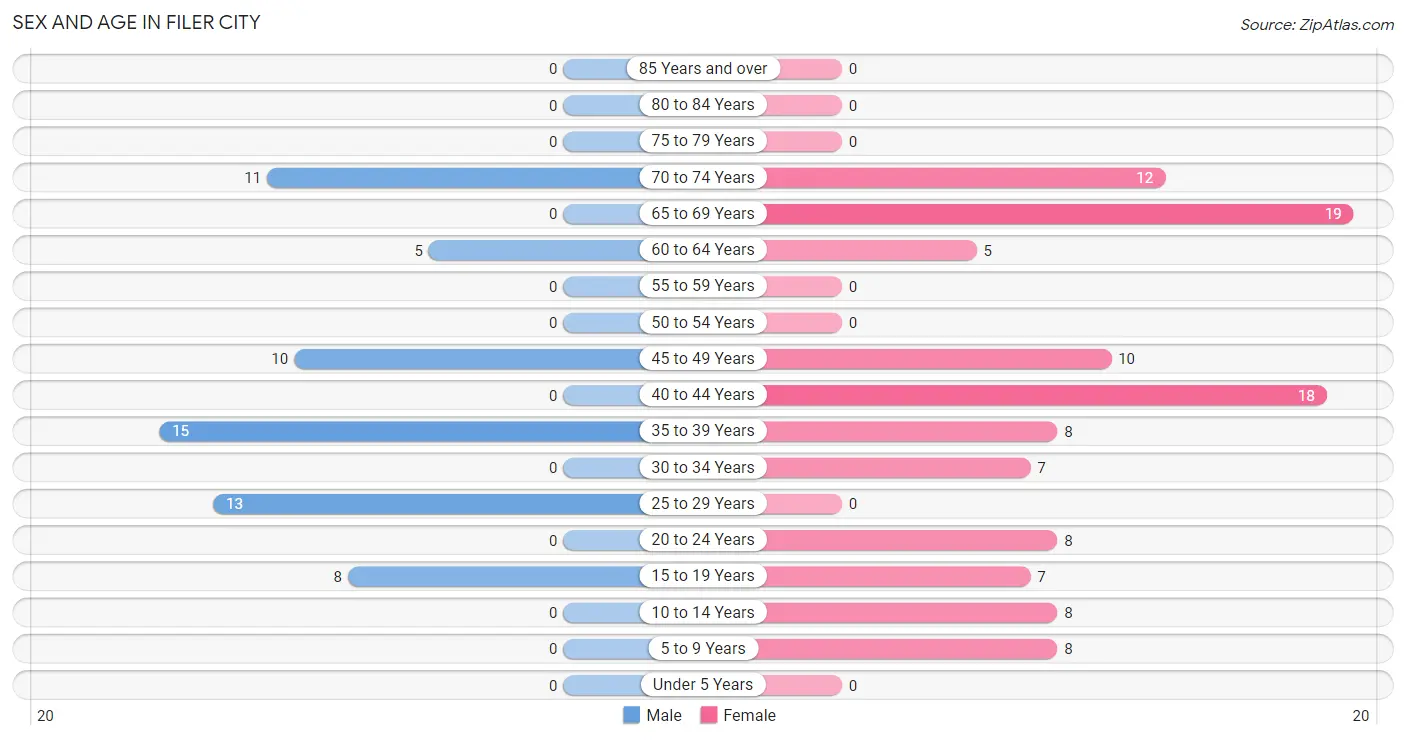
| Age Bracket | Male | Female |
| Under 5 Years | 0 (0.0%) | 0 (0.0%) |
| 5 to 9 Years | 0 (0.0%) | 8 (7.3%) |
| 10 to 14 Years | 0 (0.0%) | 8 (7.3%) |
| 15 to 19 Years | 8 (12.9%) | 7 (6.4%) |
| 20 to 24 Years | 0 (0.0%) | 8 (7.3%) |
| 25 to 29 Years | 13 (21.0%) | 0 (0.0%) |
| 30 to 34 Years | 0 (0.0%) | 7 (6.4%) |
| 35 to 39 Years | 15 (24.2%) | 8 (7.3%) |
| 40 to 44 Years | 0 (0.0%) | 18 (16.4%) |
| 45 to 49 Years | 10 (16.1%) | 10 (9.1%) |
| 50 to 54 Years | 0 (0.0%) | 0 (0.0%) |
| 55 to 59 Years | 0 (0.0%) | 0 (0.0%) |
| 60 to 64 Years | 5 (8.1%) | 5 (4.5%) |
| 65 to 69 Years | 0 (0.0%) | 19 (17.3%) |
| 70 to 74 Years | 11 (17.7%) | 12 (10.9%) |
| 75 to 79 Years | 0 (0.0%) | 0 (0.0%) |
| 80 to 84 Years | 0 (0.0%) | 0 (0.0%) |
| 85 Years and over | 0 (0.0%) | 0 (0.0%) |
| Total | 62 (100.0%) | 110 (100.0%) |
Families and Households in Filer City
Median Family Size in Filer City
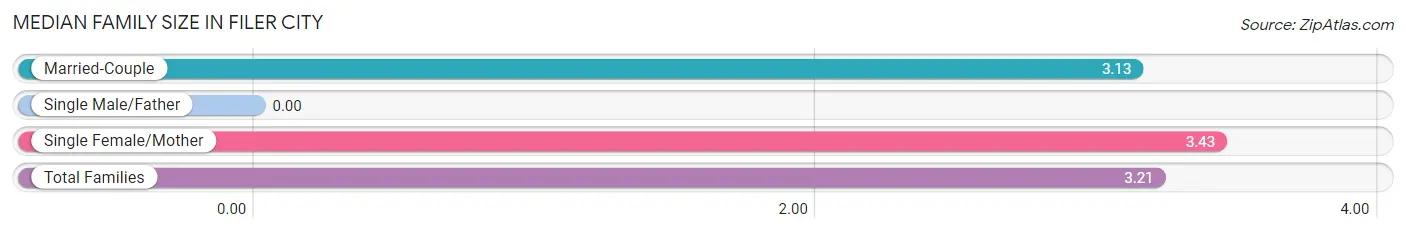
| Family Type | # Families | Family Size |
| Married-Couple | 38 (73.1%) | 3.13 |
| Single Male/Father | 0 (0.0%) | - |
| Single Female/Mother | 14 (26.9%) | 3.43 |
| Total Families | 52 (100.0%) | 3.21 |
Median Household Size in Filer City
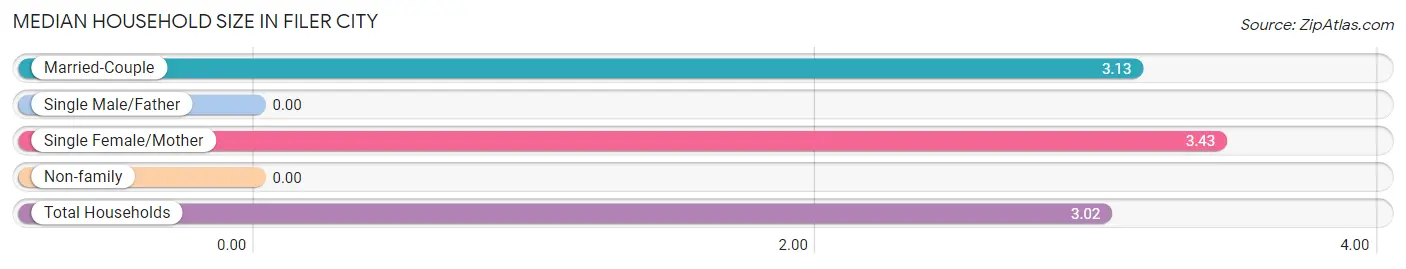
| Household Type | # Households | Household Size |
| Married-Couple | 38 (66.7%) | 3.13 |
| Single Male/Father | 0 (0.0%) | - |
| Single Female/Mother | 14 (24.6%) | 3.43 |
| Non-family | 5 (8.8%) | - |
| Total Households | 57 (100.0%) | 3.02 |
Household Size by Marriage Status in Filer City
Out of a total of 57 households in Filer City, 52 (91.2%) are family households, while 5 (8.8%) are nonfamily households. The most numerous type of family households are 2-person households, comprising 25, and the most common type of nonfamily households are 1-person households, comprising 5.
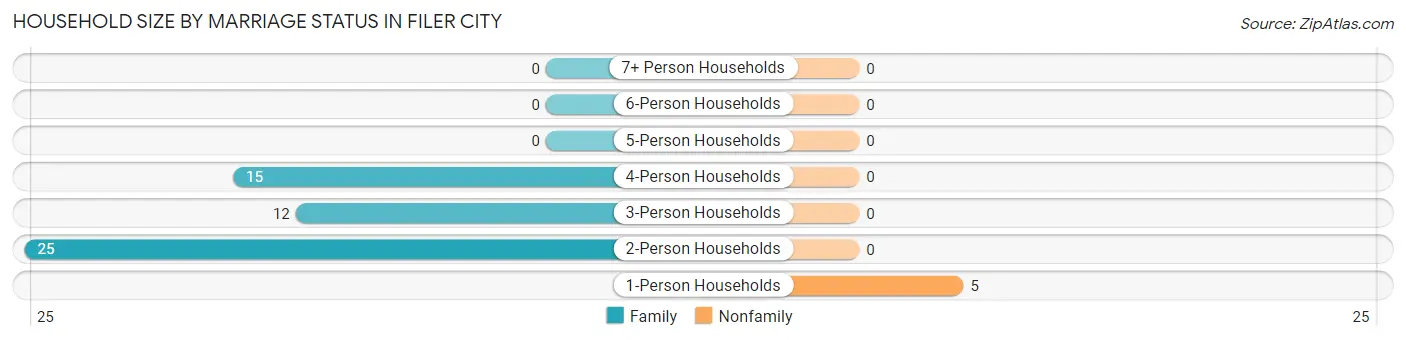
| Household Size | Family Households | Nonfamily Households |
| 1-Person Households | - | 5 (8.8%) |
| 2-Person Households | 25 (43.9%) | 0 (0.0%) |
| 3-Person Households | 12 (21.0%) | 0 (0.0%) |
| 4-Person Households | 15 (26.3%) | 0 (0.0%) |
| 5-Person Households | 0 (0.0%) | 0 (0.0%) |
| 6-Person Households | 0 (0.0%) | 0 (0.0%) |
| 7+ Person Households | 0 (0.0%) | 0 (0.0%) |
| Total | 52 (91.2%) | 5 (8.8%) |
Female Fertility in Filer City
Fertility by Age in Filer City
| Age Bracket | Women with Births | Births / 1,000 Women |
| 15 to 19 years | 0 (0.0%) | 0.0 |
| 20 to 34 years | 0 (0.0%) | 0.0 |
| 35 to 50 years | 0 (0.0%) | 0.0 |
| Total | 0 (0.0%) | 0.0 |
Fertility by Age by Marriage Status in Filer City
| Age Bracket | Married | Unmarried |
| 15 to 19 years | 0 (0.0%) | 0 (0.0%) |
| 20 to 34 years | 0 (0.0%) | 0 (0.0%) |
| 35 to 50 years | 0 (0.0%) | 0 (0.0%) |
| Total | 0 (0.0%) | 0 (0.0%) |
Fertility by Education in Filer City
| Educational Attainment | Women with Births | Births / 1,000 Women |
| Less than High School | 0 (0.0%) | 0.0 |
| High School Diploma | 0 (0.0%) | 0.0 |
| College or Associate's Degree | 0 (0.0%) | 0.0 |
| Bachelor's Degree | 0 (0.0%) | 0.0 |
| Graduate Degree | 0 (0.0%) | 0.0 |
| Total | 0 (0.0%) | 0.0 |
Fertility by Education by Marriage Status in Filer City
| Educational Attainment | Married | Unmarried |
| Less than High School | 0 (0.0%) | 0 (0.0%) |
| High School Diploma | 0 (0.0%) | 0 (0.0%) |
| College or Associate's Degree | 0 (0.0%) | 0 (0.0%) |
| Bachelor's Degree | 0 (0.0%) | 0 (0.0%) |
| Graduate Degree | 0 (0.0%) | 0 (0.0%) |
| Total | 0 (0.0%) | 0 (0.0%) |
Employment Characteristics in Filer City
Employment by Class of Employer in Filer City
Among the 109 employed individuals in Filer City, private company employees (91 | 83.5%), local government employees (13 | 11.9%), and not-for-profit organizations (5 | 4.6%) make up the most common classes of employment.
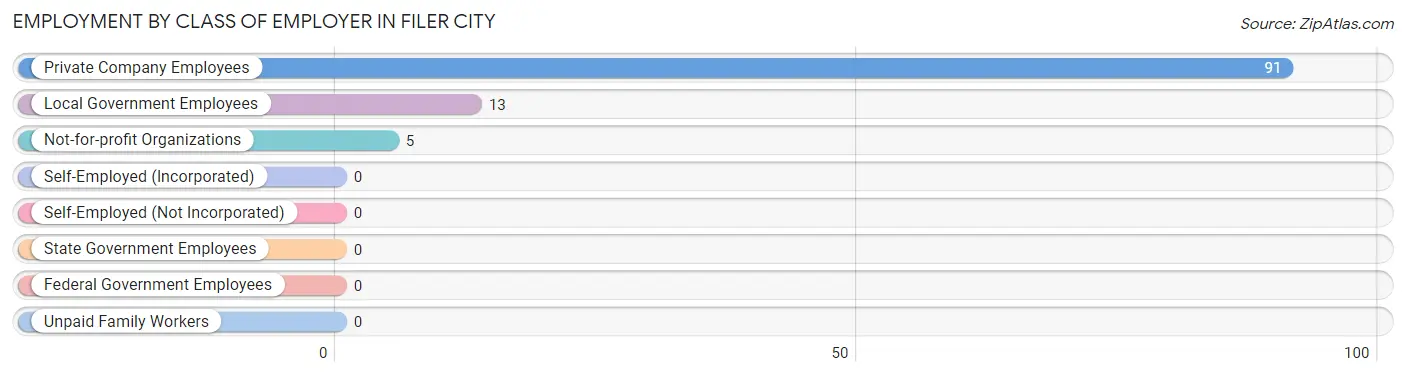
| Employer Class | # Employees | % Employees |
| Private Company Employees | 91 | 83.5% |
| Self-Employed (Incorporated) | 0 | 0.0% |
| Self-Employed (Not Incorporated) | 0 | 0.0% |
| Not-for-profit Organizations | 5 | 4.6% |
| Local Government Employees | 13 | 11.9% |
| State Government Employees | 0 | 0.0% |
| Federal Government Employees | 0 | 0.0% |
| Unpaid Family Workers | 0 | 0.0% |
| Total | 109 | 100.0% |
Employment Status by Age in Filer City
According to the labor force statistics for Filer City, out of the total population over 16 years of age (156), 75.0% or 117 individuals are in the labor force, with 6.8% or 8 of them unemployed. The age group with the highest labor force participation rate is 20 to 24 years, with 100.0% or 8 individuals in the labor force. Within the labor force, the 16 to 19 years age range has the highest percentage of unemployed individuals, with 100.0% or 8 of them being unemployed.
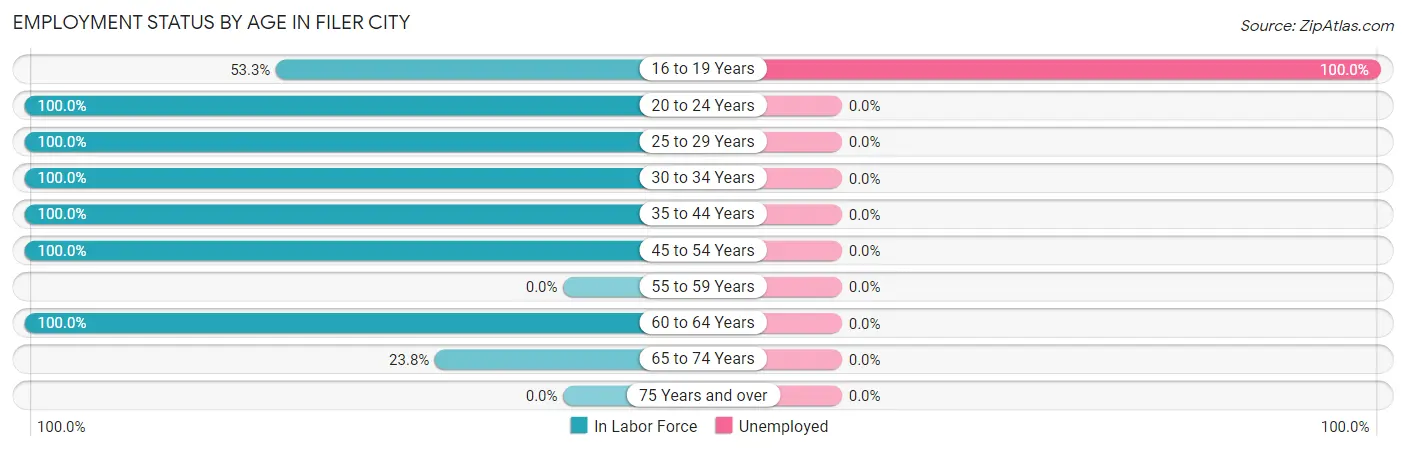
| Age Bracket | In Labor Force | Unemployed |
| 16 to 19 Years | 8 (53.3%) | 8 (100.0%) |
| 20 to 24 Years | 8 (100.0%) | 0 (0.0%) |
| 25 to 29 Years | 13 (100.0%) | 0 (0.0%) |
| 30 to 34 Years | 7 (100.0%) | 0 (0.0%) |
| 35 to 44 Years | 41 (100.0%) | 0 (0.0%) |
| 45 to 54 Years | 20 (100.0%) | 0 (0.0%) |
| 55 to 59 Years | 0 (0.0%) | 0 (0.0%) |
| 60 to 64 Years | 10 (100.0%) | 0 (0.0%) |
| 65 to 74 Years | 10 (23.8%) | 0 (0.0%) |
| 75 Years and over | 0 (0.0%) | 0 (0.0%) |
| Total | 117 (75.0%) | 8 (6.8%) |
Employment Status by Educational Attainment in Filer City
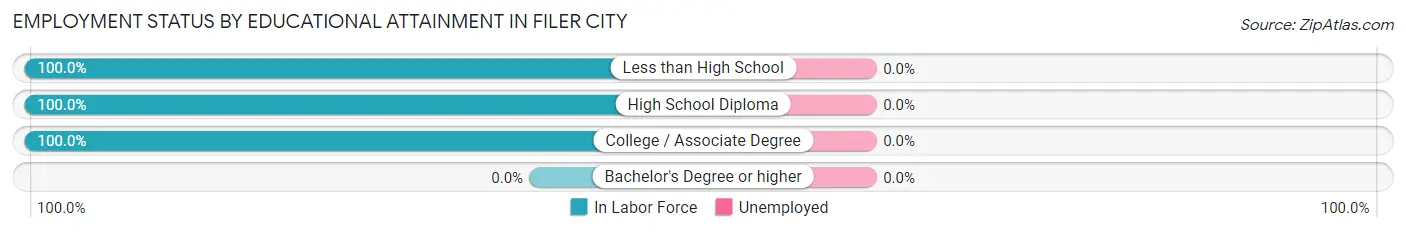
| Educational Attainment | In Labor Force | Unemployed |
| Less than High School | 7 (100.0%) | 0 (0.0%) |
| High School Diploma | 33 (100.0%) | 0 (0.0%) |
| College / Associate Degree | 51 (100.0%) | 0 (0.0%) |
| Bachelor's Degree or higher | 0 (0.0%) | 0 (0.0%) |
| Total | 91 (100.0%) | 0 (0.0%) |
Employment Occupations by Sex in Filer City
Management, Business, Science and Arts Occupations
The most common Management, Business, Science and Arts occupations in Filer City are , and Management (7 | 6.4%).
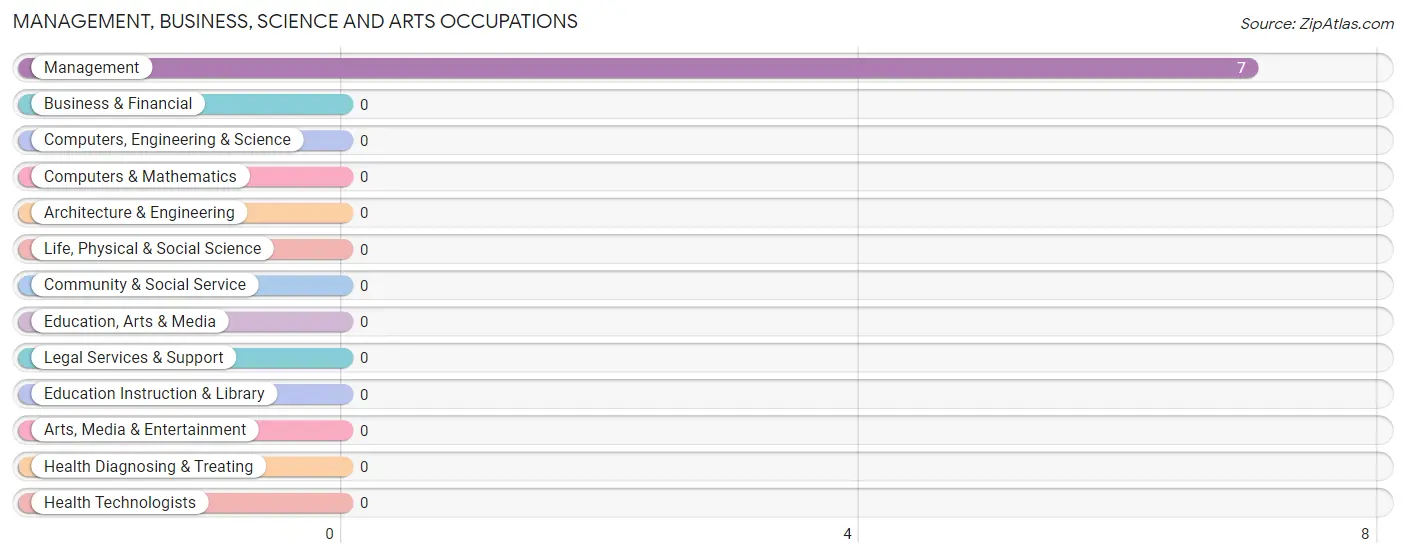
Management, Business, Science and Arts Occupations by Sex
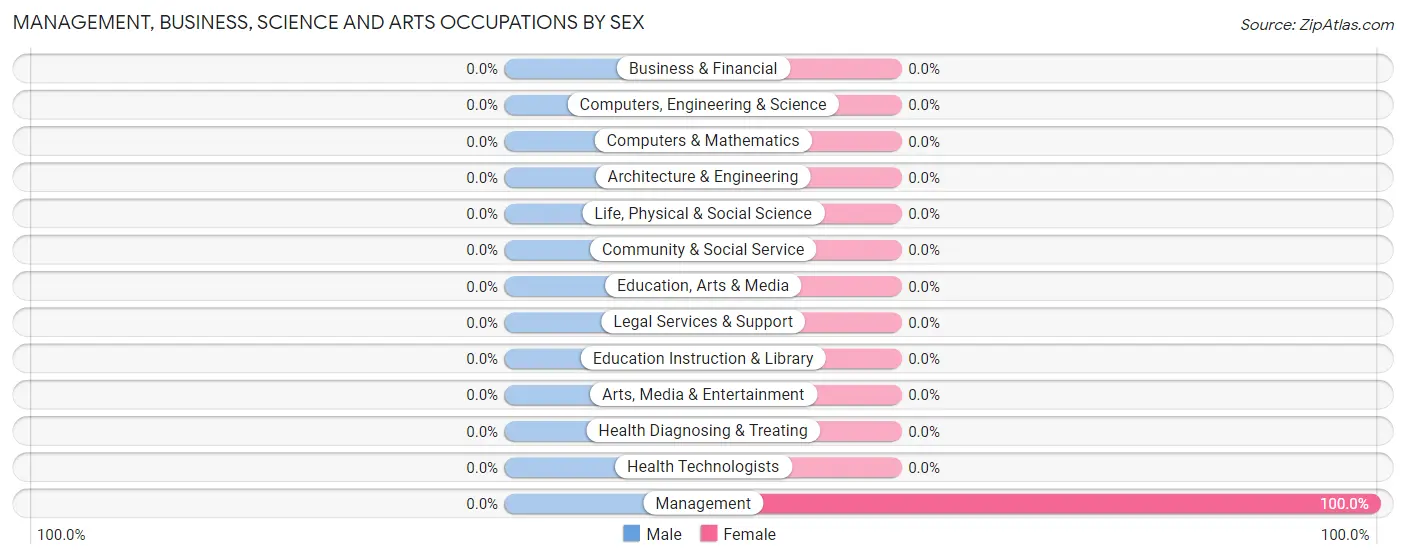
| Occupation | Male | Female |
| Management | 0 (0.0%) | 7 (100.0%) |
| Business & Financial | 0 (0.0%) | 0 (0.0%) |
| Computers, Engineering & Science | 0 (0.0%) | 0 (0.0%) |
| Computers & Mathematics | 0 (0.0%) | 0 (0.0%) |
| Architecture & Engineering | 0 (0.0%) | 0 (0.0%) |
| Life, Physical & Social Science | 0 (0.0%) | 0 (0.0%) |
| Community & Social Service | 0 (0.0%) | 0 (0.0%) |
| Education, Arts & Media | 0 (0.0%) | 0 (0.0%) |
| Legal Services & Support | 0 (0.0%) | 0 (0.0%) |
| Education Instruction & Library | 0 (0.0%) | 0 (0.0%) |
| Arts, Media & Entertainment | 0 (0.0%) | 0 (0.0%) |
| Health Diagnosing & Treating | 0 (0.0%) | 0 (0.0%) |
| Health Technologists | 0 (0.0%) | 0 (0.0%) |
| Total (Category) | 0 (0.0%) | 7 (100.0%) |
| Total (Overall) | 43 (39.5%) | 66 (60.6%) |
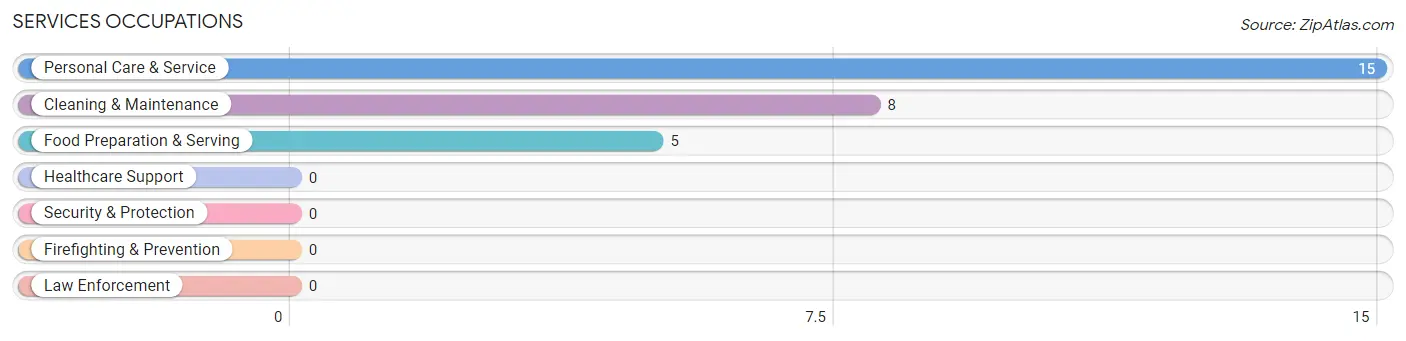
Services Occupations
The most common Services occupations in Filer City are Personal Care & Service (15 | 13.8%), Cleaning & Maintenance (8 | 7.3%), and Food Preparation & Serving (5 | 4.6%).
Services Occupations by Sex
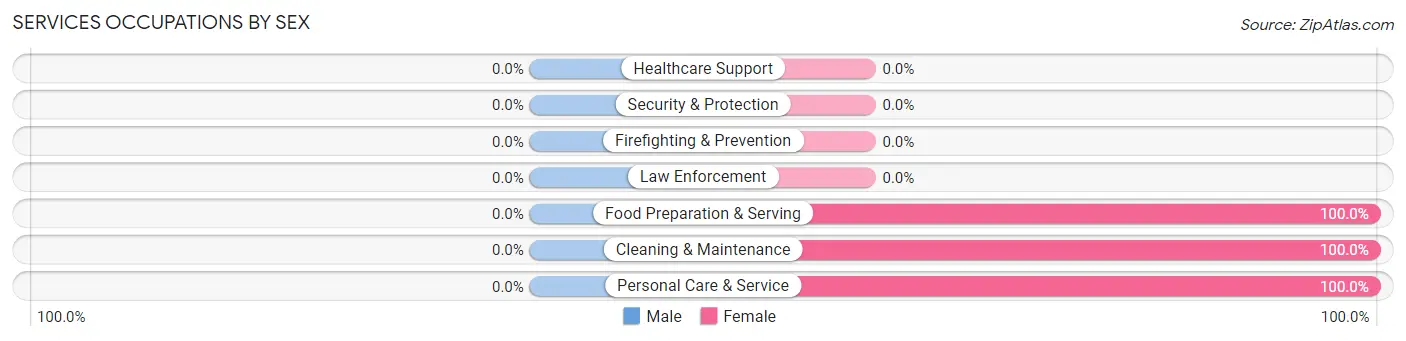
| Occupation | Male | Female |
| Healthcare Support | 0 (0.0%) | 0 (0.0%) |
| Security & Protection | 0 (0.0%) | 0 (0.0%) |
| Firefighting & Prevention | 0 (0.0%) | 0 (0.0%) |
| Law Enforcement | 0 (0.0%) | 0 (0.0%) |
| Food Preparation & Serving | 0 (0.0%) | 5 (100.0%) |
| Cleaning & Maintenance | 0 (0.0%) | 8 (100.0%) |
| Personal Care & Service | 0 (0.0%) | 15 (100.0%) |
| Total (Category) | 0 (0.0%) | 28 (100.0%) |
| Total (Overall) | 43 (39.5%) | 66 (60.6%) |
Sales and Office Occupations
The most common Sales and Office occupations in Filer City are Office & Administration (34 | 31.2%), and Sales & Related (5 | 4.6%).
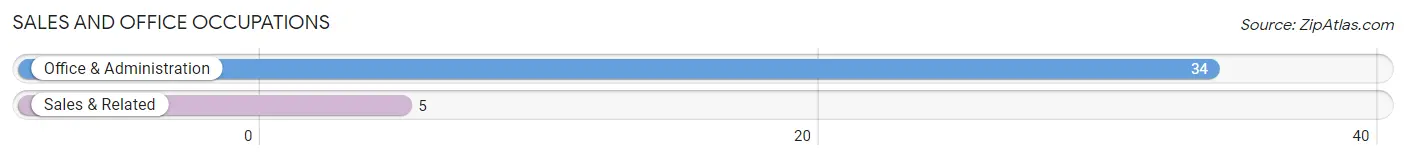
Sales and Office Occupations by Sex
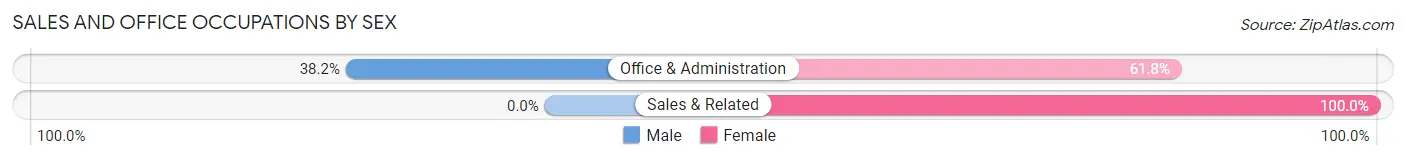
| Occupation | Male | Female |
| Sales & Related | 0 (0.0%) | 5 (100.0%) |
| Office & Administration | 13 (38.2%) | 21 (61.8%) |
| Total (Category) | 13 (33.3%) | 26 (66.7%) |
| Total (Overall) | 43 (39.5%) | 66 (60.6%) |
Natural Resources, Construction and Maintenance Occupations
The most common Natural Resources, Construction and Maintenance occupations in Filer City are Construction & Extraction (17 | 15.6%), and Installation, Maintenance & Repair (8 | 7.3%).
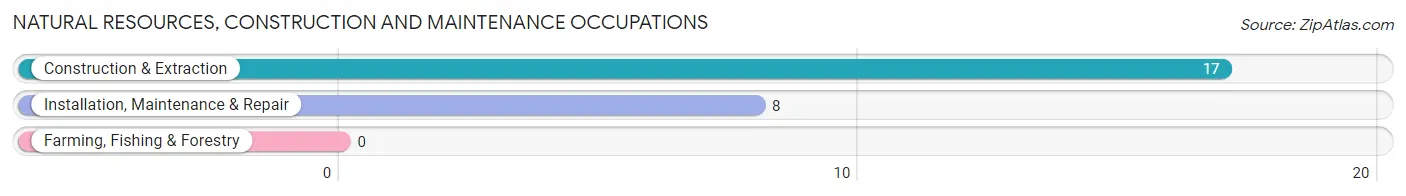
Natural Resources, Construction and Maintenance Occupations by Sex
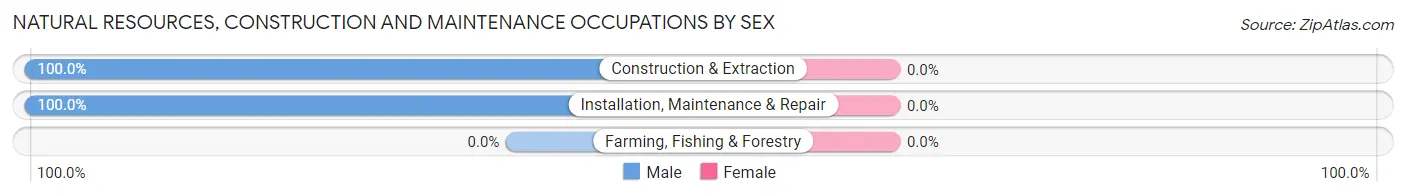
| Occupation | Male | Female |
| Farming, Fishing & Forestry | 0 (0.0%) | 0 (0.0%) |
| Construction & Extraction | 17 (100.0%) | 0 (0.0%) |
| Installation, Maintenance & Repair | 8 (100.0%) | 0 (0.0%) |
| Total (Category) | 25 (100.0%) | 0 (0.0%) |
| Total (Overall) | 43 (39.5%) | 66 (60.6%) |
Production, Transportation and Moving Occupations
The most common Production, Transportation and Moving occupations in Filer City are Transportation (5 | 4.6%), and Material Moving (5 | 4.6%).
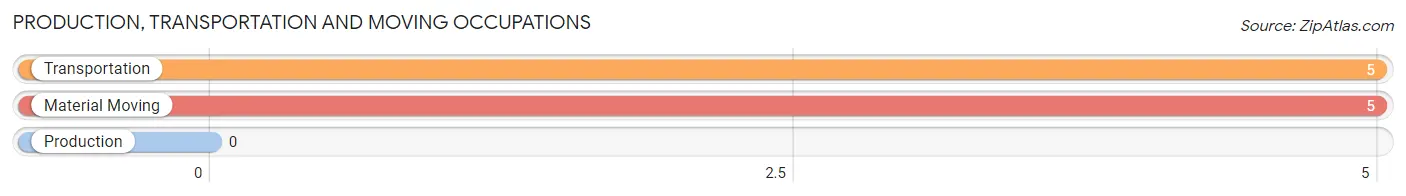
Production, Transportation and Moving Occupations by Sex
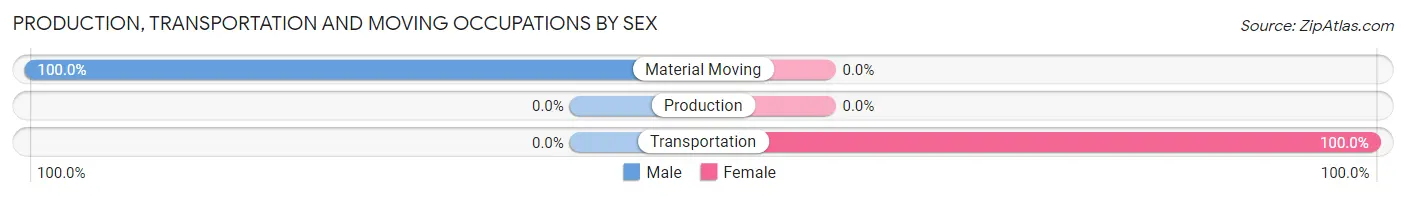
| Occupation | Male | Female |
| Production | 0 (0.0%) | 0 (0.0%) |
| Transportation | 0 (0.0%) | 5 (100.0%) |
| Material Moving | 5 (100.0%) | 0 (0.0%) |
| Total (Category) | 5 (50.0%) | 5 (50.0%) |
| Total (Overall) | 43 (39.5%) | 66 (60.6%) |
Employment Industries by Sex in Filer City
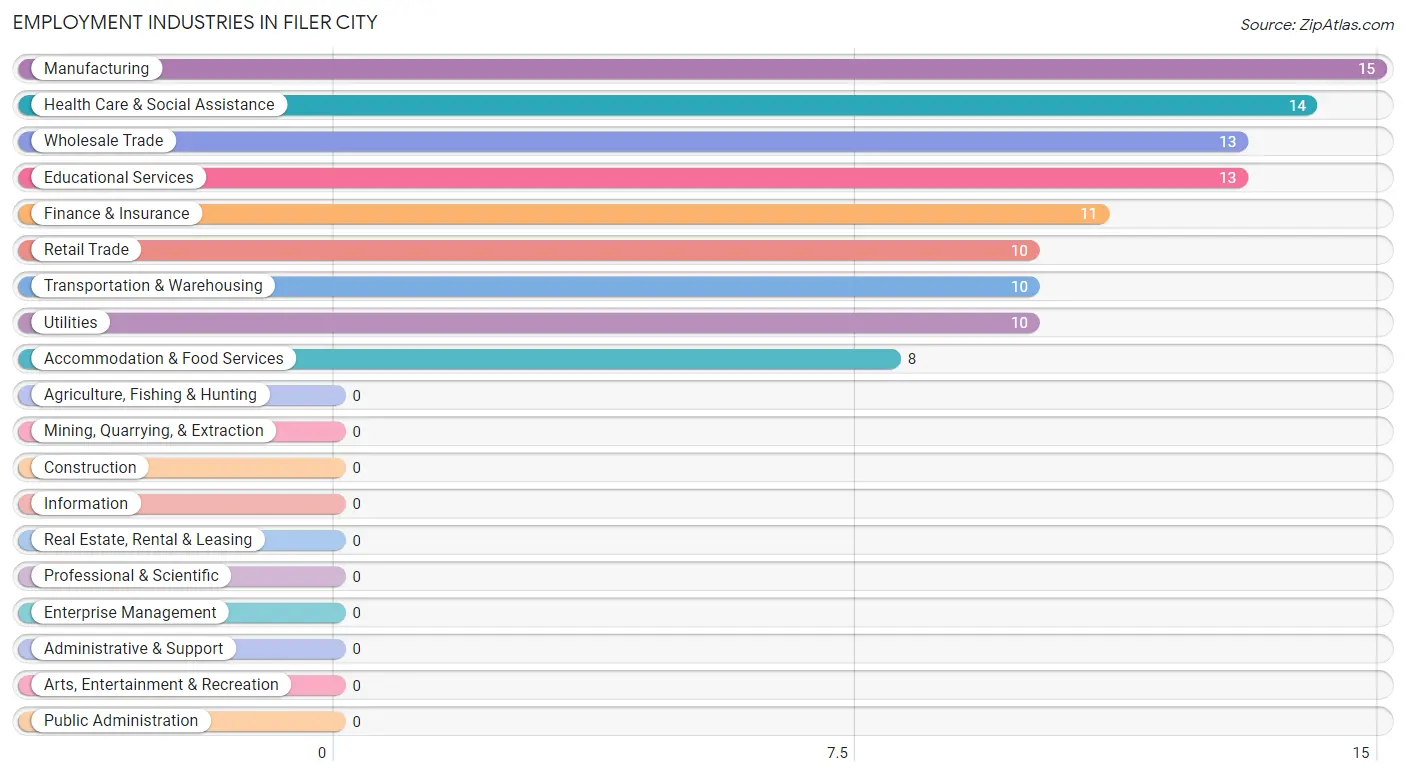
Employment Industries in Filer City
The major employment industries in Filer City include Manufacturing (15 | 13.8%), Health Care & Social Assistance (14 | 12.8%), Wholesale Trade (13 | 11.9%), Educational Services (13 | 11.9%), and Finance & Insurance (11 | 10.1%).
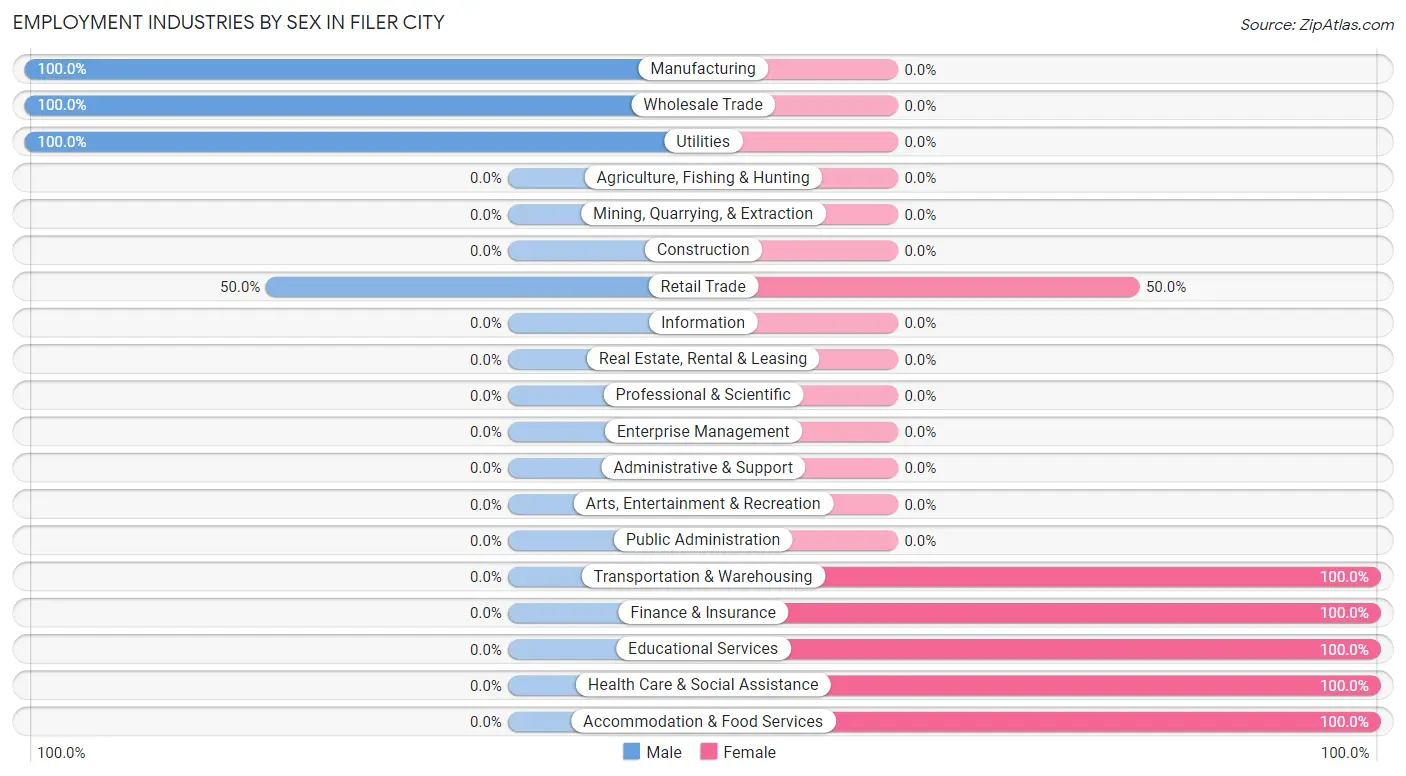
Employment Industries by Sex in Filer City
The Filer City industries that see more men than women are Manufacturing (100.0%), Wholesale Trade (100.0%), and Utilities (100.0%), whereas the industries that tend to have a higher number of women are Transportation & Warehousing (100.0%), Finance & Insurance (100.0%), and Educational Services (100.0%).
| Industry | Male | Female |
| Agriculture, Fishing & Hunting | 0 (0.0%) | 0 (0.0%) |
| Mining, Quarrying, & Extraction | 0 (0.0%) | 0 (0.0%) |
| Construction | 0 (0.0%) | 0 (0.0%) |
| Manufacturing | 15 (100.0%) | 0 (0.0%) |
| Wholesale Trade | 13 (100.0%) | 0 (0.0%) |
| Retail Trade | 5 (50.0%) | 5 (50.0%) |
| Transportation & Warehousing | 0 (0.0%) | 10 (100.0%) |
| Utilities | 10 (100.0%) | 0 (0.0%) |
| Information | 0 (0.0%) | 0 (0.0%) |
| Finance & Insurance | 0 (0.0%) | 11 (100.0%) |
| Real Estate, Rental & Leasing | 0 (0.0%) | 0 (0.0%) |
| Professional & Scientific | 0 (0.0%) | 0 (0.0%) |
| Enterprise Management | 0 (0.0%) | 0 (0.0%) |
| Administrative & Support | 0 (0.0%) | 0 (0.0%) |
| Educational Services | 0 (0.0%) | 13 (100.0%) |
| Health Care & Social Assistance | 0 (0.0%) | 14 (100.0%) |
| Arts, Entertainment & Recreation | 0 (0.0%) | 0 (0.0%) |
| Accommodation & Food Services | 0 (0.0%) | 8 (100.0%) |
| Public Administration | 0 (0.0%) | 0 (0.0%) |
| Total | 43 (39.5%) | 66 (60.6%) |
Education in Filer City
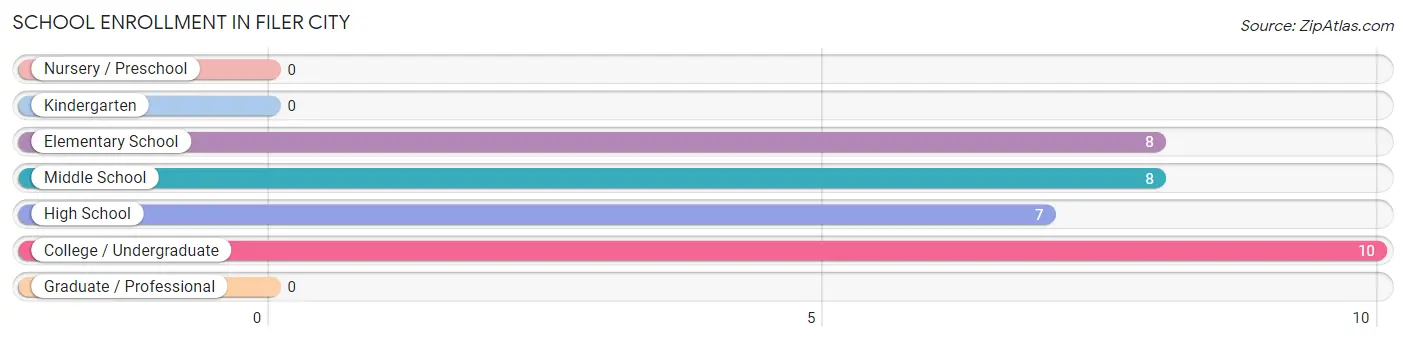
School Enrollment in Filer City
The most common levels of schooling among the 33 students in Filer City are college / undergraduate (10 | 30.3%), elementary school (8 | 24.2%), and middle school (8 | 24.2%).
| School Level | # Students | % Students |
| Nursery / Preschool | 0 | 0.0% |
| Kindergarten | 0 | 0.0% |
| Elementary School | 8 | 24.2% |
| Middle School | 8 | 24.2% |
| High School | 7 | 21.2% |
| College / Undergraduate | 10 | 30.3% |
| Graduate / Professional | 0 | 0.0% |
| Total | 33 | 100.0% |
School Enrollment by Age by Funding Source in Filer City
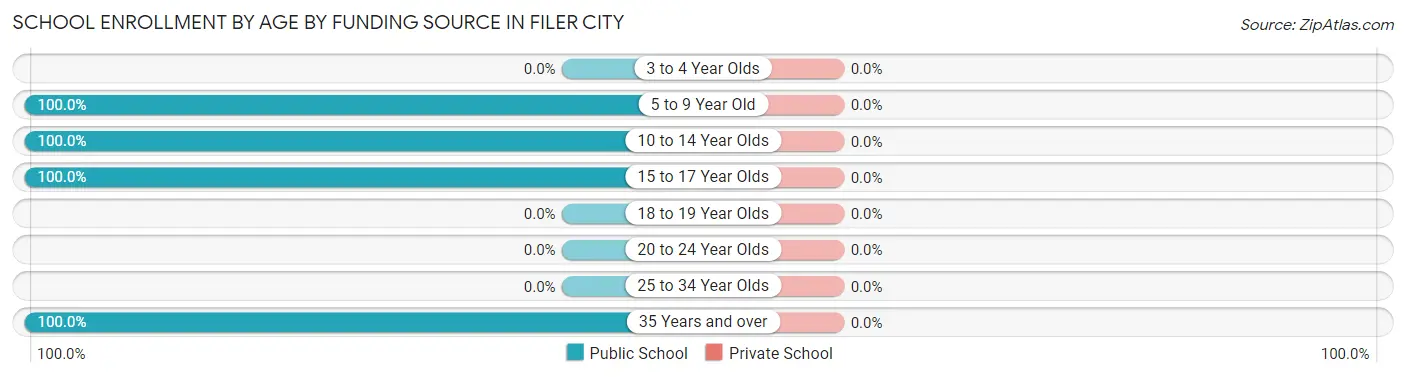
| Age Bracket | Public School | Private School |
| 3 to 4 Year Olds | 0 (0.0%) | 0 (0.0%) |
| 5 to 9 Year Old | 8 (100.0%) | 0 (0.0%) |
| 10 to 14 Year Olds | 8 (100.0%) | 0 (0.0%) |
| 15 to 17 Year Olds | 7 (100.0%) | 0 (0.0%) |
| 18 to 19 Year Olds | 0 (0.0%) | 0 (0.0%) |
| 20 to 24 Year Olds | 0 (0.0%) | 0 (0.0%) |
| 25 to 34 Year Olds | 0 (0.0%) | 0 (0.0%) |
| 35 Years and over | 10 (100.0%) | 0 (0.0%) |
| Total | 33 (100.0%) | 0 (0.0%) |
Educational Attainment by Field of Study in Filer City
, and education (6 | 100.0%) are the most common fields of study among 6 individuals in Filer City who have obtained a bachelor's degree or higher.
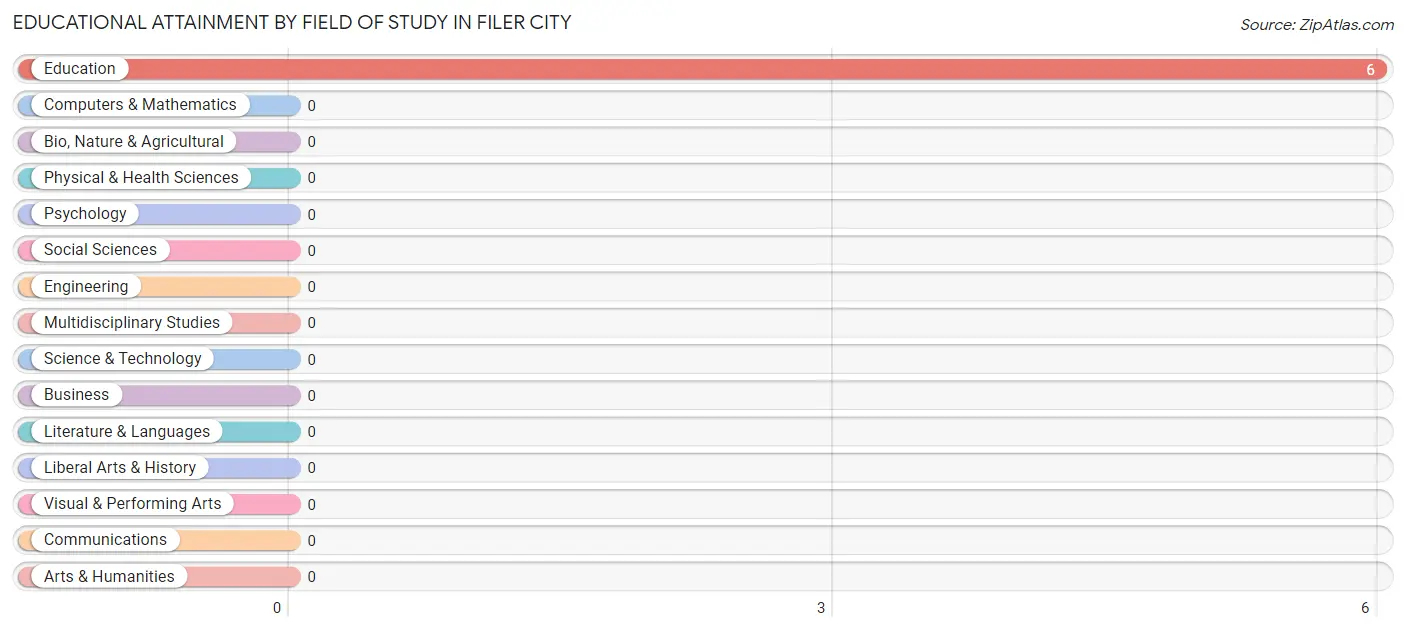
| Field of Study | # Graduates | % Graduates |
| Computers & Mathematics | 0 | 0.0% |
| Bio, Nature & Agricultural | 0 | 0.0% |
| Physical & Health Sciences | 0 | 0.0% |
| Psychology | 0 | 0.0% |
| Social Sciences | 0 | 0.0% |
| Engineering | 0 | 0.0% |
| Multidisciplinary Studies | 0 | 0.0% |
| Science & Technology | 0 | 0.0% |
| Business | 0 | 0.0% |
| Education | 6 | 100.0% |
| Literature & Languages | 0 | 0.0% |
| Liberal Arts & History | 0 | 0.0% |
| Visual & Performing Arts | 0 | 0.0% |
| Communications | 0 | 0.0% |
| Arts & Humanities | 0 | 0.0% |
| Total | 6 | 100.0% |
Transportation & Commute in Filer City
Vehicle Availability by Sex in Filer City
The most prevalent vehicle ownership categories in Filer City are males with 2 vehicles (22, accounting for 51.2%) and females with 2 vehicles (27, making up 33.3%).
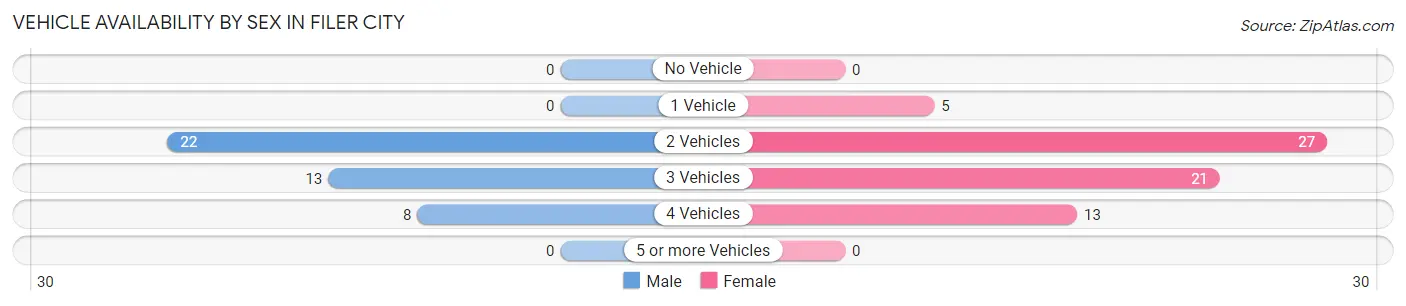
| Vehicles Available | Male | Female |
| No Vehicle | 0 (0.0%) | 0 (0.0%) |
| 1 Vehicle | 0 (0.0%) | 5 (7.6%) |
| 2 Vehicles | 22 (51.2%) | 27 (40.9%) |
| 3 Vehicles | 13 (30.2%) | 21 (31.8%) |
| 4 Vehicles | 8 (18.6%) | 13 (19.7%) |
| 5 or more Vehicles | 0 (0.0%) | 0 (0.0%) |
| Total | 43 (100.0%) | 66 (100.0%) |
Commute Time in Filer City
The most frequently occuring commute durations in Filer City are 10 to 14 minutes (28 commuters, 25.7%), 15 to 19 minutes (28 commuters, 25.7%), and 5 to 9 minutes (23 commuters, 21.1%).
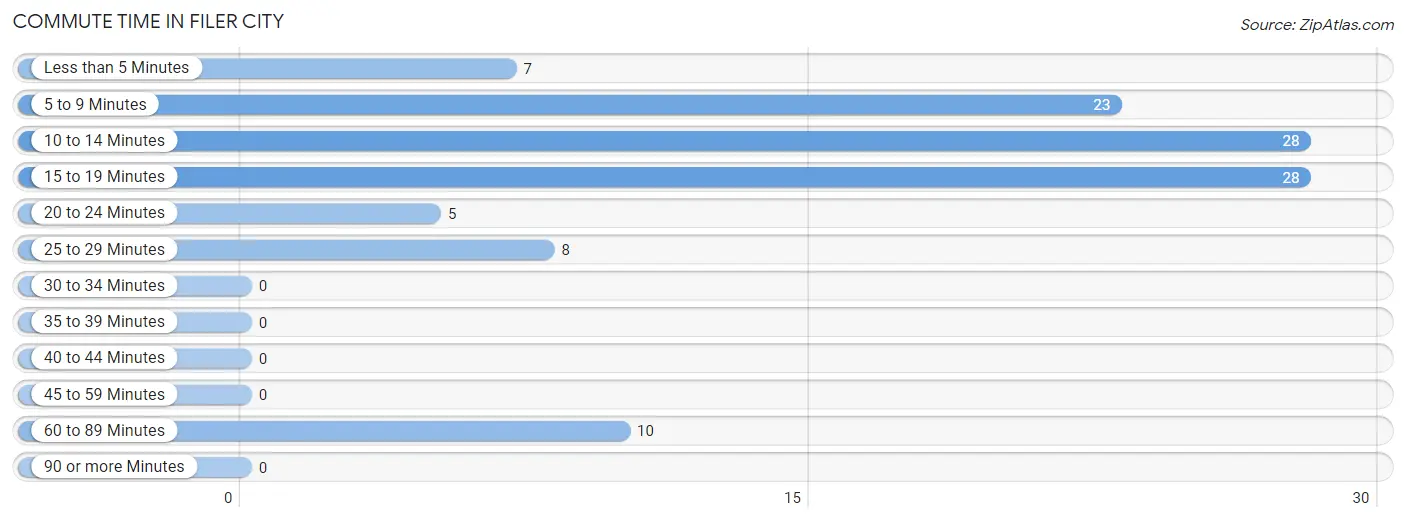
| Commute Time | # Commuters | % Commuters |
| Less than 5 Minutes | 7 | 6.4% |
| 5 to 9 Minutes | 23 | 21.1% |
| 10 to 14 Minutes | 28 | 25.7% |
| 15 to 19 Minutes | 28 | 25.7% |
| 20 to 24 Minutes | 5 | 4.6% |
| 25 to 29 Minutes | 8 | 7.3% |
| 30 to 34 Minutes | 0 | 0.0% |
| 35 to 39 Minutes | 0 | 0.0% |
| 40 to 44 Minutes | 0 | 0.0% |
| 45 to 59 Minutes | 0 | 0.0% |
| 60 to 89 Minutes | 10 | 9.2% |
| 90 or more Minutes | 0 | 0.0% |
Commute Time by Sex in Filer City
The most common commute times in Filer City are 10 to 14 minutes (13 commuters, 30.2%) for males and 5 to 9 minutes (23 commuters, 34.8%) for females.
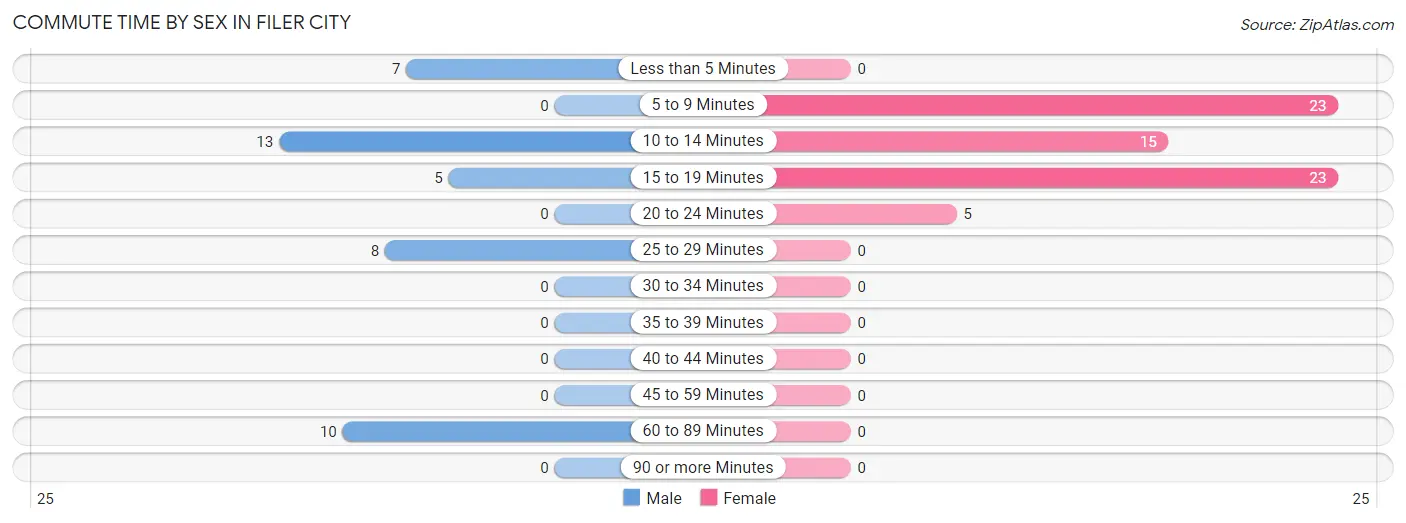
| Commute Time | Male | Female |
| Less than 5 Minutes | 7 (16.3%) | 0 (0.0%) |
| 5 to 9 Minutes | 0 (0.0%) | 23 (34.8%) |
| 10 to 14 Minutes | 13 (30.2%) | 15 (22.7%) |
| 15 to 19 Minutes | 5 (11.6%) | 23 (34.8%) |
| 20 to 24 Minutes | 0 (0.0%) | 5 (7.6%) |
| 25 to 29 Minutes | 8 (18.6%) | 0 (0.0%) |
| 30 to 34 Minutes | 0 (0.0%) | 0 (0.0%) |
| 35 to 39 Minutes | 0 (0.0%) | 0 (0.0%) |
| 40 to 44 Minutes | 0 (0.0%) | 0 (0.0%) |
| 45 to 59 Minutes | 0 (0.0%) | 0 (0.0%) |
| 60 to 89 Minutes | 10 (23.3%) | 0 (0.0%) |
| 90 or more Minutes | 0 (0.0%) | 0 (0.0%) |
Time of Departure to Work by Sex in Filer City
The most frequent times of departure to work in Filer City are 7:30 AM to 7:59 AM (21, 48.8%) for males and 7:30 AM to 7:59 AM (18, 27.3%) for females.
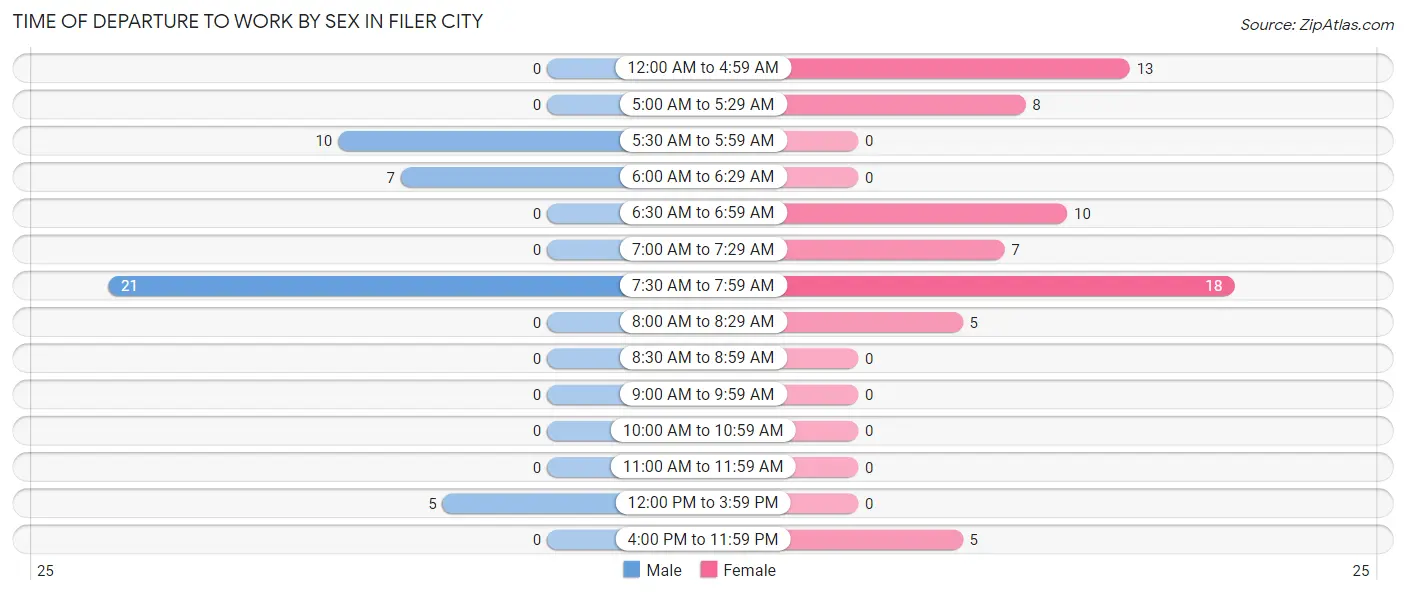
| Time of Departure | Male | Female |
| 12:00 AM to 4:59 AM | 0 (0.0%) | 13 (19.7%) |
| 5:00 AM to 5:29 AM | 0 (0.0%) | 8 (12.1%) |
| 5:30 AM to 5:59 AM | 10 (23.3%) | 0 (0.0%) |
| 6:00 AM to 6:29 AM | 7 (16.3%) | 0 (0.0%) |
| 6:30 AM to 6:59 AM | 0 (0.0%) | 10 (15.1%) |
| 7:00 AM to 7:29 AM | 0 (0.0%) | 7 (10.6%) |
| 7:30 AM to 7:59 AM | 21 (48.8%) | 18 (27.3%) |
| 8:00 AM to 8:29 AM | 0 (0.0%) | 5 (7.6%) |
| 8:30 AM to 8:59 AM | 0 (0.0%) | 0 (0.0%) |
| 9:00 AM to 9:59 AM | 0 (0.0%) | 0 (0.0%) |
| 10:00 AM to 10:59 AM | 0 (0.0%) | 0 (0.0%) |
| 11:00 AM to 11:59 AM | 0 (0.0%) | 0 (0.0%) |
| 12:00 PM to 3:59 PM | 5 (11.6%) | 0 (0.0%) |
| 4:00 PM to 11:59 PM | 0 (0.0%) | 5 (7.6%) |
| Total | 43 (100.0%) | 66 (100.0%) |
Housing Occupancy in Filer City
Occupancy by Ownership in Filer City
Of the total 57 dwellings in Filer City, owner-occupied units account for 57 (100.0%), while renter-occupied units make up 0 (0.0%).
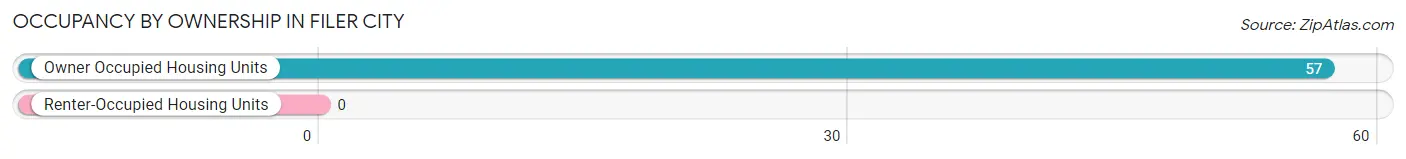
| Occupancy | # Housing Units | % Housing Units |
| Owner Occupied Housing Units | 57 | 100.0% |
| Renter-Occupied Housing Units | 0 | 0.0% |
| Total Occupied Housing Units | 57 | 100.0% |
Occupancy by Household Size in Filer City
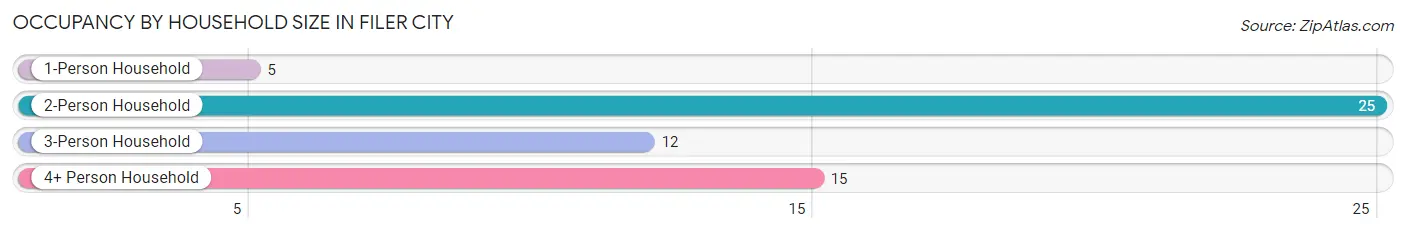
| Household Size | # Housing Units | % Housing Units |
| 1-Person Household | 5 | 8.8% |
| 2-Person Household | 25 | 43.9% |
| 3-Person Household | 12 | 21.0% |
| 4+ Person Household | 15 | 26.3% |
| Total Housing Units | 57 | 100.0% |
Occupancy by Ownership by Household Size in Filer City
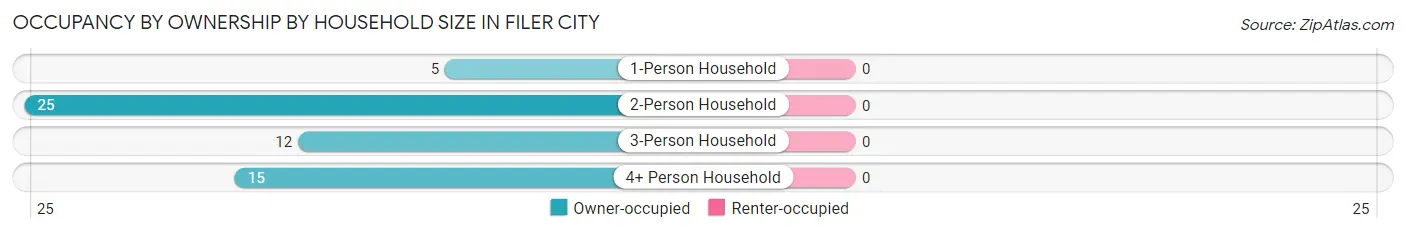
| Household Size | Owner-occupied | Renter-occupied |
| 1-Person Household | 5 (100.0%) | 0 (0.0%) |
| 2-Person Household | 25 (100.0%) | 0 (0.0%) |
| 3-Person Household | 12 (100.0%) | 0 (0.0%) |
| 4+ Person Household | 15 (100.0%) | 0 (0.0%) |
| Total Housing Units | 57 (100.0%) | 0 (0.0%) |
Occupancy by Educational Attainment in Filer City
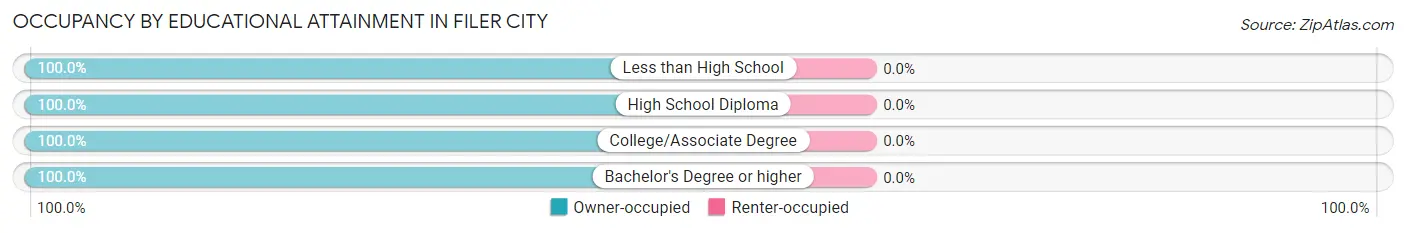
| Household Size | Owner-occupied | Renter-occupied |
| Less than High School | 7 (100.0%) | 0 (0.0%) |
| High School Diploma | 24 (100.0%) | 0 (0.0%) |
| College/Associate Degree | 20 (100.0%) | 0 (0.0%) |
| Bachelor's Degree or higher | 6 (100.0%) | 0 (0.0%) |
Occupancy by Age of Householder in Filer City
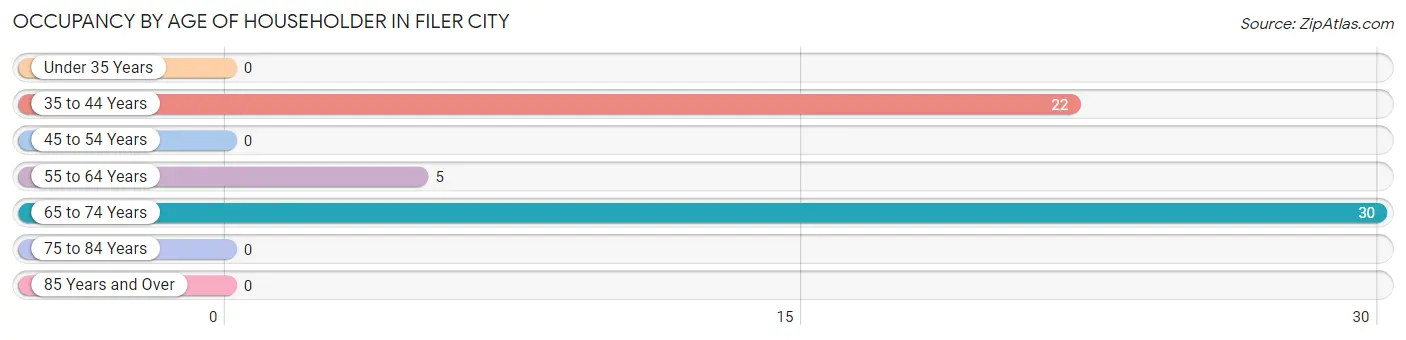
| Age Bracket | # Households | % Households |
| Under 35 Years | 0 | 0.0% |
| 35 to 44 Years | 22 | 38.6% |
| 45 to 54 Years | 0 | 0.0% |
| 55 to 64 Years | 5 | 8.8% |
| 65 to 74 Years | 30 | 52.6% |
| 75 to 84 Years | 0 | 0.0% |
| 85 Years and Over | 0 | 0.0% |
| Total | 57 | 100.0% |
Housing Finances in Filer City
Median Income by Occupancy in Filer City
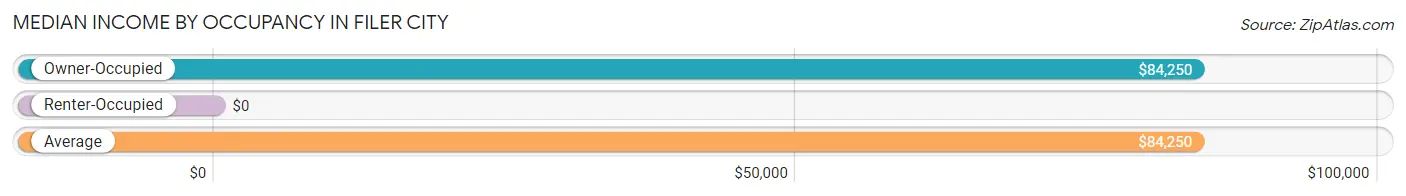
| Occupancy Type | # Households | Median Income |
| Owner-Occupied | 57 (100.0%) | $84,250 |
| Renter-Occupied | 0 (0.0%) | $0 |
| Average | 57 (100.0%) | $84,250 |
Occupancy by Householder Income Bracket in Filer City
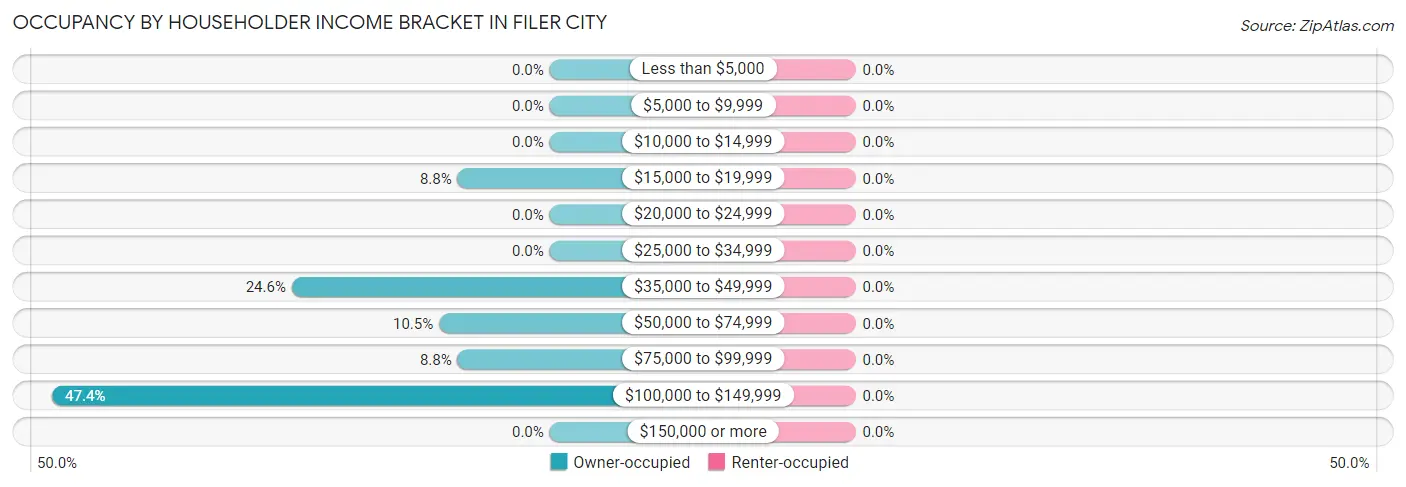
| Income Bracket | Owner-occupied | Renter-occupied |
| Less than $5,000 | 0 (0.0%) | 0 (0.0%) |
| $5,000 to $9,999 | 0 (0.0%) | 0 (0.0%) |
| $10,000 to $14,999 | 0 (0.0%) | 0 (0.0%) |
| $15,000 to $19,999 | 5 (8.8%) | 0 (0.0%) |
| $20,000 to $24,999 | 0 (0.0%) | 0 (0.0%) |
| $25,000 to $34,999 | 0 (0.0%) | 0 (0.0%) |
| $35,000 to $49,999 | 14 (24.6%) | 0 (0.0%) |
| $50,000 to $74,999 | 6 (10.5%) | 0 (0.0%) |
| $75,000 to $99,999 | 5 (8.8%) | 0 (0.0%) |
| $100,000 to $149,999 | 27 (47.4%) | 0 (0.0%) |
| $150,000 or more | 0 (0.0%) | 0 (0.0%) |
| Total | 57 (100.0%) | 0 (0.0%) |
Monthly Housing Cost Tiers in Filer City
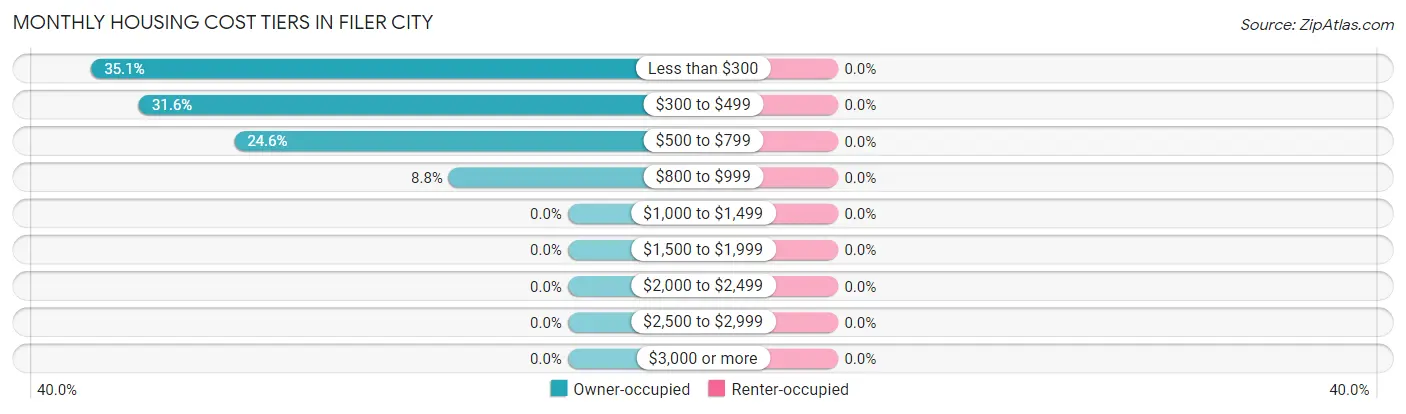
| Monthly Cost | Owner-occupied | Renter-occupied |
| Less than $300 | 20 (35.1%) | 0 (0.0%) |
| $300 to $499 | 18 (31.6%) | 0 (0.0%) |
| $500 to $799 | 14 (24.6%) | 0 (0.0%) |
| $800 to $999 | 5 (8.8%) | 0 (0.0%) |
| $1,000 to $1,499 | 0 (0.0%) | 0 (0.0%) |
| $1,500 to $1,999 | 0 (0.0%) | 0 (0.0%) |
| $2,000 to $2,499 | 0 (0.0%) | 0 (0.0%) |
| $2,500 to $2,999 | 0 (0.0%) | 0 (0.0%) |
| $3,000 or more | 0 (0.0%) | 0 (0.0%) |
| Total | 57 (100.0%) | 0 (0.0%) |
Physical Housing Characteristics in Filer City
Housing Structures in Filer City
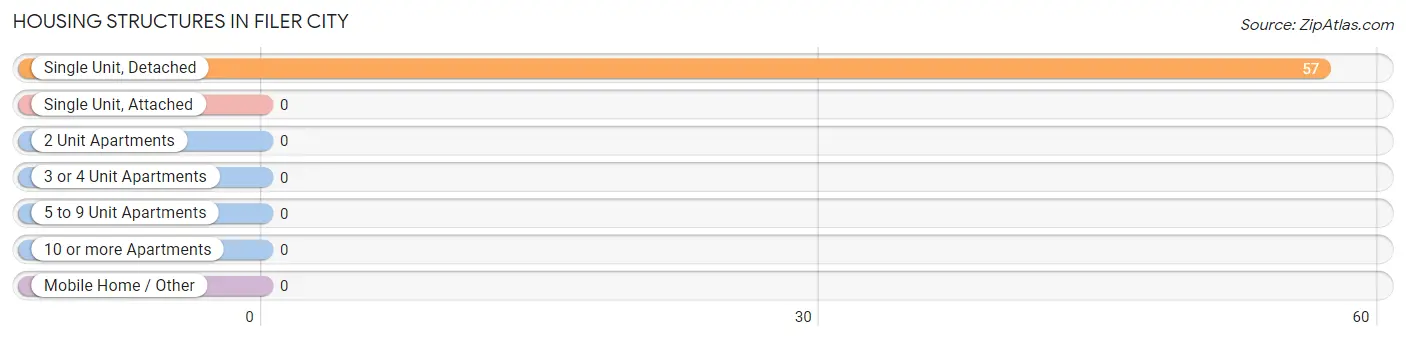
| Structure Type | # Housing Units | % Housing Units |
| Single Unit, Detached | 57 | 100.0% |
| Single Unit, Attached | 0 | 0.0% |
| 2 Unit Apartments | 0 | 0.0% |
| 3 or 4 Unit Apartments | 0 | 0.0% |
| 5 to 9 Unit Apartments | 0 | 0.0% |
| 10 or more Apartments | 0 | 0.0% |
| Mobile Home / Other | 0 | 0.0% |
| Total | 57 | 100.0% |
Housing Structures by Occupancy in Filer City
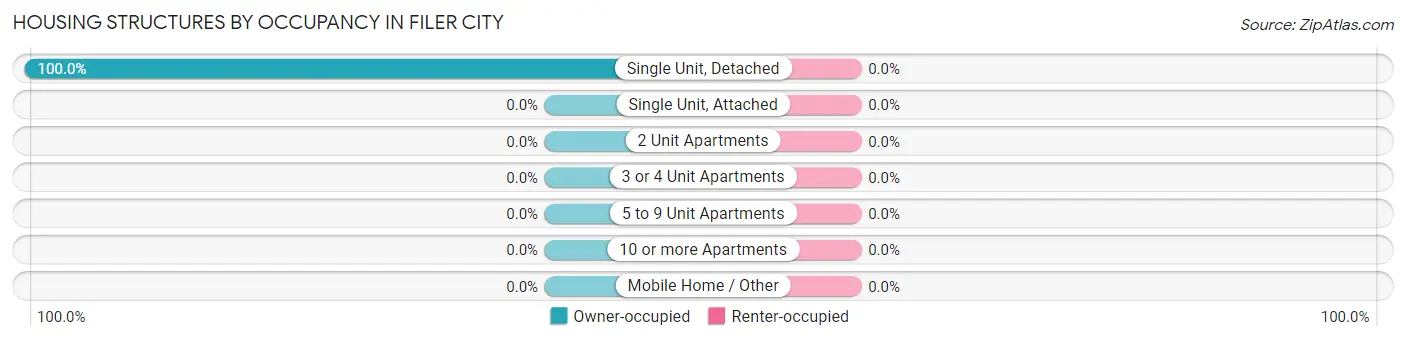
| Structure Type | Owner-occupied | Renter-occupied |
| Single Unit, Detached | 57 (100.0%) | 0 (0.0%) |
| Single Unit, Attached | 0 (0.0%) | 0 (0.0%) |
| 2 Unit Apartments | 0 (0.0%) | 0 (0.0%) |
| 3 or 4 Unit Apartments | 0 (0.0%) | 0 (0.0%) |
| 5 to 9 Unit Apartments | 0 (0.0%) | 0 (0.0%) |
| 10 or more Apartments | 0 (0.0%) | 0 (0.0%) |
| Mobile Home / Other | 0 (0.0%) | 0 (0.0%) |
| Total | 57 (100.0%) | 0 (0.0%) |
Housing Structures by Number of Rooms in Filer City
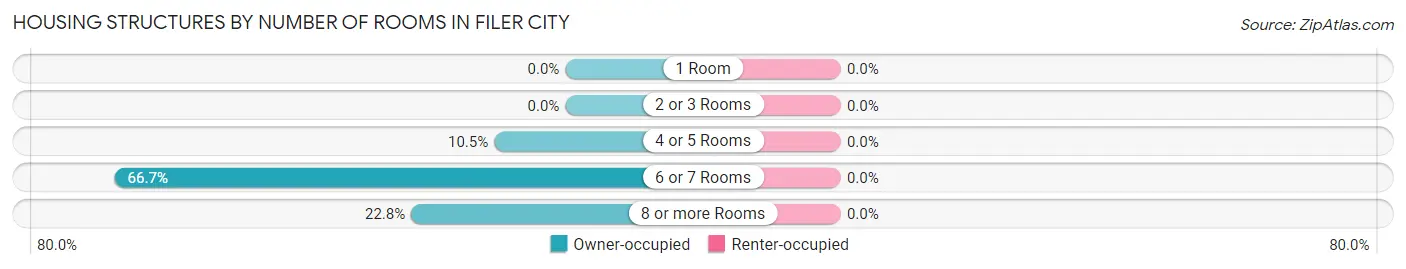
| Number of Rooms | Owner-occupied | Renter-occupied |
| 1 Room | 0 (0.0%) | 0 (0.0%) |
| 2 or 3 Rooms | 0 (0.0%) | 0 (0.0%) |
| 4 or 5 Rooms | 6 (10.5%) | 0 (0.0%) |
| 6 or 7 Rooms | 38 (66.7%) | 0 (0.0%) |
| 8 or more Rooms | 13 (22.8%) | 0 (0.0%) |
| Total | 57 (100.0%) | 0 (0.0%) |
Housing Structure by Heating Type in Filer City
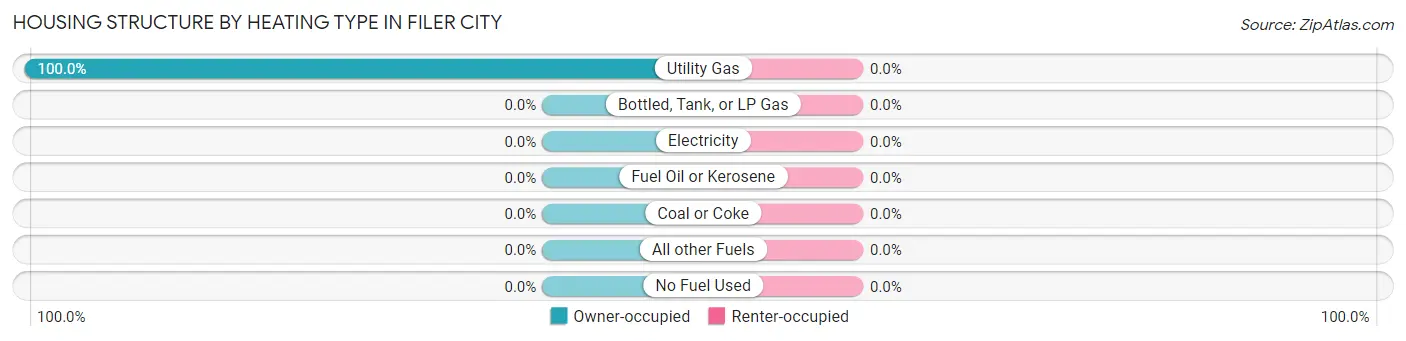
| Heating Type | Owner-occupied | Renter-occupied |
| Utility Gas | 57 (100.0%) | 0 (0.0%) |
| Bottled, Tank, or LP Gas | 0 (0.0%) | 0 (0.0%) |
| Electricity | 0 (0.0%) | 0 (0.0%) |
| Fuel Oil or Kerosene | 0 (0.0%) | 0 (0.0%) |
| Coal or Coke | 0 (0.0%) | 0 (0.0%) |
| All other Fuels | 0 (0.0%) | 0 (0.0%) |
| No Fuel Used | 0 (0.0%) | 0 (0.0%) |
| Total | 57 (100.0%) | 0 (0.0%) |
Household Vehicle Usage in Filer City
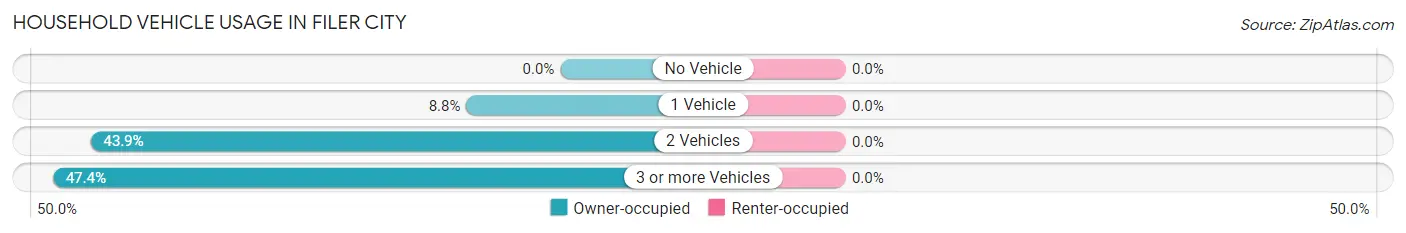
| Vehicles per Household | Owner-occupied | Renter-occupied |
| No Vehicle | 0 (0.0%) | 0 (0.0%) |
| 1 Vehicle | 5 (8.8%) | 0 (0.0%) |
| 2 Vehicles | 25 (43.9%) | 0 (0.0%) |
| 3 or more Vehicles | 27 (47.4%) | 0 (0.0%) |
| Total | 57 (100.0%) | 0 (0.0%) |
Real Estate & Mortgages in Filer City
Real Estate and Mortgage Overview in Filer City
| Characteristic | Without Mortgage | With Mortgage |
| Housing Units | 45 | 12 |
| Median Property Value | $82,700 | $0 |
| Median Household Income | - | - |
| Monthly Housing Costs | $325 | $0 |
| Real Estate Taxes | $711 | $5 |
Property Value by Mortgage Status in Filer City
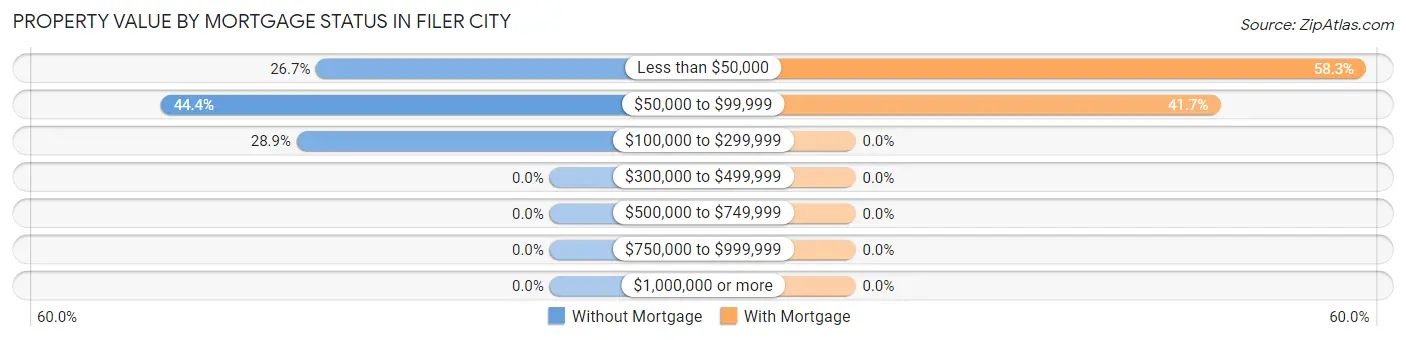
| Property Value | Without Mortgage | With Mortgage |
| Less than $50,000 | 12 (26.7%) | 7 (58.3%) |
| $50,000 to $99,999 | 20 (44.4%) | 5 (41.7%) |
| $100,000 to $299,999 | 13 (28.9%) | 0 (0.0%) |
| $300,000 to $499,999 | 0 (0.0%) | 0 (0.0%) |
| $500,000 to $749,999 | 0 (0.0%) | 0 (0.0%) |
| $750,000 to $999,999 | 0 (0.0%) | 0 (0.0%) |
| $1,000,000 or more | 0 (0.0%) | 0 (0.0%) |
| Total | 45 (100.0%) | 12 (100.0%) |
Household Income by Mortgage Status in Filer City
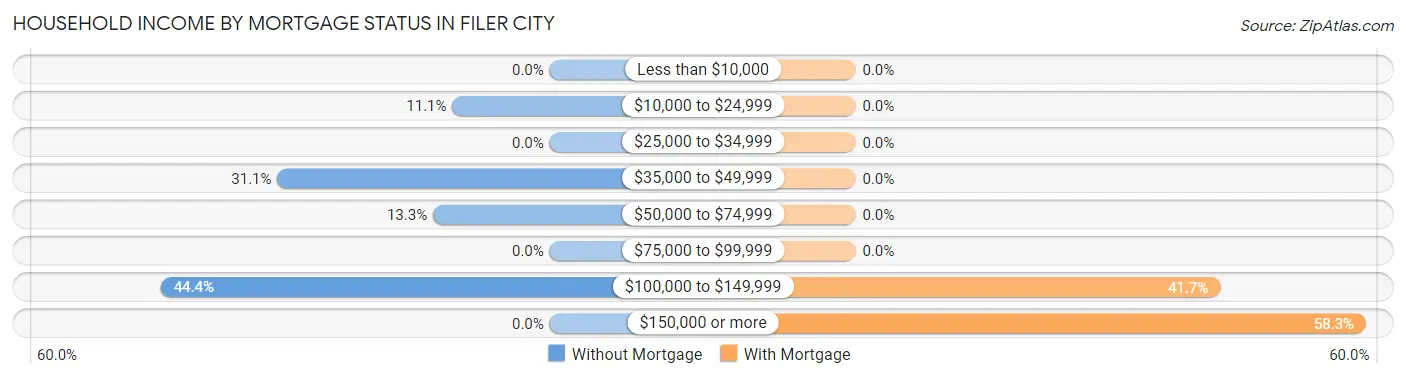
| Household Income | Without Mortgage | With Mortgage |
| Less than $10,000 | 0 (0.0%) | 0 (0.0%) |
| $10,000 to $24,999 | 5 (11.1%) | 0 (0.0%) |
| $25,000 to $34,999 | 0 (0.0%) | 0 (0.0%) |
| $35,000 to $49,999 | 14 (31.1%) | 0 (0.0%) |
| $50,000 to $74,999 | 6 (13.3%) | 0 (0.0%) |
| $75,000 to $99,999 | 0 (0.0%) | 0 (0.0%) |
| $100,000 to $149,999 | 20 (44.4%) | 5 (41.7%) |
| $150,000 or more | 0 (0.0%) | 7 (58.3%) |
| Total | 45 (100.0%) | 12 (100.0%) |
Property Value to Household Income Ratio in Filer City
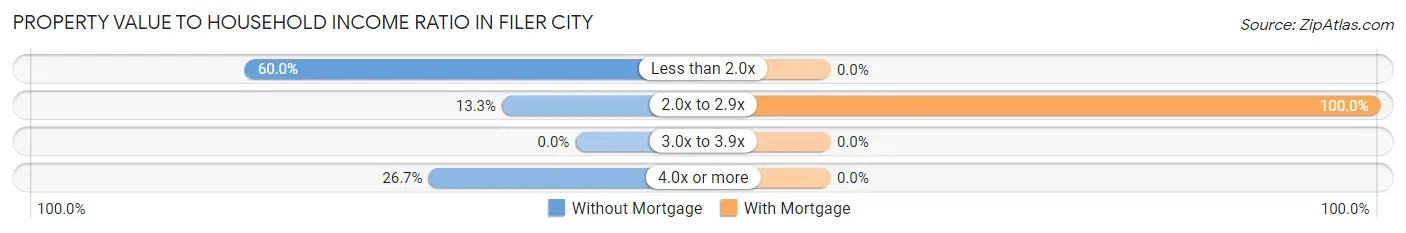
| Value-to-Income Ratio | Without Mortgage | With Mortgage |
| Less than 2.0x | 27 (60.0%) | 0 (0.0%) |
| 2.0x to 2.9x | 6 (13.3%) | 12 (100.0%) |
| 3.0x to 3.9x | 0 (0.0%) | 0 (0.0%) |
| 4.0x or more | 12 (26.7%) | 0 (0.0%) |
| Total | 45 (100.0%) | 12 (100.0%) |
Real Estate Taxes by Mortgage Status in Filer City
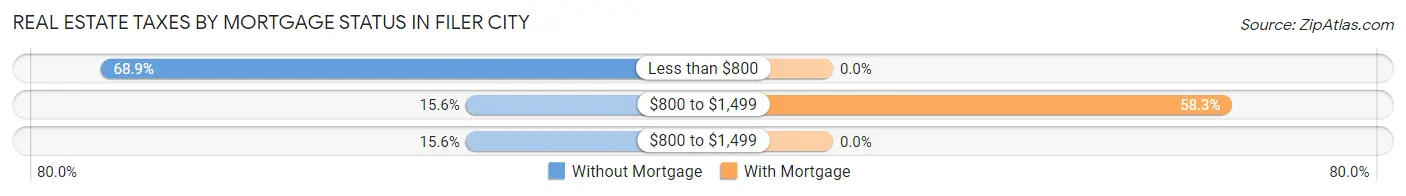
| Property Taxes | Without Mortgage | With Mortgage |
| Less than $800 | 31 (68.9%) | 0 (0.0%) |
| $800 to $1,499 | 7 (15.6%) | 7 (58.3%) |
| $800 to $1,499 | 7 (15.6%) | 0 (0.0%) |
| Total | 45 (100.0%) | 12 (100.0%) |
Health & Disability in Filer City
Health Insurance Coverage by Age in Filer City
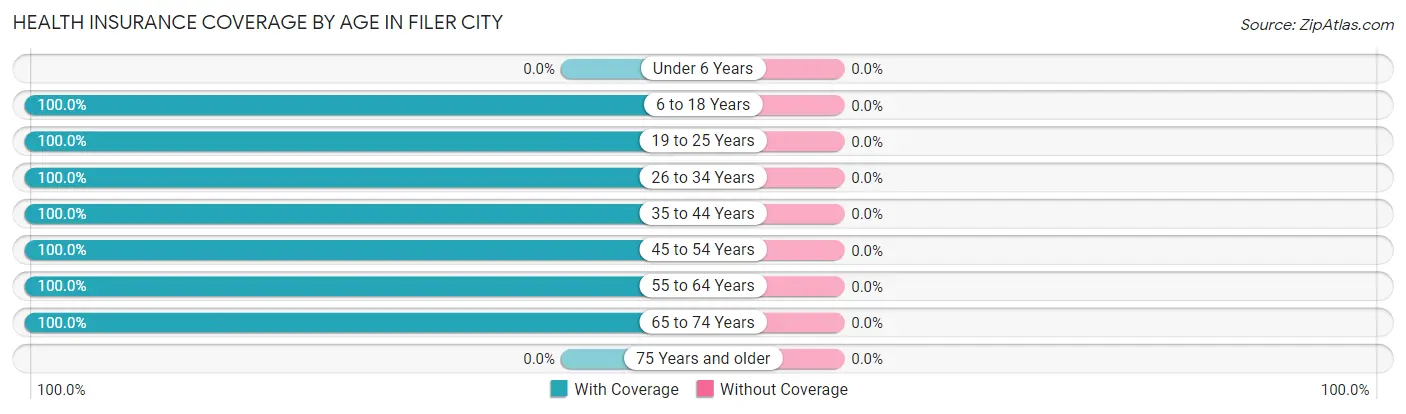
| Age Bracket | With Coverage | Without Coverage |
| Under 6 Years | 0 (0.0%) | 0 (0.0%) |
| 6 to 18 Years | 31 (100.0%) | 0 (0.0%) |
| 19 to 25 Years | 8 (100.0%) | 0 (0.0%) |
| 26 to 34 Years | 20 (100.0%) | 0 (0.0%) |
| 35 to 44 Years | 41 (100.0%) | 0 (0.0%) |
| 45 to 54 Years | 20 (100.0%) | 0 (0.0%) |
| 55 to 64 Years | 10 (100.0%) | 0 (0.0%) |
| 65 to 74 Years | 42 (100.0%) | 0 (0.0%) |
| 75 Years and older | 0 (0.0%) | 0 (0.0%) |
| Total | 172 (100.0%) | 0 (0.0%) |
Health Insurance Coverage by Citizenship Status in Filer City
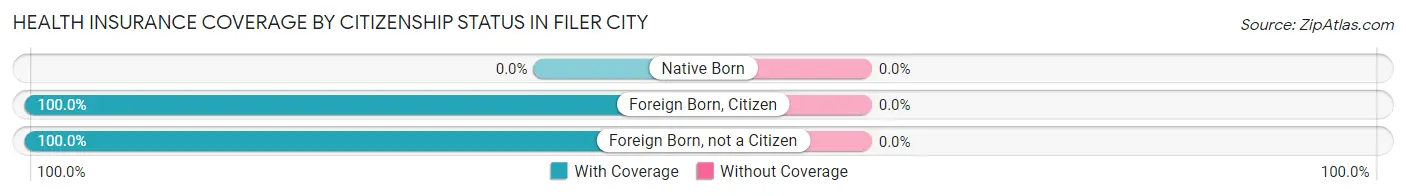
| Citizenship Status | With Coverage | Without Coverage |
| Native Born | 0 (0.0%) | 0 (0.0%) |
| Foreign Born, Citizen | 31 (100.0%) | 0 (0.0%) |
| Foreign Born, not a Citizen | 8 (100.0%) | 0 (0.0%) |
Health Insurance Coverage by Household Income in Filer City
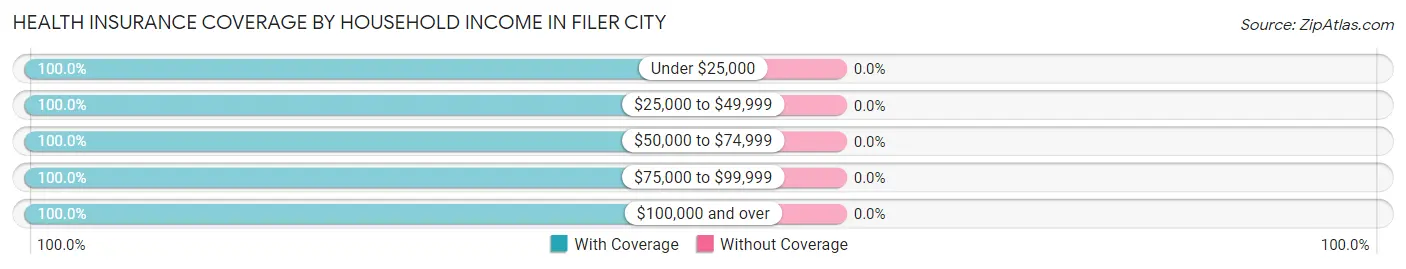
| Household Income | With Coverage | Without Coverage |
| Under $25,000 | 5 (100.0%) | 0 (0.0%) |
| $25,000 to $49,999 | 34 (100.0%) | 0 (0.0%) |
| $50,000 to $74,999 | 13 (100.0%) | 0 (0.0%) |
| $75,000 to $99,999 | 18 (100.0%) | 0 (0.0%) |
| $100,000 and over | 102 (100.0%) | 0 (0.0%) |
Public vs Private Health Insurance Coverage by Age in Filer City
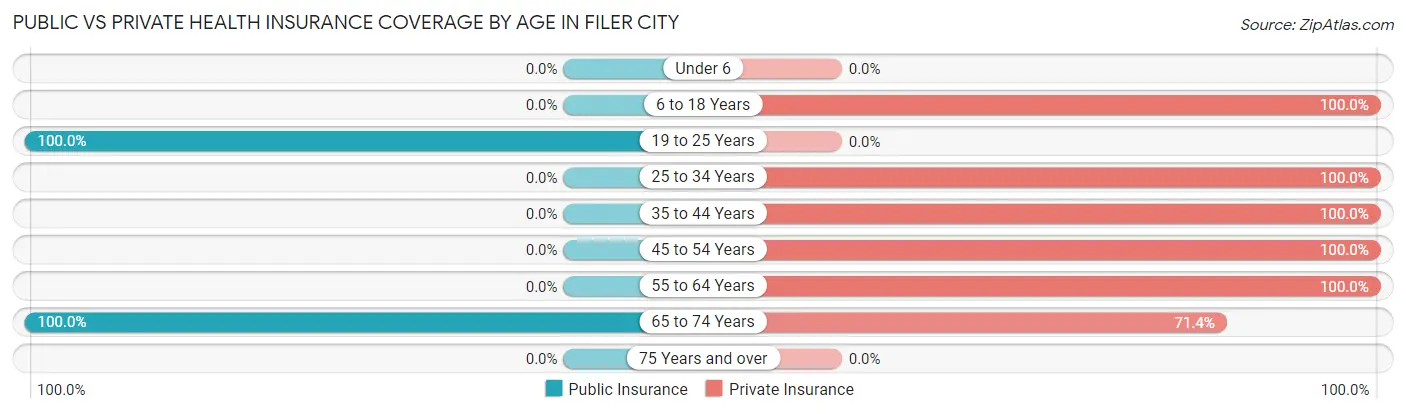
| Age Bracket | Public Insurance | Private Insurance |
| Under 6 | 0 (0.0%) | 0 (0.0%) |
| 6 to 18 Years | 0 (0.0%) | 31 (100.0%) |
| 19 to 25 Years | 8 (100.0%) | 0 (0.0%) |
| 25 to 34 Years | 0 (0.0%) | 20 (100.0%) |
| 35 to 44 Years | 0 (0.0%) | 41 (100.0%) |
| 45 to 54 Years | 0 (0.0%) | 20 (100.0%) |
| 55 to 64 Years | 0 (0.0%) | 10 (100.0%) |
| 65 to 74 Years | 42 (100.0%) | 30 (71.4%) |
| 75 Years and over | 0 (0.0%) | 0 (0.0%) |
| Total | 50 (29.1%) | 152 (88.4%) |
Disability Status by Sex by Age in Filer City
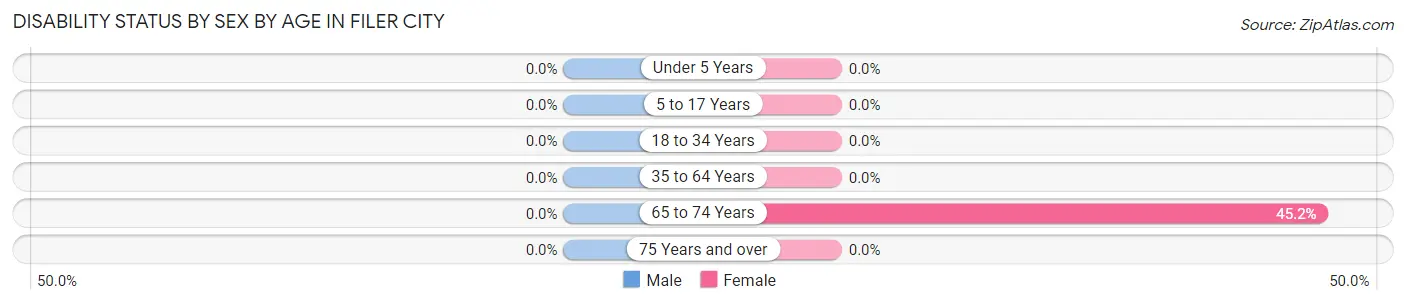
| Age Bracket | Male | Female |
| Under 5 Years | 0 (0.0%) | 0 (0.0%) |
| 5 to 17 Years | 0 (0.0%) | 0 (0.0%) |
| 18 to 34 Years | 0 (0.0%) | 0 (0.0%) |
| 35 to 64 Years | 0 (0.0%) | 0 (0.0%) |
| 65 to 74 Years | 0 (0.0%) | 14 (45.2%) |
| 75 Years and over | 0 (0.0%) | 0 (0.0%) |
Disability Class by Sex by Age in Filer City
Disability Class: Hearing Difficulty
| Age Bracket | Male | Female |
| Under 5 Years | 0 (0.0%) | 0 (0.0%) |
| 5 to 17 Years | 0 (0.0%) | 0 (0.0%) |
| 18 to 34 Years | 0 (0.0%) | 0 (0.0%) |
| 35 to 64 Years | 0 (0.0%) | 0 (0.0%) |
| 65 to 74 Years | 0 (0.0%) | 0 (0.0%) |
| 75 Years and over | 0 (0.0%) | 0 (0.0%) |
Disability Class: Vision Difficulty
| Age Bracket | Male | Female |
| Under 5 Years | 0 (0.0%) | 0 (0.0%) |
| 5 to 17 Years | 0 (0.0%) | 0 (0.0%) |
| 18 to 34 Years | 0 (0.0%) | 0 (0.0%) |
| 35 to 64 Years | 0 (0.0%) | 0 (0.0%) |
| 65 to 74 Years | 0 (0.0%) | 0 (0.0%) |
| 75 Years and over | 0 (0.0%) | 0 (0.0%) |
Disability Class: Cognitive Difficulty
| Age Bracket | Male | Female |
| 5 to 17 Years | 0 (0.0%) | 0 (0.0%) |
| 18 to 34 Years | 0 (0.0%) | 0 (0.0%) |
| 35 to 64 Years | 0 (0.0%) | 0 (0.0%) |
| 65 to 74 Years | 0 (0.0%) | 0 (0.0%) |
| 75 Years and over | 0 (0.0%) | 0 (0.0%) |
Disability Class: Ambulatory Difficulty
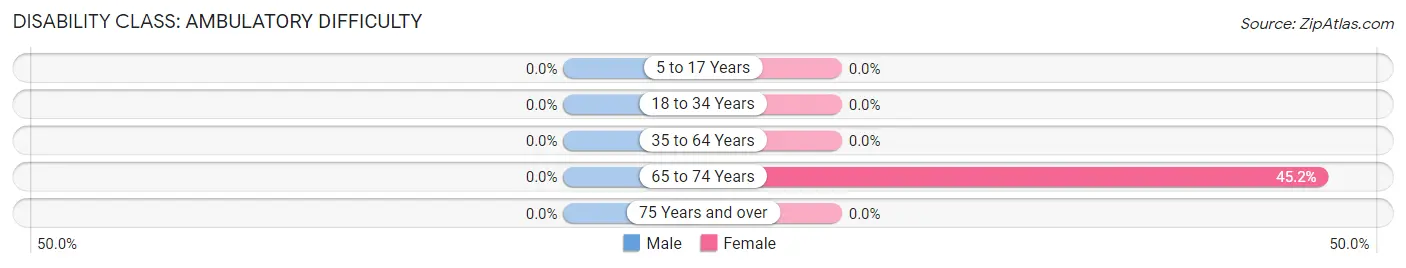
| Age Bracket | Male | Female |
| 5 to 17 Years | 0 (0.0%) | 0 (0.0%) |
| 18 to 34 Years | 0 (0.0%) | 0 (0.0%) |
| 35 to 64 Years | 0 (0.0%) | 0 (0.0%) |
| 65 to 74 Years | 0 (0.0%) | 14 (45.2%) |
| 75 Years and over | 0 (0.0%) | 0 (0.0%) |
Disability Class: Self-Care Difficulty
| Age Bracket | Male | Female |
| 5 to 17 Years | 0 (0.0%) | 0 (0.0%) |
| 18 to 34 Years | 0 (0.0%) | 0 (0.0%) |
| 35 to 64 Years | 0 (0.0%) | 0 (0.0%) |
| 65 to 74 Years | 0 (0.0%) | 0 (0.0%) |
| 75 Years and over | 0 (0.0%) | 0 (0.0%) |
Technology Access in Filer City
Computing Device Access in Filer City
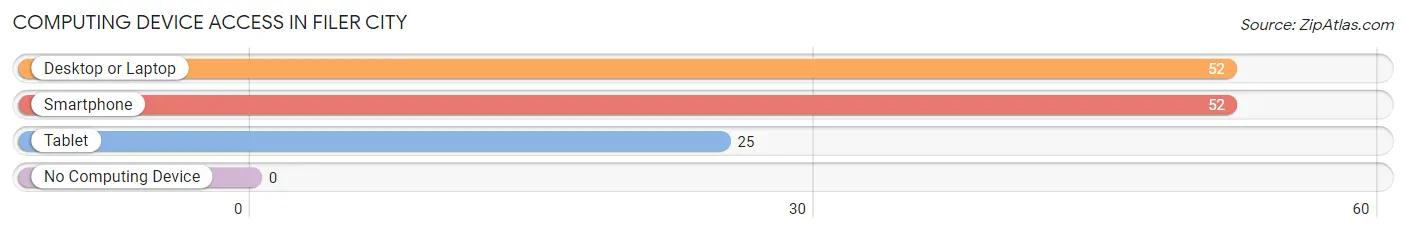
| Device Type | # Households | % Households |
| Desktop or Laptop | 52 | 91.2% |
| Smartphone | 52 | 91.2% |
| Tablet | 25 | 43.9% |
| No Computing Device | 0 | 0.0% |
| Total | 57 | 100.0% |
Internet Access in Filer City
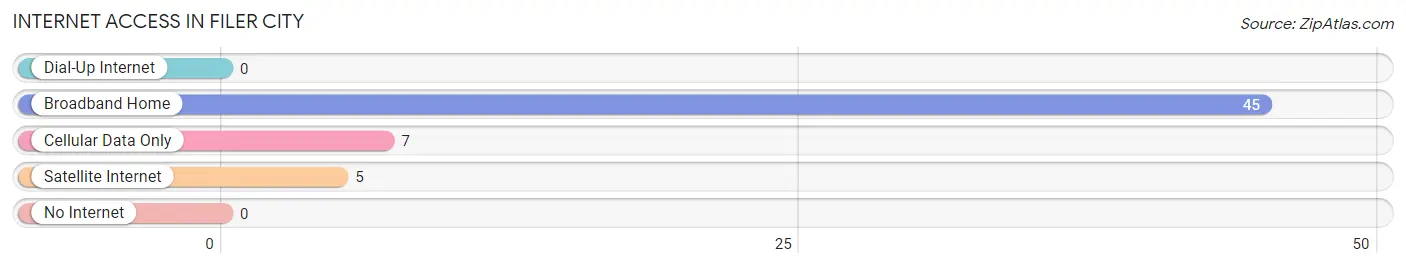
| Internet Type | # Households | % Households |
| Dial-Up Internet | 0 | 0.0% |
| Broadband Home | 45 | 78.9% |
| Cellular Data Only | 7 | 12.3% |
| Satellite Internet | 5 | 8.8% |
| No Internet | 0 | 0.0% |
| Total | 57 | 100.0% |
Filer City Summary
Filer City is a small city located in the state of Michigan. It is located in Manistee County, and is part of the Manistee-Benzie-Leelanau Metropolitan Statistical Area. The city has a population of approximately 1,500 people, and is located on the shores of Lake Michigan.
Geography
Filer City is located in the northwest corner of Manistee County, Michigan. It is situated on the shores of Lake Michigan, and is bordered by the cities of Manistee and Bear Lake. The city is located at the intersection of US-31 and M-22, and is approximately 30 miles north of Traverse City. The city is located in a rural area, and is surrounded by forests and farmland. The city is located at an elevation of 645 feet above sea level.
History
Filer City was founded in 1871 by William Filer, a lumberman from Ohio. Filer purchased a large tract of land in the area, and began to develop the area for lumbering. He built a sawmill and a dock on the lake, and began to harvest the local timber. The city was incorporated in 1891, and the population began to grow. The city was a major lumbering center, and the local economy was largely based on the lumber industry.
In the early 1900s, the city began to diversify its economy. The city became a popular tourist destination, and the local economy began to shift towards tourism. The city also became a popular fishing destination, and the local economy began to shift towards fishing and recreation. The city also became a popular destination for boaters, and the local economy began to shift towards boating and recreation.
Economy
The economy of Filer City is largely based on tourism and recreation. The city is a popular destination for boaters, fishermen, and tourists. The city is home to several marinas, and the local economy is largely based on the boating and fishing industries. The city is also home to several restaurants, bars, and shops, and the local economy is largely based on the hospitality industry. The city is also home to several manufacturing companies, and the local economy is largely based on the manufacturing industry.
Demographics
As of the 2010 census, the population of Filer City was 1,500 people. The racial makeup of the city was 97.3% White, 0.7% African American, 0.3% Native American, 0.3% Asian, 0.3% from other races, and 1.3% from two or more races. The median household income was $37,500, and the median family income was $45,000. The per capita income was $20,000.
Conclusion
Filer City is a small city located in the state of Michigan. It is located in Manistee County, and is part of the Manistee-Benzie-Leelanau Metropolitan Statistical Area. The city has a population of approximately 1,500 people, and is located on the shores of Lake Michigan. The economy of Filer City is largely based on tourism and recreation, and the city is a popular destination for boaters, fishermen, and tourists. The racial makeup of the city is predominantly White, and the median household income is $37,500.
Common Questions
What is Per Capita Income in Filer City?
Per Capita income in Filer City is $29,440.
What is the Median Family Income in Filer City?
Median Family Income in Filer City is $100,208.
What is the Median Household income in Filer City?
Median Household Income in Filer City is $84,250.
What is Income or Wage Gap in Filer City?
Income or Wage Gap in Filer City is 83.3%.
Women in Filer City earn 16.7 cents for every dollar earned by a man.
What is Inequality or Gini Index in Filer City?
Inequality or Gini Index in Filer City is 0.26.
What is the Total Population of Filer City?
Total Population of Filer City is 172.
What is the Total Male Population of Filer City?
Total Male Population of Filer City is 62.
What is the Total Female Population of Filer City?
Total Female Population of Filer City is 110.
What is the Ratio of Males per 100 Females in Filer City?
There are 56.36 Males per 100 Females in Filer City.
What is the Ratio of Females per 100 Males in Filer City?
There are 177.42 Females per 100 Males in Filer City.
What is the Median Population Age in Filer City?
Median Population Age in Filer City is 43.6 Years.
What is the Average Family Size in Filer City
Average Family Size in Filer City is 3.2 People.
What is the Average Household Size in Filer City
Average Household Size in Filer City is 3.0 People.
How Large is the Labor Force in Filer City?
There are 117 People in the Labor Forcein in Filer City.
What is the Percentage of People in the Labor Force in Filer City?
75.0% of People are in the Labor Force in Filer City.
What is the Unemployment Rate in Filer City?
Unemployment Rate in Filer City is 6.8%.