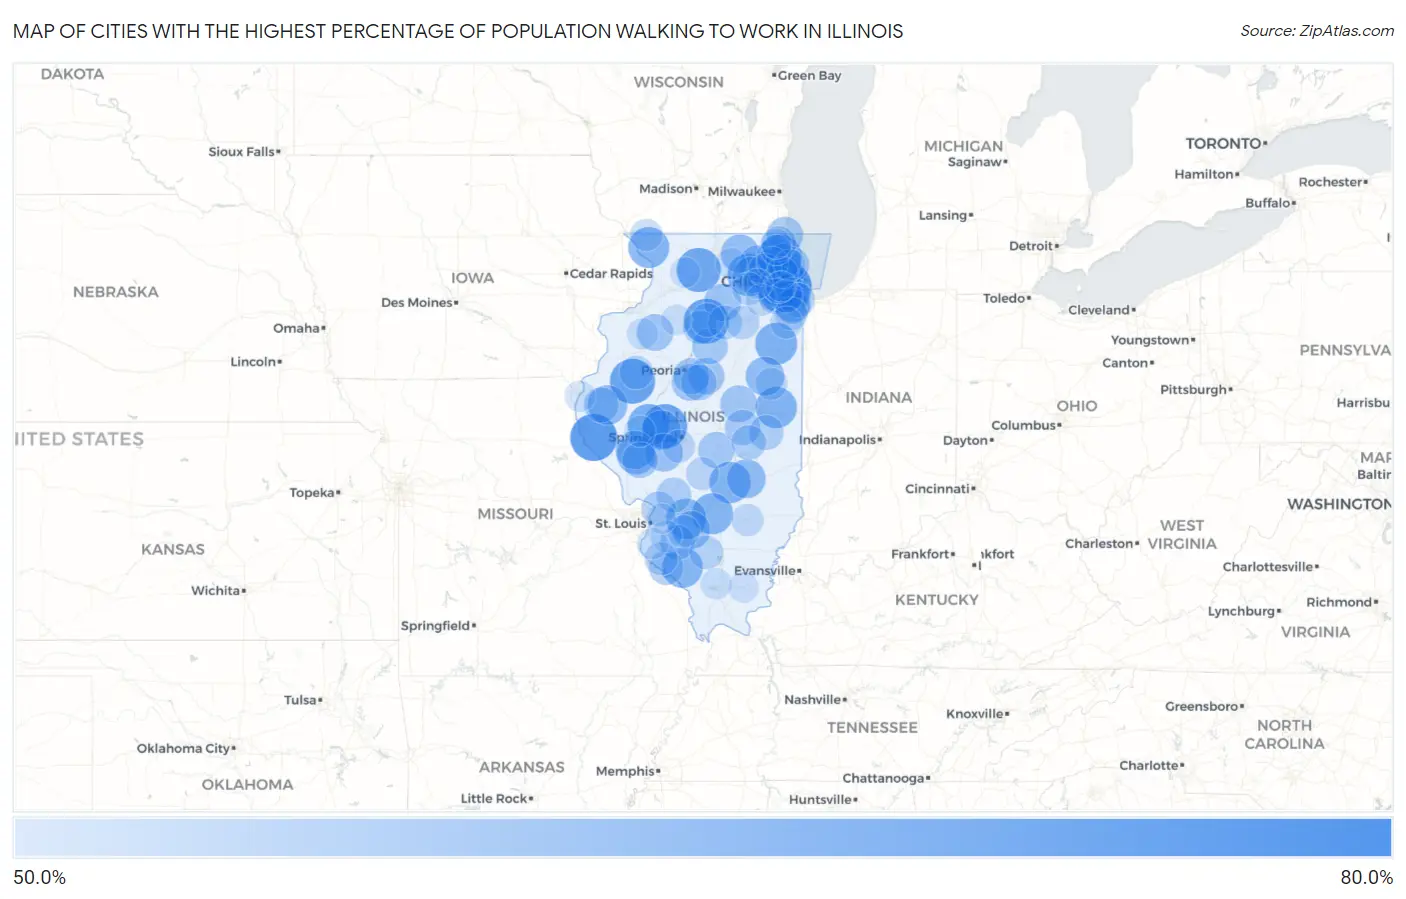
Cities with the Highest Percentage of Population Walking to Work in Illinois
RELATED REPORTS & OPTIONS
Walk to Work
Illinois
Compare Cities
Map of Cities with the Highest Percentage of Population Walking to Work in Illinois
0.0%
80.0%
Cities with the Highest Percentage of Population Walking to Work in Illinois
| City | % Walk to Work | vs State | vs National | |
| 1. | Westchester | 76.6% | 32.8%(+43.8)#1 | 33.4%(+43.2)#31 |
| 2. | Forest View | 75.0% | 32.8%(+42.2)#2 | 33.4%(+41.6)#47 |
| 3. | Plainville | 73.5% | 32.8%(+40.7)#3 | 33.4%(+40.1)#54 |
| 4. | Bushnell | 71.2% | 32.8%(+38.4)#4 | 33.4%(+37.8)#89 |
| 5. | Spring Valley | 71.1% | 32.8%(+38.3)#5 | 33.4%(+37.7)#91 |
| 6. | Burr Ridge | 70.7% | 32.8%(+37.9)#6 | 33.4%(+37.3)#98 |
| 7. | Tallula | 70.2% | 32.8%(+37.4)#7 | 33.4%(+36.8)#116 |
| 8. | Oregon | 70.0% | 32.8%(+37.2)#8 | 33.4%(+36.6)#119 |
| 9. | Lincolnshire | 69.3% | 32.8%(+36.5)#9 | 33.4%(+35.9)#129 |
| 10. | Lily Lake | 67.8% | 32.8%(+35.0)#10 | 33.4%(+34.4)#190 |
| 11. | Virginia | 67.4% | 32.8%(+34.6)#11 | 33.4%(+34.0)#211 |
| 12. | Irwin | 67.3% | 32.8%(+34.5)#12 | 33.4%(+33.9)#223 |
| 13. | Beecher City | 66.5% | 32.8%(+33.7)#13 | 33.4%(+33.1)#252 |
| 14. | Royal | 66.5% | 32.8%(+33.7)#14 | 33.4%(+33.1)#254 |
| 15. | Patoka | 66.2% | 32.8%(+33.4)#15 | 33.4%(+32.8)#278 |
| 16. | Elizabeth | 66.1% | 32.8%(+33.3)#16 | 33.4%(+32.7)#288 |
| 17. | Percy | 65.5% | 32.8%(+32.7)#17 | 33.4%(+32.1)#311 |
| 18. | St Rose | 65.3% | 32.8%(+32.5)#18 | 33.4%(+31.9)#331 |
| 19. | Augusta | 64.3% | 32.8%(+31.5)#19 | 33.4%(+30.9)#399 |
| 20. | Ashland | 63.8% | 32.8%(+31.0)#20 | 33.4%(+30.4)#429 |
| 21. | Roberts | 63.5% | 32.8%(+30.7)#21 | 33.4%(+30.1)#454 |
| 22. | Sigel | 63.5% | 32.8%(+30.7)#22 | 33.4%(+30.1)#455 |
| 23. | Mccook | 63.5% | 32.8%(+30.7)#23 | 33.4%(+30.1)#459 |
| 24. | Alsey | 63.5% | 32.8%(+30.7)#24 | 33.4%(+30.1)#461 |
| 25. | Winchester | 63.1% | 32.8%(+30.3)#25 | 33.4%(+29.7)#499 |
| 26. | Marengo | 63.0% | 32.8%(+30.2)#26 | 33.4%(+29.6)#508 |
| 27. | Waverly | 62.5% | 32.8%(+29.7)#27 | 33.4%(+29.1)#542 |
| 28. | Bartelso | 62.3% | 32.8%(+29.5)#28 | 33.4%(+28.9)#580 |
| 29. | Northlake | 62.1% | 32.8%(+29.3)#29 | 33.4%(+28.7)#600 |
| 30. | Earlville | 61.8% | 32.8%(+29.0)#30 | 33.4%(+28.4)#621 |
| 31. | Prospect Heights | 61.4% | 32.8%(+28.6)#31 | 33.4%(+28.0)#670 |
| 32. | Norridge | 61.1% | 32.8%(+28.3)#32 | 33.4%(+27.7)#716 |
| 33. | West Dundee | 61.1% | 32.8%(+28.3)#33 | 33.4%(+27.7)#718 |
| 34. | Farmer City | 61.1% | 32.8%(+28.3)#34 | 33.4%(+27.7)#723 |
| 35. | Bishop Hill | 61.0% | 32.8%(+28.2)#35 | 33.4%(+27.6)#730 |
| 36. | Tremont | 60.8% | 32.8%(+28.0)#36 | 33.4%(+27.4)#743 |
| 37. | Hazel Crest | 60.6% | 32.8%(+27.8)#37 | 33.4%(+27.2)#756 |
| 38. | Campton Hills | 60.6% | 32.8%(+27.8)#38 | 33.4%(+27.2)#760 |
| 39. | Long Grove | 60.6% | 32.8%(+27.8)#39 | 33.4%(+27.2)#762 |
| 40. | Congerville | 60.5% | 32.8%(+27.7)#40 | 33.4%(+27.1)#784 |
| 41. | Winthrop Harbor | 60.4% | 32.8%(+27.6)#41 | 33.4%(+27.0)#802 |
| 42. | Morton | 60.3% | 32.8%(+27.5)#42 | 33.4%(+26.9)#814 |
| 43. | Kenilworth | 60.3% | 32.8%(+27.5)#43 | 33.4%(+26.9)#824 |
| 44. | Moweaqua | 60.3% | 32.8%(+27.5)#44 | 33.4%(+26.9)#825 |
| 45. | Mackinaw | 59.8% | 32.8%(+27.0)#45 | 33.4%(+26.4)#885 |
| 46. | Roodhouse | 59.8% | 32.8%(+27.0)#46 | 33.4%(+26.4)#886 |
| 47. | Toluca | 59.8% | 32.8%(+27.0)#47 | 33.4%(+26.4)#887 |
| 48. | Oak Brook | 59.5% | 32.8%(+26.7)#48 | 33.4%(+26.1)#909 |
| 49. | Lemont | 59.4% | 32.8%(+26.6)#49 | 33.4%(+26.0)#933 |
| 50. | Northbrook | 59.2% | 32.8%(+26.4)#50 | 33.4%(+25.8)#971 |
| 51. | Bement | 59.2% | 32.8%(+26.4)#51 | 33.4%(+25.8)#978 |
| 52. | Gurnee | 58.8% | 32.8%(+26.0)#52 | 33.4%(+25.4)#1,023 |
| 53. | Merrionette Park | 58.8% | 32.8%(+26.0)#53 | 33.4%(+25.4)#1,029 |
| 54. | Bowen | 58.8% | 32.8%(+26.0)#54 | 33.4%(+25.4)#1,031 |
| 55. | Flossmoor | 58.7% | 32.8%(+25.9)#55 | 33.4%(+25.3)#1,039 |
| 56. | Staunton | 58.7% | 32.8%(+25.9)#56 | 33.4%(+25.3)#1,044 |
| 57. | Villa Grove | 58.5% | 32.8%(+25.7)#57 | 33.4%(+25.1)#1,075 |
| 58. | Roxana | 58.5% | 32.8%(+25.7)#58 | 33.4%(+25.1)#1,076 |
| 59. | St Libory | 58.5% | 32.8%(+25.7)#59 | 33.4%(+25.1)#1,083 |
| 60. | Ellis Grove | 58.5% | 32.8%(+25.7)#60 | 33.4%(+25.1)#1,088 |
| 61. | Arthur | 58.4% | 32.8%(+25.6)#61 | 33.4%(+25.0)#1,109 |
| 62. | Dolton | 58.2% | 32.8%(+25.4)#62 | 33.4%(+24.8)#1,135 |
| 63. | Hennepin | 57.5% | 32.8%(+24.7)#63 | 33.4%(+24.1)#1,230 |
| 64. | Naplate | 57.5% | 32.8%(+24.7)#64 | 33.4%(+24.1)#1,238 |
| 65. | Dalzell | 57.3% | 32.8%(+24.5)#65 | 33.4%(+23.9)#1,272 |
| 66. | Du Bois | 57.3% | 32.8%(+24.5)#66 | 33.4%(+23.9)#1,277 |
| 67. | Avon | 57.2% | 32.8%(+24.4)#67 | 33.4%(+23.8)#1,301 |
| 68. | Seneca | 57.1% | 32.8%(+24.3)#68 | 33.4%(+23.7)#1,308 |
| 69. | Streamwood | 56.5% | 32.8%(+23.7)#69 | 33.4%(+23.1)#1,378 |
| 70. | Ruma | 56.5% | 32.8%(+23.7)#70 | 33.4%(+23.1)#1,406 |
| 71. | Nokomis | 56.4% | 32.8%(+23.6)#71 | 33.4%(+23.0)#1,429 |
| 72. | University Park | 56.3% | 32.8%(+23.5)#72 | 33.4%(+22.9)#1,446 |
| 73. | Chatham | 56.2% | 32.8%(+23.4)#73 | 33.4%(+22.8)#1,464 |
| 74. | Sugar Grove | 56.2% | 32.8%(+23.4)#74 | 33.4%(+22.8)#1,467 |
| 75. | Palos Heights | 56.1% | 32.8%(+23.3)#75 | 33.4%(+22.7)#1,481 |
| 76. | Flora | 55.6% | 32.8%(+22.8)#76 | 33.4%(+22.2)#1,540 |
| 77. | Damiansville | 55.6% | 32.8%(+22.8)#77 | 33.4%(+22.2)#1,546 |
| 78. | Peotone | 55.5% | 32.8%(+22.7)#78 | 33.4%(+22.1)#1,556 |
| 79. | Scales Mound | 55.5% | 32.8%(+22.7)#79 | 33.4%(+22.1)#1,577 |
| 80. | Loda | 55.5% | 32.8%(+22.7)#80 | 33.4%(+22.1)#1,580 |
| 81. | Plainfield | 54.9% | 32.8%(+22.1)#81 | 33.4%(+21.5)#1,689 |
| 82. | Hinsdale | 54.7% | 32.8%(+21.9)#82 | 33.4%(+21.3)#1,714 |
| 83. | Freeburg | 54.7% | 32.8%(+21.9)#83 | 33.4%(+21.3)#1,717 |
| 84. | Palatine | 54.5% | 32.8%(+21.7)#84 | 33.4%(+21.1)#1,731 |
| 85. | Wilmette | 54.5% | 32.8%(+21.7)#85 | 33.4%(+21.1)#1,734 |
| 86. | Arenzville | 54.5% | 32.8%(+21.7)#86 | 33.4%(+21.1)#1,765 |
| 87. | Woodhull | 54.3% | 32.8%(+21.5)#87 | 33.4%(+20.9)#1,796 |
| 88. | Herrin | 54.2% | 32.8%(+21.4)#88 | 33.4%(+20.8)#1,808 |
| 89. | Rosemont | 54.2% | 32.8%(+21.4)#89 | 33.4%(+20.8)#1,813 |
| 90. | Kingston | 54.2% | 32.8%(+21.4)#90 | 33.4%(+20.8)#1,820 |
| 91. | Waterloo | 54.1% | 32.8%(+21.3)#91 | 33.4%(+20.7)#1,833 |
| 92. | Warsaw | 54.0% | 32.8%(+21.2)#92 | 33.4%(+20.6)#1,849 |
| 93. | Sheffield | 54.0% | 32.8%(+21.2)#93 | 33.4%(+20.6)#1,851 |
| 94. | Libertyville | 53.6% | 32.8%(+20.8)#94 | 33.4%(+20.2)#1,900 |
| 95. | Collinsville | 53.5% | 32.8%(+20.7)#95 | 33.4%(+20.1)#1,912 |
| 96. | Harrisburg | 53.5% | 32.8%(+20.7)#96 | 33.4%(+20.1)#1,915 |
| 97. | Western Springs | 53.4% | 32.8%(+20.6)#97 | 33.4%(+20.0)#1,952 |
| 98. | Polo | 53.3% | 32.8%(+20.5)#98 | 33.4%(+19.9)#1,974 |
| 99. | Batavia | 53.1% | 32.8%(+20.3)#99 | 33.4%(+19.7)#2,006 |
| 100. | Gages Lake | 53.1% | 32.8%(+20.3)#100 | 33.4%(+19.7)#2,009 |
Common Questions
What are the Top 10 Cities with the Highest Percentage of Population Walking to Work in Illinois?
Top 10 Cities with the Highest Percentage of Population Walking to Work in Illinois are:
#1
76.6%
#2
75.0%
#3
73.5%
#4
71.2%
#5
71.1%
#6
70.7%
#7
70.2%
#8
70.0%
#9
69.3%
#10
67.8%
What city has the Highest Percentage of Population Walking to Work in Illinois?
Westchester has the Highest Percentage of Population Walking to Work in Illinois with 76.6%.
What is the Percentage of Population Walking to Work in the State of Illinois?
Percentage of Population Walking to Work in Illinois is 32.8%.
What is the Percentage of Population Walking to Work in the United States?
Percentage of Population Walking to Work in the United States is 33.4%.