Virginia, IL Map & Demographics
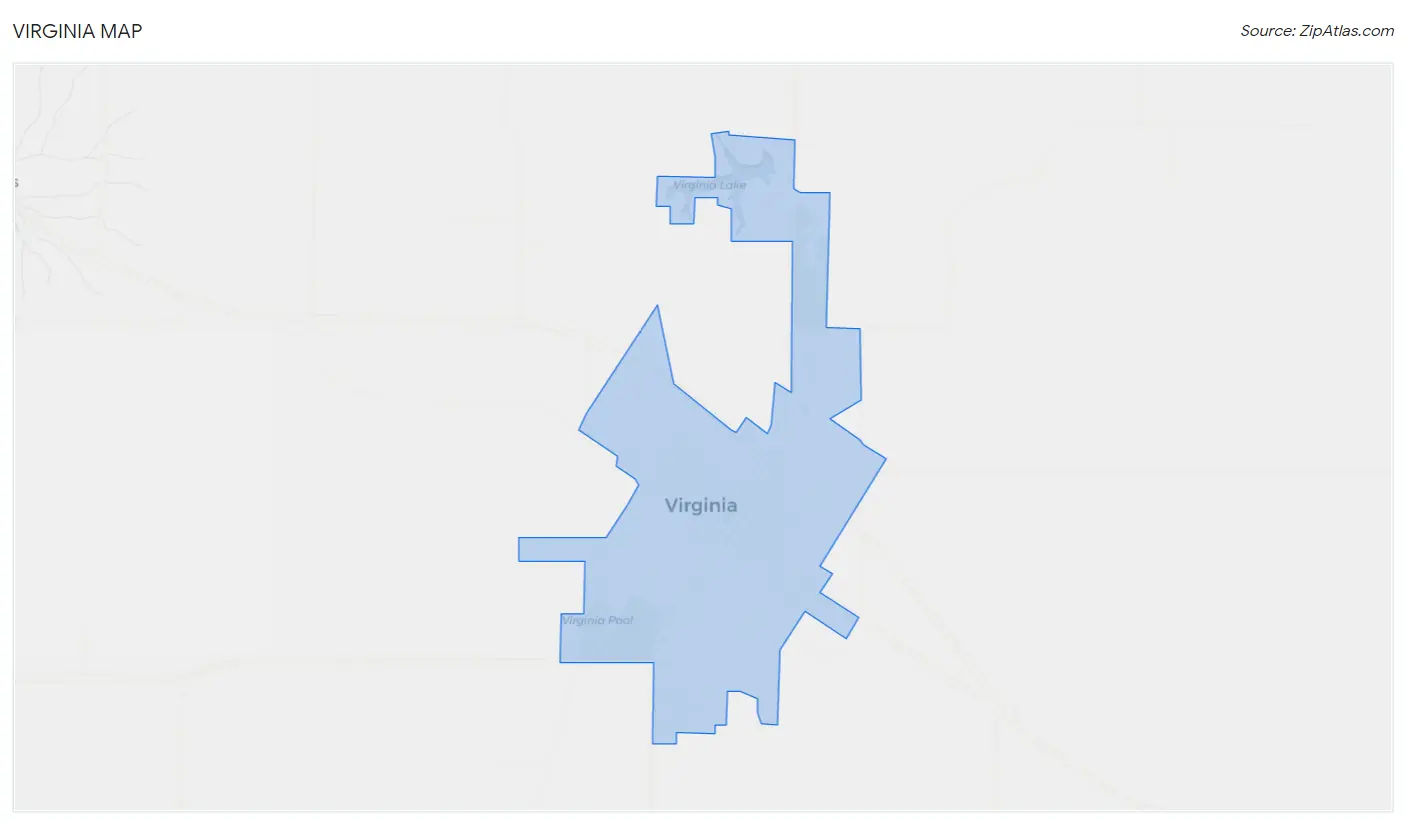
Virginia Map
Virginia Overview
$26,190
PER CAPITA INCOME
$54,750
AVG FAMILY INCOME
$48,438
AVG HOUSEHOLD INCOME
18.4%
WAGE / INCOME GAP [ % ]
81.6¢/ $1
WAGE / INCOME GAP [ $ ]
0.41
INEQUALITY / GINI INDEX
1,490
TOTAL POPULATION
711
MALE POPULATION
779
FEMALE POPULATION
91.27
MALES / 100 FEMALES
109.56
FEMALES / 100 MALES
43.0
MEDIAN AGE
2.9
AVG FAMILY SIZE
2.4
AVG HOUSEHOLD SIZE
724
LABOR FORCE [ PEOPLE ]
61.6%
PERCENT IN LABOR FORCE
3.7%
UNEMPLOYMENT RATE
Virginia Zip Codes
Virginia Area Codes
Income in Virginia
Income Overview in Virginia
Per Capita Income in Virginia is $26,190, while median incomes of families and households are $54,750 and $48,438 respectively.
| Characteristic | Number | Measure |
| Per Capita Income | 1,490 | $26,190 |
| Median Family Income | 399 | $54,750 |
| Mean Family Income | 399 | $66,865 |
| Median Household Income | 614 | $48,438 |
| Mean Household Income | 614 | $60,216 |
| Income Deficit | 399 | $0 |
| Wage / Income Gap (%) | 1,490 | 18.45% |
| Wage / Income Gap ($) | 1,490 | 81.55¢ per $1 |
| Gini / Inequality Index | 1,490 | 0.41 |
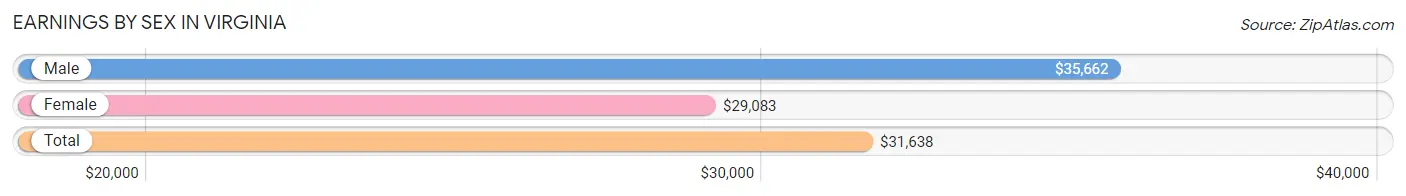
Earnings by Sex in Virginia
Average Earnings in Virginia are $31,638, $35,662 for men and $29,083 for women, a difference of 18.4%.
| Sex | Number | Average Earnings |
| Male | 411 (53.7%) | $35,662 |
| Female | 355 (46.3%) | $29,083 |
| Total | 766 (100.0%) | $31,638 |
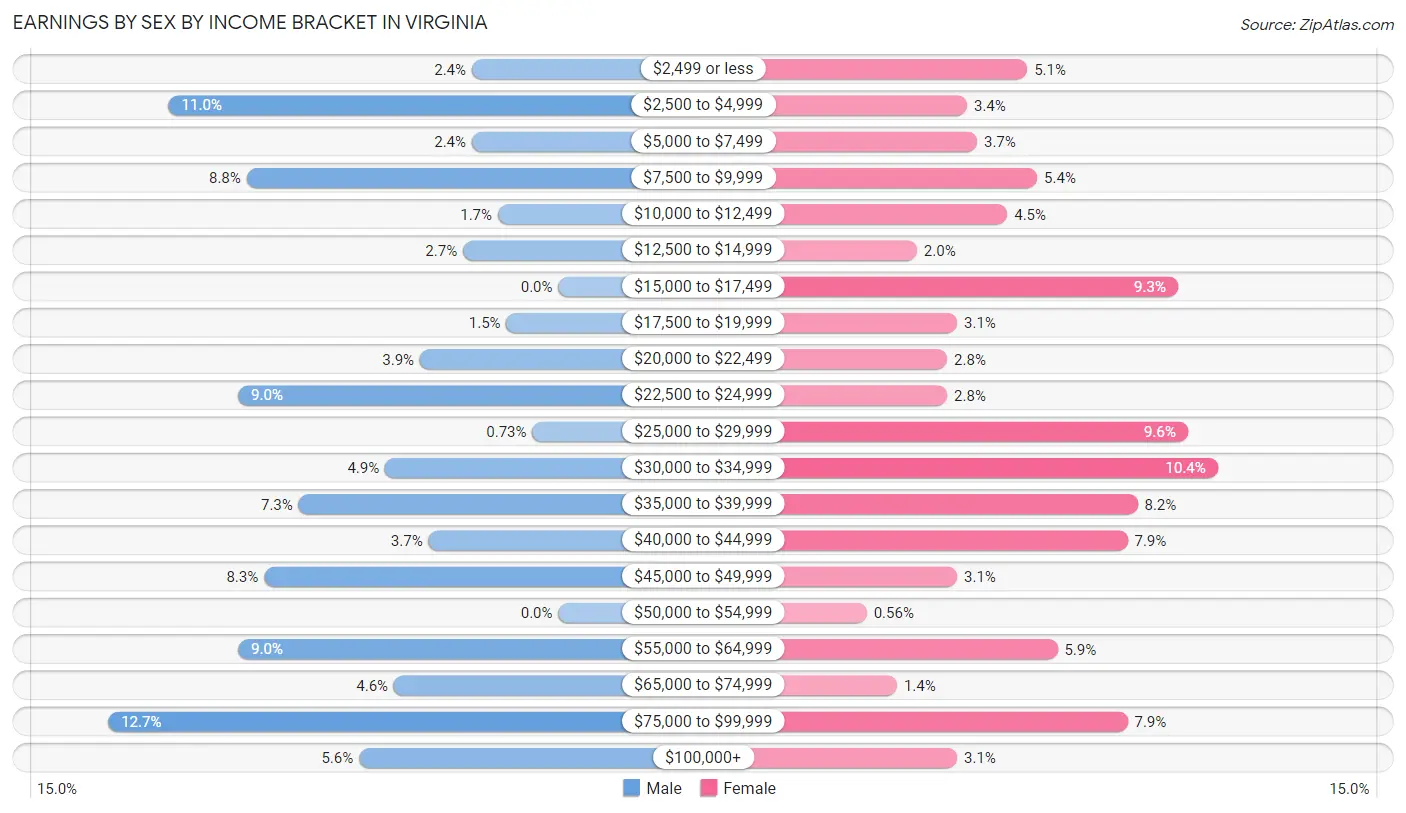
Earnings by Sex by Income Bracket in Virginia
The most common earnings brackets in Virginia are $75,000 to $99,999 for men (52 | 12.7%) and $30,000 to $34,999 for women (37 | 10.4%).
| Income | Male | Female |
| $2,499 or less | 10 (2.4%) | 18 (5.1%) |
| $2,500 to $4,999 | 45 (11.0%) | 12 (3.4%) |
| $5,000 to $7,499 | 10 (2.4%) | 13 (3.7%) |
| $7,500 to $9,999 | 36 (8.8%) | 19 (5.3%) |
| $10,000 to $12,499 | 7 (1.7%) | 16 (4.5%) |
| $12,500 to $14,999 | 11 (2.7%) | 7 (2.0%) |
| $15,000 to $17,499 | 0 (0.0%) | 33 (9.3%) |
| $17,500 to $19,999 | 6 (1.5%) | 11 (3.1%) |
| $20,000 to $22,499 | 16 (3.9%) | 10 (2.8%) |
| $22,500 to $24,999 | 37 (9.0%) | 10 (2.8%) |
| $25,000 to $29,999 | 3 (0.7%) | 34 (9.6%) |
| $30,000 to $34,999 | 20 (4.9%) | 37 (10.4%) |
| $35,000 to $39,999 | 30 (7.3%) | 29 (8.2%) |
| $40,000 to $44,999 | 15 (3.6%) | 28 (7.9%) |
| $45,000 to $49,999 | 34 (8.3%) | 11 (3.1%) |
| $50,000 to $54,999 | 0 (0.0%) | 2 (0.6%) |
| $55,000 to $64,999 | 37 (9.0%) | 21 (5.9%) |
| $65,000 to $74,999 | 19 (4.6%) | 5 (1.4%) |
| $75,000 to $99,999 | 52 (12.7%) | 28 (7.9%) |
| $100,000+ | 23 (5.6%) | 11 (3.1%) |
| Total | 411 (100.0%) | 355 (100.0%) |
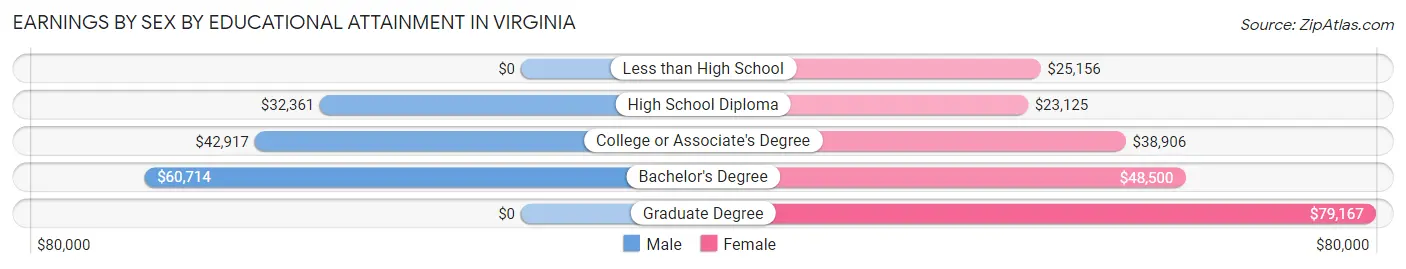
Earnings by Sex by Educational Attainment in Virginia
Average earnings in Virginia are $42,614 for men and $32,159 for women, a difference of 24.5%. Men with an educational attainment of bachelor's degree enjoy the highest average annual earnings of $60,714, while those with high school diploma education earn the least with $32,361. Women with an educational attainment of graduate degree earn the most with the average annual earnings of $79,167, while those with high school diploma education have the smallest earnings of $23,125.
| Educational Attainment | Male Income | Female Income |
| Less than High School | - | - |
| High School Diploma | $32,361 | $23,125 |
| College or Associate's Degree | $42,917 | $38,906 |
| Bachelor's Degree | $60,714 | $48,500 |
| Graduate Degree | - | - |
| Total | $42,614 | $32,159 |
Family Income in Virginia
Family Income Brackets in Virginia
According to the Virginia family income data, there are 75 families falling into the $75,000 to $99,999 income range, which is the most common income bracket and makes up 18.8% of all families. Conversely, the $10,000 to $14,999 income bracket is the least frequent group with only 6 families (1.5%) belonging to this category.
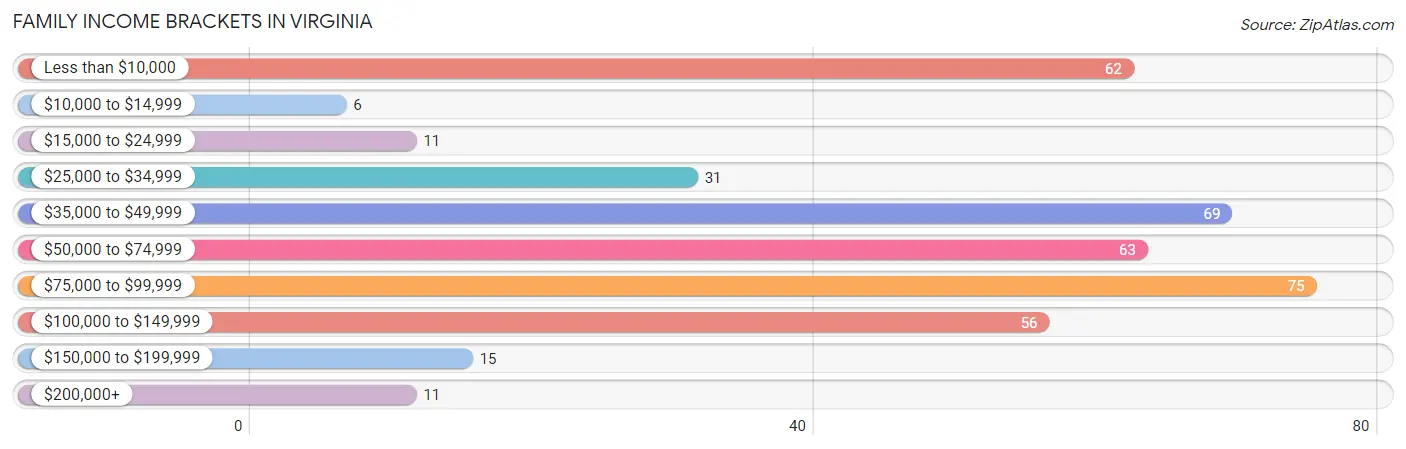
| Income Bracket | # Families | % Families |
| Less than $10,000 | 62 | 15.5% |
| $10,000 to $14,999 | 6 | 1.5% |
| $15,000 to $24,999 | 11 | 2.8% |
| $25,000 to $34,999 | 31 | 7.8% |
| $35,000 to $49,999 | 69 | 17.3% |
| $50,000 to $74,999 | 63 | 15.8% |
| $75,000 to $99,999 | 75 | 18.8% |
| $100,000 to $149,999 | 56 | 14.0% |
| $150,000 to $199,999 | 15 | 3.8% |
| $200,000+ | 11 | 2.8% |
Family Income by Famaliy Size in Virginia
5-person families (34 | 8.5%) account for the highest median family income in Virginia with $130,625 per family, while 5-person families (34 | 8.5%) have the highest median income of $26,125 per family member.
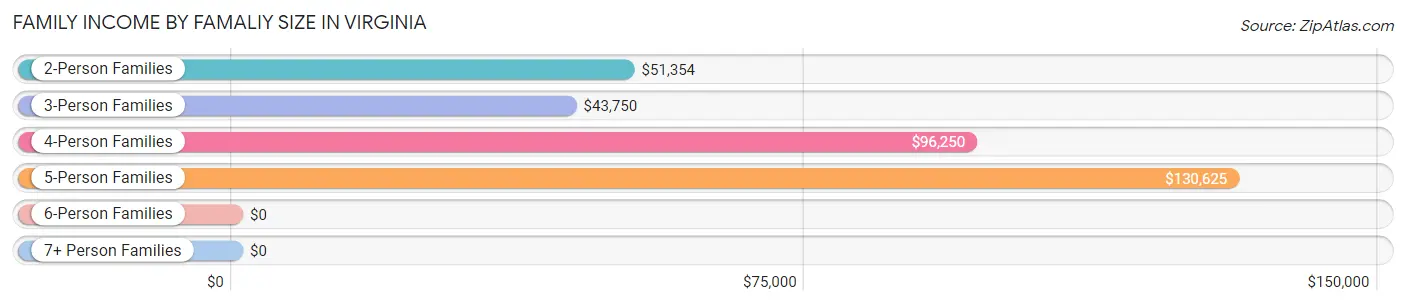
| Income Bracket | # Families | Median Income |
| 2-Person Families | 235 (58.9%) | $51,354 |
| 3-Person Families | 96 (24.1%) | $43,750 |
| 4-Person Families | 22 (5.5%) | $96,250 |
| 5-Person Families | 34 (8.5%) | $130,625 |
| 6-Person Families | 12 (3.0%) | $0 |
| 7+ Person Families | 0 (0.0%) | $0 |
| Total | 399 (100.0%) | $54,750 |
Family Income by Number of Earners in Virginia
The median family income in Virginia is $54,750, with families comprising 3+ earners (23) having the highest median family income of $94,750, while families with no earners (78) have the lowest median family income of $32,727, accounting for 5.8% and 19.6% of families, respectively.
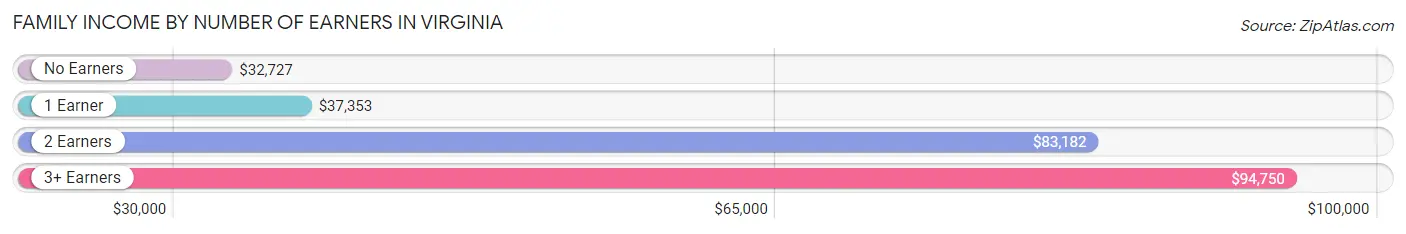
| Number of Earners | # Families | Median Income |
| No Earners | 78 (19.6%) | $32,727 |
| 1 Earner | 148 (37.1%) | $37,353 |
| 2 Earners | 150 (37.6%) | $83,182 |
| 3+ Earners | 23 (5.8%) | $94,750 |
| Total | 399 (100.0%) | $54,750 |
Household Income in Virginia
Household Income Brackets in Virginia
With 117 households falling in the category, the $75,000 to $99,999 income range is the most frequent in Virginia, accounting for 19.1% of all households. In contrast, only 11 households (1.8%) fall into the $10,000 to $14,999 income bracket, making it the least populous group.
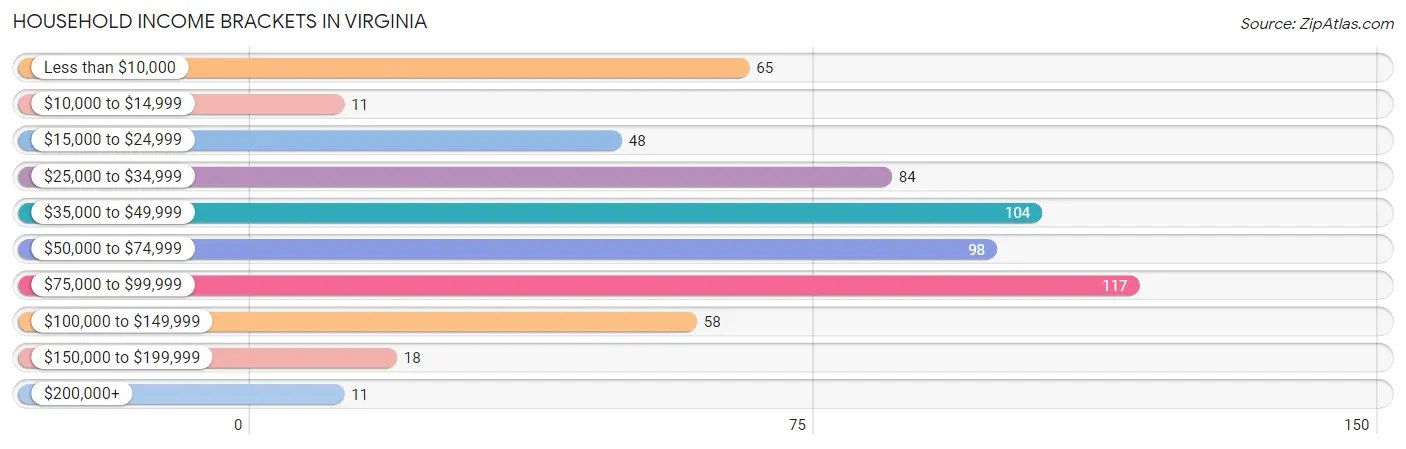
| Income Bracket | # Households | % Households |
| Less than $10,000 | 65 | 10.6% |
| $10,000 to $14,999 | 11 | 1.8% |
| $15,000 to $24,999 | 48 | 7.8% |
| $25,000 to $34,999 | 84 | 13.7% |
| $35,000 to $49,999 | 104 | 16.9% |
| $50,000 to $74,999 | 98 | 16.0% |
| $75,000 to $99,999 | 117 | 19.1% |
| $100,000 to $149,999 | 58 | 9.4% |
| $150,000 to $199,999 | 18 | 2.9% |
| $200,000+ | 11 | 1.8% |
Household Income by Householder Age in Virginia
The median household income in Virginia is $48,438, with the highest median household income of $58,173 found in the 45 to 64 years age bracket for the primary householder. A total of 203 households (33.1%) fall into this category. Meanwhile, the 15 to 24 years age bracket for the primary householder has the lowest median household income of $28,125, with 48 households (7.8%) in this group.
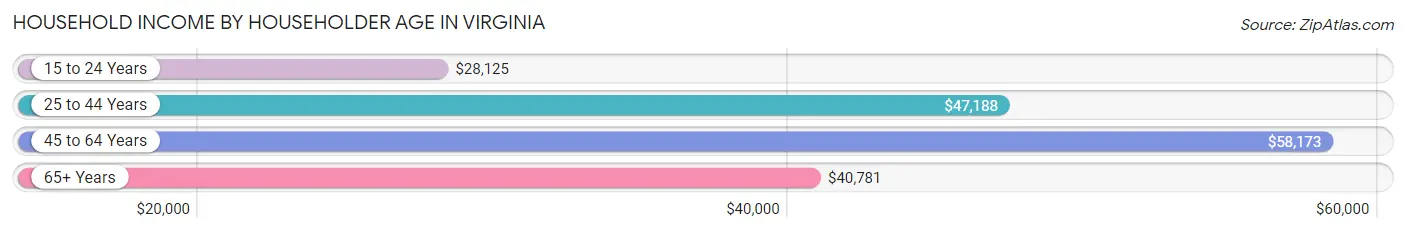
| Income Bracket | # Households | Median Income |
| 15 to 24 Years | 48 (7.8%) | $28,125 |
| 25 to 44 Years | 192 (31.3%) | $47,188 |
| 45 to 64 Years | 203 (33.1%) | $58,173 |
| 65+ Years | 171 (27.9%) | $40,781 |
| Total | 614 (100.0%) | $48,438 |
Poverty in Virginia
Income Below Poverty by Sex and Age in Virginia
With 18.9% poverty level for males and 11.7% for females among the residents of Virginia, 18 to 24 year old males and 12 to 14 year old females are the most vulnerable to poverty, with 31 males (59.6%) and 31 females (38.3%) in their respective age groups living below the poverty level.
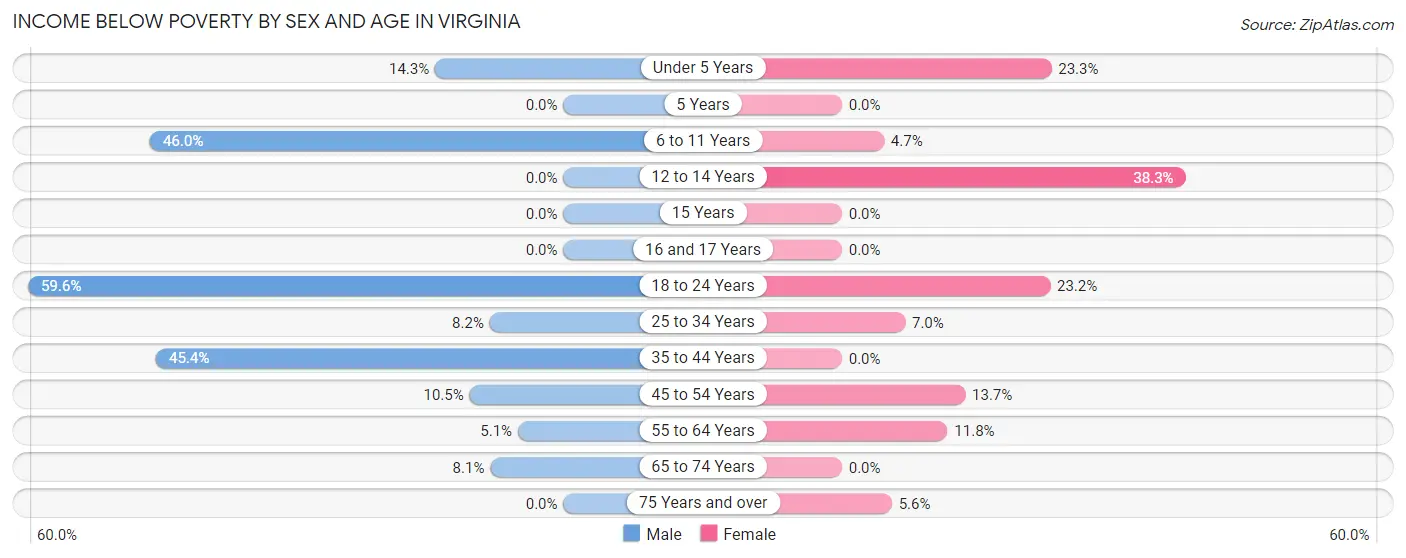
| Age Bracket | Male | Female |
| Under 5 Years | 2 (14.3%) | 7 (23.3%) |
| 5 Years | 0 (0.0%) | 0 (0.0%) |
| 6 to 11 Years | 29 (46.0%) | 3 (4.7%) |
| 12 to 14 Years | 0 (0.0%) | 31 (38.3%) |
| 15 Years | 0 (0.0%) | 0 (0.0%) |
| 16 and 17 Years | 0 (0.0%) | 0 (0.0%) |
| 18 to 24 Years | 31 (59.6%) | 16 (23.2%) |
| 25 to 34 Years | 5 (8.2%) | 5 (7.0%) |
| 35 to 44 Years | 44 (45.4%) | 0 (0.0%) |
| 45 to 54 Years | 7 (10.4%) | 7 (13.7%) |
| 55 to 64 Years | 8 (5.1%) | 14 (11.8%) |
| 65 to 74 Years | 7 (8.1%) | 0 (0.0%) |
| 75 Years and over | 0 (0.0%) | 4 (5.6%) |
| Total | 133 (18.9%) | 87 (11.7%) |
Income Above Poverty by Sex and Age in Virginia
According to the poverty statistics in Virginia, males aged 12 to 14 years and females aged 15 years are the age groups that are most secure financially, with 100.0% of males and 100.0% of females in these age groups living above the poverty line.
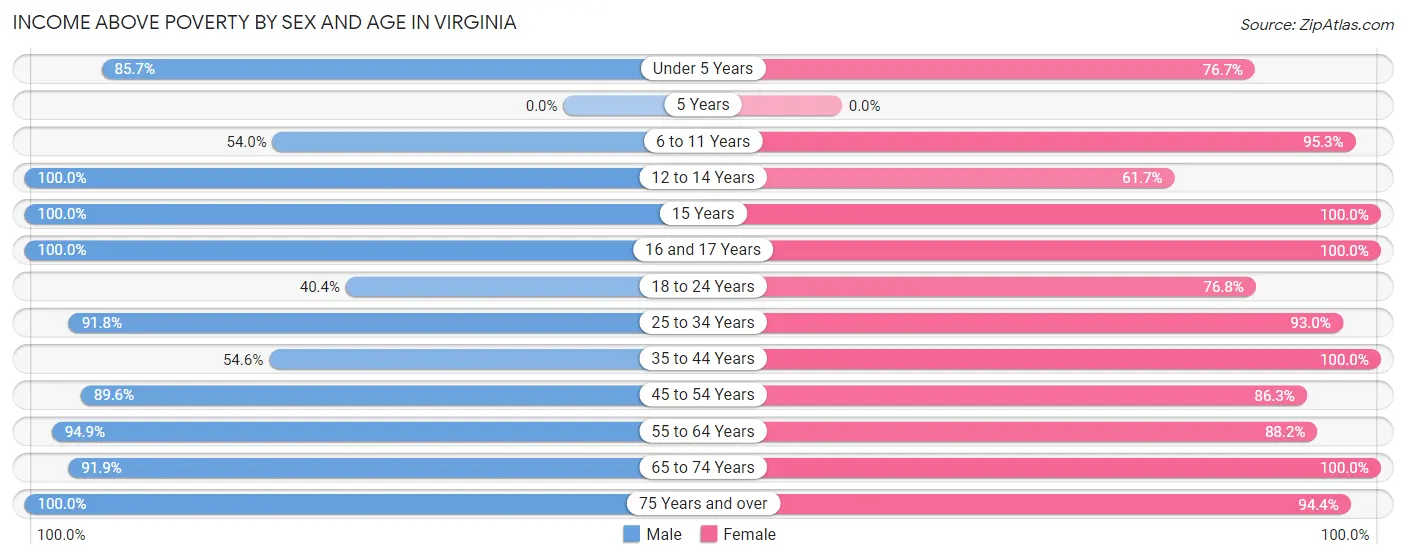
| Age Bracket | Male | Female |
| Under 5 Years | 12 (85.7%) | 23 (76.7%) |
| 5 Years | 0 (0.0%) | 0 (0.0%) |
| 6 to 11 Years | 34 (54.0%) | 61 (95.3%) |
| 12 to 14 Years | 38 (100.0%) | 50 (61.7%) |
| 15 Years | 16 (100.0%) | 8 (100.0%) |
| 16 and 17 Years | 16 (100.0%) | 13 (100.0%) |
| 18 to 24 Years | 21 (40.4%) | 53 (76.8%) |
| 25 to 34 Years | 56 (91.8%) | 66 (93.0%) |
| 35 to 44 Years | 53 (54.6%) | 97 (100.0%) |
| 45 to 54 Years | 60 (89.5%) | 44 (86.3%) |
| 55 to 64 Years | 150 (94.9%) | 105 (88.2%) |
| 65 to 74 Years | 79 (91.9%) | 71 (100.0%) |
| 75 Years and over | 37 (100.0%) | 68 (94.4%) |
| Total | 572 (81.1%) | 659 (88.3%) |
Income Below Poverty Among Married-Couple Families in Virginia
The poverty statistics for married-couple families in Virginia show that 5.2% or 14 of the total 269 families live below the poverty line. Families with no children have the highest poverty rate of 7.2%, comprising of 14 families. On the other hand, families with 1 or 2 children have the lowest poverty rate of 0.0%, which includes 0 families.
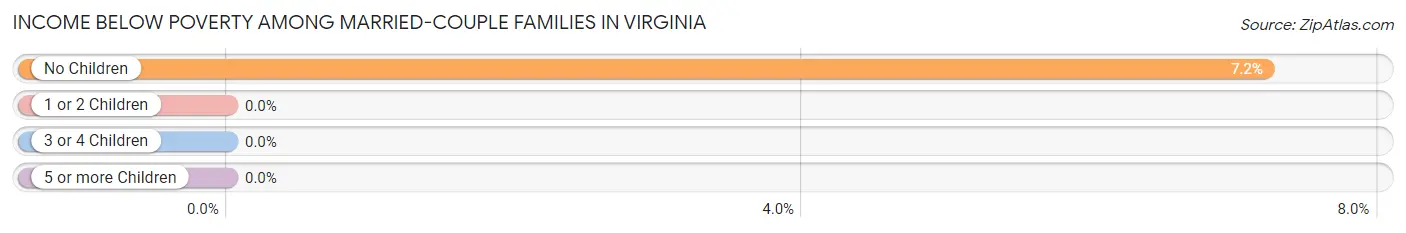
| Children | Above Poverty | Below Poverty |
| No Children | 180 (92.8%) | 14 (7.2%) |
| 1 or 2 Children | 44 (100.0%) | 0 (0.0%) |
| 3 or 4 Children | 31 (100.0%) | 0 (0.0%) |
| 5 or more Children | 0 (0.0%) | 0 (0.0%) |
| Total | 255 (94.8%) | 14 (5.2%) |
Income Below Poverty Among Single-Parent Households in Virginia
According to the poverty data in Virginia, 52.9% or 36 single-father households and 29.0% or 18 single-mother households are living below the poverty line. Among single-father households, those with 1 or 2 children have the highest poverty rate, with 36 households (69.2%) experiencing poverty. Likewise, among single-mother households, those with 3 or 4 children have the highest poverty rate, with 2 households (100.0%) falling below the poverty line.
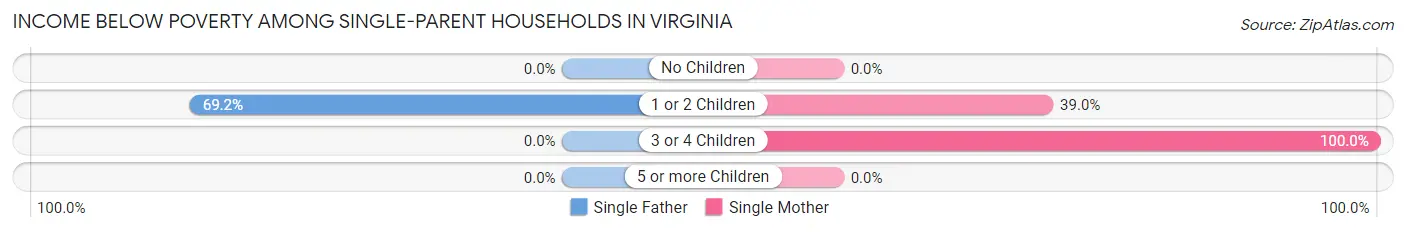
| Children | Single Father | Single Mother |
| No Children | 0 (0.0%) | 0 (0.0%) |
| 1 or 2 Children | 36 (69.2%) | 16 (39.0%) |
| 3 or 4 Children | 0 (0.0%) | 2 (100.0%) |
| 5 or more Children | 0 (0.0%) | 0 (0.0%) |
| Total | 36 (52.9%) | 18 (29.0%) |
Income Below Poverty Among Married-Couple vs Single-Parent Households in Virginia
The poverty data for Virginia shows that 14 of the married-couple family households (5.2%) and 54 of the single-parent households (41.5%) are living below the poverty level. Within the married-couple family households, those with no children have the highest poverty rate, with 14 households (7.2%) falling below the poverty line. Among the single-parent households, those with 3 or 4 children have the highest poverty rate, with 2 household (100.0%) living below poverty.
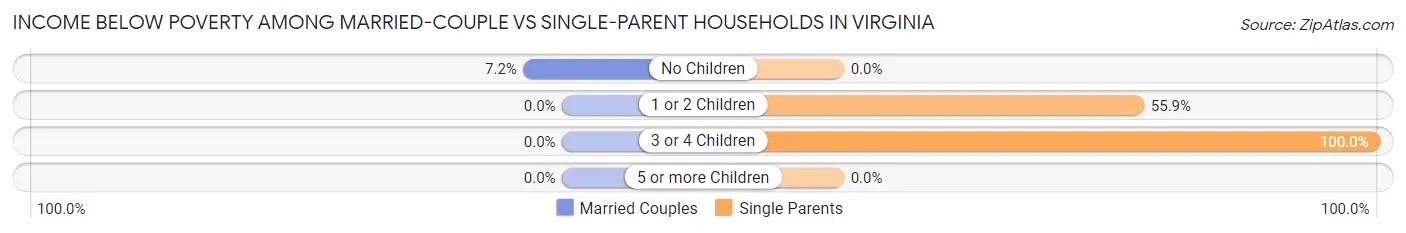
| Children | Married-Couple Families | Single-Parent Households |
| No Children | 14 (7.2%) | 0 (0.0%) |
| 1 or 2 Children | 0 (0.0%) | 52 (55.9%) |
| 3 or 4 Children | 0 (0.0%) | 2 (100.0%) |
| 5 or more Children | 0 (0.0%) | 0 (0.0%) |
| Total | 14 (5.2%) | 54 (41.5%) |
Race in Virginia
The most populous races in Virginia are White / Caucasian (1,419 | 95.2%), Two or more Races (41 | 2.8%), and Hispanic or Latino (32 | 2.1%).
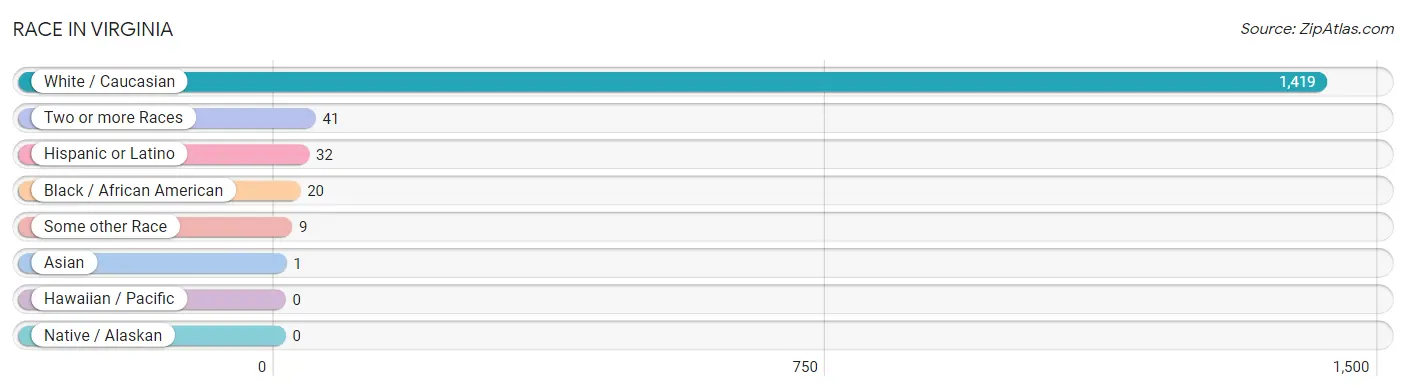
| Race | # Population | % Population |
| Asian | 1 | 0.1% |
| Black / African American | 20 | 1.3% |
| Hawaiian / Pacific | 0 | 0.0% |
| Hispanic or Latino | 32 | 2.1% |
| Native / Alaskan | 0 | 0.0% |
| White / Caucasian | 1,419 | 95.2% |
| Two or more Races | 41 | 2.8% |
| Some other Race | 9 | 0.6% |
| Total | 1,490 | 100.0% |
Ancestry in Virginia
The most populous ancestries reported in Virginia are German (299 | 20.1%), Irish (187 | 12.6%), English (154 | 10.3%), American (127 | 8.5%), and Italian (49 | 3.3%), together accounting for 54.8% of all Virginia residents.
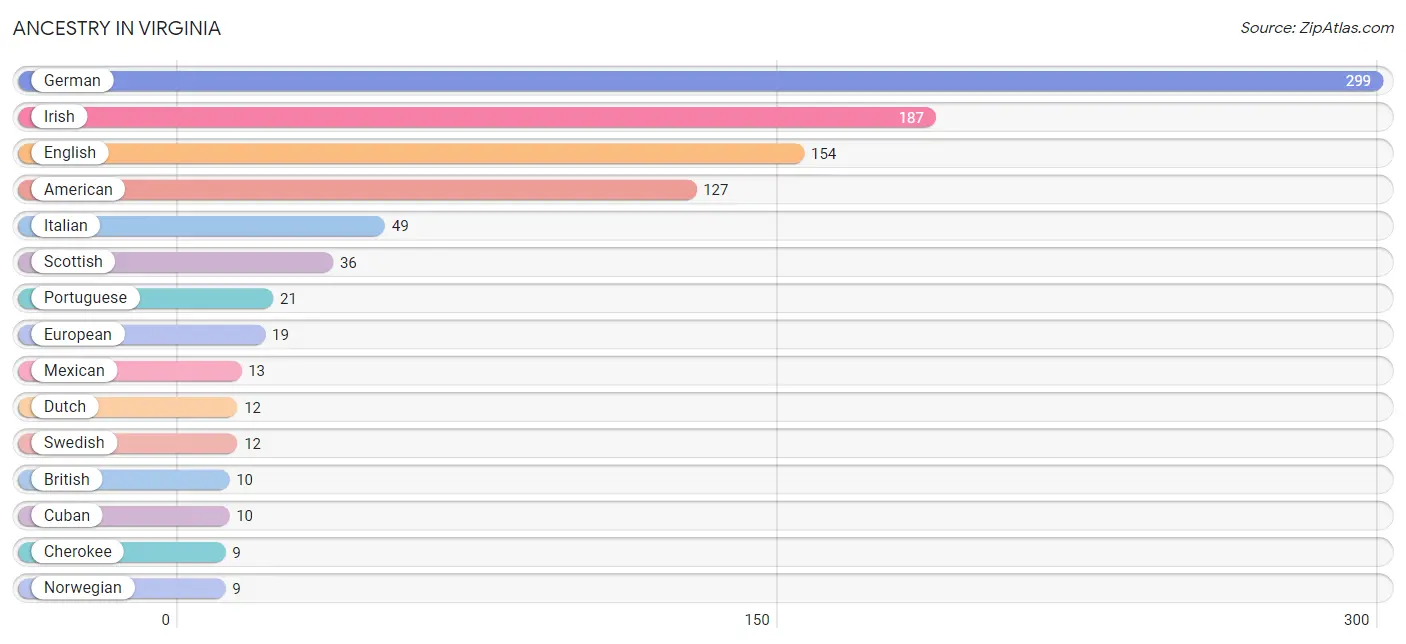
| Ancestry | # Population | % Population |
| African | 3 | 0.2% |
| American | 127 | 8.5% |
| Blackfeet | 3 | 0.2% |
| British | 10 | 0.7% |
| Cherokee | 9 | 0.6% |
| Cuban | 10 | 0.7% |
| Dutch | 12 | 0.8% |
| English | 154 | 10.3% |
| European | 19 | 1.3% |
| French | 6 | 0.4% |
| German | 299 | 20.1% |
| Irish | 187 | 12.6% |
| Italian | 49 | 3.3% |
| Korean | 1 | 0.1% |
| Mexican | 13 | 0.9% |
| Norwegian | 9 | 0.6% |
| Polish | 8 | 0.5% |
| Portuguese | 21 | 1.4% |
| Puerto Rican | 9 | 0.6% |
| Scandinavian | 2 | 0.1% |
| Scottish | 36 | 2.4% |
| Subsaharan African | 9 | 0.6% |
| Swedish | 12 | 0.8% |
| Trinidadian and Tobagonian | 2 | 0.1% | View All 24 Rows |
Immigrants in Virginia
The most numerous immigrant groups reported in Virginia came from Africa (17 | 1.1%), Western Africa (11 | 0.7%), Asia (1 | 0.1%), Philippines (1 | 0.1%), and South Eastern Asia (1 | 0.1%), together accounting for 2.1% of all Virginia residents.
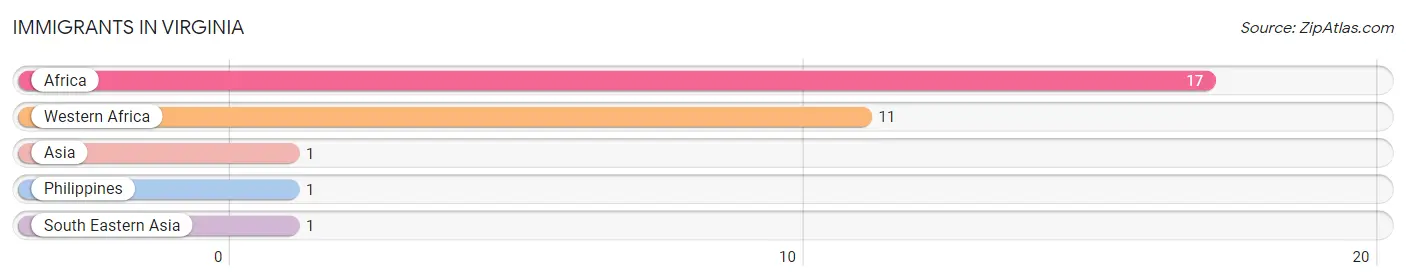
| Immigration Origin | # Population | % Population |
| Africa | 17 | 1.1% |
| Asia | 1 | 0.1% |
| Philippines | 1 | 0.1% |
| South Eastern Asia | 1 | 0.1% |
| Western Africa | 11 | 0.7% | View All 5 Rows |
Sex and Age in Virginia
Sex and Age in Virginia
The most populous age groups in Virginia are 60 to 64 Years (81 | 11.4%) for men and 10 to 14 Years (108 | 13.9%) for women.
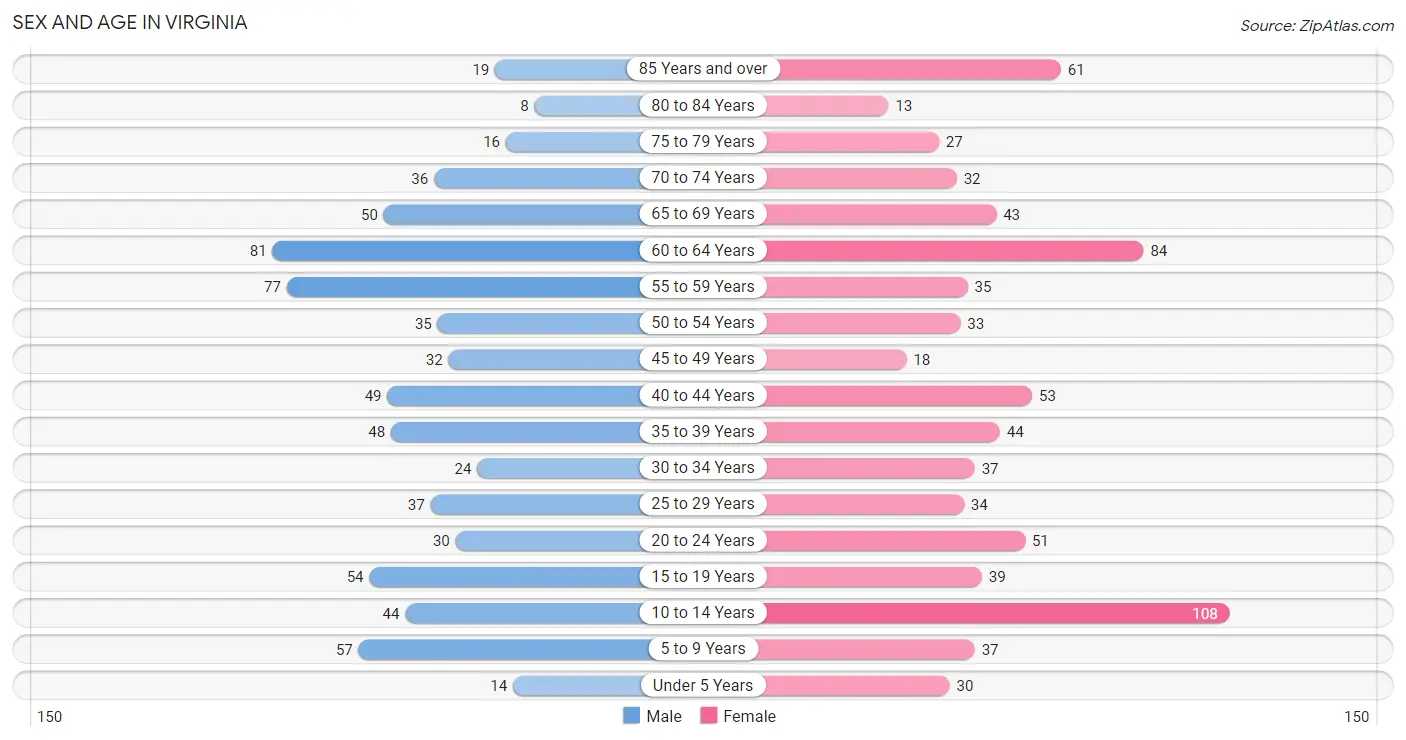
| Age Bracket | Male | Female |
| Under 5 Years | 14 (2.0%) | 30 (3.8%) |
| 5 to 9 Years | 57 (8.0%) | 37 (4.8%) |
| 10 to 14 Years | 44 (6.2%) | 108 (13.9%) |
| 15 to 19 Years | 54 (7.6%) | 39 (5.0%) |
| 20 to 24 Years | 30 (4.2%) | 51 (6.6%) |
| 25 to 29 Years | 37 (5.2%) | 34 (4.4%) |
| 30 to 34 Years | 24 (3.4%) | 37 (4.8%) |
| 35 to 39 Years | 48 (6.8%) | 44 (5.7%) |
| 40 to 44 Years | 49 (6.9%) | 53 (6.8%) |
| 45 to 49 Years | 32 (4.5%) | 18 (2.3%) |
| 50 to 54 Years | 35 (4.9%) | 33 (4.2%) |
| 55 to 59 Years | 77 (10.8%) | 35 (4.5%) |
| 60 to 64 Years | 81 (11.4%) | 84 (10.8%) |
| 65 to 69 Years | 50 (7.0%) | 43 (5.5%) |
| 70 to 74 Years | 36 (5.1%) | 32 (4.1%) |
| 75 to 79 Years | 16 (2.2%) | 27 (3.5%) |
| 80 to 84 Years | 8 (1.1%) | 13 (1.7%) |
| 85 Years and over | 19 (2.7%) | 61 (7.8%) |
| Total | 711 (100.0%) | 779 (100.0%) |
Families and Households in Virginia
Median Family Size in Virginia
The median family size in Virginia is 2.92 persons per family, with married-couple families (269 | 67.4%) accounting for the largest median family size of 3.17 persons per family. On the other hand, single female/mother families (62 | 15.5%) represent the smallest median family size with 2.35 persons per family.
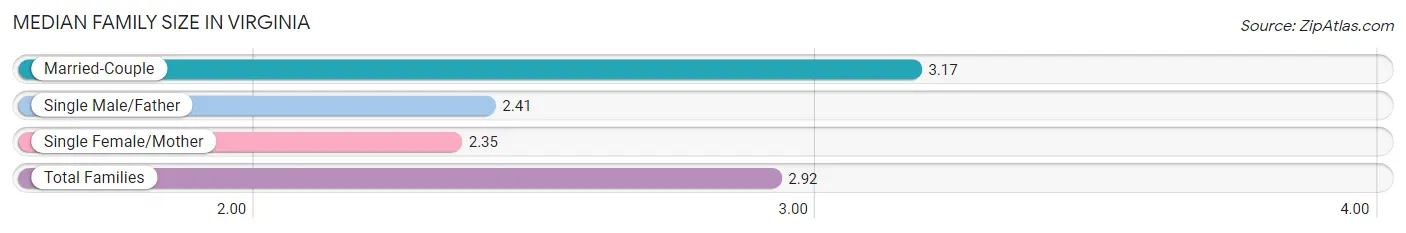
| Family Type | # Families | Family Size |
| Married-Couple | 269 (67.4%) | 3.17 |
| Single Male/Father | 68 (17.0%) | 2.41 |
| Single Female/Mother | 62 (15.5%) | 2.35 |
| Total Families | 399 (100.0%) | 2.92 |
Median Household Size in Virginia
The median household size in Virginia is 2.36 persons per household, with married-couple households (269 | 43.8%) accounting for the largest median household size of 3.17 persons per household. non-family households (215 | 35.0%) represent the smallest median household size with 1.17 persons per household.
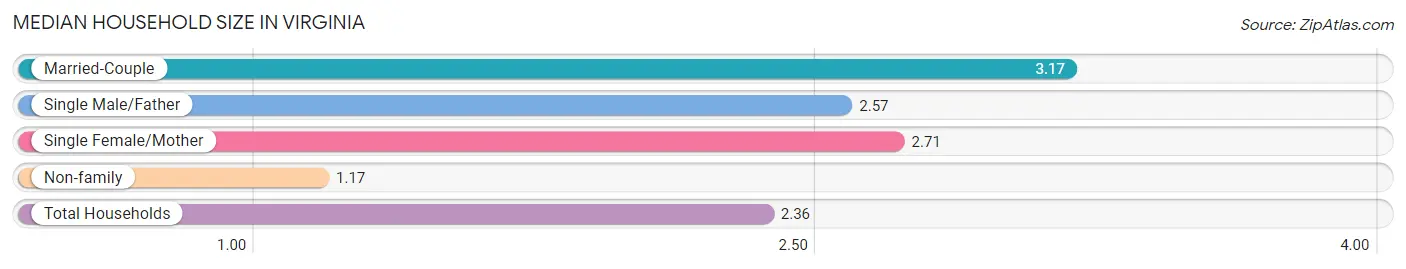
| Household Type | # Households | Household Size |
| Married-Couple | 269 (43.8%) | 3.17 |
| Single Male/Father | 68 (11.1%) | 2.57 |
| Single Female/Mother | 62 (10.1%) | 2.71 |
| Non-family | 215 (35.0%) | 1.17 |
| Total Households | 614 (100.0%) | 2.36 |
Household Size by Marriage Status in Virginia
Out of a total of 614 households in Virginia, 399 (65.0%) are family households, while 215 (35.0%) are nonfamily households. The most numerous type of family households are 2-person households, comprising 207, and the most common type of nonfamily households are 1-person households, comprising 186.
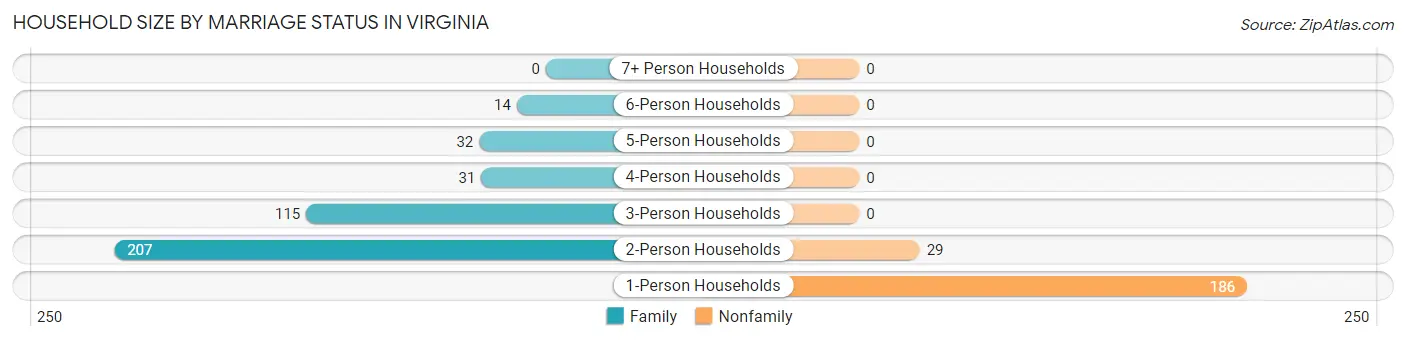
| Household Size | Family Households | Nonfamily Households |
| 1-Person Households | - | 186 (30.3%) |
| 2-Person Households | 207 (33.7%) | 29 (4.7%) |
| 3-Person Households | 115 (18.7%) | 0 (0.0%) |
| 4-Person Households | 31 (5.1%) | 0 (0.0%) |
| 5-Person Households | 32 (5.2%) | 0 (0.0%) |
| 6-Person Households | 14 (2.3%) | 0 (0.0%) |
| 7+ Person Households | 0 (0.0%) | 0 (0.0%) |
| Total | 399 (65.0%) | 215 (35.0%) |
Female Fertility in Virginia
Fertility by Age in Virginia
Average fertility rate in Virginia is 39.0 births per 1,000 women. Women in the age bracket of 20 to 34 years have the highest fertility rate with 90.0 births per 1,000 women. Women in the age bracket of 20 to 34 years acount for 100.0% of all women with births.
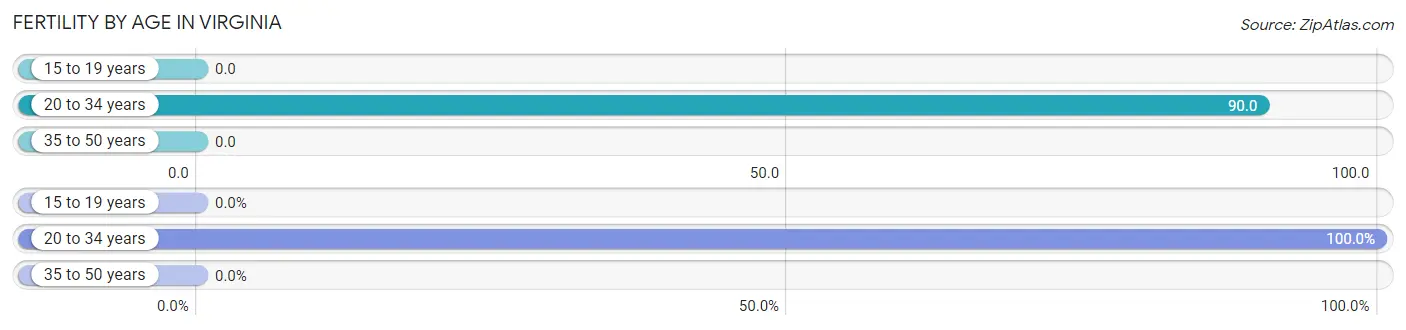
| Age Bracket | Women with Births | Births / 1,000 Women |
| 15 to 19 years | 0 (0.0%) | 0.0 |
| 20 to 34 years | 11 (100.0%) | 90.0 |
| 35 to 50 years | 0 (0.0%) | 0.0 |
| Total | 11 (100.0%) | 39.0 |
Fertility by Age by Marriage Status in Virginia
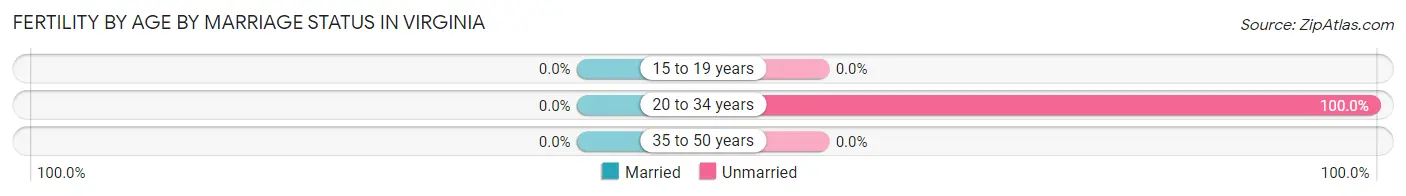
| Age Bracket | Married | Unmarried |
| 15 to 19 years | 0 (0.0%) | 0 (0.0%) |
| 20 to 34 years | 0 (0.0%) | 11 (100.0%) |
| 35 to 50 years | 0 (0.0%) | 0 (0.0%) |
| Total | 0 (0.0%) | 11 (100.0%) |
Fertility by Education in Virginia
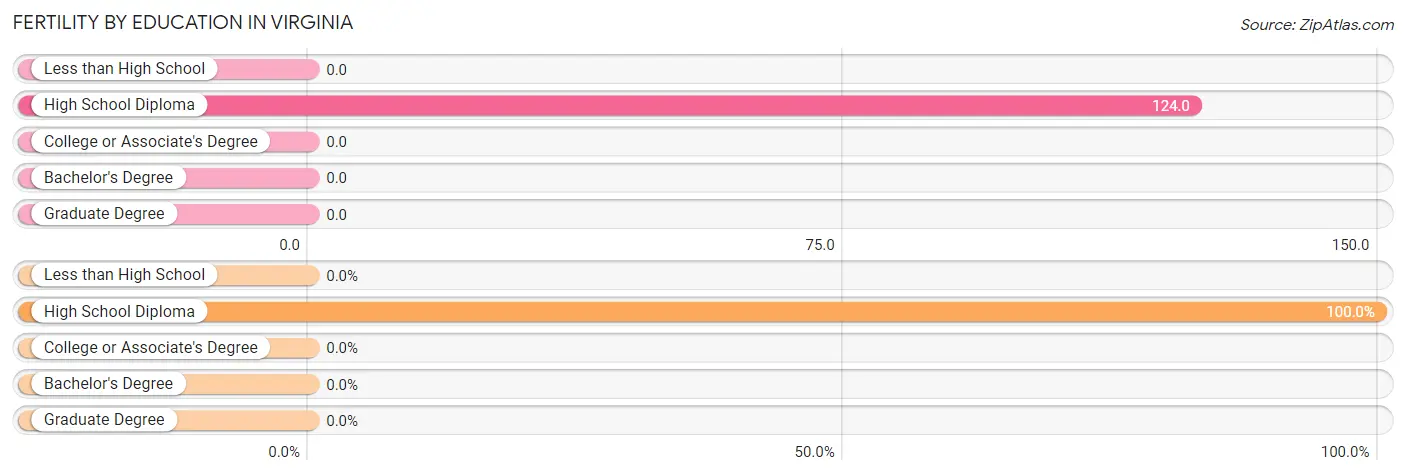
| Educational Attainment | Women with Births | Births / 1,000 Women |
| Less than High School | 0 (0.0%) | 0.0 |
| High School Diploma | 11 (100.0%) | 124.0 |
| College or Associate's Degree | 0 (0.0%) | 0.0 |
| Bachelor's Degree | 0 (0.0%) | 0.0 |
| Graduate Degree | 0 (0.0%) | 0.0 |
| Total | 11 (100.0%) | 39.0 |
Fertility by Education by Marriage Status in Virginia
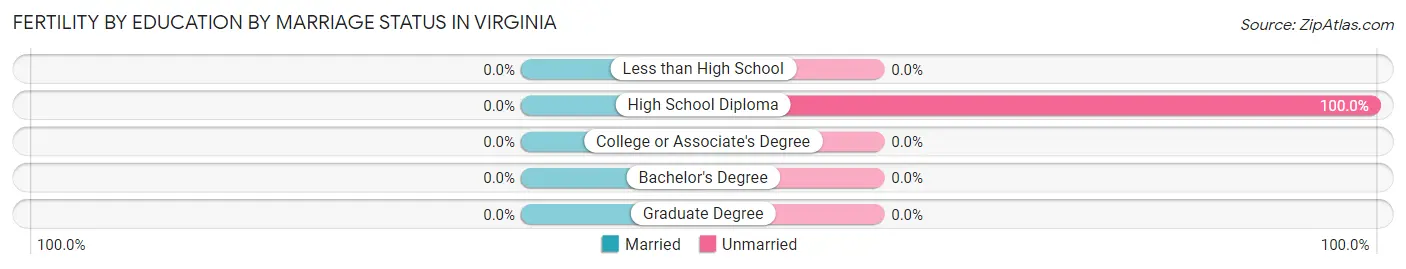
| Educational Attainment | Married | Unmarried |
| Less than High School | 0 (0.0%) | 0 (0.0%) |
| High School Diploma | 0 (0.0%) | 11 (100.0%) |
| College or Associate's Degree | 0 (0.0%) | 0 (0.0%) |
| Bachelor's Degree | 0 (0.0%) | 0 (0.0%) |
| Graduate Degree | 0 (0.0%) | 0 (0.0%) |
| Total | 0 (0.0%) | 11 (100.0%) |
Employment Characteristics in Virginia
Employment by Class of Employer in Virginia
Among the 692 employed individuals in Virginia, private company employees (482 | 69.7%), local government employees (87 | 12.6%), and not-for-profit organizations (52 | 7.5%) make up the most common classes of employment.
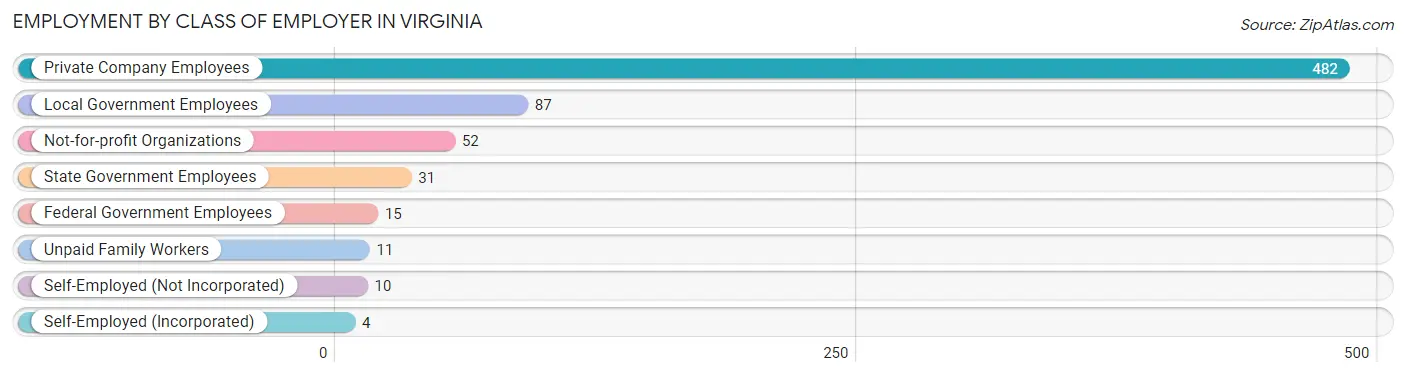
| Employer Class | # Employees | % Employees |
| Private Company Employees | 482 | 69.7% |
| Self-Employed (Incorporated) | 4 | 0.6% |
| Self-Employed (Not Incorporated) | 10 | 1.5% |
| Not-for-profit Organizations | 52 | 7.5% |
| Local Government Employees | 87 | 12.6% |
| State Government Employees | 31 | 4.5% |
| Federal Government Employees | 15 | 2.2% |
| Unpaid Family Workers | 11 | 1.6% |
| Total | 692 | 100.0% |
Employment Status by Age in Virginia
According to the labor force statistics for Virginia, out of the total population over 16 years of age (1,176), 61.6% or 724 individuals are in the labor force, with 3.7% or 27 of them unemployed. The age group with the highest labor force participation rate is 30 to 34 years, with 96.7% or 59 individuals in the labor force. Within the labor force, the 45 to 54 years age range has the highest percentage of unemployed individuals, with 10.5% or 11 of them being unemployed.
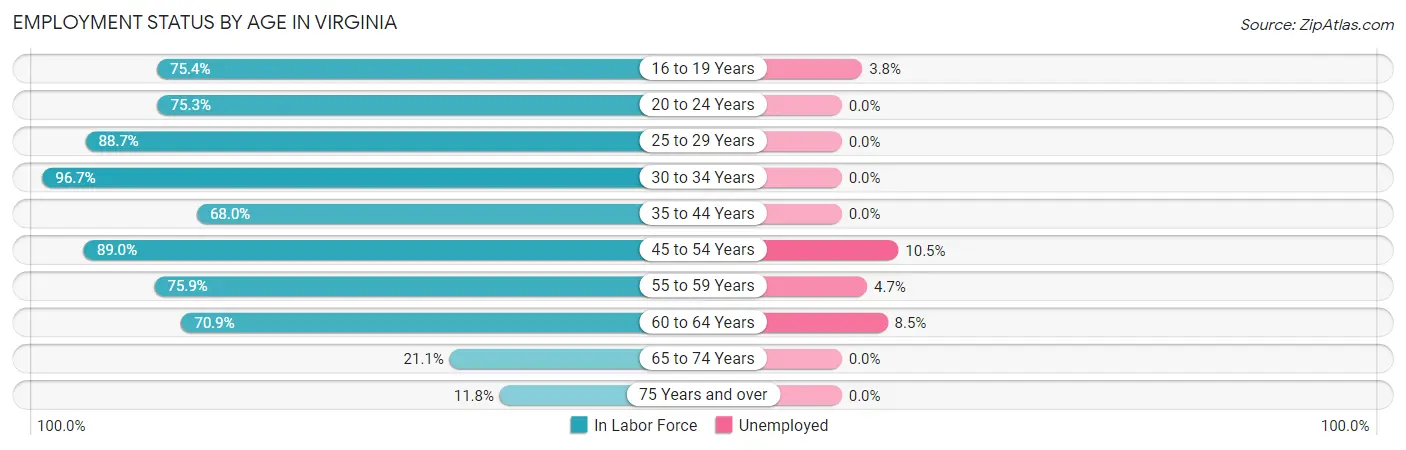
| Age Bracket | In Labor Force | Unemployed |
| 16 to 19 Years | 52 (75.4%) | 2 (3.8%) |
| 20 to 24 Years | 61 (75.3%) | 0 (0.0%) |
| 25 to 29 Years | 63 (88.7%) | 0 (0.0%) |
| 30 to 34 Years | 59 (96.7%) | 0 (0.0%) |
| 35 to 44 Years | 132 (68.0%) | 0 (0.0%) |
| 45 to 54 Years | 105 (89.0%) | 11 (10.5%) |
| 55 to 59 Years | 85 (75.9%) | 4 (4.7%) |
| 60 to 64 Years | 117 (70.9%) | 10 (8.5%) |
| 65 to 74 Years | 34 (21.1%) | 0 (0.0%) |
| 75 Years and over | 17 (11.8%) | 0 (0.0%) |
| Total | 724 (61.6%) | 27 (3.7%) |
Employment Status by Educational Attainment in Virginia
According to labor force statistics for Virginia, 77.8% of individuals (561) out of the total population between 25 and 64 years of age (721) are in the labor force, with 4.5% or 25 of them being unemployed. The group with the highest labor force participation rate are those with the educational attainment of bachelor's degree or higher, with 94.2% or 97 individuals in the labor force. Within the labor force, individuals with less than high school education have the highest percentage of unemployment, with 22.4% or 11 of them being unemployed.
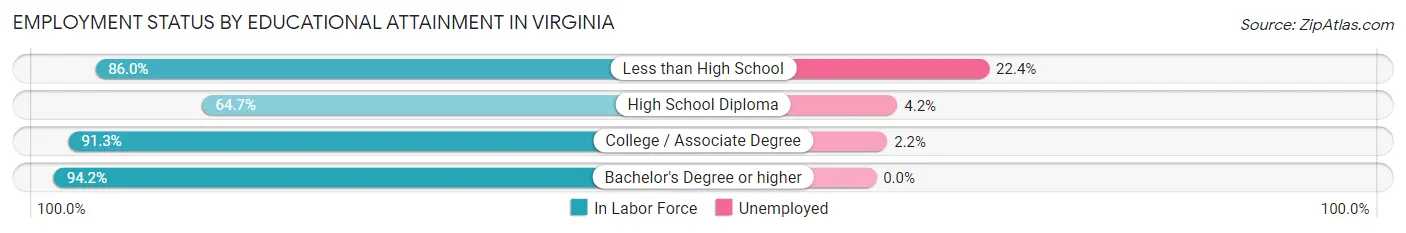
| Educational Attainment | In Labor Force | Unemployed |
| Less than High School | 49 (86.0%) | 13 (22.4%) |
| High School Diploma | 236 (64.7%) | 15 (4.2%) |
| College / Associate Degree | 179 (91.3%) | 4 (2.2%) |
| Bachelor's Degree or higher | 97 (94.2%) | 0 (0.0%) |
| Total | 561 (77.8%) | 32 (4.5%) |
Employment Occupations by Sex in Virginia
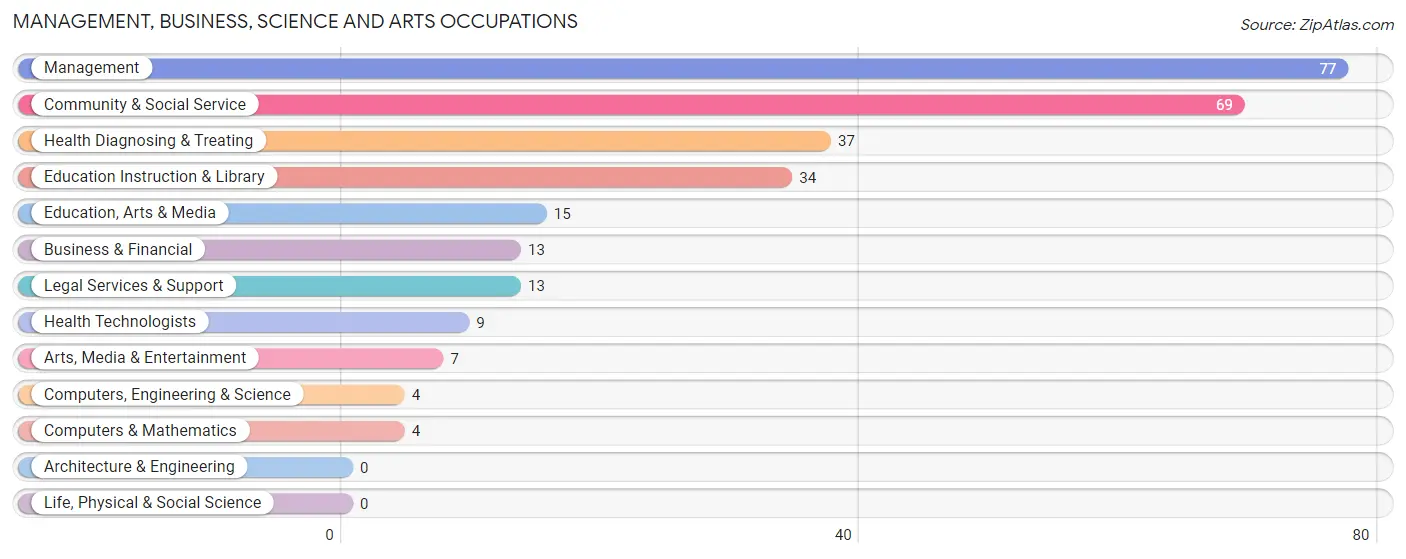
Management, Business, Science and Arts Occupations
The most common Management, Business, Science and Arts occupations in Virginia are Management (77 | 11.0%), Community & Social Service (69 | 9.9%), Health Diagnosing & Treating (37 | 5.3%), Education Instruction & Library (34 | 4.9%), and Education, Arts & Media (15 | 2.1%).
Management, Business, Science and Arts Occupations by Sex
Within the Management, Business, Science and Arts occupations in Virginia, the most male-oriented occupations are Computers, Engineering & Science (100.0%), Computers & Mathematics (100.0%), and Arts, Media & Entertainment (85.7%), while the most female-oriented occupations are Health Technologists (100.0%), Health Diagnosing & Treating (91.9%), and Education Instruction & Library (76.5%).
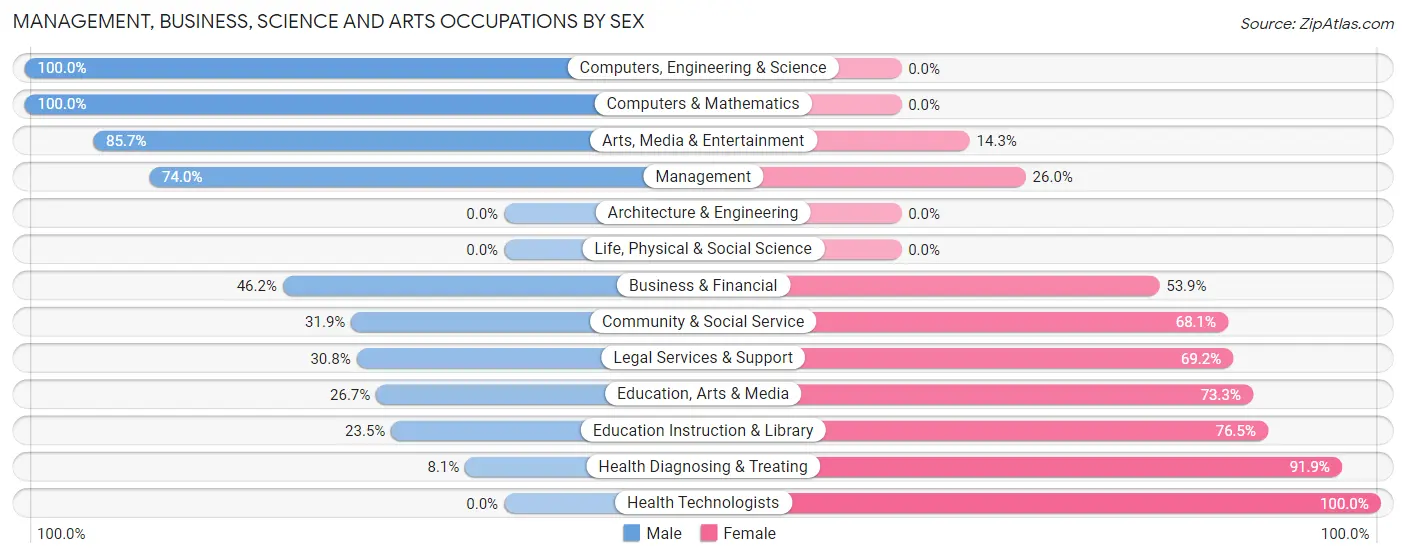
| Occupation | Male | Female |
| Management | 57 (74.0%) | 20 (26.0%) |
| Business & Financial | 6 (46.2%) | 7 (53.8%) |
| Computers, Engineering & Science | 4 (100.0%) | 0 (0.0%) |
| Computers & Mathematics | 4 (100.0%) | 0 (0.0%) |
| Architecture & Engineering | 0 (0.0%) | 0 (0.0%) |
| Life, Physical & Social Science | 0 (0.0%) | 0 (0.0%) |
| Community & Social Service | 22 (31.9%) | 47 (68.1%) |
| Education, Arts & Media | 4 (26.7%) | 11 (73.3%) |
| Legal Services & Support | 4 (30.8%) | 9 (69.2%) |
| Education Instruction & Library | 8 (23.5%) | 26 (76.5%) |
| Arts, Media & Entertainment | 6 (85.7%) | 1 (14.3%) |
| Health Diagnosing & Treating | 3 (8.1%) | 34 (91.9%) |
| Health Technologists | 0 (0.0%) | 9 (100.0%) |
| Total (Category) | 92 (46.0%) | 108 (54.0%) |
| Total (Overall) | 359 (51.4%) | 339 (48.6%) |
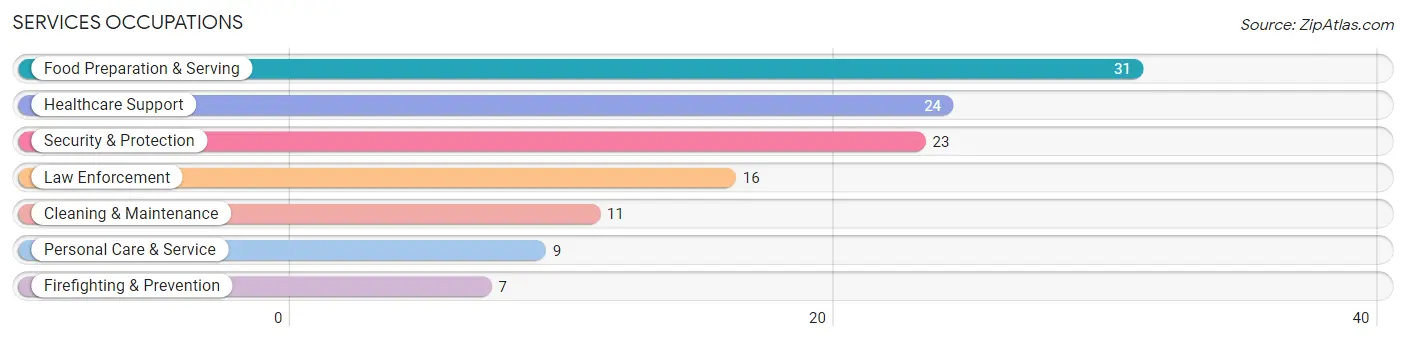
Services Occupations
The most common Services occupations in Virginia are Food Preparation & Serving (31 | 4.4%), Healthcare Support (24 | 3.4%), Security & Protection (23 | 3.3%), Law Enforcement (16 | 2.3%), and Cleaning & Maintenance (11 | 1.6%).
Services Occupations by Sex
Within the Services occupations in Virginia, the most male-oriented occupations are Law Enforcement (100.0%), Cleaning & Maintenance (100.0%), and Security & Protection (87.0%), while the most female-oriented occupations are Healthcare Support (100.0%), Food Preparation & Serving (83.9%), and Firefighting & Prevention (42.9%).
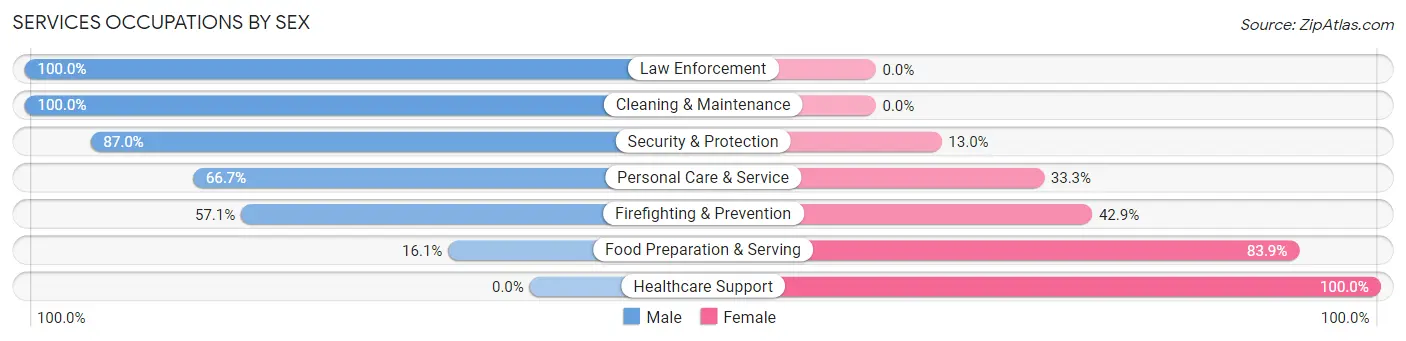
| Occupation | Male | Female |
| Healthcare Support | 0 (0.0%) | 24 (100.0%) |
| Security & Protection | 20 (87.0%) | 3 (13.0%) |
| Firefighting & Prevention | 4 (57.1%) | 3 (42.9%) |
| Law Enforcement | 16 (100.0%) | 0 (0.0%) |
| Food Preparation & Serving | 5 (16.1%) | 26 (83.9%) |
| Cleaning & Maintenance | 11 (100.0%) | 0 (0.0%) |
| Personal Care & Service | 6 (66.7%) | 3 (33.3%) |
| Total (Category) | 42 (42.9%) | 56 (57.1%) |
| Total (Overall) | 359 (51.4%) | 339 (48.6%) |
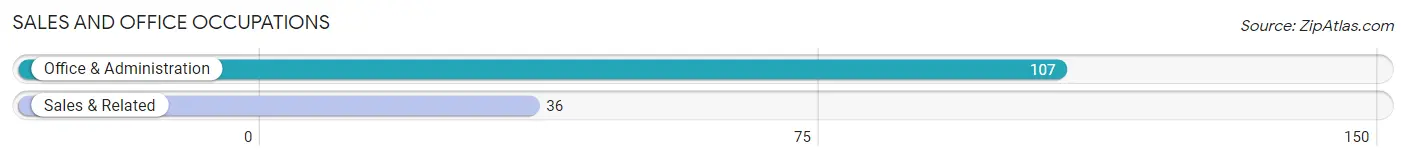
Sales and Office Occupations
The most common Sales and Office occupations in Virginia are Office & Administration (107 | 15.3%), and Sales & Related (36 | 5.2%).
Sales and Office Occupations by Sex
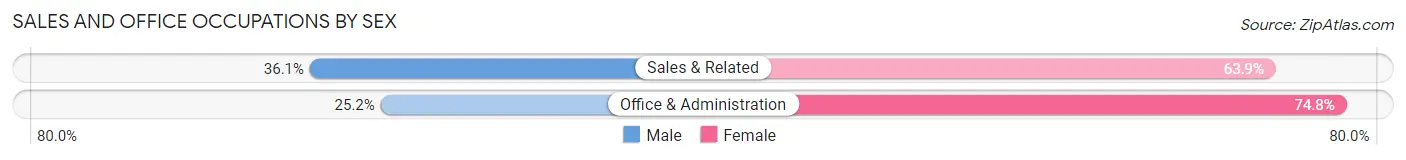
| Occupation | Male | Female |
| Sales & Related | 13 (36.1%) | 23 (63.9%) |
| Office & Administration | 27 (25.2%) | 80 (74.8%) |
| Total (Category) | 40 (28.0%) | 103 (72.0%) |
| Total (Overall) | 359 (51.4%) | 339 (48.6%) |
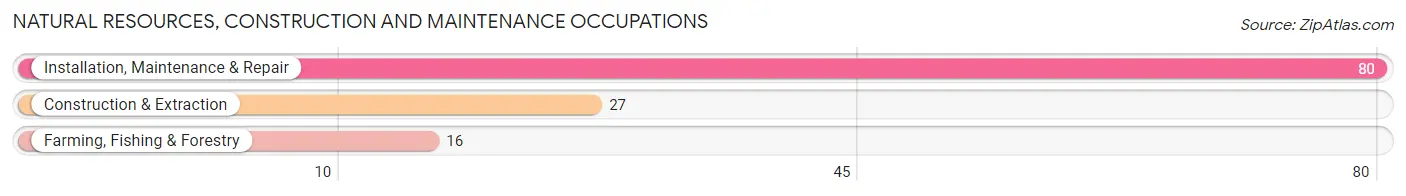
Natural Resources, Construction and Maintenance Occupations
The most common Natural Resources, Construction and Maintenance occupations in Virginia are Installation, Maintenance & Repair (80 | 11.5%), Construction & Extraction (27 | 3.9%), and Farming, Fishing & Forestry (16 | 2.3%).
Natural Resources, Construction and Maintenance Occupations by Sex
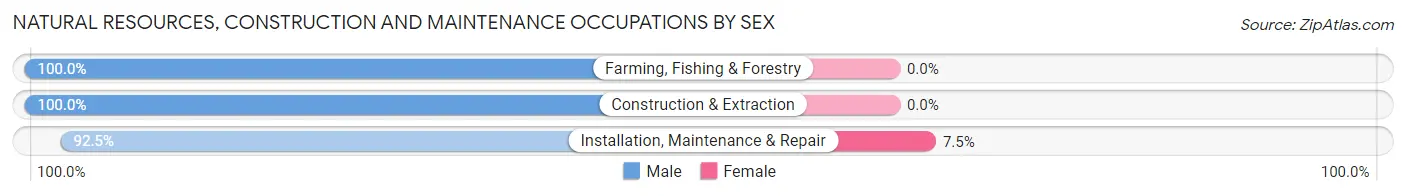
| Occupation | Male | Female |
| Farming, Fishing & Forestry | 16 (100.0%) | 0 (0.0%) |
| Construction & Extraction | 27 (100.0%) | 0 (0.0%) |
| Installation, Maintenance & Repair | 74 (92.5%) | 6 (7.5%) |
| Total (Category) | 117 (95.1%) | 6 (4.9%) |
| Total (Overall) | 359 (51.4%) | 339 (48.6%) |
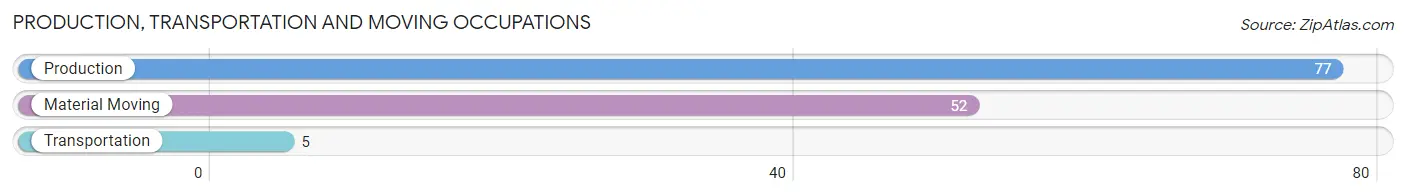
Production, Transportation and Moving Occupations
The most common Production, Transportation and Moving occupations in Virginia are Production (77 | 11.0%), Material Moving (52 | 7.4%), and Transportation (5 | 0.7%).
Production, Transportation and Moving Occupations by Sex
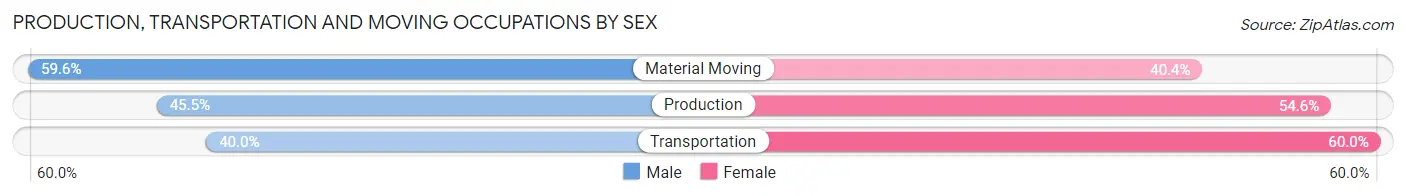
| Occupation | Male | Female |
| Production | 35 (45.5%) | 42 (54.5%) |
| Transportation | 2 (40.0%) | 3 (60.0%) |
| Material Moving | 31 (59.6%) | 21 (40.4%) |
| Total (Category) | 68 (50.7%) | 66 (49.2%) |
| Total (Overall) | 359 (51.4%) | 339 (48.6%) |
Employment Industries by Sex in Virginia
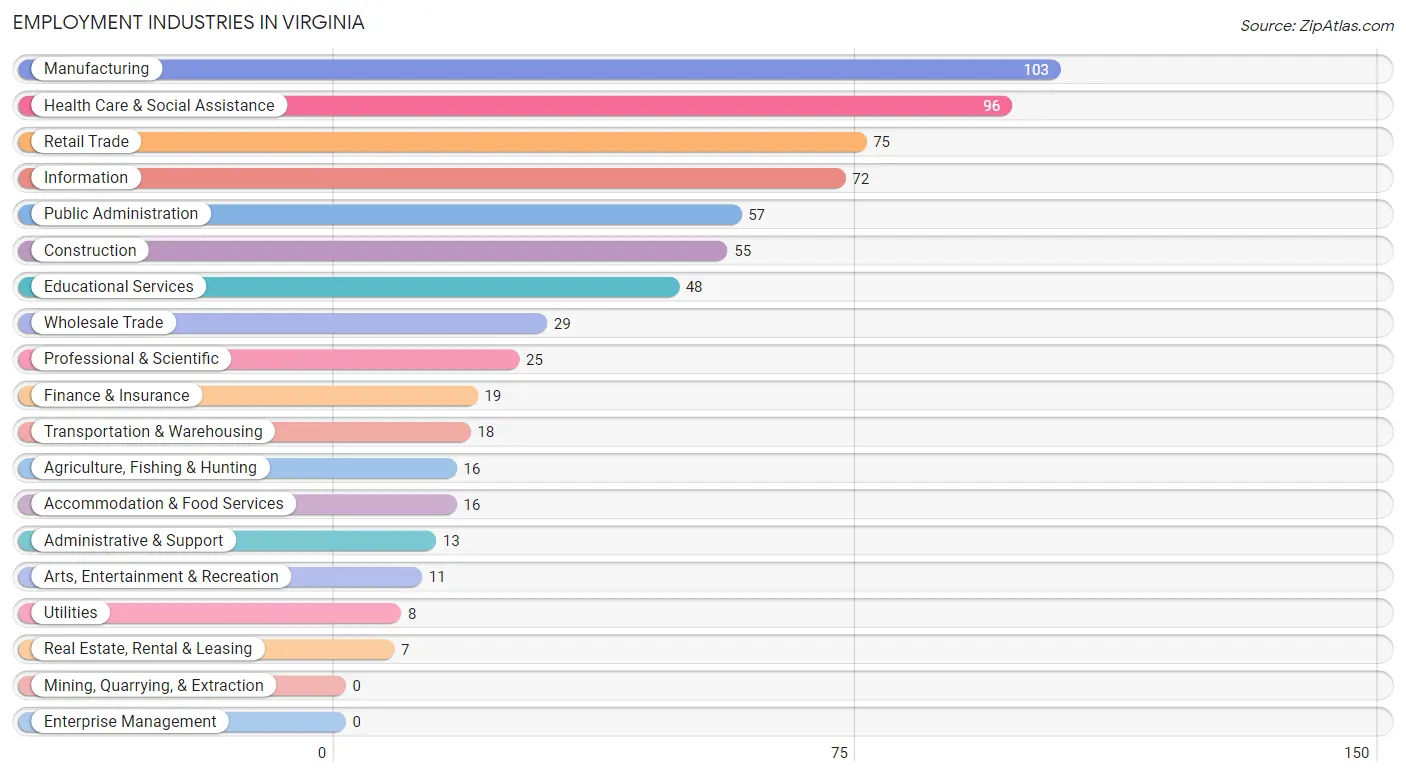
Employment Industries in Virginia
The major employment industries in Virginia include Manufacturing (103 | 14.8%), Health Care & Social Assistance (96 | 13.8%), Retail Trade (75 | 10.7%), Information (72 | 10.3%), and Public Administration (57 | 8.2%).
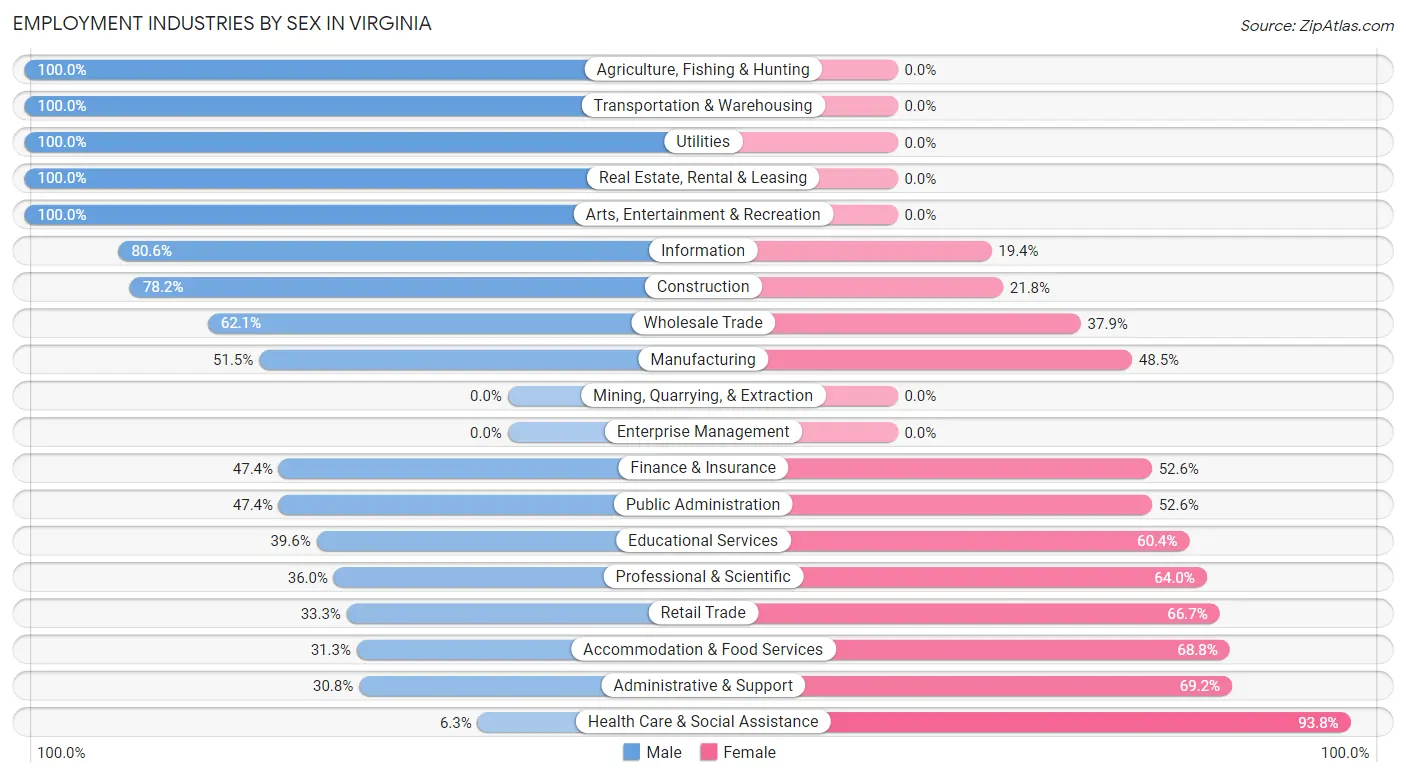
Employment Industries by Sex in Virginia
The Virginia industries that see more men than women are Agriculture, Fishing & Hunting (100.0%), Transportation & Warehousing (100.0%), and Utilities (100.0%), whereas the industries that tend to have a higher number of women are Health Care & Social Assistance (93.8%), Administrative & Support (69.2%), and Accommodation & Food Services (68.8%).
| Industry | Male | Female |
| Agriculture, Fishing & Hunting | 16 (100.0%) | 0 (0.0%) |
| Mining, Quarrying, & Extraction | 0 (0.0%) | 0 (0.0%) |
| Construction | 43 (78.2%) | 12 (21.8%) |
| Manufacturing | 53 (51.5%) | 50 (48.5%) |
| Wholesale Trade | 18 (62.1%) | 11 (37.9%) |
| Retail Trade | 25 (33.3%) | 50 (66.7%) |
| Transportation & Warehousing | 18 (100.0%) | 0 (0.0%) |
| Utilities | 8 (100.0%) | 0 (0.0%) |
| Information | 58 (80.6%) | 14 (19.4%) |
| Finance & Insurance | 9 (47.4%) | 10 (52.6%) |
| Real Estate, Rental & Leasing | 7 (100.0%) | 0 (0.0%) |
| Professional & Scientific | 9 (36.0%) | 16 (64.0%) |
| Enterprise Management | 0 (0.0%) | 0 (0.0%) |
| Administrative & Support | 4 (30.8%) | 9 (69.2%) |
| Educational Services | 19 (39.6%) | 29 (60.4%) |
| Health Care & Social Assistance | 6 (6.2%) | 90 (93.8%) |
| Arts, Entertainment & Recreation | 11 (100.0%) | 0 (0.0%) |
| Accommodation & Food Services | 5 (31.2%) | 11 (68.8%) |
| Public Administration | 27 (47.4%) | 30 (52.6%) |
| Total | 359 (51.4%) | 339 (48.6%) |
Education in Virginia
School Enrollment in Virginia
The most common levels of schooling among the 374 students in Virginia are middle school (143 | 38.2%), elementary school (100 | 26.7%), and high school (71 | 19.0%).
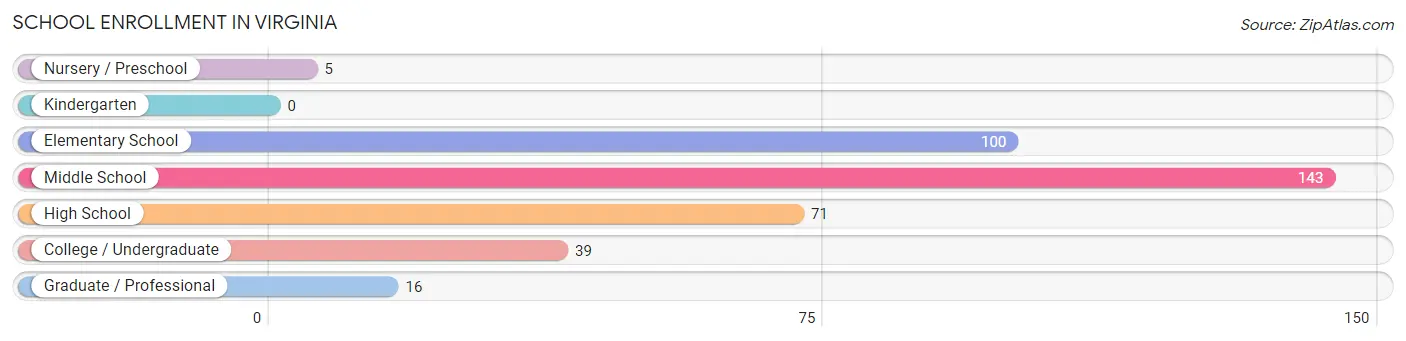
| School Level | # Students | % Students |
| Nursery / Preschool | 5 | 1.3% |
| Kindergarten | 0 | 0.0% |
| Elementary School | 100 | 26.7% |
| Middle School | 143 | 38.2% |
| High School | 71 | 19.0% |
| College / Undergraduate | 39 | 10.4% |
| Graduate / Professional | 16 | 4.3% |
| Total | 374 | 100.0% |
School Enrollment by Age by Funding Source in Virginia
Out of a total of 374 students who are enrolled in schools in Virginia, 41 (11.0%) attend a private institution, while the remaining 333 (89.0%) are enrolled in public schools. The age group of 35 years and over has the highest likelihood of being enrolled in private schools, with 13 (46.4% in the age bracket) enrolled. Conversely, the age group of 3 to 4 year olds has the lowest likelihood of being enrolled in a private school, with 5 (100.0% in the age bracket) attending a public institution.
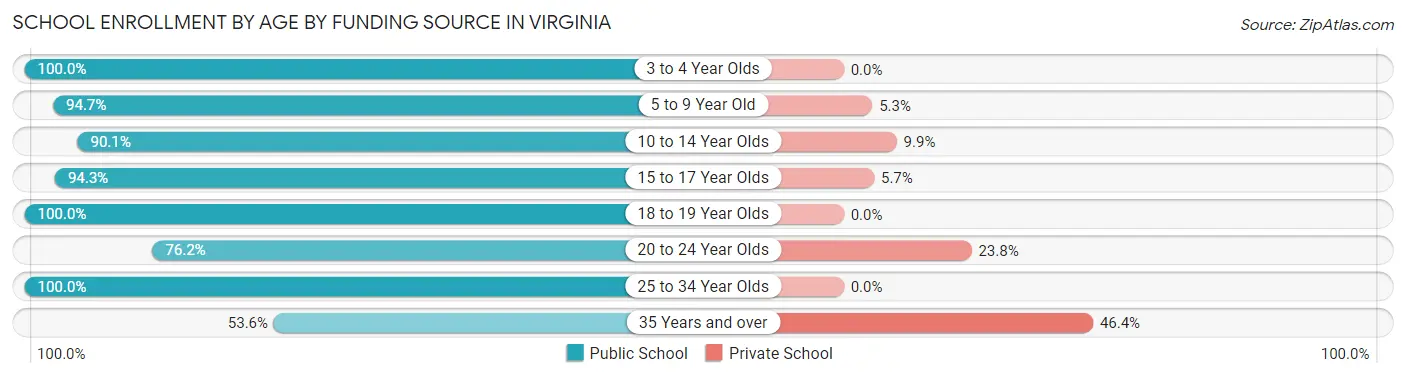
| Age Bracket | Public School | Private School |
| 3 to 4 Year Olds | 5 (100.0%) | 0 (0.0%) |
| 5 to 9 Year Old | 89 (94.7%) | 5 (5.3%) |
| 10 to 14 Year Olds | 137 (90.1%) | 15 (9.9%) |
| 15 to 17 Year Olds | 50 (94.3%) | 3 (5.7%) |
| 18 to 19 Year Olds | 18 (100.0%) | 0 (0.0%) |
| 20 to 24 Year Olds | 16 (76.2%) | 5 (23.8%) |
| 25 to 34 Year Olds | 3 (100.0%) | 0 (0.0%) |
| 35 Years and over | 15 (53.6%) | 13 (46.4%) |
| Total | 333 (89.0%) | 41 (11.0%) |
Educational Attainment by Field of Study in Virginia
Education (31 | 19.9%), business (24 | 15.4%), science & technology (23 | 14.7%), liberal arts & history (18 | 11.5%), and social sciences (15 | 9.6%) are the most common fields of study among 156 individuals in Virginia who have obtained a bachelor's degree or higher.
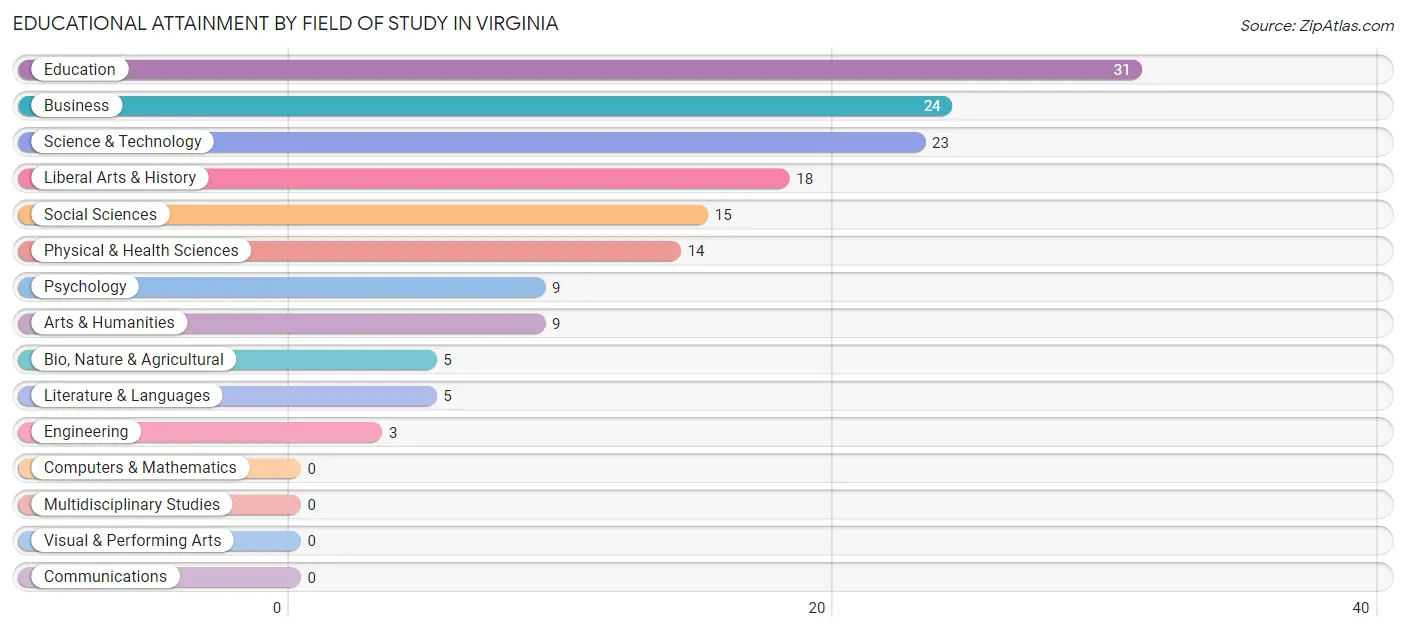
| Field of Study | # Graduates | % Graduates |
| Computers & Mathematics | 0 | 0.0% |
| Bio, Nature & Agricultural | 5 | 3.2% |
| Physical & Health Sciences | 14 | 9.0% |
| Psychology | 9 | 5.8% |
| Social Sciences | 15 | 9.6% |
| Engineering | 3 | 1.9% |
| Multidisciplinary Studies | 0 | 0.0% |
| Science & Technology | 23 | 14.7% |
| Business | 24 | 15.4% |
| Education | 31 | 19.9% |
| Literature & Languages | 5 | 3.2% |
| Liberal Arts & History | 18 | 11.5% |
| Visual & Performing Arts | 0 | 0.0% |
| Communications | 0 | 0.0% |
| Arts & Humanities | 9 | 5.8% |
| Total | 156 | 100.0% |
Transportation & Commute in Virginia
Vehicle Availability by Sex in Virginia
The most prevalent vehicle ownership categories in Virginia are males with 2 vehicles (201, accounting for 56.5%) and females with 2 vehicles (129, making up 59.8%).
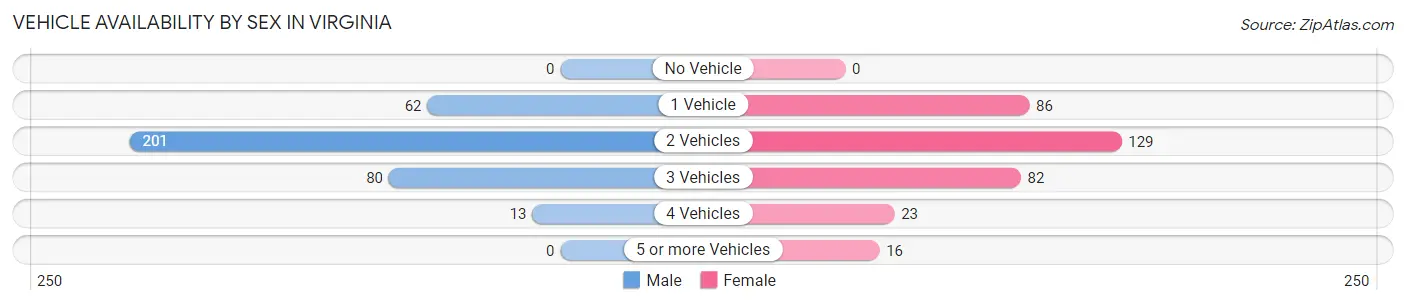
| Vehicles Available | Male | Female |
| No Vehicle | 0 (0.0%) | 0 (0.0%) |
| 1 Vehicle | 62 (17.4%) | 86 (25.6%) |
| 2 Vehicles | 201 (56.5%) | 129 (38.4%) |
| 3 Vehicles | 80 (22.5%) | 82 (24.4%) |
| 4 Vehicles | 13 (3.6%) | 23 (6.9%) |
| 5 or more Vehicles | 0 (0.0%) | 16 (4.8%) |
| Total | 356 (100.0%) | 336 (100.0%) |
Commute Time in Virginia
The most frequently occuring commute durations in Virginia are less than 5 minutes (165 commuters, 24.4%), 20 to 24 minutes (85 commuters, 12.6%), and 5 to 9 minutes (78 commuters, 11.5%).
| Commute Time | # Commuters | % Commuters |
| Less than 5 Minutes | 165 | 24.4% |
| 5 to 9 Minutes | 78 | 11.5% |
| 10 to 14 Minutes | 69 | 10.2% |
| 15 to 19 Minutes | 35 | 5.2% |
| 20 to 24 Minutes | 85 | 12.6% |
| 25 to 29 Minutes | 21 | 3.1% |
| 30 to 34 Minutes | 63 | 9.3% |
| 35 to 39 Minutes | 38 | 5.6% |
| 40 to 44 Minutes | 26 | 3.8% |
| 45 to 59 Minutes | 75 | 11.1% |
| 60 to 89 Minutes | 14 | 2.1% |
| 90 or more Minutes | 7 | 1.0% |
Commute Time by Sex in Virginia
The most common commute times in Virginia are less than 5 minutes (102 commuters, 29.4%) for males and less than 5 minutes (63 commuters, 19.2%) for females.
| Commute Time | Male | Female |
| Less than 5 Minutes | 102 (29.4%) | 63 (19.2%) |
| 5 to 9 Minutes | 31 (8.9%) | 47 (14.3%) |
| 10 to 14 Minutes | 43 (12.4%) | 26 (7.9%) |
| 15 to 19 Minutes | 14 (4.0%) | 21 (6.4%) |
| 20 to 24 Minutes | 35 (10.1%) | 50 (15.2%) |
| 25 to 29 Minutes | 10 (2.9%) | 11 (3.3%) |
| 30 to 34 Minutes | 19 (5.5%) | 44 (13.4%) |
| 35 to 39 Minutes | 26 (7.5%) | 12 (3.6%) |
| 40 to 44 Minutes | 21 (6.0%) | 5 (1.5%) |
| 45 to 59 Minutes | 28 (8.1%) | 47 (14.3%) |
| 60 to 89 Minutes | 11 (3.2%) | 3 (0.9%) |
| 90 or more Minutes | 7 (2.0%) | 0 (0.0%) |
Time of Departure to Work by Sex in Virginia
The most frequent times of departure to work in Virginia are 7:00 AM to 7:29 AM (88, 25.4%) for males and 7:00 AM to 7:29 AM (61, 18.5%) for females.
| Time of Departure | Male | Female |
| 12:00 AM to 4:59 AM | 11 (3.2%) | 17 (5.2%) |
| 5:00 AM to 5:29 AM | 26 (7.5%) | 20 (6.1%) |
| 5:30 AM to 5:59 AM | 12 (3.5%) | 19 (5.8%) |
| 6:00 AM to 6:29 AM | 48 (13.8%) | 16 (4.9%) |
| 6:30 AM to 6:59 AM | 19 (5.5%) | 29 (8.8%) |
| 7:00 AM to 7:29 AM | 88 (25.4%) | 61 (18.5%) |
| 7:30 AM to 7:59 AM | 75 (21.6%) | 56 (17.0%) |
| 8:00 AM to 8:29 AM | 4 (1.1%) | 35 (10.6%) |
| 8:30 AM to 8:59 AM | 7 (2.0%) | 12 (3.6%) |
| 9:00 AM to 9:59 AM | 4 (1.1%) | 8 (2.4%) |
| 10:00 AM to 10:59 AM | 0 (0.0%) | 0 (0.0%) |
| 11:00 AM to 11:59 AM | 0 (0.0%) | 0 (0.0%) |
| 12:00 PM to 3:59 PM | 26 (7.5%) | 22 (6.7%) |
| 4:00 PM to 11:59 PM | 27 (7.8%) | 34 (10.3%) |
| Total | 347 (100.0%) | 329 (100.0%) |
Housing Occupancy in Virginia
Occupancy by Ownership in Virginia
Of the total 614 dwellings in Virginia, owner-occupied units account for 411 (66.9%), while renter-occupied units make up 203 (33.1%).
| Occupancy | # Housing Units | % Housing Units |
| Owner Occupied Housing Units | 411 | 66.9% |
| Renter-Occupied Housing Units | 203 | 33.1% |
| Total Occupied Housing Units | 614 | 100.0% |
Occupancy by Household Size in Virginia
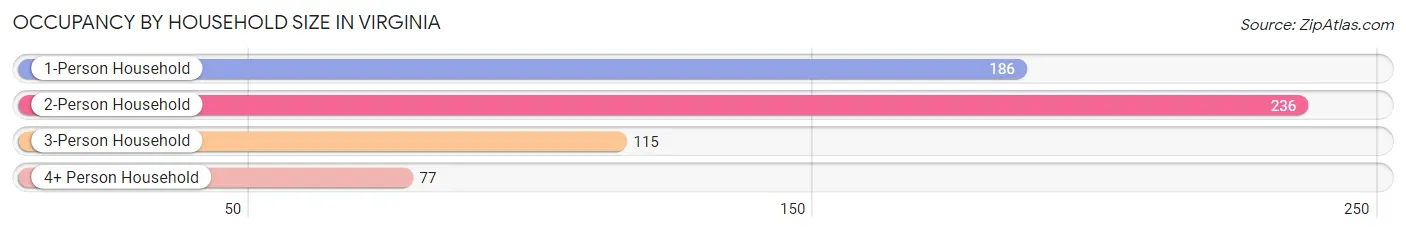
| Household Size | # Housing Units | % Housing Units |
| 1-Person Household | 186 | 30.3% |
| 2-Person Household | 236 | 38.4% |
| 3-Person Household | 115 | 18.7% |
| 4+ Person Household | 77 | 12.5% |
| Total Housing Units | 614 | 100.0% |
Occupancy by Ownership by Household Size in Virginia
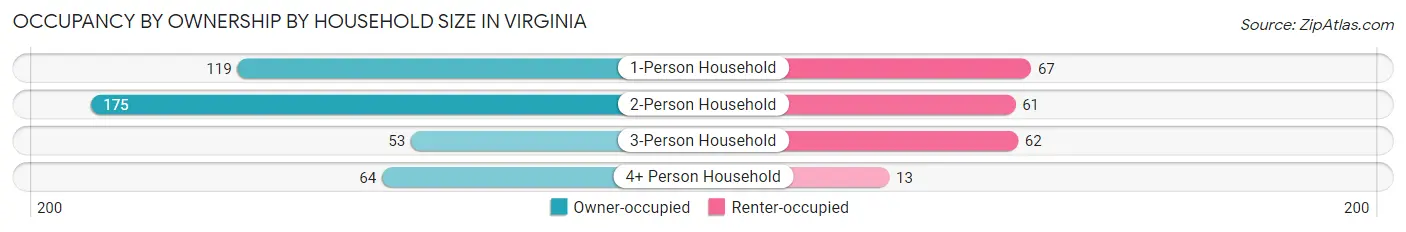
| Household Size | Owner-occupied | Renter-occupied |
| 1-Person Household | 119 (64.0%) | 67 (36.0%) |
| 2-Person Household | 175 (74.2%) | 61 (25.9%) |
| 3-Person Household | 53 (46.1%) | 62 (53.9%) |
| 4+ Person Household | 64 (83.1%) | 13 (16.9%) |
| Total Housing Units | 411 (66.9%) | 203 (33.1%) |
Occupancy by Educational Attainment in Virginia
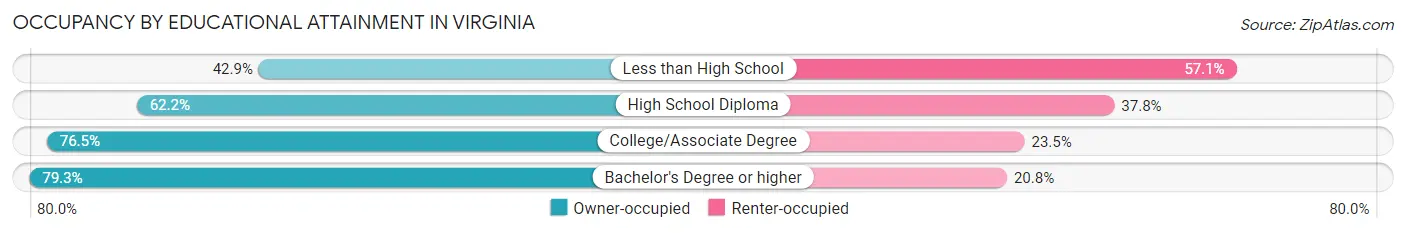
| Household Size | Owner-occupied | Renter-occupied |
| Less than High School | 24 (42.9%) | 32 (57.1%) |
| High School Diploma | 186 (62.2%) | 113 (37.8%) |
| College/Associate Degree | 117 (76.5%) | 36 (23.5%) |
| Bachelor's Degree or higher | 84 (79.2%) | 22 (20.7%) |
Occupancy by Age of Householder in Virginia
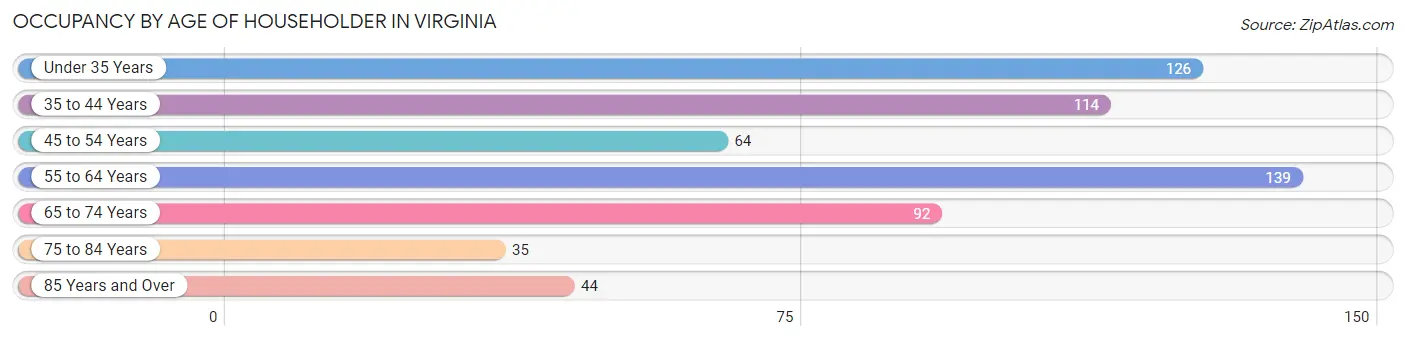
| Age Bracket | # Households | % Households |
| Under 35 Years | 126 | 20.5% |
| 35 to 44 Years | 114 | 18.6% |
| 45 to 54 Years | 64 | 10.4% |
| 55 to 64 Years | 139 | 22.6% |
| 65 to 74 Years | 92 | 15.0% |
| 75 to 84 Years | 35 | 5.7% |
| 85 Years and Over | 44 | 7.2% |
| Total | 614 | 100.0% |
Housing Finances in Virginia
Median Income by Occupancy in Virginia
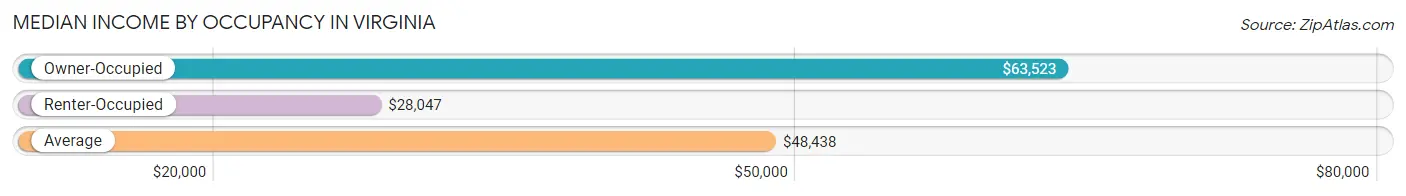
| Occupancy Type | # Households | Median Income |
| Owner-Occupied | 411 (66.9%) | $63,523 |
| Renter-Occupied | 203 (33.1%) | $28,047 |
| Average | 614 (100.0%) | $48,438 |
Occupancy by Householder Income Bracket in Virginia
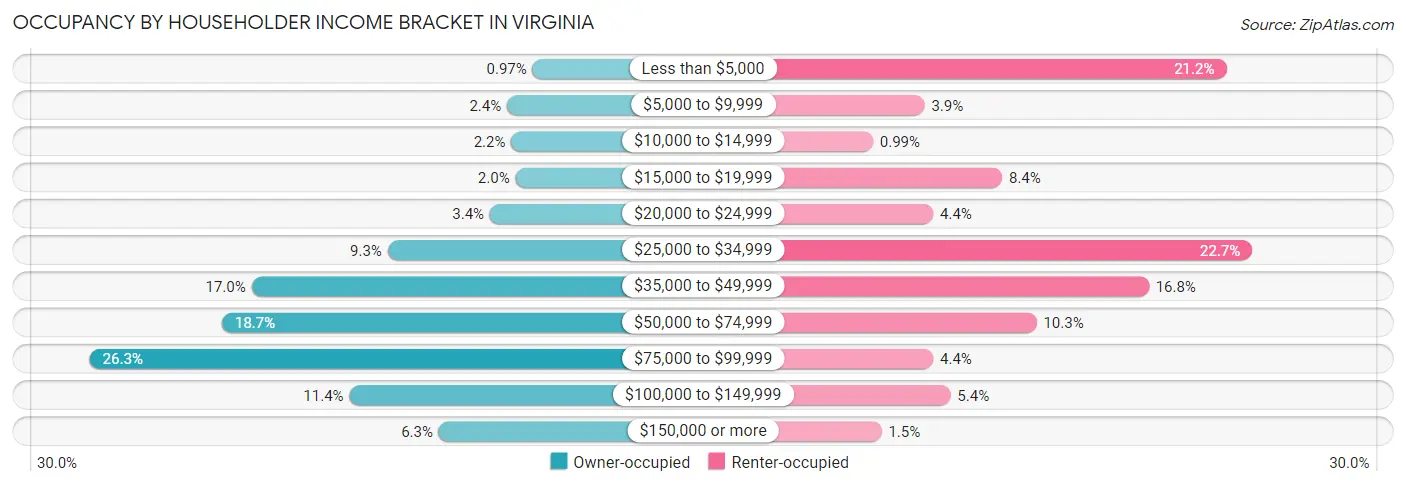
| Income Bracket | Owner-occupied | Renter-occupied |
| Less than $5,000 | 4 (1.0%) | 43 (21.2%) |
| $5,000 to $9,999 | 10 (2.4%) | 8 (3.9%) |
| $10,000 to $14,999 | 9 (2.2%) | 2 (1.0%) |
| $15,000 to $19,999 | 8 (1.9%) | 17 (8.4%) |
| $20,000 to $24,999 | 14 (3.4%) | 9 (4.4%) |
| $25,000 to $34,999 | 38 (9.2%) | 46 (22.7%) |
| $35,000 to $49,999 | 70 (17.0%) | 34 (16.8%) |
| $50,000 to $74,999 | 77 (18.7%) | 21 (10.3%) |
| $75,000 to $99,999 | 108 (26.3%) | 9 (4.4%) |
| $100,000 to $149,999 | 47 (11.4%) | 11 (5.4%) |
| $150,000 or more | 26 (6.3%) | 3 (1.5%) |
| Total | 411 (100.0%) | 203 (100.0%) |
Monthly Housing Cost Tiers in Virginia
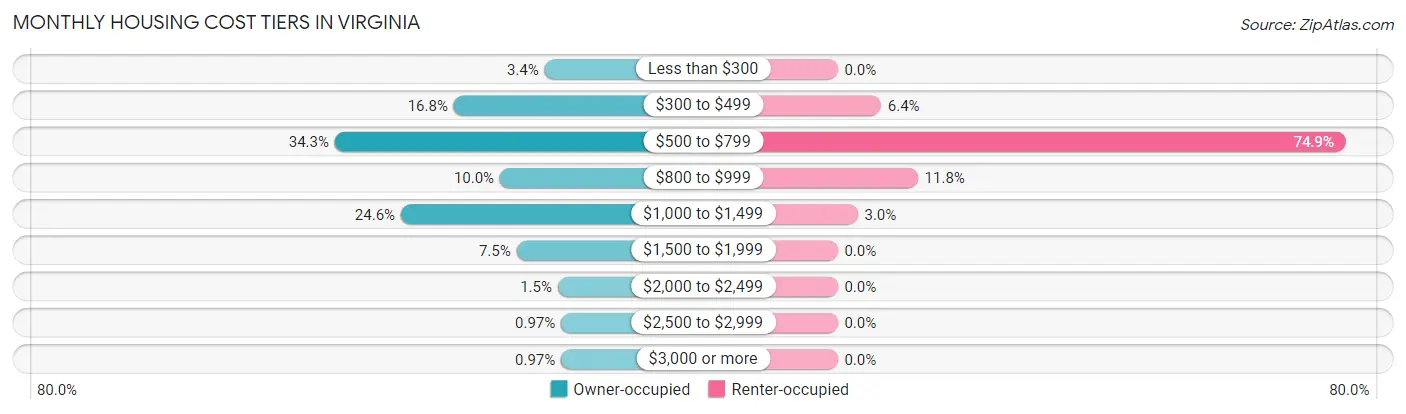
| Monthly Cost | Owner-occupied | Renter-occupied |
| Less than $300 | 14 (3.4%) | 0 (0.0%) |
| $300 to $499 | 69 (16.8%) | 13 (6.4%) |
| $500 to $799 | 141 (34.3%) | 152 (74.9%) |
| $800 to $999 | 41 (10.0%) | 24 (11.8%) |
| $1,000 to $1,499 | 101 (24.6%) | 6 (3.0%) |
| $1,500 to $1,999 | 31 (7.5%) | 0 (0.0%) |
| $2,000 to $2,499 | 6 (1.5%) | 0 (0.0%) |
| $2,500 to $2,999 | 4 (1.0%) | 0 (0.0%) |
| $3,000 or more | 4 (1.0%) | 0 (0.0%) |
| Total | 411 (100.0%) | 203 (100.0%) |
Physical Housing Characteristics in Virginia
Housing Structures in Virginia
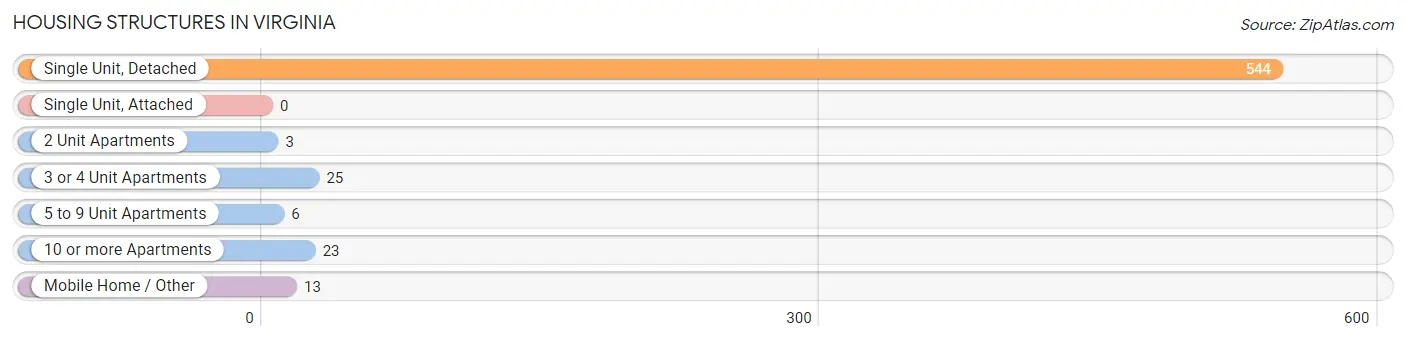
| Structure Type | # Housing Units | % Housing Units |
| Single Unit, Detached | 544 | 88.6% |
| Single Unit, Attached | 0 | 0.0% |
| 2 Unit Apartments | 3 | 0.5% |
| 3 or 4 Unit Apartments | 25 | 4.1% |
| 5 to 9 Unit Apartments | 6 | 1.0% |
| 10 or more Apartments | 23 | 3.7% |
| Mobile Home / Other | 13 | 2.1% |
| Total | 614 | 100.0% |
Housing Structures by Occupancy in Virginia
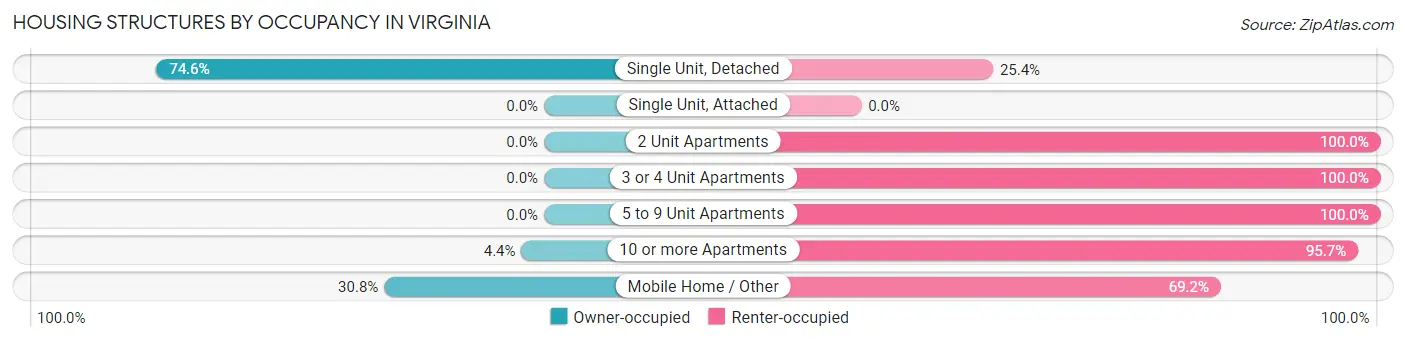
| Structure Type | Owner-occupied | Renter-occupied |
| Single Unit, Detached | 406 (74.6%) | 138 (25.4%) |
| Single Unit, Attached | 0 (0.0%) | 0 (0.0%) |
| 2 Unit Apartments | 0 (0.0%) | 3 (100.0%) |
| 3 or 4 Unit Apartments | 0 (0.0%) | 25 (100.0%) |
| 5 to 9 Unit Apartments | 0 (0.0%) | 6 (100.0%) |
| 10 or more Apartments | 1 (4.3%) | 22 (95.7%) |
| Mobile Home / Other | 4 (30.8%) | 9 (69.2%) |
| Total | 411 (66.9%) | 203 (33.1%) |
Housing Structures by Number of Rooms in Virginia
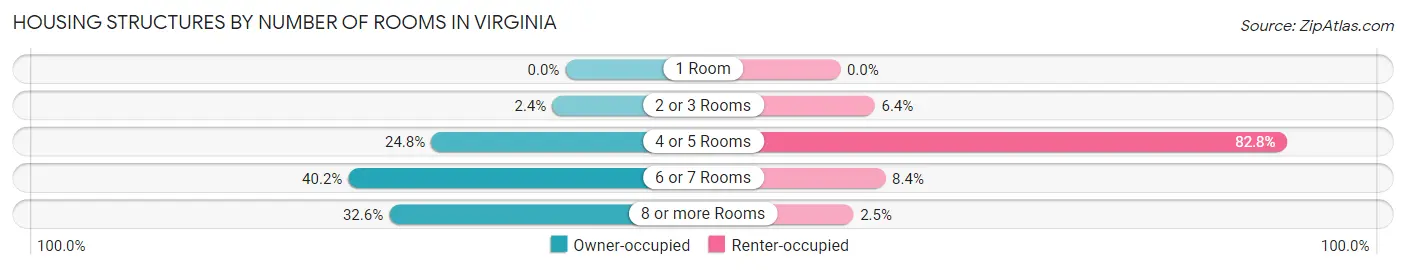
| Number of Rooms | Owner-occupied | Renter-occupied |
| 1 Room | 0 (0.0%) | 0 (0.0%) |
| 2 or 3 Rooms | 10 (2.4%) | 13 (6.4%) |
| 4 or 5 Rooms | 102 (24.8%) | 168 (82.8%) |
| 6 or 7 Rooms | 165 (40.2%) | 17 (8.4%) |
| 8 or more Rooms | 134 (32.6%) | 5 (2.5%) |
| Total | 411 (100.0%) | 203 (100.0%) |
Housing Structure by Heating Type in Virginia
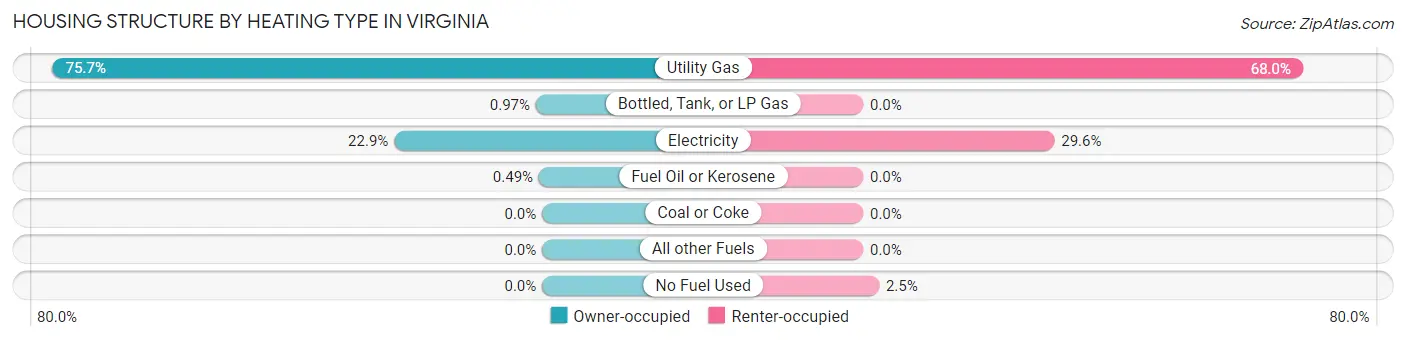
| Heating Type | Owner-occupied | Renter-occupied |
| Utility Gas | 311 (75.7%) | 138 (68.0%) |
| Bottled, Tank, or LP Gas | 4 (1.0%) | 0 (0.0%) |
| Electricity | 94 (22.9%) | 60 (29.6%) |
| Fuel Oil or Kerosene | 2 (0.5%) | 0 (0.0%) |
| Coal or Coke | 0 (0.0%) | 0 (0.0%) |
| All other Fuels | 0 (0.0%) | 0 (0.0%) |
| No Fuel Used | 0 (0.0%) | 5 (2.5%) |
| Total | 411 (100.0%) | 203 (100.0%) |
Household Vehicle Usage in Virginia
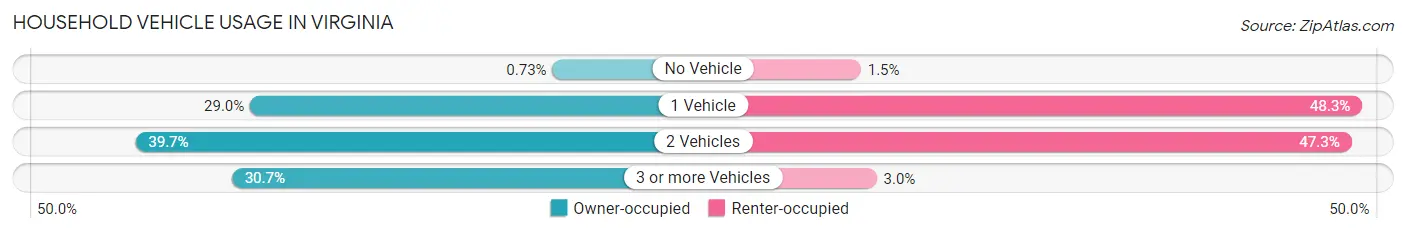
| Vehicles per Household | Owner-occupied | Renter-occupied |
| No Vehicle | 3 (0.7%) | 3 (1.5%) |
| 1 Vehicle | 119 (28.9%) | 98 (48.3%) |
| 2 Vehicles | 163 (39.7%) | 96 (47.3%) |
| 3 or more Vehicles | 126 (30.7%) | 6 (3.0%) |
| Total | 411 (100.0%) | 203 (100.0%) |
Real Estate & Mortgages in Virginia
Real Estate and Mortgage Overview in Virginia
| Characteristic | Without Mortgage | With Mortgage |
| Housing Units | 170 | 241 |
| Median Property Value | $84,100 | $95,700 |
| Median Household Income | $50,500 | $15 |
| Monthly Housing Costs | $527 | $4 |
| Real Estate Taxes | $1,889 | $14 |
Property Value by Mortgage Status in Virginia
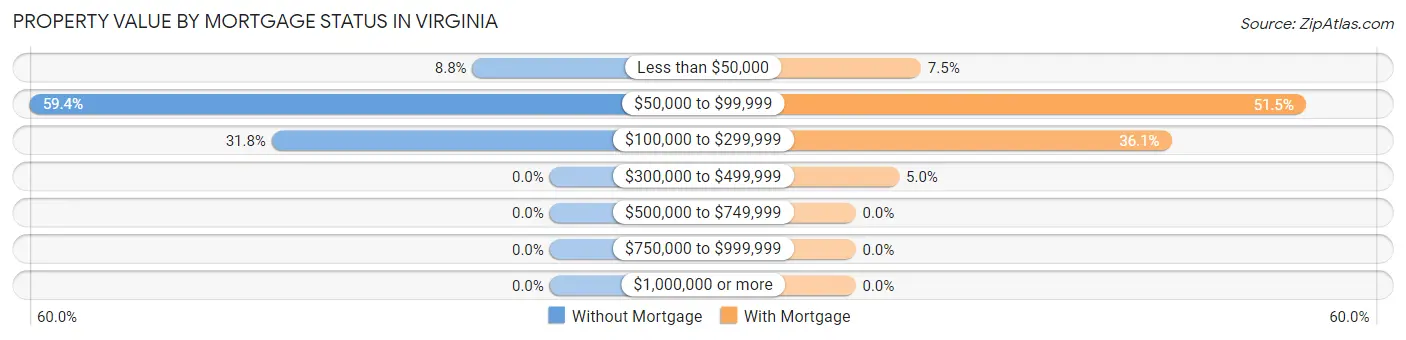
| Property Value | Without Mortgage | With Mortgage |
| Less than $50,000 | 15 (8.8%) | 18 (7.5%) |
| $50,000 to $99,999 | 101 (59.4%) | 124 (51.4%) |
| $100,000 to $299,999 | 54 (31.8%) | 87 (36.1%) |
| $300,000 to $499,999 | 0 (0.0%) | 12 (5.0%) |
| $500,000 to $749,999 | 0 (0.0%) | 0 (0.0%) |
| $750,000 to $999,999 | 0 (0.0%) | 0 (0.0%) |
| $1,000,000 or more | 0 (0.0%) | 0 (0.0%) |
| Total | 170 (100.0%) | 241 (100.0%) |
Household Income by Mortgage Status in Virginia
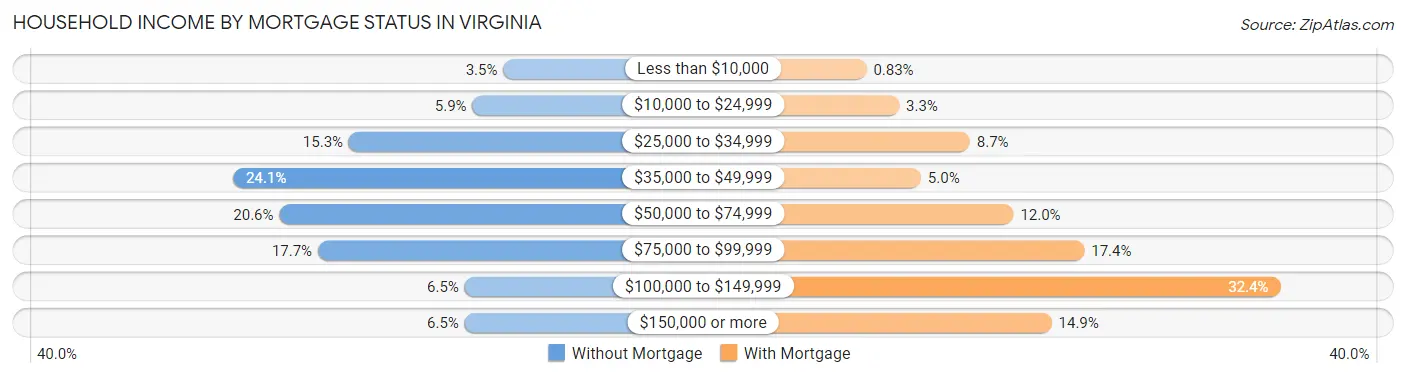
| Household Income | Without Mortgage | With Mortgage |
| Less than $10,000 | 6 (3.5%) | 2 (0.8%) |
| $10,000 to $24,999 | 10 (5.9%) | 8 (3.3%) |
| $25,000 to $34,999 | 26 (15.3%) | 21 (8.7%) |
| $35,000 to $49,999 | 41 (24.1%) | 12 (5.0%) |
| $50,000 to $74,999 | 35 (20.6%) | 29 (12.0%) |
| $75,000 to $99,999 | 30 (17.6%) | 42 (17.4%) |
| $100,000 to $149,999 | 11 (6.5%) | 78 (32.4%) |
| $150,000 or more | 11 (6.5%) | 36 (14.9%) |
| Total | 170 (100.0%) | 241 (100.0%) |
Property Value to Household Income Ratio in Virginia
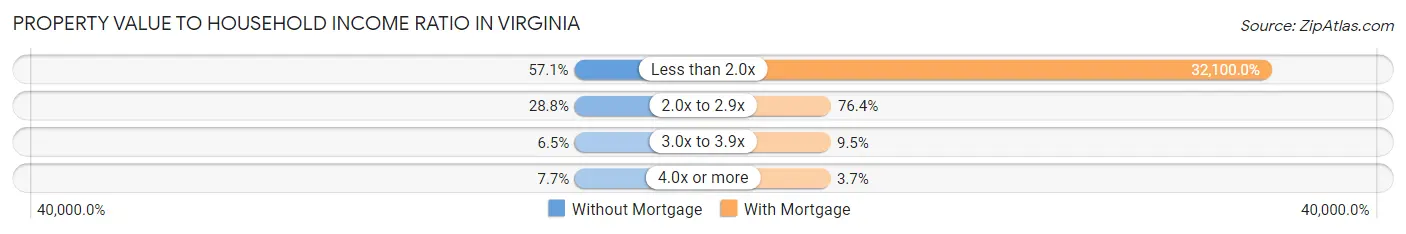
| Value-to-Income Ratio | Without Mortgage | With Mortgage |
| Less than 2.0x | 97 (57.1%) | 77,361 (32,100.0%) |
| 2.0x to 2.9x | 49 (28.8%) | 184 (76.3%) |
| 3.0x to 3.9x | 11 (6.5%) | 23 (9.5%) |
| 4.0x or more | 13 (7.6%) | 9 (3.7%) |
| Total | 170 (100.0%) | 241 (100.0%) |
Real Estate Taxes by Mortgage Status in Virginia
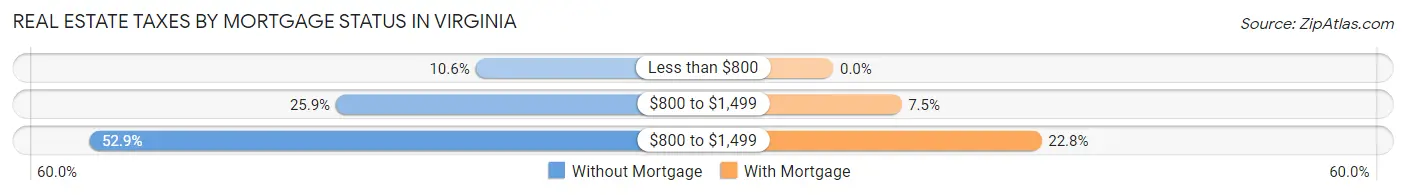
| Property Taxes | Without Mortgage | With Mortgage |
| Less than $800 | 18 (10.6%) | 0 (0.0%) |
| $800 to $1,499 | 44 (25.9%) | 18 (7.5%) |
| $800 to $1,499 | 90 (52.9%) | 55 (22.8%) |
| Total | 170 (100.0%) | 241 (100.0%) |
Health & Disability in Virginia
Health Insurance Coverage by Age in Virginia
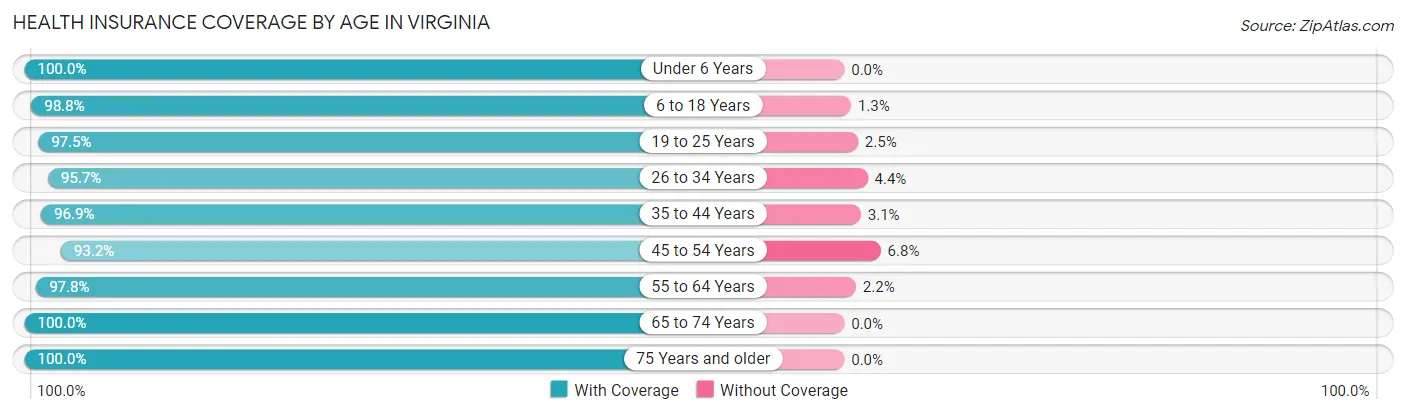
| Age Bracket | With Coverage | Without Coverage |
| Under 6 Years | 44 (100.0%) | 0 (0.0%) |
| 6 to 18 Years | 315 (98.8%) | 4 (1.3%) |
| 19 to 25 Years | 115 (97.5%) | 3 (2.5%) |
| 26 to 34 Years | 110 (95.7%) | 5 (4.3%) |
| 35 to 44 Years | 188 (96.9%) | 6 (3.1%) |
| 45 to 54 Years | 110 (93.2%) | 8 (6.8%) |
| 55 to 64 Years | 271 (97.8%) | 6 (2.2%) |
| 65 to 74 Years | 157 (100.0%) | 0 (0.0%) |
| 75 Years and older | 109 (100.0%) | 0 (0.0%) |
| Total | 1,419 (97.8%) | 32 (2.2%) |
Health Insurance Coverage by Citizenship Status in Virginia
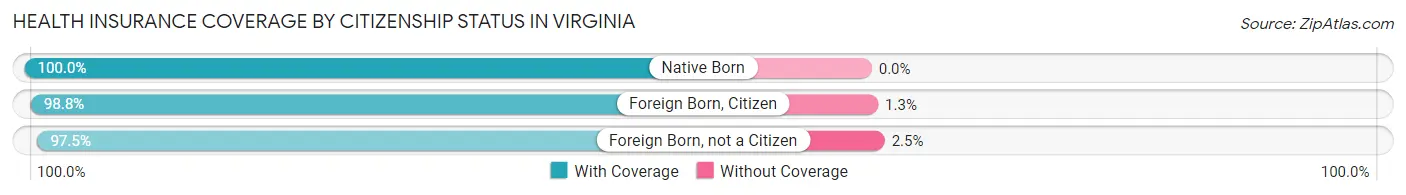
| Citizenship Status | With Coverage | Without Coverage |
| Native Born | 44 (100.0%) | 0 (0.0%) |
| Foreign Born, Citizen | 315 (98.8%) | 4 (1.3%) |
| Foreign Born, not a Citizen | 115 (97.5%) | 3 (2.5%) |
Health Insurance Coverage by Household Income in Virginia
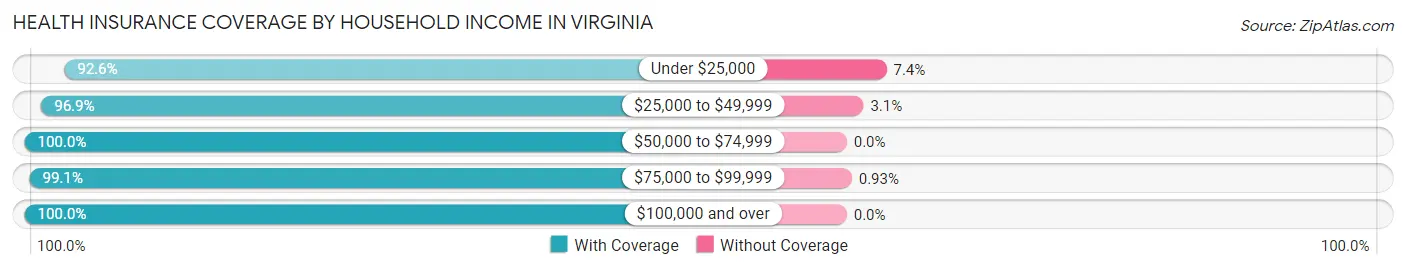
| Household Income | With Coverage | Without Coverage |
| Under $25,000 | 224 (92.6%) | 18 (7.4%) |
| $25,000 to $49,999 | 340 (96.9%) | 11 (3.1%) |
| $50,000 to $74,999 | 243 (100.0%) | 0 (0.0%) |
| $75,000 to $99,999 | 320 (99.1%) | 3 (0.9%) |
| $100,000 and over | 290 (100.0%) | 0 (0.0%) |
Public vs Private Health Insurance Coverage by Age in Virginia
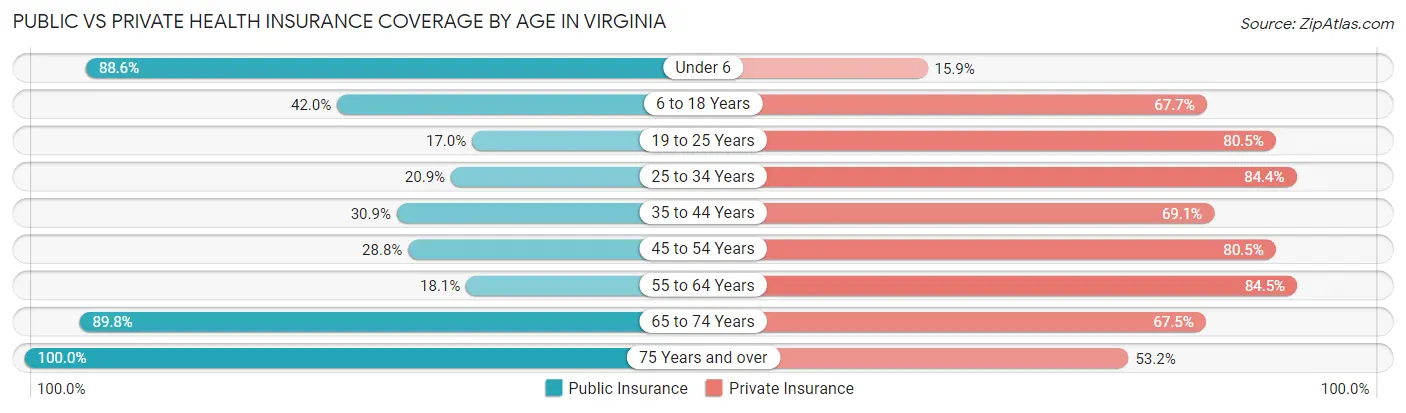
| Age Bracket | Public Insurance | Private Insurance |
| Under 6 | 39 (88.6%) | 7 (15.9%) |
| 6 to 18 Years | 134 (42.0%) | 216 (67.7%) |
| 19 to 25 Years | 20 (17.0%) | 95 (80.5%) |
| 25 to 34 Years | 24 (20.9%) | 97 (84.4%) |
| 35 to 44 Years | 60 (30.9%) | 134 (69.1%) |
| 45 to 54 Years | 34 (28.8%) | 95 (80.5%) |
| 55 to 64 Years | 50 (18.0%) | 234 (84.5%) |
| 65 to 74 Years | 141 (89.8%) | 106 (67.5%) |
| 75 Years and over | 109 (100.0%) | 58 (53.2%) |
| Total | 611 (42.1%) | 1,042 (71.8%) |
Disability Status by Sex by Age in Virginia
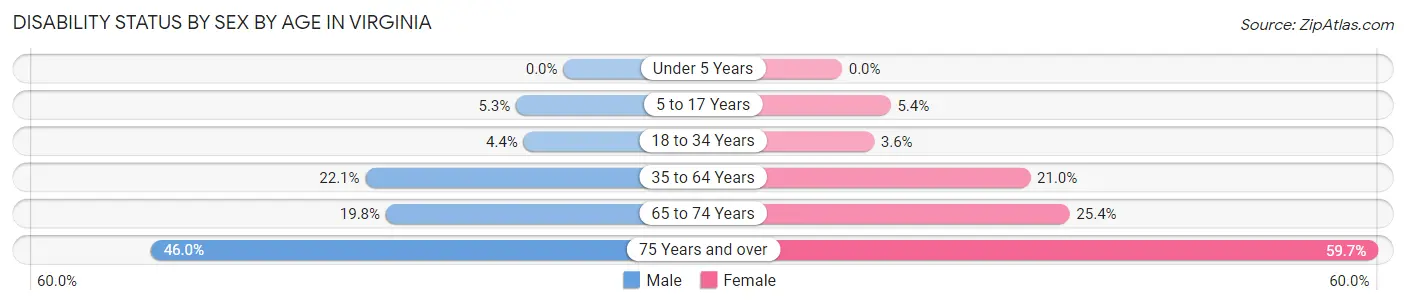
| Age Bracket | Male | Female |
| Under 5 Years | 0 (0.0%) | 0 (0.0%) |
| 5 to 17 Years | 7 (5.3%) | 9 (5.4%) |
| 18 to 34 Years | 5 (4.4%) | 5 (3.6%) |
| 35 to 64 Years | 71 (22.1%) | 56 (21.0%) |
| 65 to 74 Years | 17 (19.8%) | 18 (25.4%) |
| 75 Years and over | 17 (46.0%) | 43 (59.7%) |
Disability Class by Sex by Age in Virginia
Disability Class: Hearing Difficulty
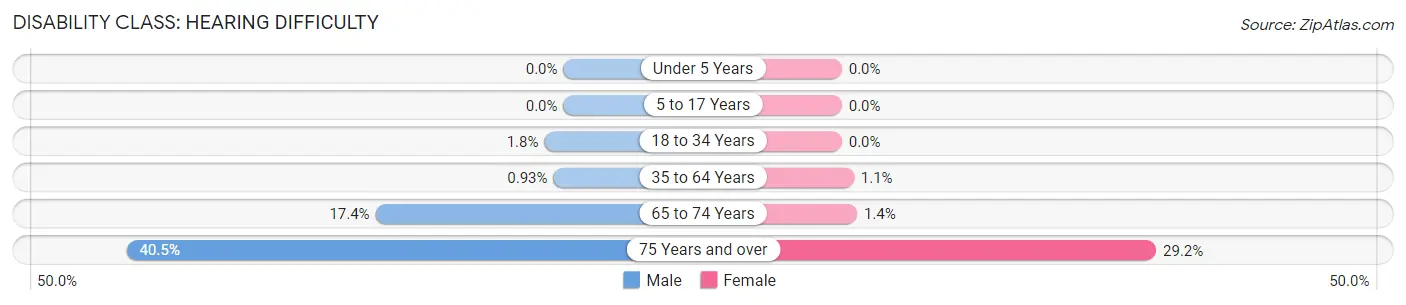
| Age Bracket | Male | Female |
| Under 5 Years | 0 (0.0%) | 0 (0.0%) |
| 5 to 17 Years | 0 (0.0%) | 0 (0.0%) |
| 18 to 34 Years | 2 (1.8%) | 0 (0.0%) |
| 35 to 64 Years | 3 (0.9%) | 3 (1.1%) |
| 65 to 74 Years | 15 (17.4%) | 1 (1.4%) |
| 75 Years and over | 15 (40.5%) | 21 (29.2%) |
Disability Class: Vision Difficulty
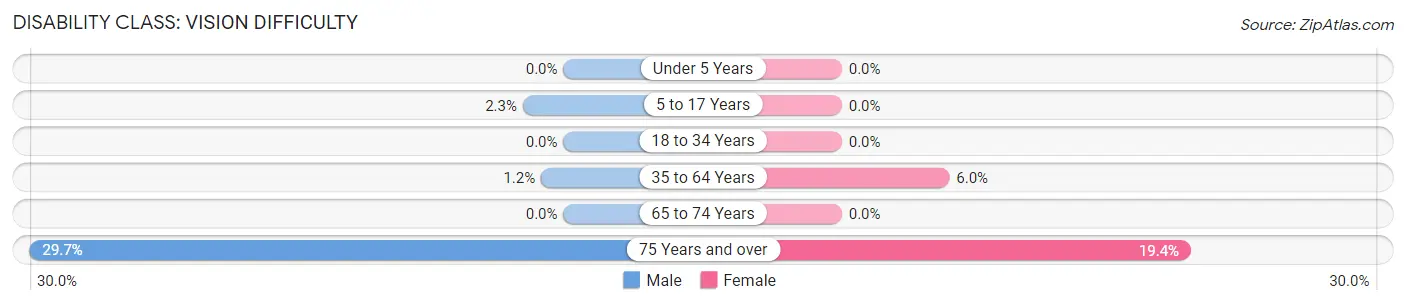
| Age Bracket | Male | Female |
| Under 5 Years | 0 (0.0%) | 0 (0.0%) |
| 5 to 17 Years | 3 (2.3%) | 0 (0.0%) |
| 18 to 34 Years | 0 (0.0%) | 0 (0.0%) |
| 35 to 64 Years | 4 (1.2%) | 16 (6.0%) |
| 65 to 74 Years | 0 (0.0%) | 0 (0.0%) |
| 75 Years and over | 11 (29.7%) | 14 (19.4%) |
Disability Class: Cognitive Difficulty
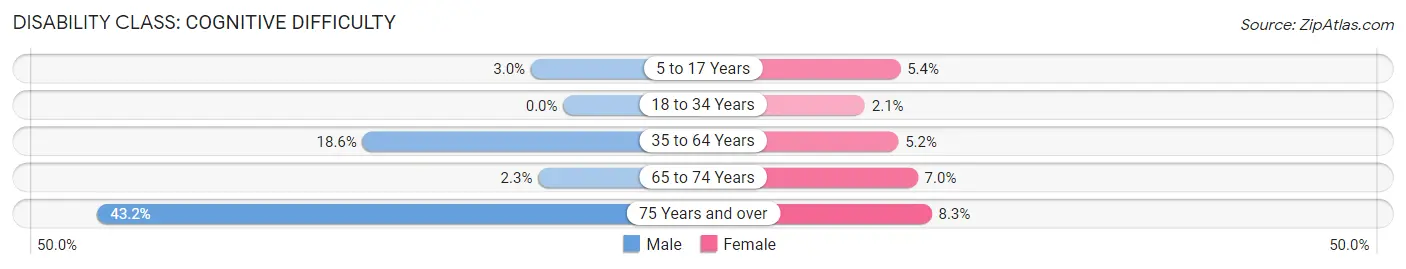
| Age Bracket | Male | Female |
| 5 to 17 Years | 4 (3.0%) | 9 (5.4%) |
| 18 to 34 Years | 0 (0.0%) | 3 (2.1%) |
| 35 to 64 Years | 60 (18.6%) | 14 (5.2%) |
| 65 to 74 Years | 2 (2.3%) | 5 (7.0%) |
| 75 Years and over | 16 (43.2%) | 6 (8.3%) |
Disability Class: Ambulatory Difficulty
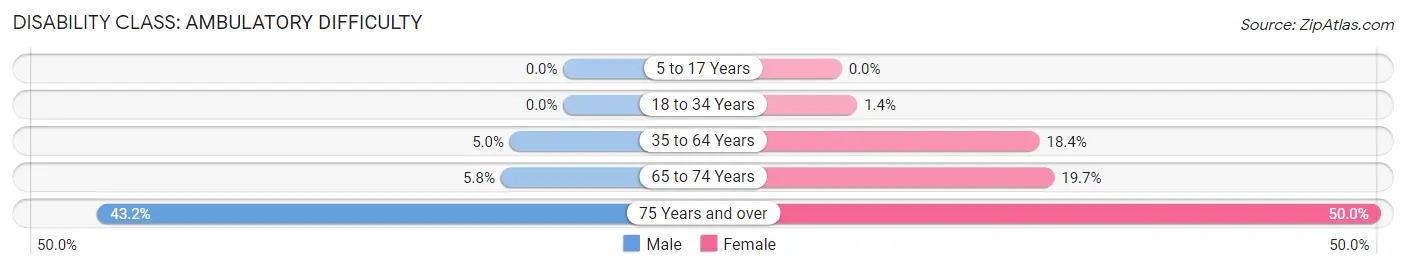
| Age Bracket | Male | Female |
| 5 to 17 Years | 0 (0.0%) | 0 (0.0%) |
| 18 to 34 Years | 0 (0.0%) | 2 (1.4%) |
| 35 to 64 Years | 16 (5.0%) | 49 (18.3%) |
| 65 to 74 Years | 5 (5.8%) | 14 (19.7%) |
| 75 Years and over | 16 (43.2%) | 36 (50.0%) |
Disability Class: Self-Care Difficulty
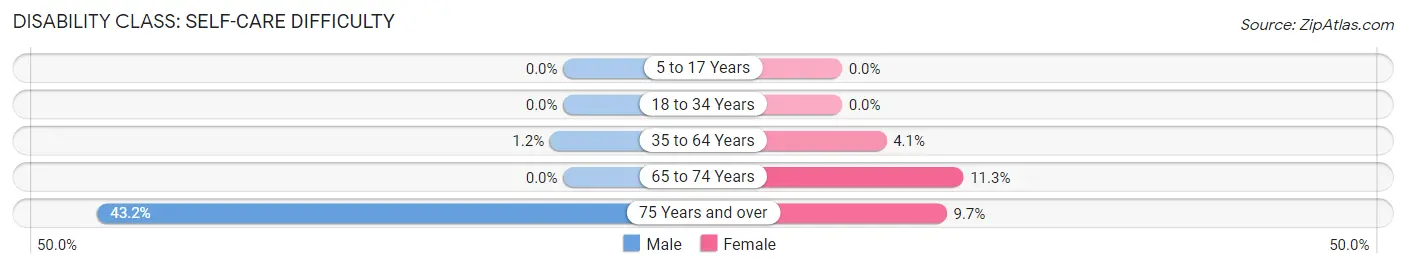
| Age Bracket | Male | Female |
| 5 to 17 Years | 0 (0.0%) | 0 (0.0%) |
| 18 to 34 Years | 0 (0.0%) | 0 (0.0%) |
| 35 to 64 Years | 4 (1.2%) | 11 (4.1%) |
| 65 to 74 Years | 0 (0.0%) | 8 (11.3%) |
| 75 Years and over | 16 (43.2%) | 7 (9.7%) |
Technology Access in Virginia
Computing Device Access in Virginia
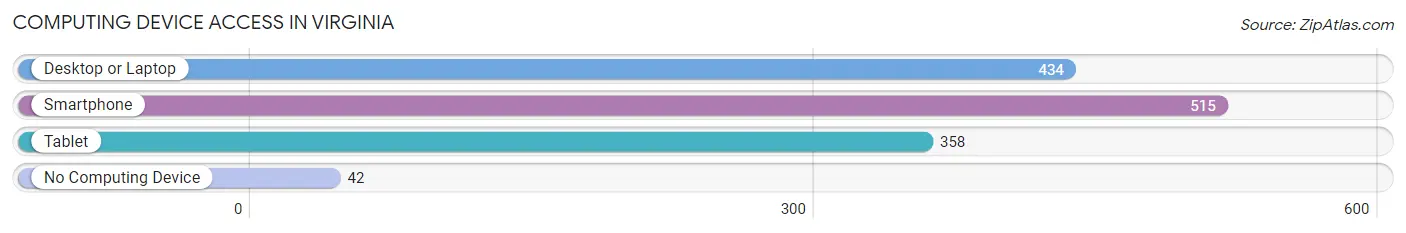
| Device Type | # Households | % Households |
| Desktop or Laptop | 434 | 70.7% |
| Smartphone | 515 | 83.9% |
| Tablet | 358 | 58.3% |
| No Computing Device | 42 | 6.8% |
| Total | 614 | 100.0% |
Internet Access in Virginia
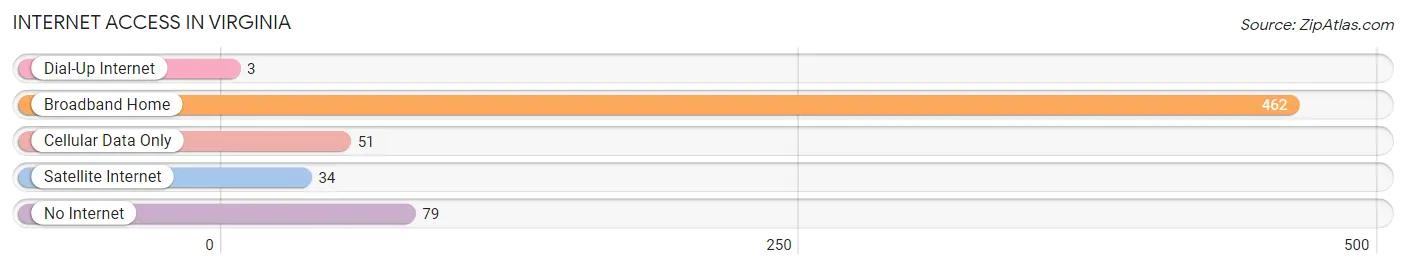
| Internet Type | # Households | % Households |
| Dial-Up Internet | 3 | 0.5% |
| Broadband Home | 462 | 75.2% |
| Cellular Data Only | 51 | 8.3% |
| Satellite Internet | 34 | 5.5% |
| No Internet | 79 | 12.9% |
| Total | 614 | 100.0% |
Virginia Summary
Virginia, Illinois is a small city located in Cass County, Illinois, United States. It is situated on the banks of the Embarras River, about 25 miles south of the state capital of Springfield. The city has a population of approximately 2,500 people and is the county seat of Cass County.
History
The area that is now Virginia, Illinois was first settled in 1819 by a group of pioneers from Virginia. The town was originally known as Virginia City, but was later changed to Virginia in 1837. The town was officially incorporated in 1855.
During the Civil War, Virginia was a major stop on the Underground Railroad, with many slaves escaping to freedom in Canada. The town was also the site of a major battle between Union and Confederate forces in 1864.
Geography
Virginia is located in the central part of Cass County, Illinois. It is situated on the banks of the Embarras River, about 25 miles south of the state capital of Springfield. The city has a total area of 1.2 square miles, all of which is land.
The climate in Virginia is characterized by hot, humid summers and cold, wet winters. The average annual temperature is around 54°F, with average highs in the summer reaching into the mid-80s and average lows in the winter dipping into the mid-20s.
Economy
The economy of Virginia is largely based on agriculture and manufacturing. The city is home to several large agricultural operations, including a large hog farm and a large dairy farm. The city also has several manufacturing plants, including a paper mill and a plastics factory.
The city also has a vibrant tourism industry, with many visitors coming to the area to enjoy the city’s historic sites, outdoor recreation, and cultural attractions.
Demographics
As of the 2010 census, the population of Virginia was 2,500. The racial makeup of the city was 97.2% White, 0.8% African American, 0.4% Native American, 0.4% Asian, and 0.8% from other races. Hispanic or Latino of any race were 1.2% of the population.
The median household income in Virginia was $37,500, and the median family income was $45,000. The per capita income for the city was $18,000. About 11.2% of families and 14.2% of the population were below the poverty line, including 18.2% of those under age 18 and 8.2% of those age 65 or over.
The city is served by the Cass County School District, which includes two elementary schools, one middle school, and one high school. The city also has a public library and several churches.
Common Questions
What is Per Capita Income in Virginia?
Per Capita income in Virginia is $26,190.
What is the Median Family Income in Virginia?
Median Family Income in Virginia is $54,750.
What is the Median Household income in Virginia?
Median Household Income in Virginia is $48,438.
What is Income or Wage Gap in Virginia?
Income or Wage Gap in Virginia is 18.4%.
Women in Virginia earn 81.6 cents for every dollar earned by a man.
What is Inequality or Gini Index in Virginia?
Inequality or Gini Index in Virginia is 0.41.
What is the Total Population of Virginia?
Total Population of Virginia is 1,490.
What is the Total Male Population of Virginia?
Total Male Population of Virginia is 711.
What is the Total Female Population of Virginia?
Total Female Population of Virginia is 779.
What is the Ratio of Males per 100 Females in Virginia?
There are 91.27 Males per 100 Females in Virginia.
What is the Ratio of Females per 100 Males in Virginia?
There are 109.56 Females per 100 Males in Virginia.
What is the Median Population Age in Virginia?
Median Population Age in Virginia is 43.0 Years.
What is the Average Family Size in Virginia
Average Family Size in Virginia is 2.9 People.
What is the Average Household Size in Virginia
Average Household Size in Virginia is 2.4 People.
How Large is the Labor Force in Virginia?
There are 724 People in the Labor Forcein in Virginia.
What is the Percentage of People in the Labor Force in Virginia?
61.6% of People are in the Labor Force in Virginia.
What is the Unemployment Rate in Virginia?
Unemployment Rate in Virginia is 3.7%.