Bishop Hill, IL Map & Demographics
Bishop Hill Map
Bishop Hill Overview
$37,317
PER CAPITA INCOME
$71,250
AVG FAMILY INCOME
$52,321
AVG HOUSEHOLD INCOME
16.7%
WAGE / INCOME GAP [ % ]
83.3¢/ $1
WAGE / INCOME GAP [ $ ]
0.45
INEQUALITY / GINI INDEX
151
TOTAL POPULATION
65
MALE POPULATION
86
FEMALE POPULATION
75.58
MALES / 100 FEMALES
132.31
FEMALES / 100 MALES
62.1
MEDIAN AGE
2.7
AVG FAMILY SIZE
2.1
AVG HOUSEHOLD SIZE
78
LABOR FORCE [ PEOPLE ]
58.2%
PERCENT IN LABOR FORCE
Bishop Hill Zip Codes
Bishop Hill Area Codes
Income in Bishop Hill
Income Overview in Bishop Hill
Per Capita Income in Bishop Hill is $37,317, while median incomes of families and households are $71,250 and $52,321 respectively.
| Characteristic | Number | Measure |
| Per Capita Income | 151 | $37,317 |
| Median Family Income | 46 | $71,250 |
| Mean Family Income | 46 | $109,791 |
| Median Household Income | 71 | $52,321 |
| Mean Household Income | 71 | $83,137 |
| Income Deficit | 46 | $0 |
| Wage / Income Gap (%) | 151 | 16.67% |
| Wage / Income Gap ($) | 151 | 83.33¢ per $1 |
| Gini / Inequality Index | 151 | 0.45 |
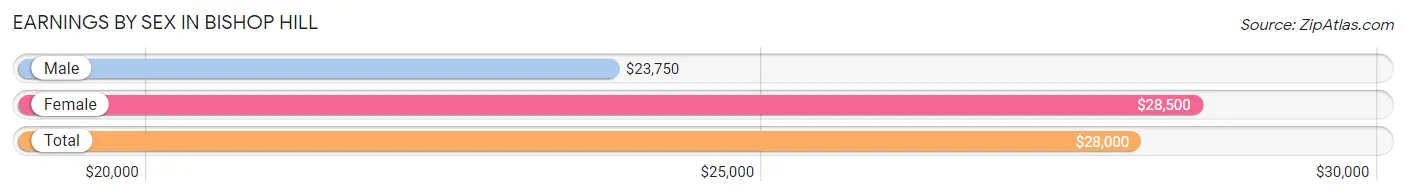
Earnings by Sex in Bishop Hill
Average Earnings in Bishop Hill are $28,000, $23,750 for men and $28,500 for women, a difference of 16.7%.
| Sex | Number | Average Earnings |
| Male | 24 (27.9%) | $23,750 |
| Female | 62 (72.1%) | $28,500 |
| Total | 86 (100.0%) | $28,000 |
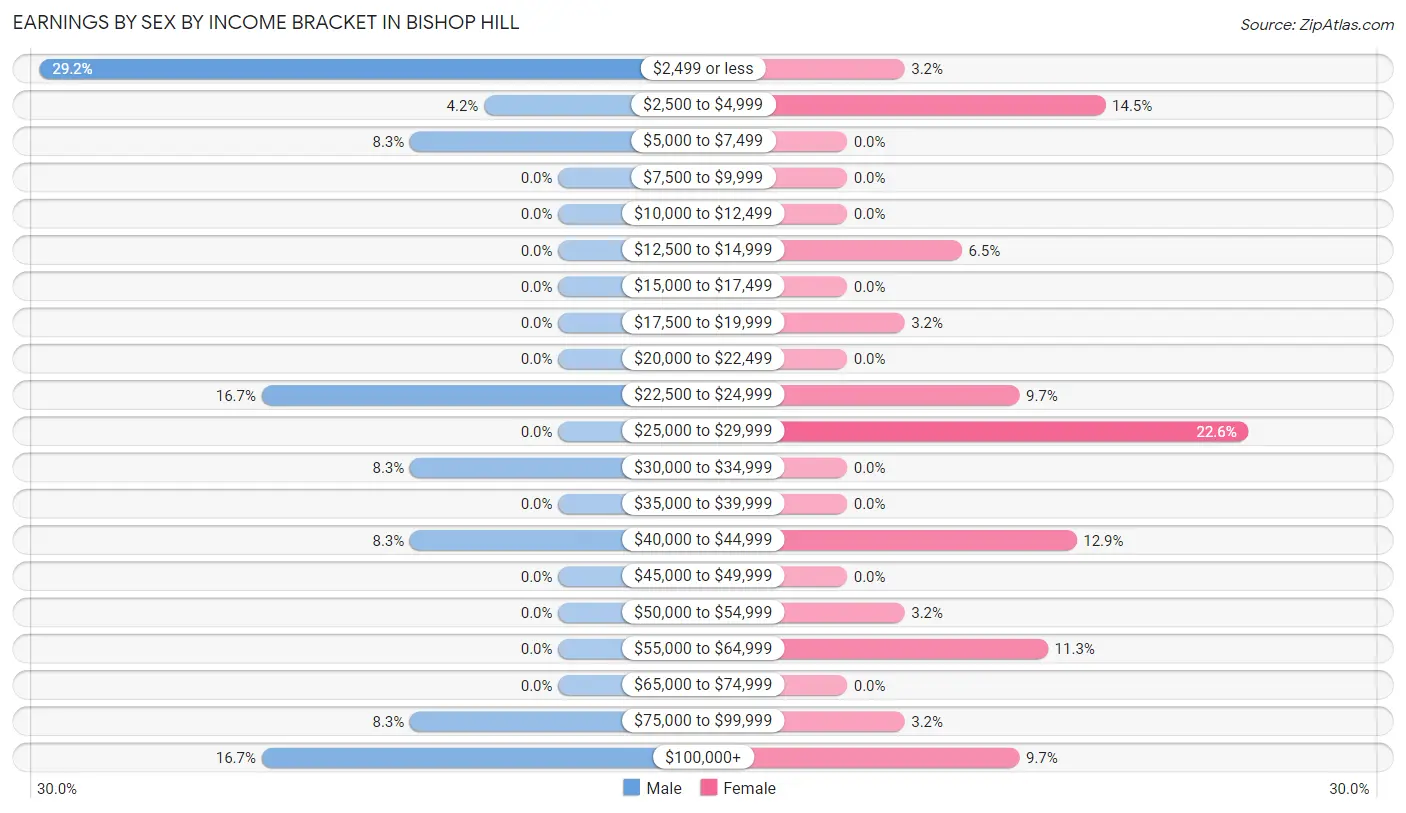
Earnings by Sex by Income Bracket in Bishop Hill
The most common earnings brackets in Bishop Hill are $2,499 or less for men (7 | 29.2%) and $25,000 to $29,999 for women (14 | 22.6%).
| Income | Male | Female |
| $2,499 or less | 7 (29.2%) | 2 (3.2%) |
| $2,500 to $4,999 | 1 (4.2%) | 9 (14.5%) |
| $5,000 to $7,499 | 2 (8.3%) | 0 (0.0%) |
| $7,500 to $9,999 | 0 (0.0%) | 0 (0.0%) |
| $10,000 to $12,499 | 0 (0.0%) | 0 (0.0%) |
| $12,500 to $14,999 | 0 (0.0%) | 4 (6.5%) |
| $15,000 to $17,499 | 0 (0.0%) | 0 (0.0%) |
| $17,500 to $19,999 | 0 (0.0%) | 2 (3.2%) |
| $20,000 to $22,499 | 0 (0.0%) | 0 (0.0%) |
| $22,500 to $24,999 | 4 (16.7%) | 6 (9.7%) |
| $25,000 to $29,999 | 0 (0.0%) | 14 (22.6%) |
| $30,000 to $34,999 | 2 (8.3%) | 0 (0.0%) |
| $35,000 to $39,999 | 0 (0.0%) | 0 (0.0%) |
| $40,000 to $44,999 | 2 (8.3%) | 8 (12.9%) |
| $45,000 to $49,999 | 0 (0.0%) | 0 (0.0%) |
| $50,000 to $54,999 | 0 (0.0%) | 2 (3.2%) |
| $55,000 to $64,999 | 0 (0.0%) | 7 (11.3%) |
| $65,000 to $74,999 | 0 (0.0%) | 0 (0.0%) |
| $75,000 to $99,999 | 2 (8.3%) | 2 (3.2%) |
| $100,000+ | 4 (16.7%) | 6 (9.7%) |
| Total | 24 (100.0%) | 62 (100.0%) |
Earnings by Sex by Educational Attainment in Bishop Hill
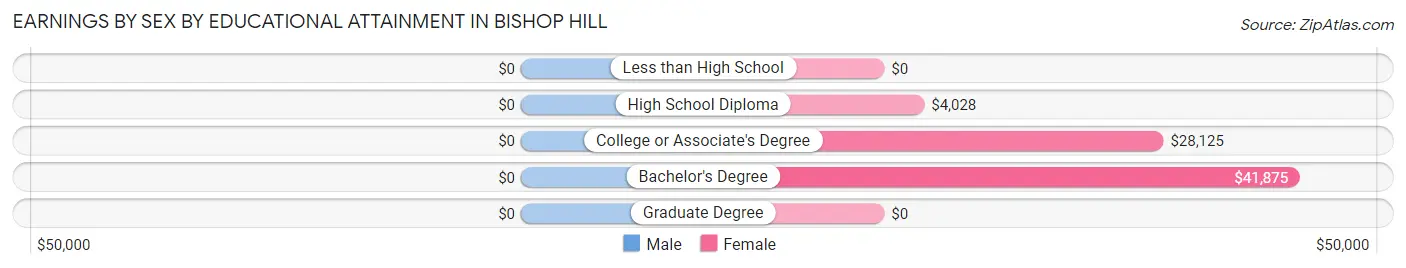
| Educational Attainment | Male Income | Female Income |
| Less than High School | - | - |
| High School Diploma | - | - |
| College or Associate's Degree | - | - |
| Bachelor's Degree | - | - |
| Graduate Degree | - | - |
| Total | - | - |
Family Income in Bishop Hill
Family Income Brackets in Bishop Hill
According to the Bishop Hill family income data, there are 15 families falling into the $50,000 to $74,999 income range, which is the most common income bracket and makes up 32.6% of all families.
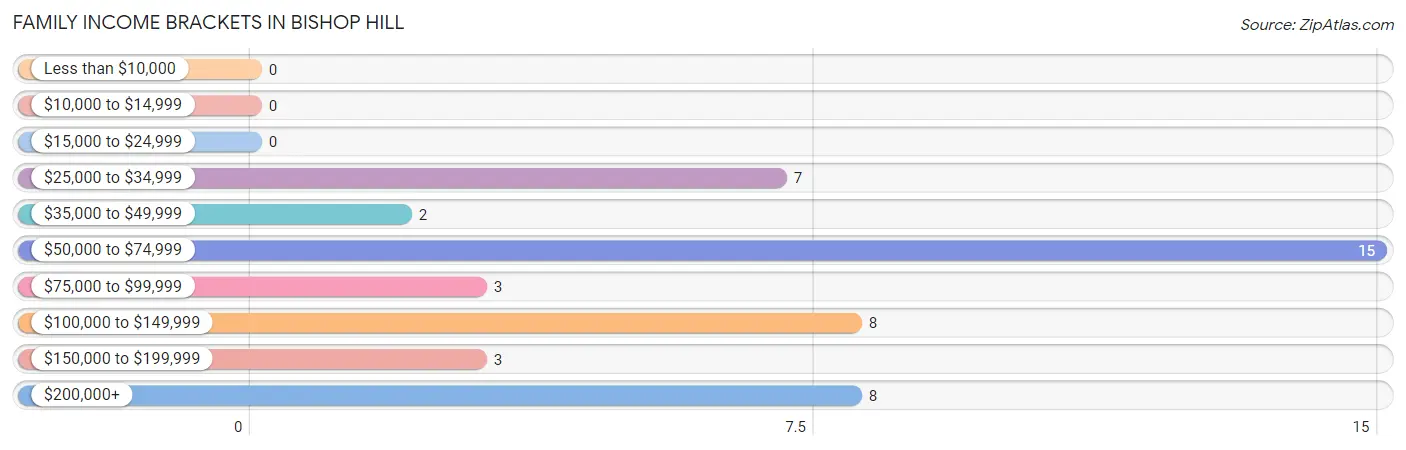
| Income Bracket | # Families | % Families |
| Less than $10,000 | 0 | 0.0% |
| $10,000 to $14,999 | 0 | 0.0% |
| $15,000 to $24,999 | 0 | 0.0% |
| $25,000 to $34,999 | 7 | 15.2% |
| $35,000 to $49,999 | 2 | 4.3% |
| $50,000 to $74,999 | 15 | 32.6% |
| $75,000 to $99,999 | 3 | 6.5% |
| $100,000 to $149,999 | 8 | 17.4% |
| $150,000 to $199,999 | 3 | 6.5% |
| $200,000+ | 8 | 17.4% |
Family Income by Famaliy Size in Bishop Hill
2-person families (36 | 78.3%) account for the highest median family income in Bishop Hill with $63,750 per family, while 2-person families (36 | 78.3%) have the highest median income of $31,875 per family member.
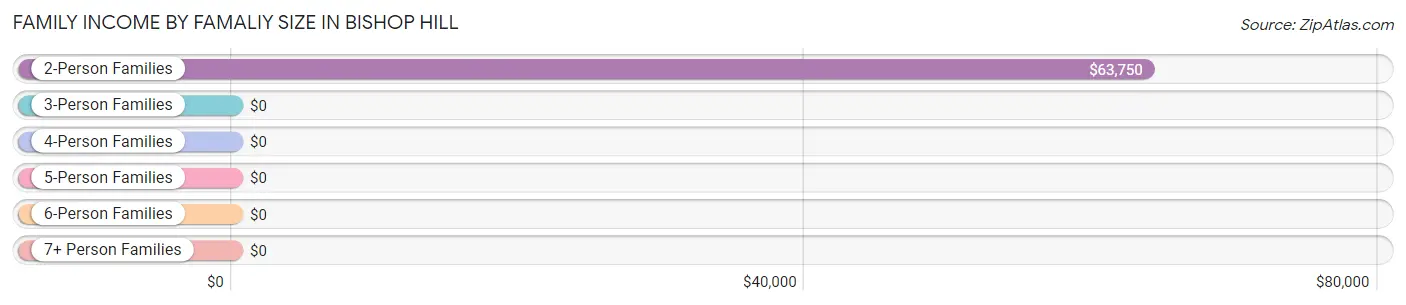
| Income Bracket | # Families | Median Income |
| 2-Person Families | 36 (78.3%) | $63,750 |
| 3-Person Families | 0 (0.0%) | $0 |
| 4-Person Families | 4 (8.7%) | $0 |
| 5-Person Families | 0 (0.0%) | $0 |
| 6-Person Families | 6 (13.0%) | $0 |
| 7+ Person Families | 0 (0.0%) | $0 |
| Total | 46 (100.0%) | $71,250 |
Family Income by Number of Earners in Bishop Hill
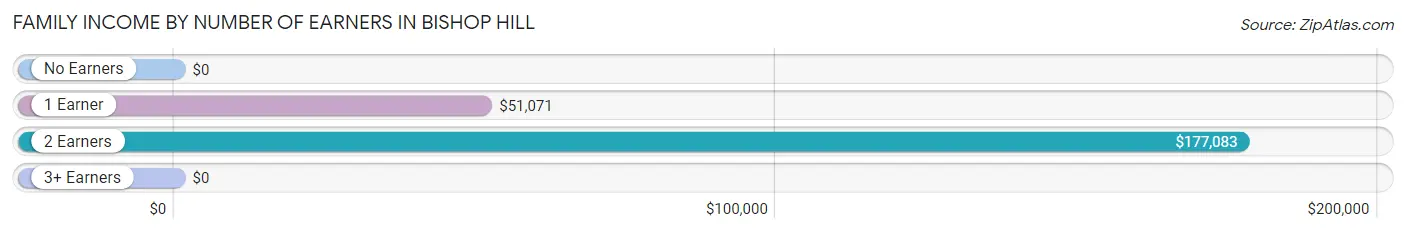
| Number of Earners | # Families | Median Income |
| No Earners | 1 (2.2%) | $0 |
| 1 Earner | 22 (47.8%) | $51,071 |
| 2 Earners | 17 (37.0%) | $177,083 |
| 3+ Earners | 6 (13.0%) | $0 |
| Total | 46 (100.0%) | $71,250 |
Household Income in Bishop Hill
Household Income Brackets in Bishop Hill
With 17 households falling in the category, the $50,000 to $74,999 income range is the most frequent in Bishop Hill, accounting for 23.9% of all households. In contrast, only 2 households (2.8%) fall into the less than $10,000 income bracket, making it the least populous group.
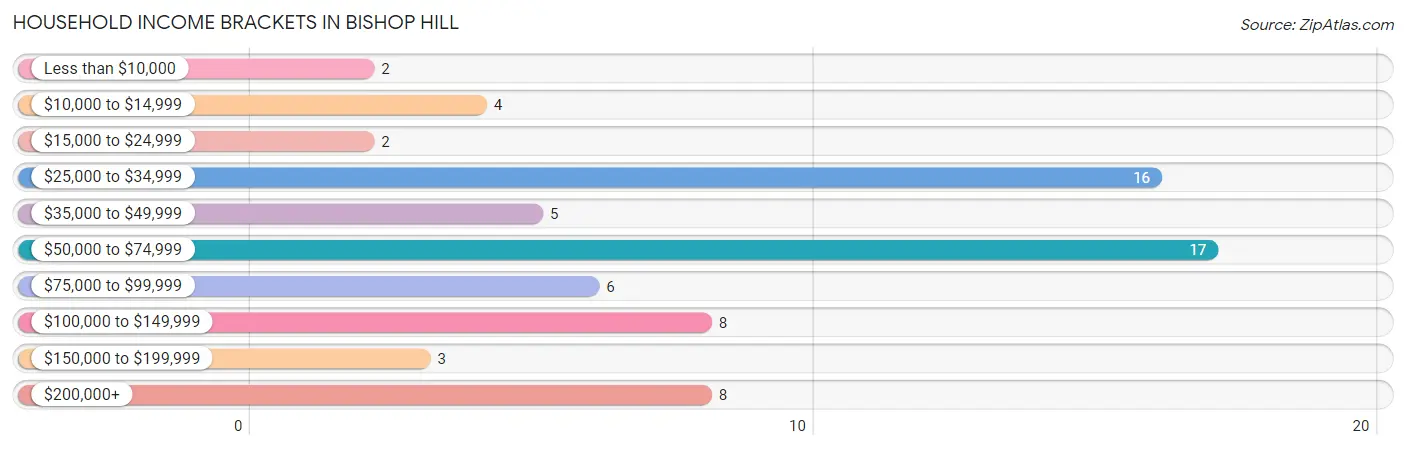
| Income Bracket | # Households | % Households |
| Less than $10,000 | 2 | 2.8% |
| $10,000 to $14,999 | 4 | 5.6% |
| $15,000 to $24,999 | 2 | 2.8% |
| $25,000 to $34,999 | 16 | 22.5% |
| $35,000 to $49,999 | 5 | 7.0% |
| $50,000 to $74,999 | 17 | 23.9% |
| $75,000 to $99,999 | 6 | 8.5% |
| $100,000 to $149,999 | 8 | 11.3% |
| $150,000 to $199,999 | 3 | 4.2% |
| $200,000+ | 8 | 11.3% |
Household Income by Householder Age in Bishop Hill
The median household income in Bishop Hill is $52,321, with the highest median household income of $52,143 found in the 45 to 64 years age bracket for the primary householder. A total of 36 households (50.7%) fall into this category.
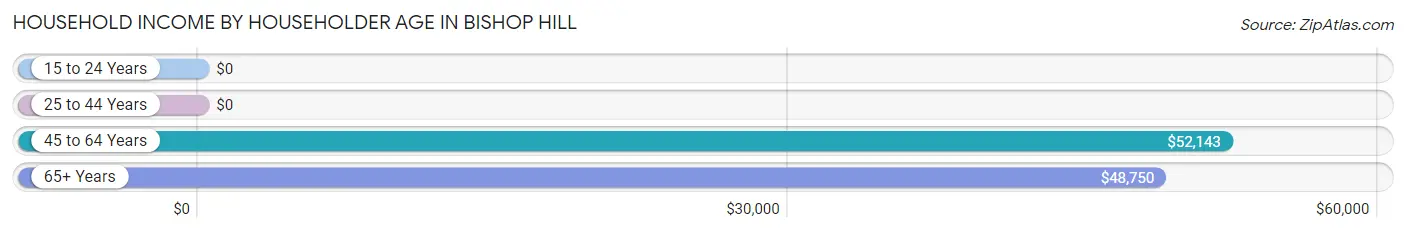
| Income Bracket | # Households | Median Income |
| 15 to 24 Years | 0 (0.0%) | $0 |
| 25 to 44 Years | 14 (19.7%) | $0 |
| 45 to 64 Years | 36 (50.7%) | $52,143 |
| 65+ Years | 21 (29.6%) | $48,750 |
| Total | 71 (100.0%) | $52,321 |
Poverty in Bishop Hill
Income Below Poverty by Sex and Age in Bishop Hill
With 6.1% poverty level for males and 1.2% for females among the residents of Bishop Hill, 35 to 44 year old males and 65 to 74 year old females are the most vulnerable to poverty, with 2 males (66.7%) and 1 females (7.7%) in their respective age groups living below the poverty level.
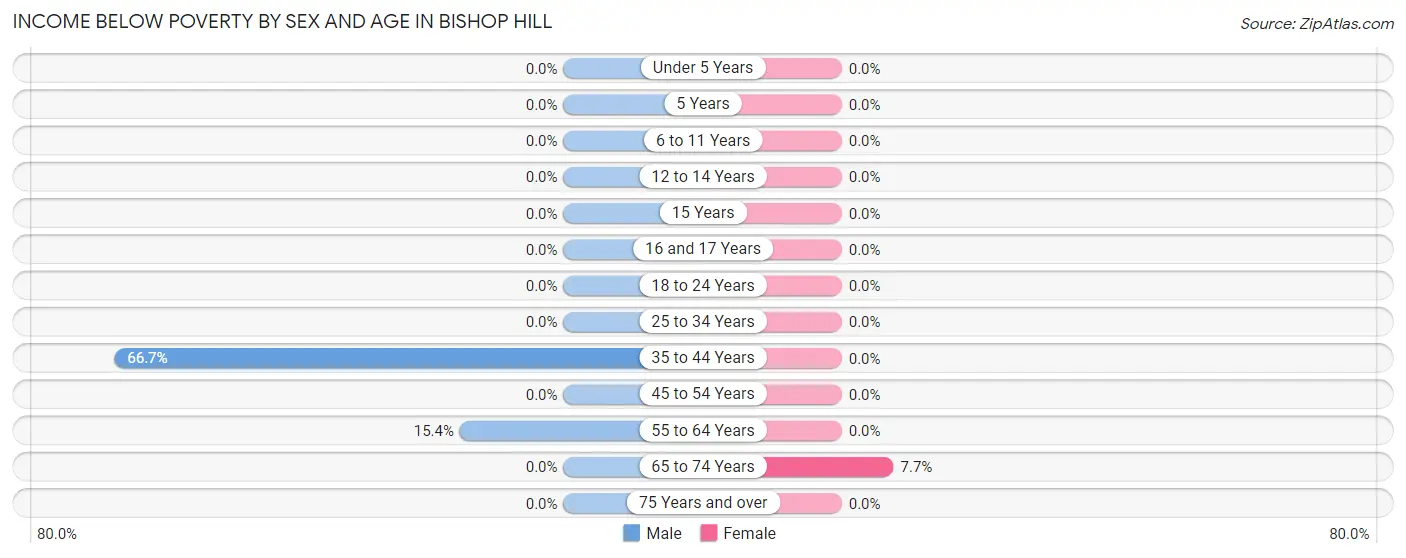
| Age Bracket | Male | Female |
| Under 5 Years | 0 (0.0%) | 0 (0.0%) |
| 5 Years | 0 (0.0%) | 0 (0.0%) |
| 6 to 11 Years | 0 (0.0%) | 0 (0.0%) |
| 12 to 14 Years | 0 (0.0%) | 0 (0.0%) |
| 15 Years | 0 (0.0%) | 0 (0.0%) |
| 16 and 17 Years | 0 (0.0%) | 0 (0.0%) |
| 18 to 24 Years | 0 (0.0%) | 0 (0.0%) |
| 25 to 34 Years | 0 (0.0%) | 0 (0.0%) |
| 35 to 44 Years | 2 (66.7%) | 0 (0.0%) |
| 45 to 54 Years | 0 (0.0%) | 0 (0.0%) |
| 55 to 64 Years | 2 (15.4%) | 0 (0.0%) |
| 65 to 74 Years | 0 (0.0%) | 1 (7.7%) |
| 75 Years and over | 0 (0.0%) | 0 (0.0%) |
| Total | 4 (6.1%) | 1 (1.2%) |
Income Above Poverty by Sex and Age in Bishop Hill
According to the poverty statistics in Bishop Hill, males aged 6 to 11 years and females aged 6 to 11 years are the age groups that are most secure financially, with 100.0% of males and 100.0% of females in these age groups living above the poverty line.
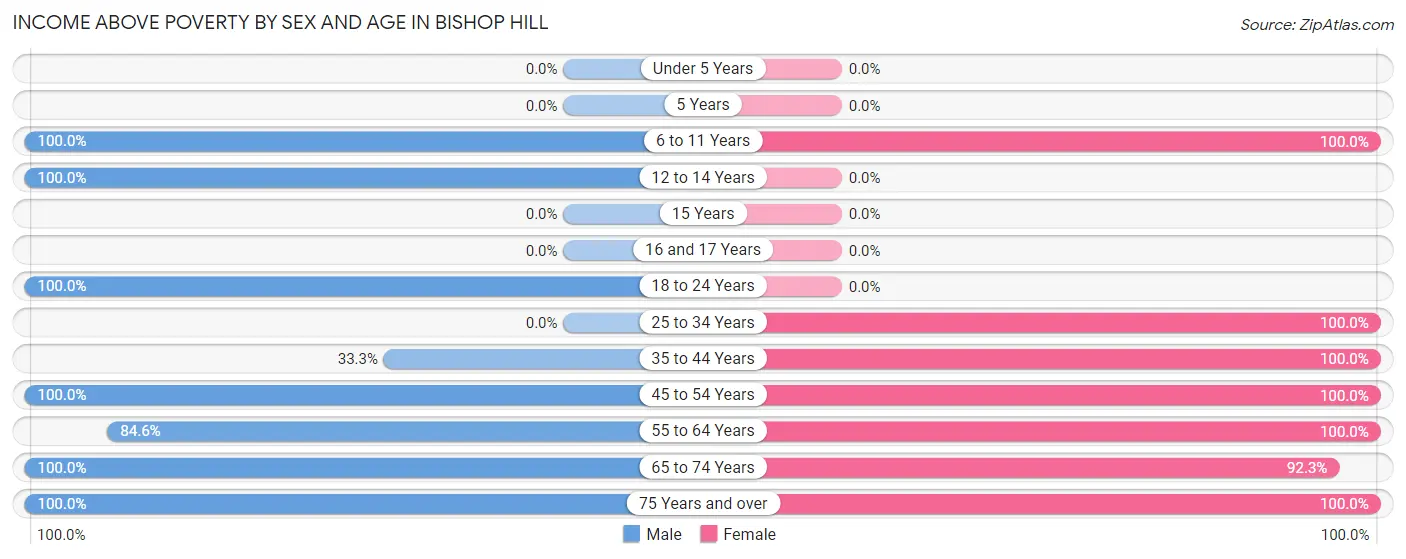
| Age Bracket | Male | Female |
| Under 5 Years | 0 (0.0%) | 0 (0.0%) |
| 5 Years | 0 (0.0%) | 0 (0.0%) |
| 6 to 11 Years | 9 (100.0%) | 2 (100.0%) |
| 12 to 14 Years | 6 (100.0%) | 0 (0.0%) |
| 15 Years | 0 (0.0%) | 0 (0.0%) |
| 16 and 17 Years | 0 (0.0%) | 0 (0.0%) |
| 18 to 24 Years | 2 (100.0%) | 0 (0.0%) |
| 25 to 34 Years | 0 (0.0%) | 18 (100.0%) |
| 35 to 44 Years | 1 (33.3%) | 4 (100.0%) |
| 45 to 54 Years | 7 (100.0%) | 4 (100.0%) |
| 55 to 64 Years | 11 (84.6%) | 32 (100.0%) |
| 65 to 74 Years | 23 (100.0%) | 12 (92.3%) |
| 75 Years and over | 2 (100.0%) | 13 (100.0%) |
| Total | 61 (93.9%) | 85 (98.8%) |
Income Below Poverty Among Married-Couple Families in Bishop Hill
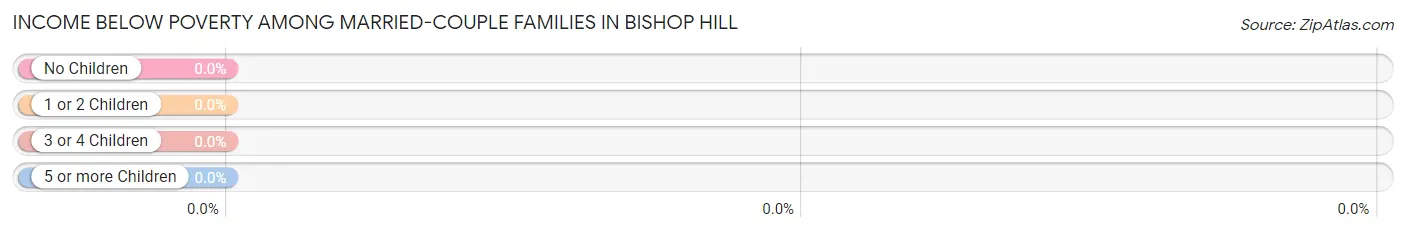
| Children | Above Poverty | Below Poverty |
| No Children | 29 (100.0%) | 0 (0.0%) |
| 1 or 2 Children | 9 (100.0%) | 0 (0.0%) |
| 3 or 4 Children | 0 (0.0%) | 0 (0.0%) |
| 5 or more Children | 0 (0.0%) | 0 (0.0%) |
| Total | 38 (100.0%) | 0 (0.0%) |
Income Below Poverty Among Single-Parent Households in Bishop Hill
| Children | Single Father | Single Mother |
| No Children | 0 (0.0%) | 0 (0.0%) |
| 1 or 2 Children | 0 (0.0%) | 0 (0.0%) |
| 3 or 4 Children | 0 (0.0%) | 0 (0.0%) |
| 5 or more Children | 0 (0.0%) | 0 (0.0%) |
| Total | 0 (0.0%) | 0 (0.0%) |
Income Below Poverty Among Married-Couple vs Single-Parent Households in Bishop Hill
| Children | Married-Couple Families | Single-Parent Households |
| No Children | 0 (0.0%) | 0 (0.0%) |
| 1 or 2 Children | 0 (0.0%) | 0 (0.0%) |
| 3 or 4 Children | 0 (0.0%) | 0 (0.0%) |
| 5 or more Children | 0 (0.0%) | 0 (0.0%) |
| Total | 0 (0.0%) | 0 (0.0%) |
Race in Bishop Hill
The most populous races in Bishop Hill are White / Caucasian (143 | 94.7%), Two or more Races (8 | 5.3%), and Hispanic or Latino (2 | 1.3%).
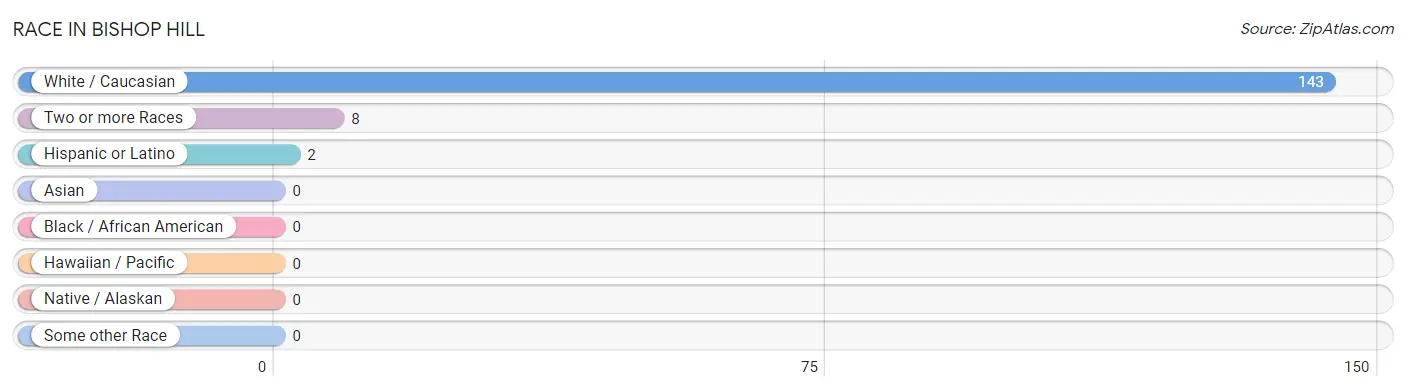
| Race | # Population | % Population |
| Asian | 0 | 0.0% |
| Black / African American | 0 | 0.0% |
| Hawaiian / Pacific | 0 | 0.0% |
| Hispanic or Latino | 2 | 1.3% |
| Native / Alaskan | 0 | 0.0% |
| White / Caucasian | 143 | 94.7% |
| Two or more Races | 8 | 5.3% |
| Some other Race | 0 | 0.0% |
| Total | 151 | 100.0% |
Ancestry in Bishop Hill
The most populous ancestries reported in Bishop Hill are German (76 | 50.3%), Swedish (51 | 33.8%), English (35 | 23.2%), Irish (18 | 11.9%), and Italian (18 | 11.9%), together accounting for 131.1% of all Bishop Hill residents.
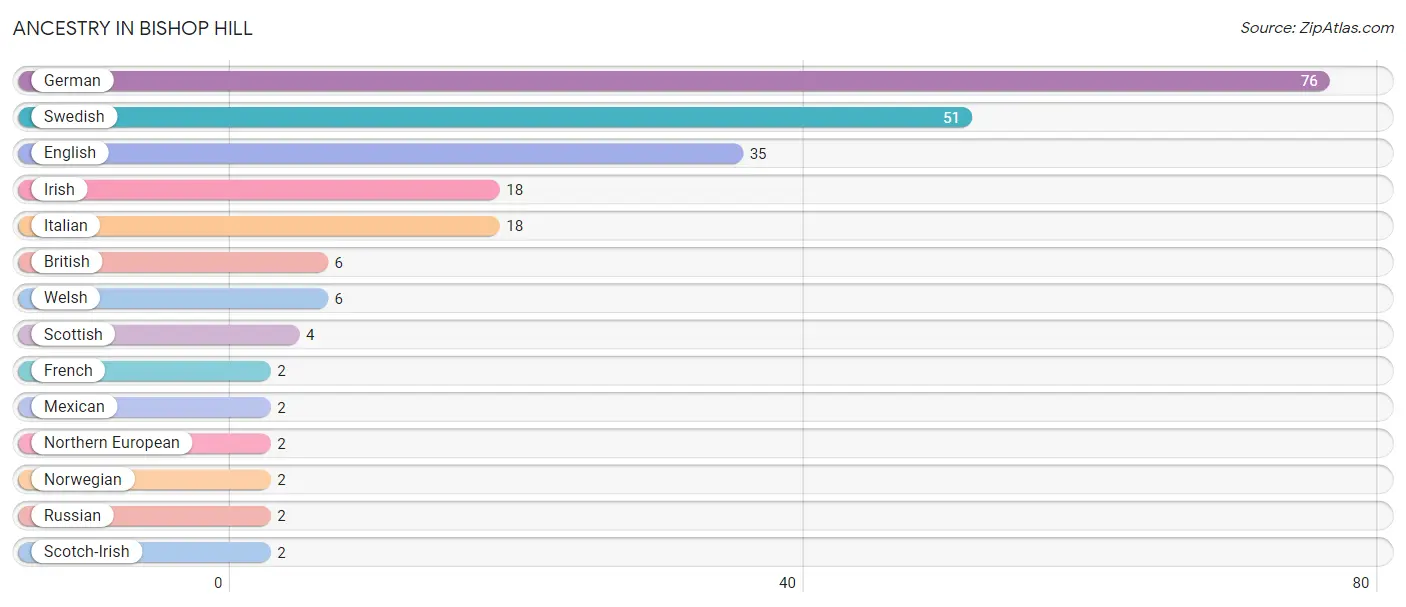
| Ancestry | # Population | % Population |
| British | 6 | 4.0% |
| English | 35 | 23.2% |
| French | 2 | 1.3% |
| German | 76 | 50.3% |
| Irish | 18 | 11.9% |
| Italian | 18 | 11.9% |
| Mexican | 2 | 1.3% |
| Northern European | 2 | 1.3% |
| Norwegian | 2 | 1.3% |
| Russian | 2 | 1.3% |
| Scotch-Irish | 2 | 1.3% |
| Scottish | 4 | 2.6% |
| Swedish | 51 | 33.8% |
| Welsh | 6 | 4.0% | View All 14 Rows |
Immigrants in Bishop Hill

| Immigration Origin | # Population | % Population | View All 0 Rows |
Sex and Age in Bishop Hill
Sex and Age in Bishop Hill
The most populous age groups in Bishop Hill are 70 to 74 Years (15 | 23.1%) for men and 60 to 64 Years (30 | 34.9%) for women.
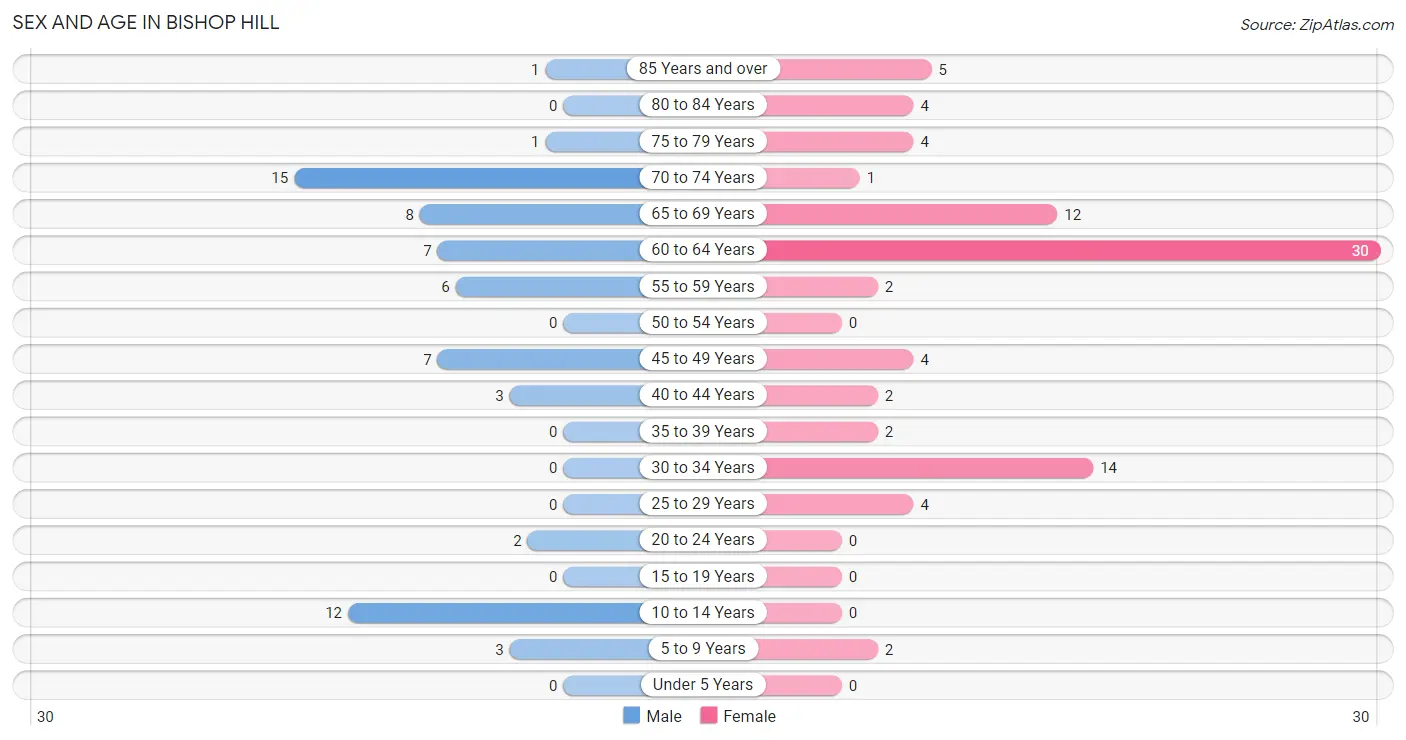
| Age Bracket | Male | Female |
| Under 5 Years | 0 (0.0%) | 0 (0.0%) |
| 5 to 9 Years | 3 (4.6%) | 2 (2.3%) |
| 10 to 14 Years | 12 (18.5%) | 0 (0.0%) |
| 15 to 19 Years | 0 (0.0%) | 0 (0.0%) |
| 20 to 24 Years | 2 (3.1%) | 0 (0.0%) |
| 25 to 29 Years | 0 (0.0%) | 4 (4.6%) |
| 30 to 34 Years | 0 (0.0%) | 14 (16.3%) |
| 35 to 39 Years | 0 (0.0%) | 2 (2.3%) |
| 40 to 44 Years | 3 (4.6%) | 2 (2.3%) |
| 45 to 49 Years | 7 (10.8%) | 4 (4.6%) |
| 50 to 54 Years | 0 (0.0%) | 0 (0.0%) |
| 55 to 59 Years | 6 (9.2%) | 2 (2.3%) |
| 60 to 64 Years | 7 (10.8%) | 30 (34.9%) |
| 65 to 69 Years | 8 (12.3%) | 12 (14.0%) |
| 70 to 74 Years | 15 (23.1%) | 1 (1.2%) |
| 75 to 79 Years | 1 (1.5%) | 4 (4.6%) |
| 80 to 84 Years | 0 (0.0%) | 4 (4.6%) |
| 85 Years and over | 1 (1.5%) | 5 (5.8%) |
| Total | 65 (100.0%) | 86 (100.0%) |
Families and Households in Bishop Hill
Median Family Size in Bishop Hill
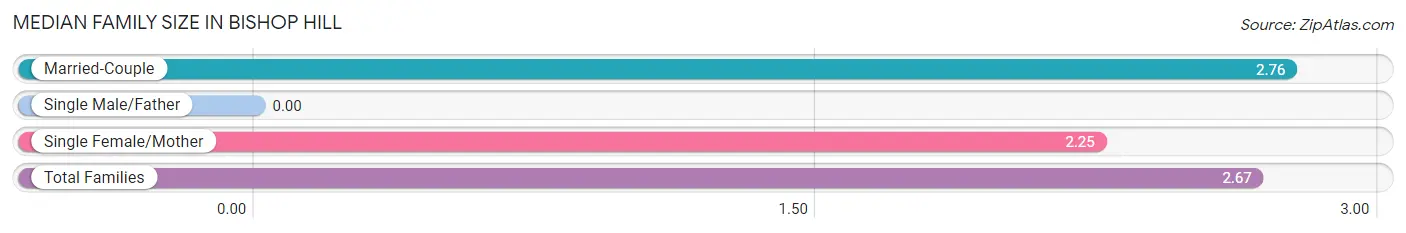
| Family Type | # Families | Family Size |
| Married-Couple | 38 (82.6%) | 2.76 |
| Single Male/Father | 0 (0.0%) | - |
| Single Female/Mother | 8 (17.4%) | 2.25 |
| Total Families | 46 (100.0%) | 2.67 |
Median Household Size in Bishop Hill
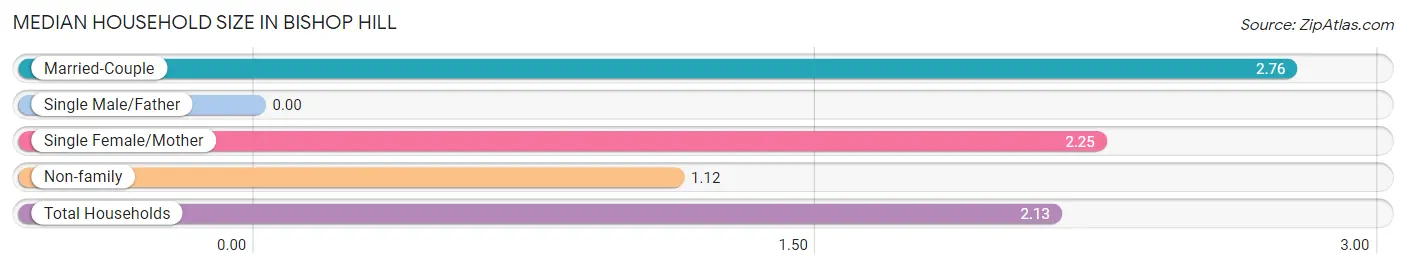
| Household Type | # Households | Household Size |
| Married-Couple | 38 (53.5%) | 2.76 |
| Single Male/Father | 0 (0.0%) | - |
| Single Female/Mother | 8 (11.3%) | 2.25 |
| Non-family | 25 (35.2%) | 1.12 |
| Total Households | 71 (100.0%) | 2.13 |
Household Size by Marriage Status in Bishop Hill
Out of a total of 71 households in Bishop Hill, 46 (64.8%) are family households, while 25 (35.2%) are nonfamily households. The most numerous type of family households are 2-person households, comprising 36, and the most common type of nonfamily households are 1-person households, comprising 21.
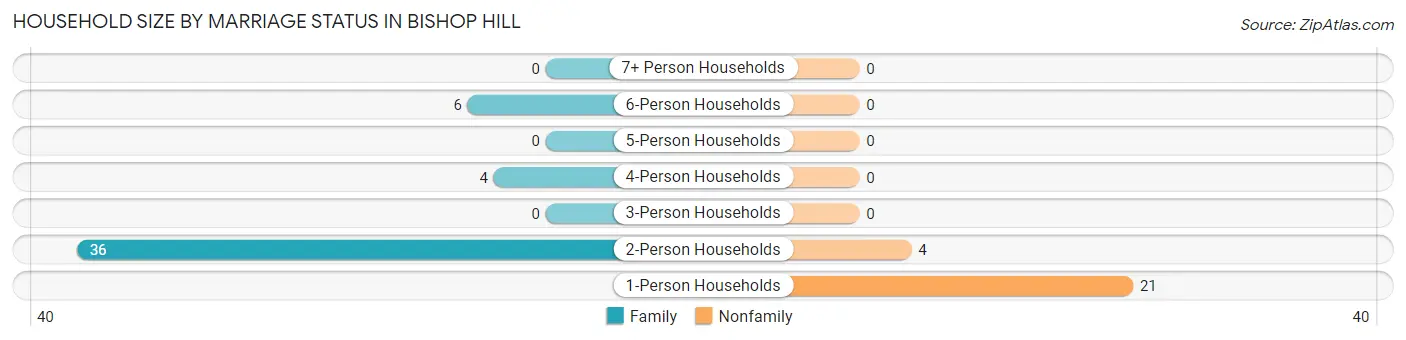
| Household Size | Family Households | Nonfamily Households |
| 1-Person Households | - | 21 (29.6%) |
| 2-Person Households | 36 (50.7%) | 4 (5.6%) |
| 3-Person Households | 0 (0.0%) | 0 (0.0%) |
| 4-Person Households | 4 (5.6%) | 0 (0.0%) |
| 5-Person Households | 0 (0.0%) | 0 (0.0%) |
| 6-Person Households | 6 (8.5%) | 0 (0.0%) |
| 7+ Person Households | 0 (0.0%) | 0 (0.0%) |
| Total | 46 (64.8%) | 25 (35.2%) |
Female Fertility in Bishop Hill
Fertility by Age in Bishop Hill
| Age Bracket | Women with Births | Births / 1,000 Women |
| 15 to 19 years | 0 (0.0%) | 0.0 |
| 20 to 34 years | 0 (0.0%) | 0.0 |
| 35 to 50 years | 0 (0.0%) | 0.0 |
| Total | 0 (0.0%) | 0.0 |
Fertility by Age by Marriage Status in Bishop Hill
| Age Bracket | Married | Unmarried |
| 15 to 19 years | 0 (0.0%) | 0 (0.0%) |
| 20 to 34 years | 0 (0.0%) | 0 (0.0%) |
| 35 to 50 years | 0 (0.0%) | 0 (0.0%) |
| Total | 0 (0.0%) | 0 (0.0%) |
Fertility by Education in Bishop Hill
| Educational Attainment | Women with Births | Births / 1,000 Women |
| Less than High School | 0 (0.0%) | 0.0 |
| High School Diploma | 0 (0.0%) | 0.0 |
| College or Associate's Degree | 0 (0.0%) | 0.0 |
| Bachelor's Degree | 0 (0.0%) | 0.0 |
| Graduate Degree | 0 (0.0%) | 0.0 |
| Total | 0 (0.0%) | 0.0 |
Fertility by Education by Marriage Status in Bishop Hill
| Educational Attainment | Married | Unmarried |
| Less than High School | 0 (0.0%) | 0 (0.0%) |
| High School Diploma | 0 (0.0%) | 0 (0.0%) |
| College or Associate's Degree | 0 (0.0%) | 0 (0.0%) |
| Bachelor's Degree | 0 (0.0%) | 0 (0.0%) |
| Graduate Degree | 0 (0.0%) | 0 (0.0%) |
| Total | 0 (0.0%) | 0 (0.0%) |
Employment Characteristics in Bishop Hill
Employment by Class of Employer in Bishop Hill
Among the 78 employed individuals in Bishop Hill, private company employees (30 | 38.5%), self-employed (not incorporated) (23 | 29.5%), and local government employees (17 | 21.8%) make up the most common classes of employment.
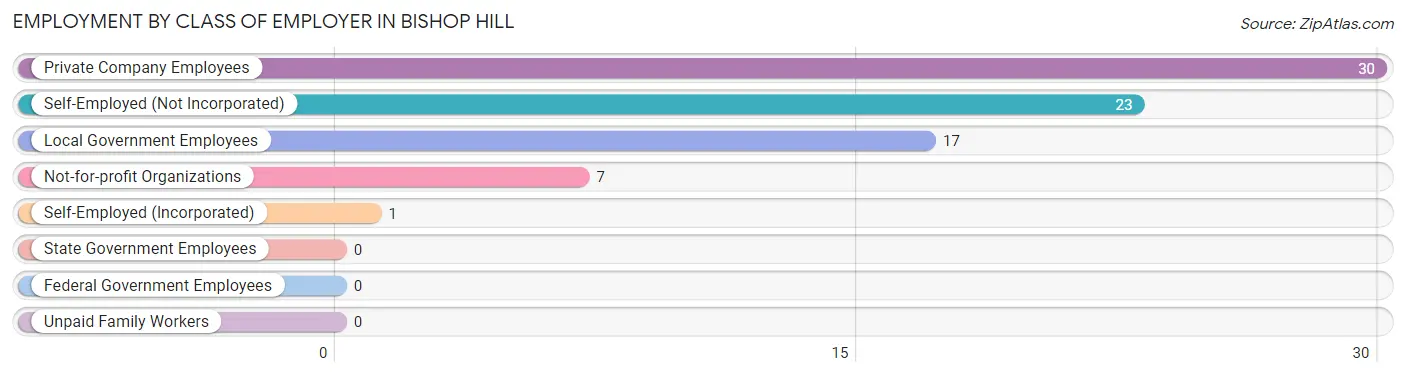
| Employer Class | # Employees | % Employees |
| Private Company Employees | 30 | 38.5% |
| Self-Employed (Incorporated) | 1 | 1.3% |
| Self-Employed (Not Incorporated) | 23 | 29.5% |
| Not-for-profit Organizations | 7 | 9.0% |
| Local Government Employees | 17 | 21.8% |
| State Government Employees | 0 | 0.0% |
| Federal Government Employees | 0 | 0.0% |
| Unpaid Family Workers | 0 | 0.0% |
| Total | 78 | 100.0% |
Employment Status by Age in Bishop Hill
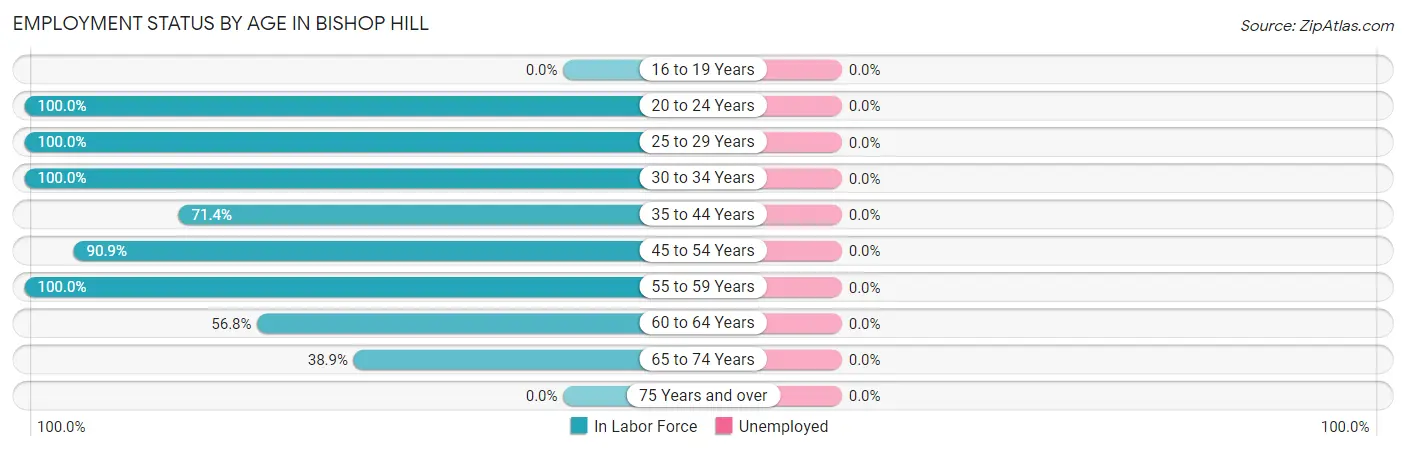
| Age Bracket | In Labor Force | Unemployed |
| 16 to 19 Years | 0 (0.0%) | 0 (0.0%) |
| 20 to 24 Years | 2 (100.0%) | 0 (0.0%) |
| 25 to 29 Years | 4 (100.0%) | 0 (0.0%) |
| 30 to 34 Years | 14 (100.0%) | 0 (0.0%) |
| 35 to 44 Years | 5 (71.4%) | 0 (0.0%) |
| 45 to 54 Years | 10 (90.9%) | 0 (0.0%) |
| 55 to 59 Years | 8 (100.0%) | 0 (0.0%) |
| 60 to 64 Years | 21 (56.8%) | 0 (0.0%) |
| 65 to 74 Years | 14 (38.9%) | 0 (0.0%) |
| 75 Years and over | 0 (0.0%) | 0 (0.0%) |
| Total | 78 (58.2%) | 0 (0.0%) |
Employment Status by Educational Attainment in Bishop Hill
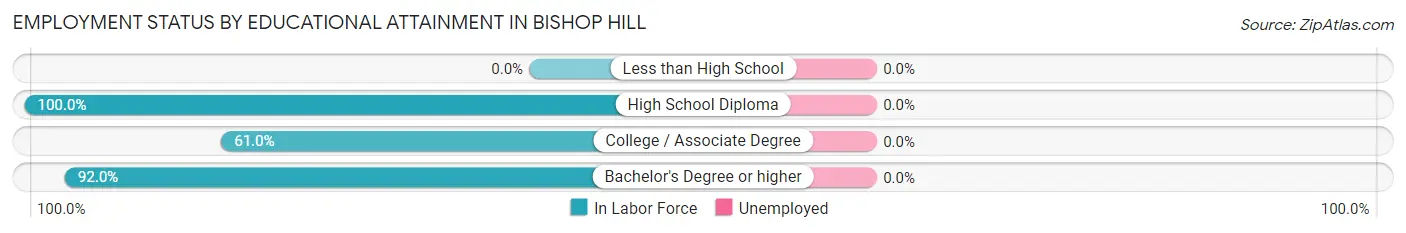
| Educational Attainment | In Labor Force | Unemployed |
| Less than High School | 0 (0.0%) | 0 (0.0%) |
| High School Diploma | 14 (100.0%) | 0 (0.0%) |
| College / Associate Degree | 25 (61.0%) | 0 (0.0%) |
| Bachelor's Degree or higher | 23 (92.0%) | 0 (0.0%) |
| Total | 62 (76.5%) | 0 (0.0%) |
Employment Occupations by Sex in Bishop Hill
Management, Business, Science and Arts Occupations
The most common Management, Business, Science and Arts occupations in Bishop Hill are Community & Social Service (23 | 29.5%), Education Instruction & Library (17 | 21.8%), Management (10 | 12.8%), Arts, Media & Entertainment (6 | 7.7%), and Business & Financial (3 | 3.8%).
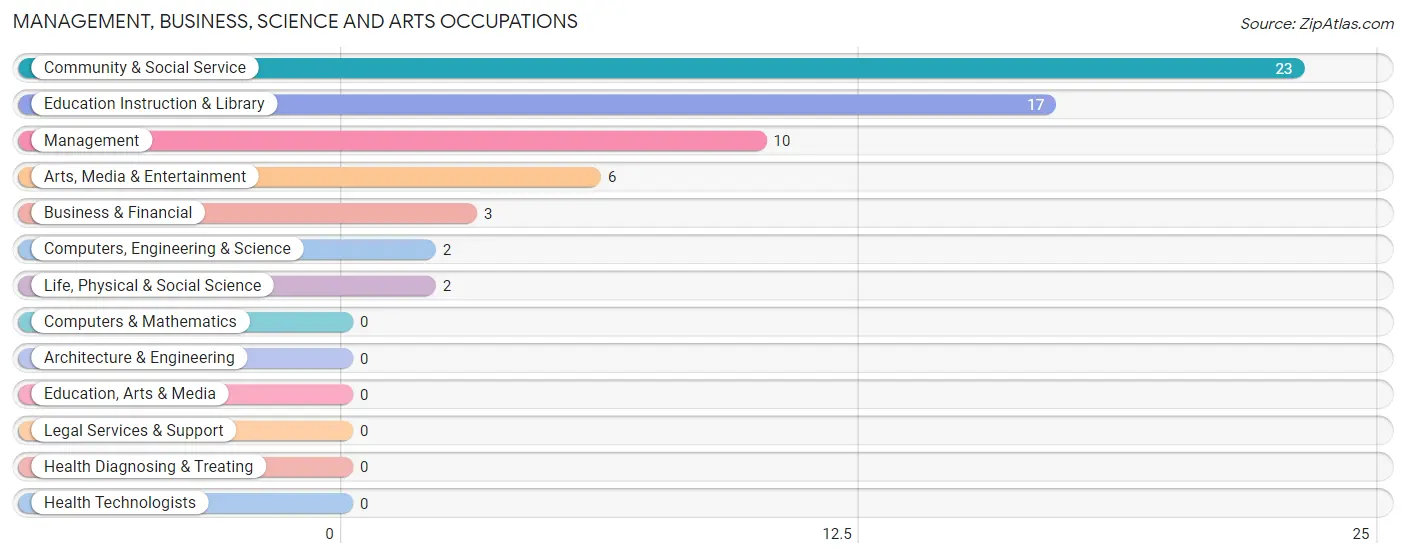
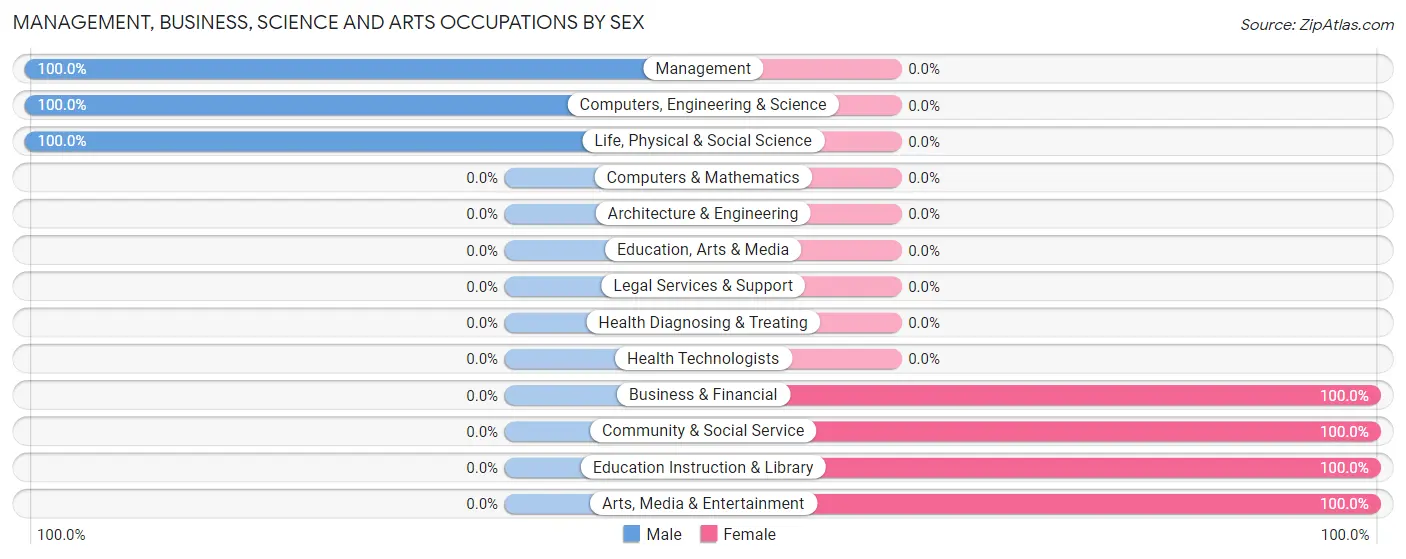
Management, Business, Science and Arts Occupations by Sex
Within the Management, Business, Science and Arts occupations in Bishop Hill, the most male-oriented occupations are Management (100.0%), Computers, Engineering & Science (100.0%), and Life, Physical & Social Science (100.0%), while the most female-oriented occupations are Business & Financial (100.0%), Community & Social Service (100.0%), and Education Instruction & Library (100.0%).
| Occupation | Male | Female |
| Management | 10 (100.0%) | 0 (0.0%) |
| Business & Financial | 0 (0.0%) | 3 (100.0%) |
| Computers, Engineering & Science | 2 (100.0%) | 0 (0.0%) |
| Computers & Mathematics | 0 (0.0%) | 0 (0.0%) |
| Architecture & Engineering | 0 (0.0%) | 0 (0.0%) |
| Life, Physical & Social Science | 2 (100.0%) | 0 (0.0%) |
| Community & Social Service | 0 (0.0%) | 23 (100.0%) |
| Education, Arts & Media | 0 (0.0%) | 0 (0.0%) |
| Legal Services & Support | 0 (0.0%) | 0 (0.0%) |
| Education Instruction & Library | 0 (0.0%) | 17 (100.0%) |
| Arts, Media & Entertainment | 0 (0.0%) | 6 (100.0%) |
| Health Diagnosing & Treating | 0 (0.0%) | 0 (0.0%) |
| Health Technologists | 0 (0.0%) | 0 (0.0%) |
| Total (Category) | 12 (31.6%) | 26 (68.4%) |
| Total (Overall) | 23 (29.5%) | 55 (70.5%) |
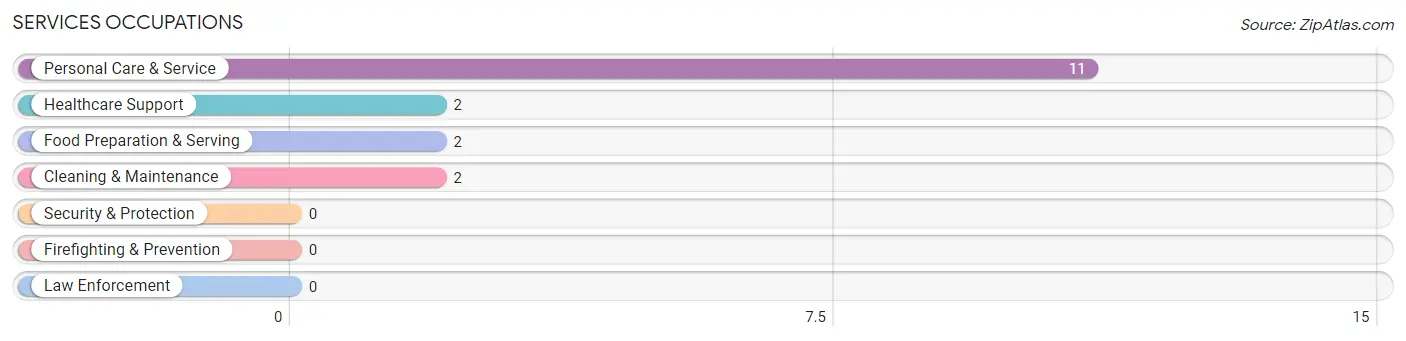
Services Occupations
The most common Services occupations in Bishop Hill are Personal Care & Service (11 | 14.1%), Healthcare Support (2 | 2.6%), Food Preparation & Serving (2 | 2.6%), and Cleaning & Maintenance (2 | 2.6%).
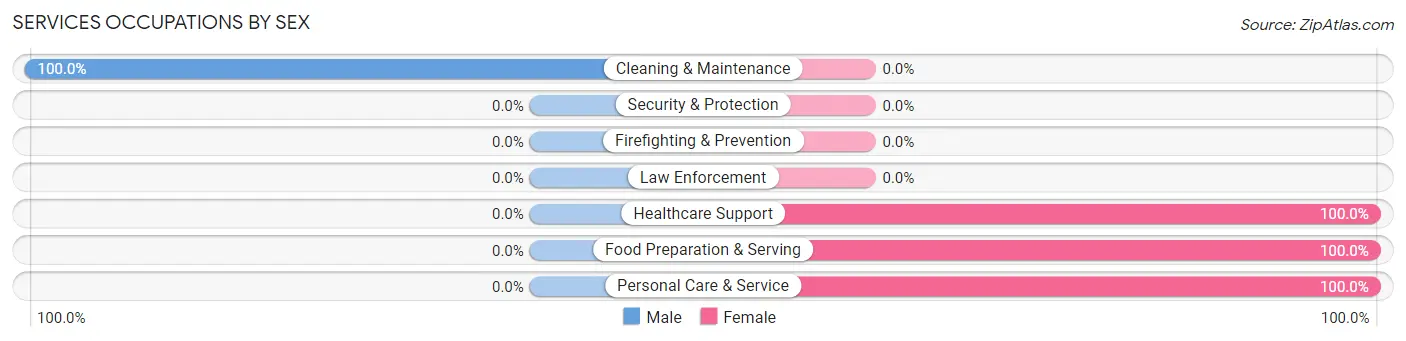
Services Occupations by Sex
| Occupation | Male | Female |
| Healthcare Support | 0 (0.0%) | 2 (100.0%) |
| Security & Protection | 0 (0.0%) | 0 (0.0%) |
| Firefighting & Prevention | 0 (0.0%) | 0 (0.0%) |
| Law Enforcement | 0 (0.0%) | 0 (0.0%) |
| Food Preparation & Serving | 0 (0.0%) | 2 (100.0%) |
| Cleaning & Maintenance | 2 (100.0%) | 0 (0.0%) |
| Personal Care & Service | 0 (0.0%) | 11 (100.0%) |
| Total (Category) | 2 (11.8%) | 15 (88.2%) |
| Total (Overall) | 23 (29.5%) | 55 (70.5%) |
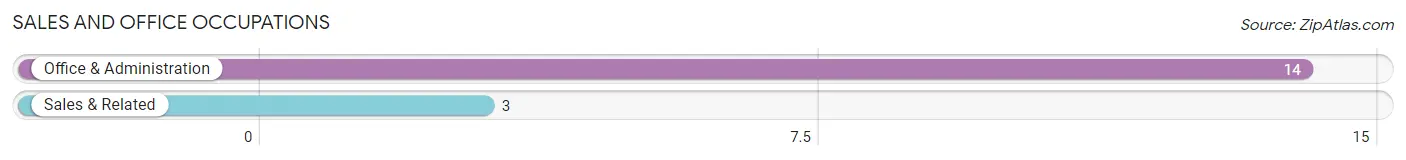
Sales and Office Occupations
The most common Sales and Office occupations in Bishop Hill are Office & Administration (14 | 17.9%), and Sales & Related (3 | 3.8%).
Sales and Office Occupations by Sex
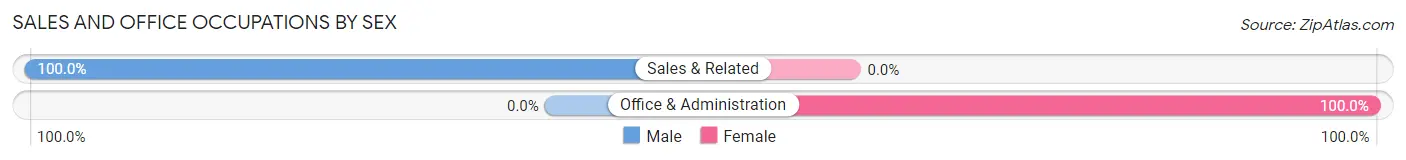
| Occupation | Male | Female |
| Sales & Related | 3 (100.0%) | 0 (0.0%) |
| Office & Administration | 0 (0.0%) | 14 (100.0%) |
| Total (Category) | 3 (17.6%) | 14 (82.4%) |
| Total (Overall) | 23 (29.5%) | 55 (70.5%) |
Natural Resources, Construction and Maintenance Occupations
The most common Natural Resources, Construction and Maintenance occupations in Bishop Hill are Construction & Extraction (4 | 5.1%), and Farming, Fishing & Forestry (2 | 2.6%).
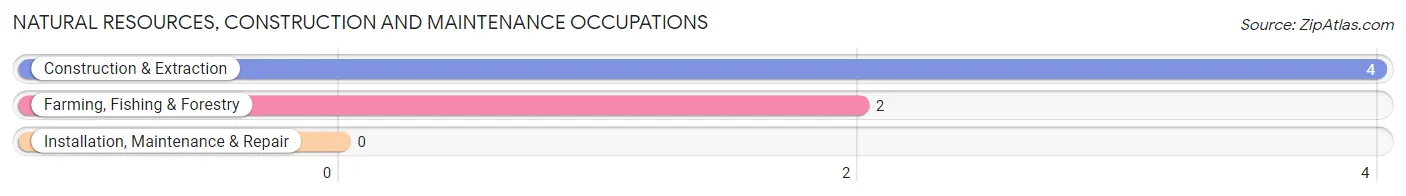
Natural Resources, Construction and Maintenance Occupations by Sex
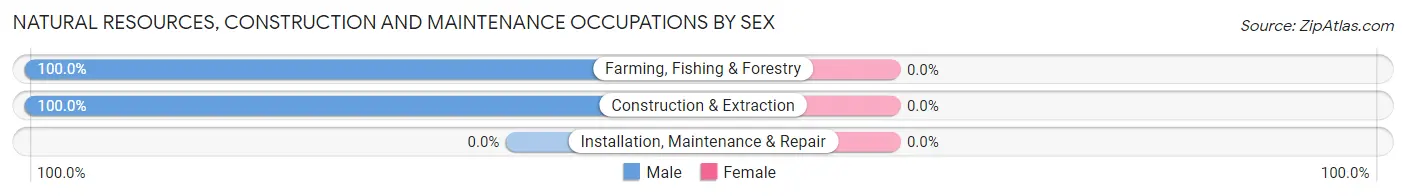
| Occupation | Male | Female |
| Farming, Fishing & Forestry | 2 (100.0%) | 0 (0.0%) |
| Construction & Extraction | 4 (100.0%) | 0 (0.0%) |
| Installation, Maintenance & Repair | 0 (0.0%) | 0 (0.0%) |
| Total (Category) | 6 (100.0%) | 0 (0.0%) |
| Total (Overall) | 23 (29.5%) | 55 (70.5%) |
Production, Transportation and Moving Occupations
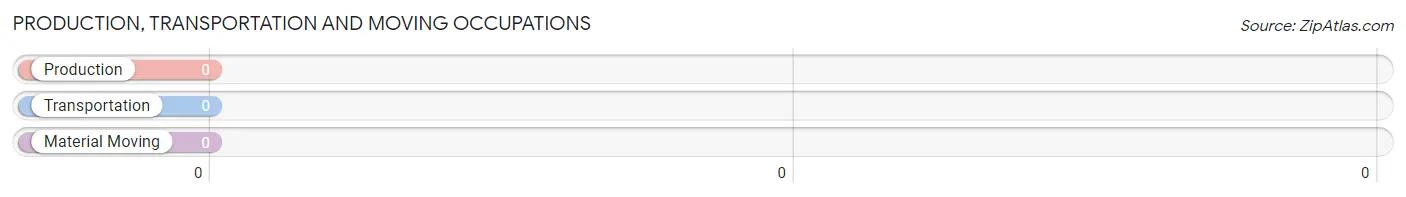
Production, Transportation and Moving Occupations by Sex
| Occupation | Male | Female |
| Production | 0 (0.0%) | 0 (0.0%) |
| Transportation | 0 (0.0%) | 0 (0.0%) |
| Material Moving | 0 (0.0%) | 0 (0.0%) |
| Total (Category) | 0 (0.0%) | 0 (0.0%) |
| Total (Overall) | 23 (29.5%) | 55 (70.5%) |
Employment Industries by Sex in Bishop Hill
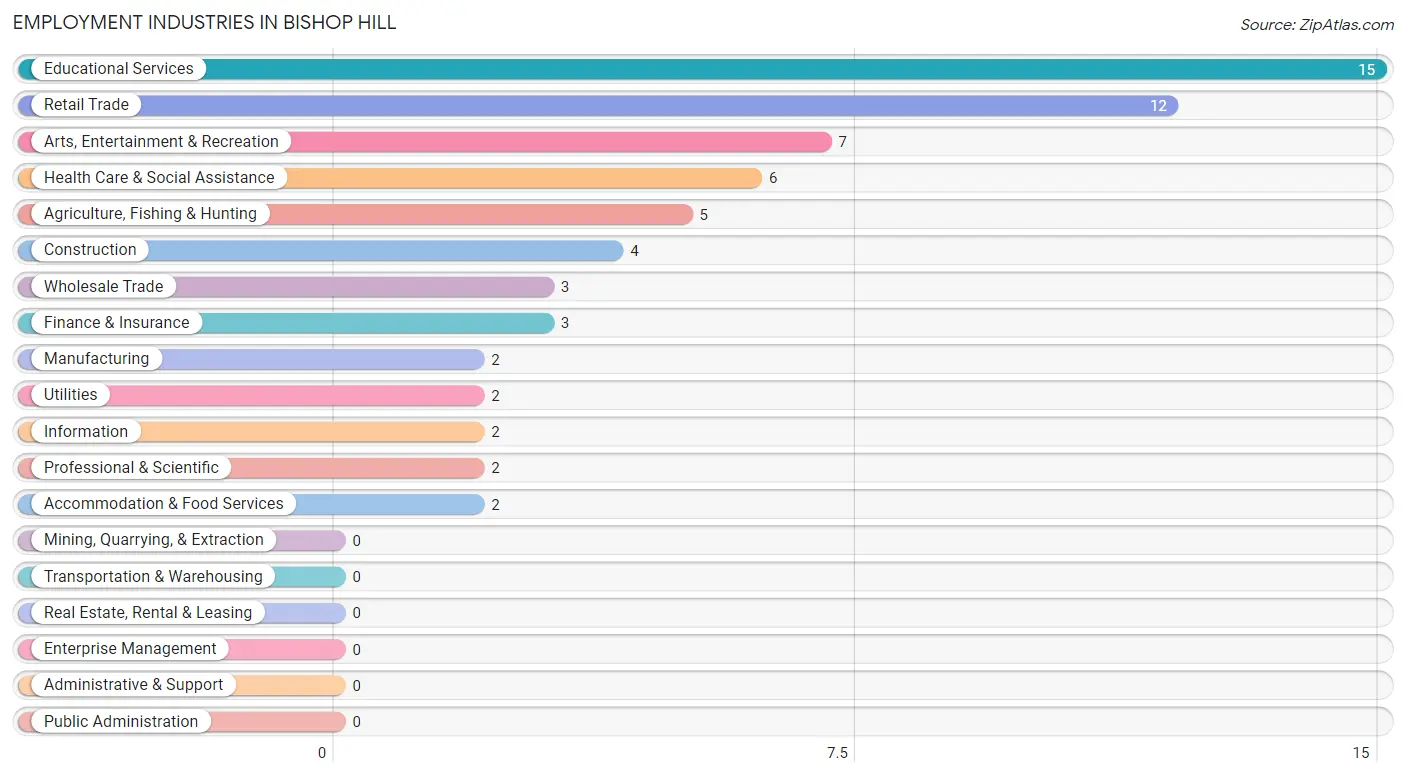
Employment Industries in Bishop Hill
The major employment industries in Bishop Hill include Educational Services (15 | 19.2%), Retail Trade (12 | 15.4%), Arts, Entertainment & Recreation (7 | 9.0%), Health Care & Social Assistance (6 | 7.7%), and Agriculture, Fishing & Hunting (5 | 6.4%).
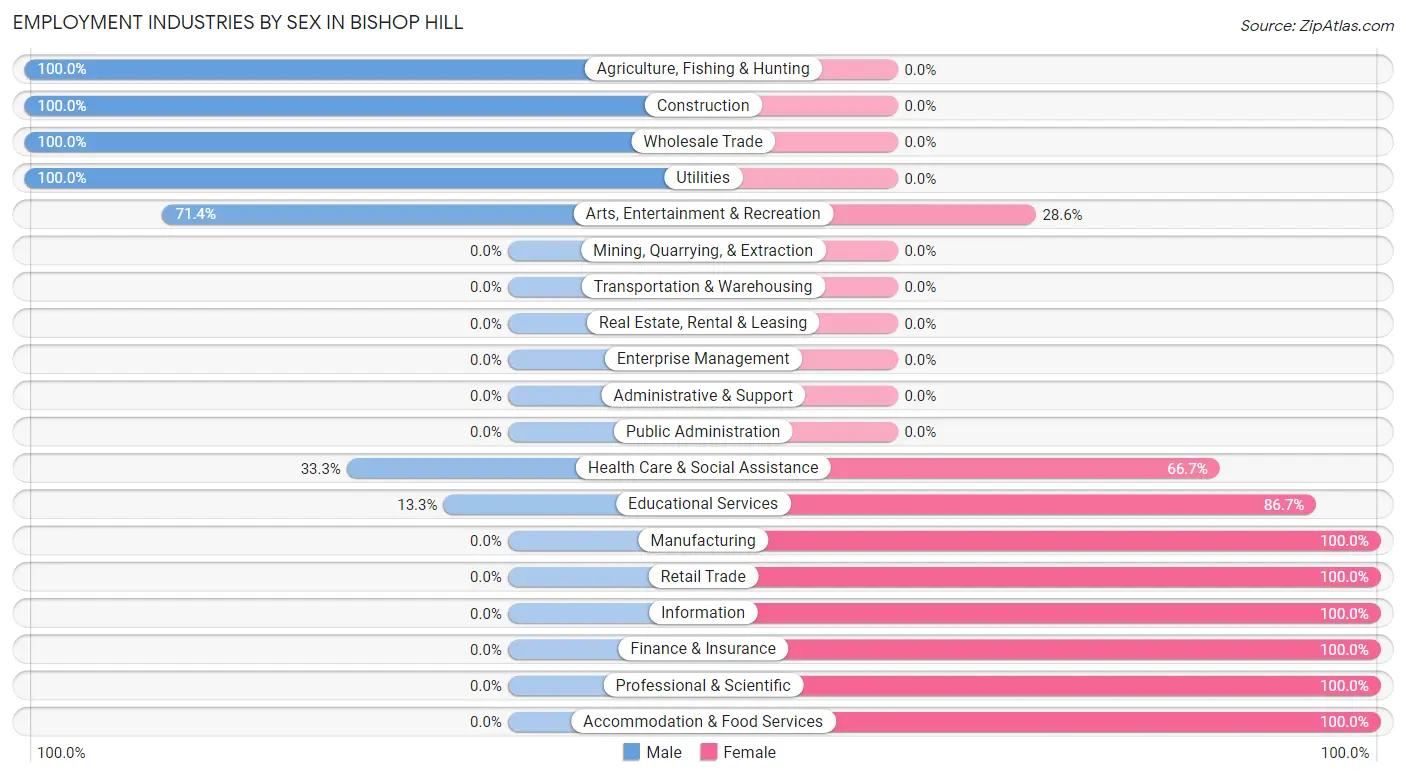
Employment Industries by Sex in Bishop Hill
The Bishop Hill industries that see more men than women are Agriculture, Fishing & Hunting (100.0%), Construction (100.0%), and Wholesale Trade (100.0%), whereas the industries that tend to have a higher number of women are Manufacturing (100.0%), Retail Trade (100.0%), and Information (100.0%).
| Industry | Male | Female |
| Agriculture, Fishing & Hunting | 5 (100.0%) | 0 (0.0%) |
| Mining, Quarrying, & Extraction | 0 (0.0%) | 0 (0.0%) |
| Construction | 4 (100.0%) | 0 (0.0%) |
| Manufacturing | 0 (0.0%) | 2 (100.0%) |
| Wholesale Trade | 3 (100.0%) | 0 (0.0%) |
| Retail Trade | 0 (0.0%) | 12 (100.0%) |
| Transportation & Warehousing | 0 (0.0%) | 0 (0.0%) |
| Utilities | 2 (100.0%) | 0 (0.0%) |
| Information | 0 (0.0%) | 2 (100.0%) |
| Finance & Insurance | 0 (0.0%) | 3 (100.0%) |
| Real Estate, Rental & Leasing | 0 (0.0%) | 0 (0.0%) |
| Professional & Scientific | 0 (0.0%) | 2 (100.0%) |
| Enterprise Management | 0 (0.0%) | 0 (0.0%) |
| Administrative & Support | 0 (0.0%) | 0 (0.0%) |
| Educational Services | 2 (13.3%) | 13 (86.7%) |
| Health Care & Social Assistance | 2 (33.3%) | 4 (66.7%) |
| Arts, Entertainment & Recreation | 5 (71.4%) | 2 (28.6%) |
| Accommodation & Food Services | 0 (0.0%) | 2 (100.0%) |
| Public Administration | 0 (0.0%) | 0 (0.0%) |
| Total | 23 (29.5%) | 55 (70.5%) |
Education in Bishop Hill
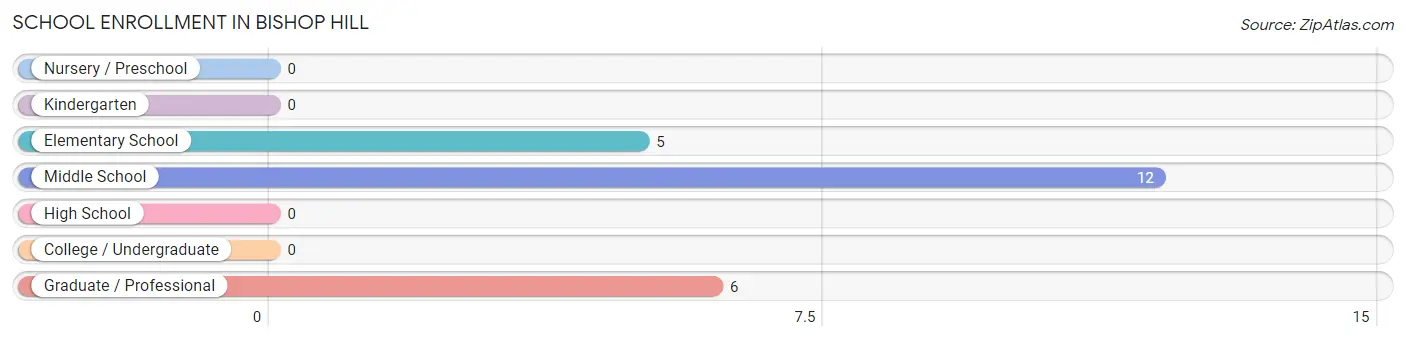
School Enrollment in Bishop Hill
The most common levels of schooling among the 23 students in Bishop Hill are middle school (12 | 52.2%), graduate / professional (6 | 26.1%), and elementary school (5 | 21.7%).
| School Level | # Students | % Students |
| Nursery / Preschool | 0 | 0.0% |
| Kindergarten | 0 | 0.0% |
| Elementary School | 5 | 21.7% |
| Middle School | 12 | 52.2% |
| High School | 0 | 0.0% |
| College / Undergraduate | 0 | 0.0% |
| Graduate / Professional | 6 | 26.1% |
| Total | 23 | 100.0% |
School Enrollment by Age by Funding Source in Bishop Hill
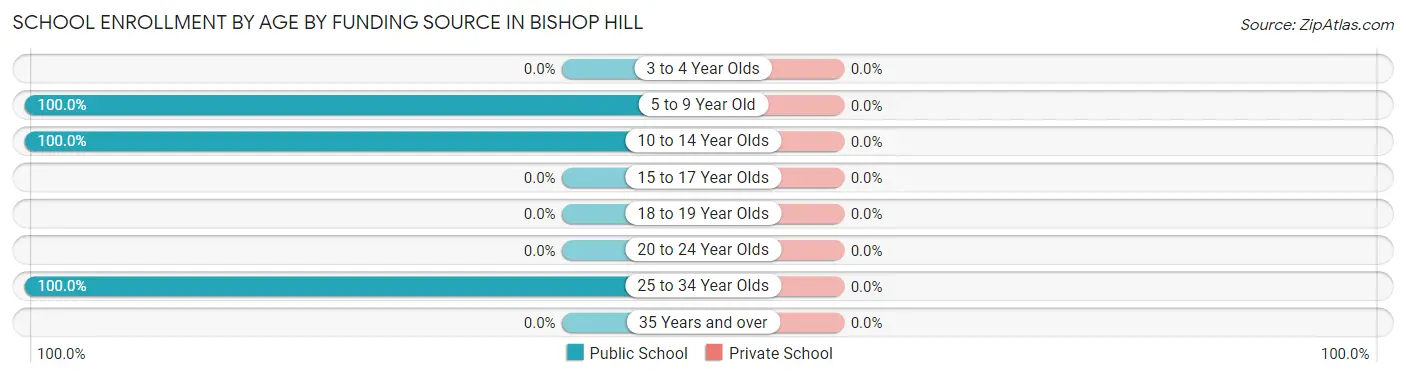
| Age Bracket | Public School | Private School |
| 3 to 4 Year Olds | 0 (0.0%) | 0 (0.0%) |
| 5 to 9 Year Old | 5 (100.0%) | 0 (0.0%) |
| 10 to 14 Year Olds | 12 (100.0%) | 0 (0.0%) |
| 15 to 17 Year Olds | 0 (0.0%) | 0 (0.0%) |
| 18 to 19 Year Olds | 0 (0.0%) | 0 (0.0%) |
| 20 to 24 Year Olds | 0 (0.0%) | 0 (0.0%) |
| 25 to 34 Year Olds | 6 (100.0%) | 0 (0.0%) |
| 35 Years and over | 0 (0.0%) | 0 (0.0%) |
| Total | 23 (100.0%) | 0 (0.0%) |
Educational Attainment by Field of Study in Bishop Hill
Education (16 | 34.8%), visual & performing arts (8 | 17.4%), business (5 | 10.9%), arts & humanities (5 | 10.9%), and psychology (4 | 8.7%) are the most common fields of study among 46 individuals in Bishop Hill who have obtained a bachelor's degree or higher.
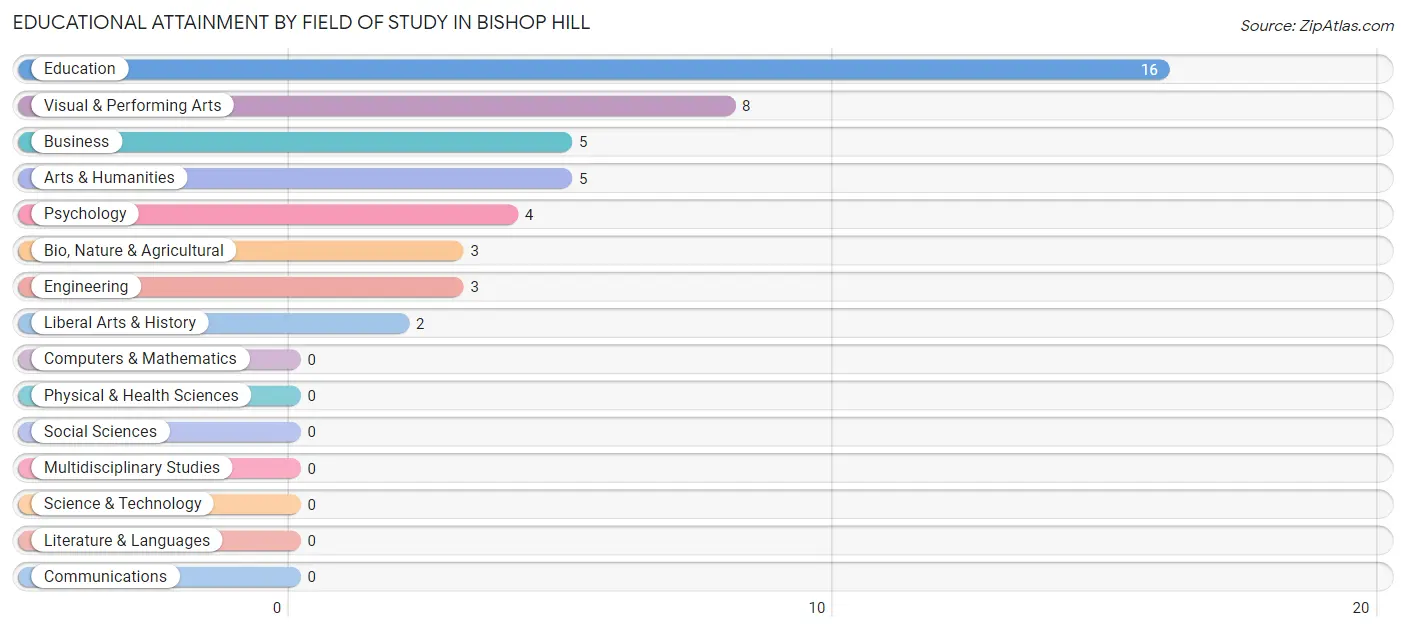
| Field of Study | # Graduates | % Graduates |
| Computers & Mathematics | 0 | 0.0% |
| Bio, Nature & Agricultural | 3 | 6.5% |
| Physical & Health Sciences | 0 | 0.0% |
| Psychology | 4 | 8.7% |
| Social Sciences | 0 | 0.0% |
| Engineering | 3 | 6.5% |
| Multidisciplinary Studies | 0 | 0.0% |
| Science & Technology | 0 | 0.0% |
| Business | 5 | 10.9% |
| Education | 16 | 34.8% |
| Literature & Languages | 0 | 0.0% |
| Liberal Arts & History | 2 | 4.3% |
| Visual & Performing Arts | 8 | 17.4% |
| Communications | 0 | 0.0% |
| Arts & Humanities | 5 | 10.9% |
| Total | 46 | 100.0% |
Transportation & Commute in Bishop Hill
Vehicle Availability by Sex in Bishop Hill
The most prevalent vehicle ownership categories in Bishop Hill are males with 3 vehicles (13, accounting for 56.5%) and females with 3 vehicles (20, making up 23.6%).
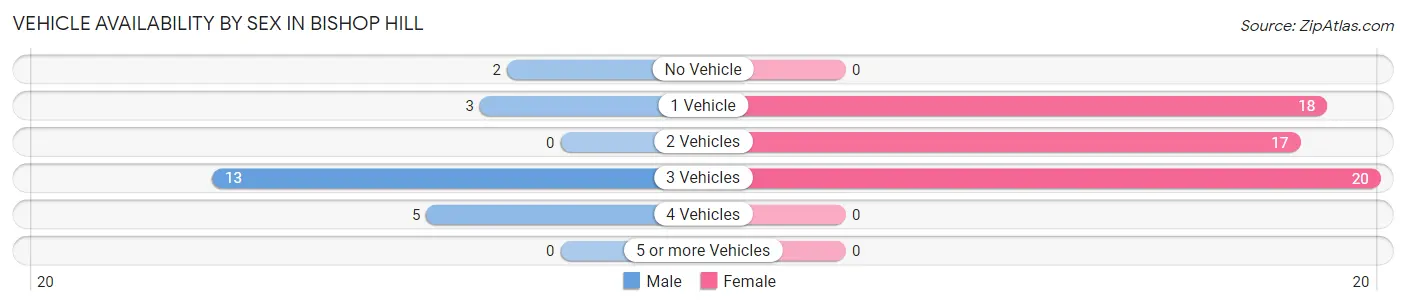
| Vehicles Available | Male | Female |
| No Vehicle | 2 (8.7%) | 0 (0.0%) |
| 1 Vehicle | 3 (13.0%) | 18 (32.7%) |
| 2 Vehicles | 0 (0.0%) | 17 (30.9%) |
| 3 Vehicles | 13 (56.5%) | 20 (36.4%) |
| 4 Vehicles | 5 (21.7%) | 0 (0.0%) |
| 5 or more Vehicles | 0 (0.0%) | 0 (0.0%) |
| Total | 23 (100.0%) | 55 (100.0%) |
Commute Time in Bishop Hill
The most frequently occuring commute durations in Bishop Hill are 10 to 14 minutes (20 commuters, 28.6%), 5 to 9 minutes (14 commuters, 20.0%), and 60 to 89 minutes (14 commuters, 20.0%).
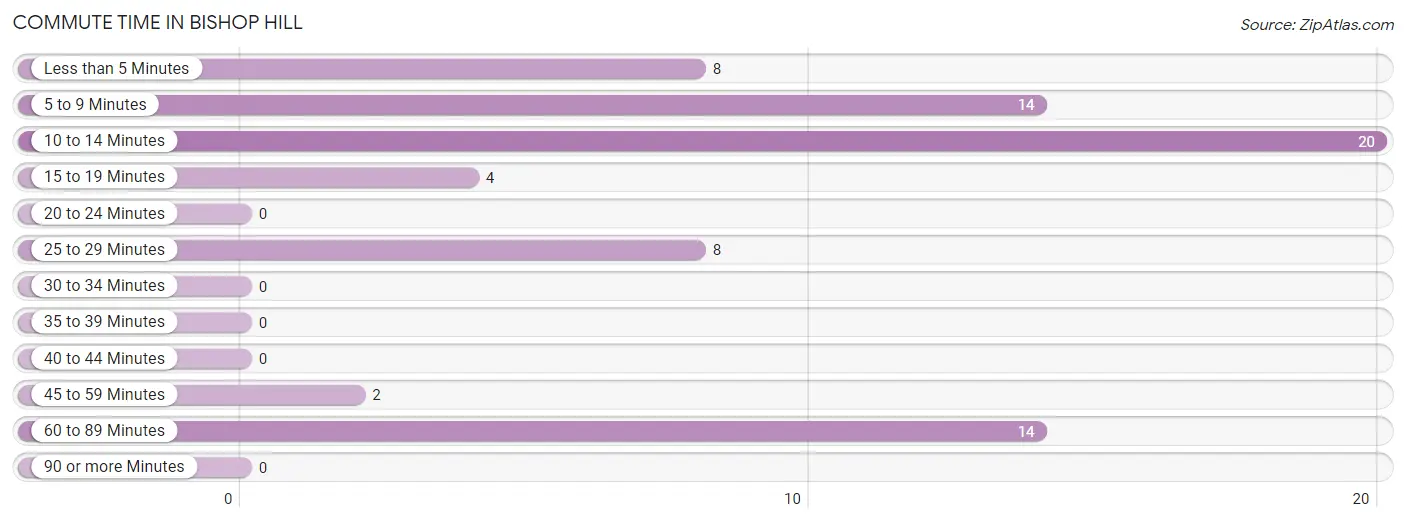
| Commute Time | # Commuters | % Commuters |
| Less than 5 Minutes | 8 | 11.4% |
| 5 to 9 Minutes | 14 | 20.0% |
| 10 to 14 Minutes | 20 | 28.6% |
| 15 to 19 Minutes | 4 | 5.7% |
| 20 to 24 Minutes | 0 | 0.0% |
| 25 to 29 Minutes | 8 | 11.4% |
| 30 to 34 Minutes | 0 | 0.0% |
| 35 to 39 Minutes | 0 | 0.0% |
| 40 to 44 Minutes | 0 | 0.0% |
| 45 to 59 Minutes | 2 | 2.9% |
| 60 to 89 Minutes | 14 | 20.0% |
| 90 or more Minutes | 0 | 0.0% |
Commute Time by Sex in Bishop Hill
The most common commute times in Bishop Hill are less than 5 minutes (6 commuters, 26.1%) for males and 10 to 14 minutes (15 commuters, 31.9%) for females.
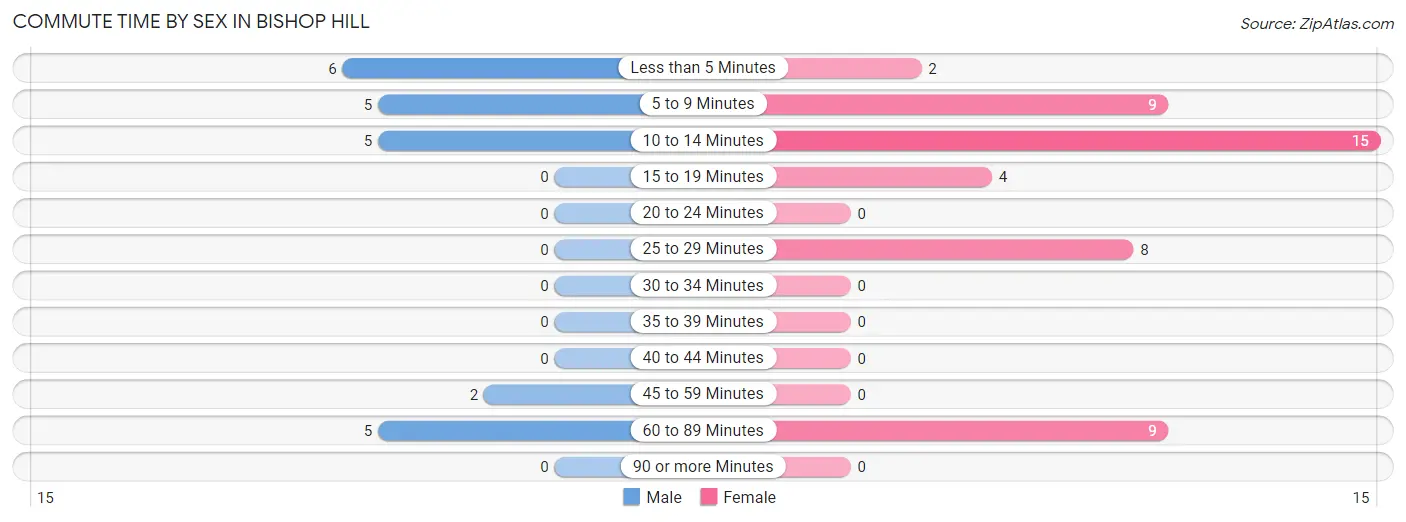
| Commute Time | Male | Female |
| Less than 5 Minutes | 6 (26.1%) | 2 (4.3%) |
| 5 to 9 Minutes | 5 (21.7%) | 9 (19.2%) |
| 10 to 14 Minutes | 5 (21.7%) | 15 (31.9%) |
| 15 to 19 Minutes | 0 (0.0%) | 4 (8.5%) |
| 20 to 24 Minutes | 0 (0.0%) | 0 (0.0%) |
| 25 to 29 Minutes | 0 (0.0%) | 8 (17.0%) |
| 30 to 34 Minutes | 0 (0.0%) | 0 (0.0%) |
| 35 to 39 Minutes | 0 (0.0%) | 0 (0.0%) |
| 40 to 44 Minutes | 0 (0.0%) | 0 (0.0%) |
| 45 to 59 Minutes | 2 (8.7%) | 0 (0.0%) |
| 60 to 89 Minutes | 5 (21.7%) | 9 (19.2%) |
| 90 or more Minutes | 0 (0.0%) | 0 (0.0%) |
Time of Departure to Work by Sex in Bishop Hill
The most frequent times of departure to work in Bishop Hill are 8:00 AM to 8:29 AM (10, 43.5%) for males and 6:30 AM to 6:59 AM (13, 27.7%) for females.
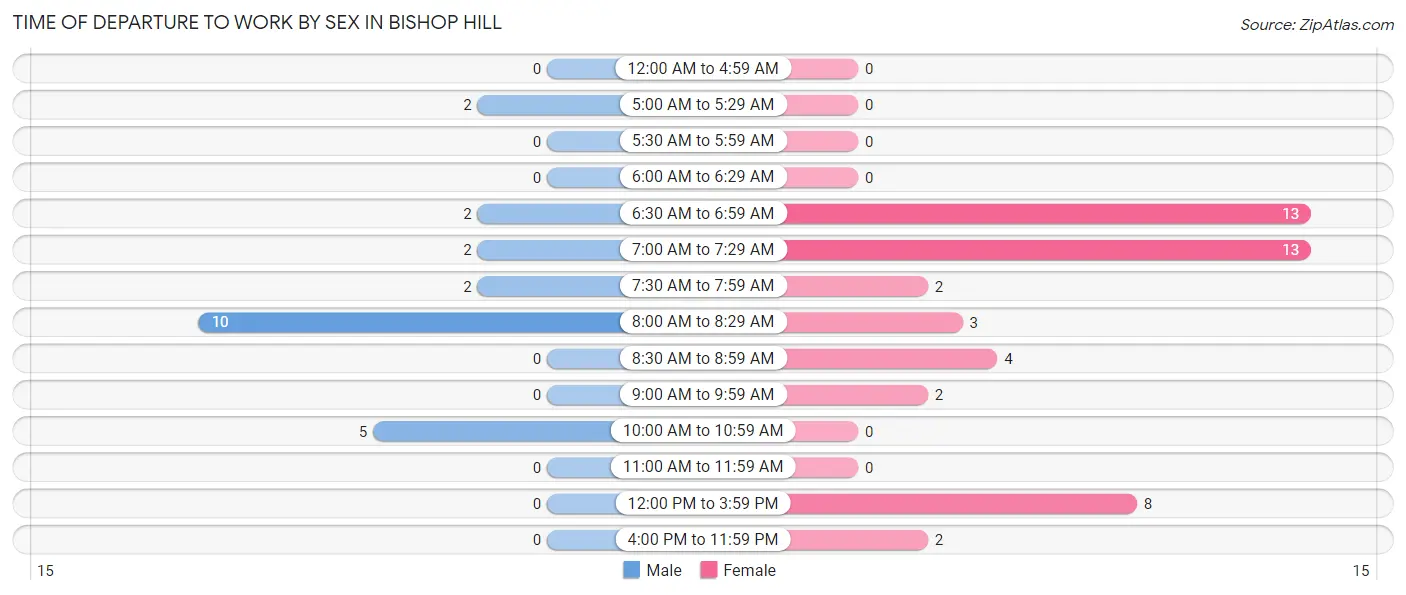
| Time of Departure | Male | Female |
| 12:00 AM to 4:59 AM | 0 (0.0%) | 0 (0.0%) |
| 5:00 AM to 5:29 AM | 2 (8.7%) | 0 (0.0%) |
| 5:30 AM to 5:59 AM | 0 (0.0%) | 0 (0.0%) |
| 6:00 AM to 6:29 AM | 0 (0.0%) | 0 (0.0%) |
| 6:30 AM to 6:59 AM | 2 (8.7%) | 13 (27.7%) |
| 7:00 AM to 7:29 AM | 2 (8.7%) | 13 (27.7%) |
| 7:30 AM to 7:59 AM | 2 (8.7%) | 2 (4.3%) |
| 8:00 AM to 8:29 AM | 10 (43.5%) | 3 (6.4%) |
| 8:30 AM to 8:59 AM | 0 (0.0%) | 4 (8.5%) |
| 9:00 AM to 9:59 AM | 0 (0.0%) | 2 (4.3%) |
| 10:00 AM to 10:59 AM | 5 (21.7%) | 0 (0.0%) |
| 11:00 AM to 11:59 AM | 0 (0.0%) | 0 (0.0%) |
| 12:00 PM to 3:59 PM | 0 (0.0%) | 8 (17.0%) |
| 4:00 PM to 11:59 PM | 0 (0.0%) | 2 (4.3%) |
| Total | 23 (100.0%) | 47 (100.0%) |
Housing Occupancy in Bishop Hill
Occupancy by Ownership in Bishop Hill
Of the total 71 dwellings in Bishop Hill, owner-occupied units account for 59 (83.1%), while renter-occupied units make up 12 (16.9%).
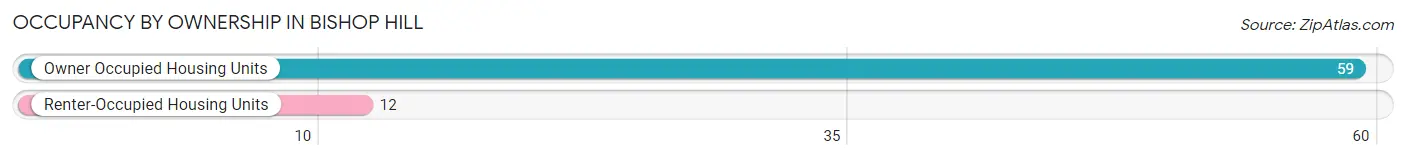
| Occupancy | # Housing Units | % Housing Units |
| Owner Occupied Housing Units | 59 | 83.1% |
| Renter-Occupied Housing Units | 12 | 16.9% |
| Total Occupied Housing Units | 71 | 100.0% |
Occupancy by Household Size in Bishop Hill
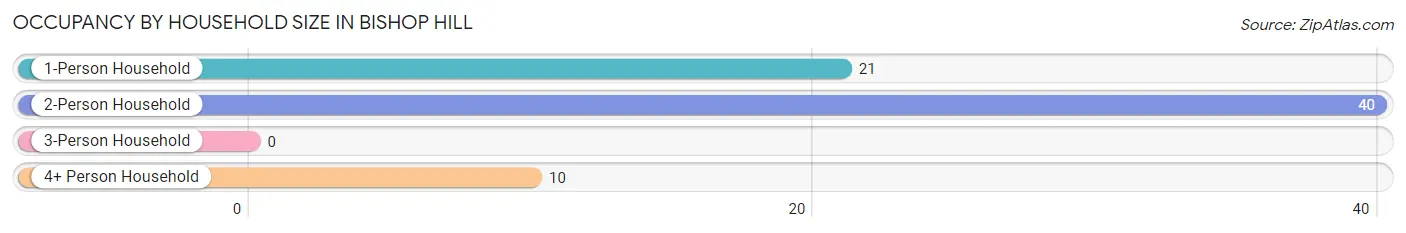
| Household Size | # Housing Units | % Housing Units |
| 1-Person Household | 21 | 29.6% |
| 2-Person Household | 40 | 56.3% |
| 3-Person Household | 0 | 0.0% |
| 4+ Person Household | 10 | 14.1% |
| Total Housing Units | 71 | 100.0% |
Occupancy by Ownership by Household Size in Bishop Hill
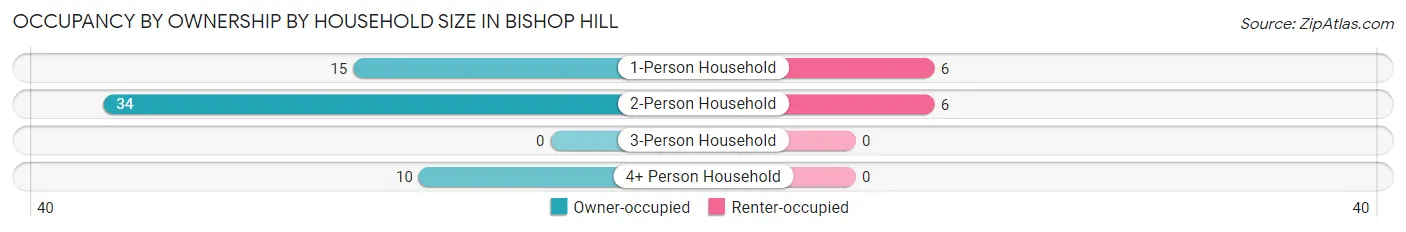
| Household Size | Owner-occupied | Renter-occupied |
| 1-Person Household | 15 (71.4%) | 6 (28.6%) |
| 2-Person Household | 34 (85.0%) | 6 (15.0%) |
| 3-Person Household | 0 (0.0%) | 0 (0.0%) |
| 4+ Person Household | 10 (100.0%) | 0 (0.0%) |
| Total Housing Units | 59 (83.1%) | 12 (16.9%) |
Occupancy by Educational Attainment in Bishop Hill
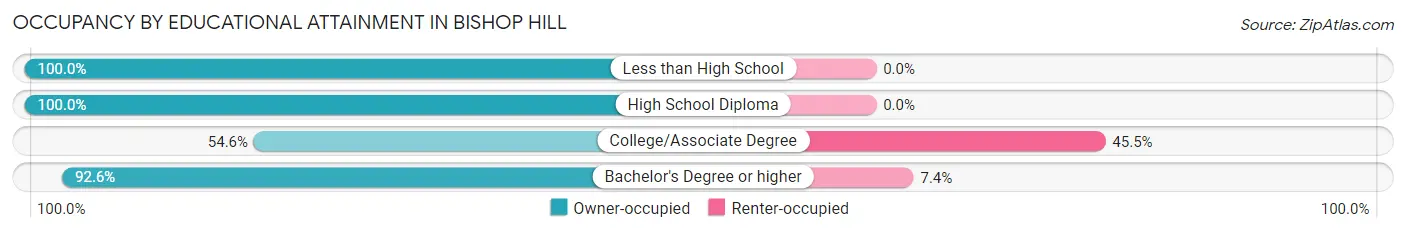
| Household Size | Owner-occupied | Renter-occupied |
| Less than High School | 1 (100.0%) | 0 (0.0%) |
| High School Diploma | 21 (100.0%) | 0 (0.0%) |
| College/Associate Degree | 12 (54.5%) | 10 (45.5%) |
| Bachelor's Degree or higher | 25 (92.6%) | 2 (7.4%) |
Occupancy by Age of Householder in Bishop Hill
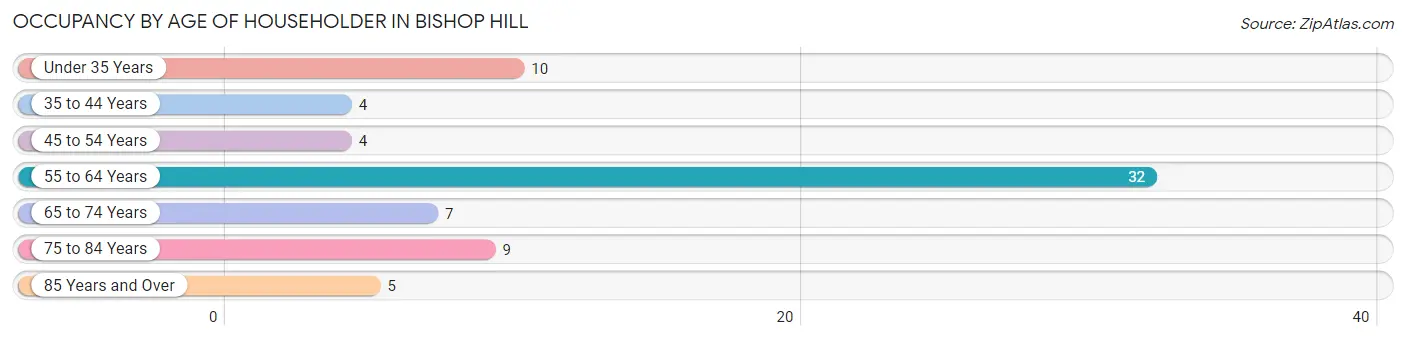
| Age Bracket | # Households | % Households |
| Under 35 Years | 10 | 14.1% |
| 35 to 44 Years | 4 | 5.6% |
| 45 to 54 Years | 4 | 5.6% |
| 55 to 64 Years | 32 | 45.1% |
| 65 to 74 Years | 7 | 9.9% |
| 75 to 84 Years | 9 | 12.7% |
| 85 Years and Over | 5 | 7.0% |
| Total | 71 | 100.0% |
Housing Finances in Bishop Hill
Median Income by Occupancy in Bishop Hill
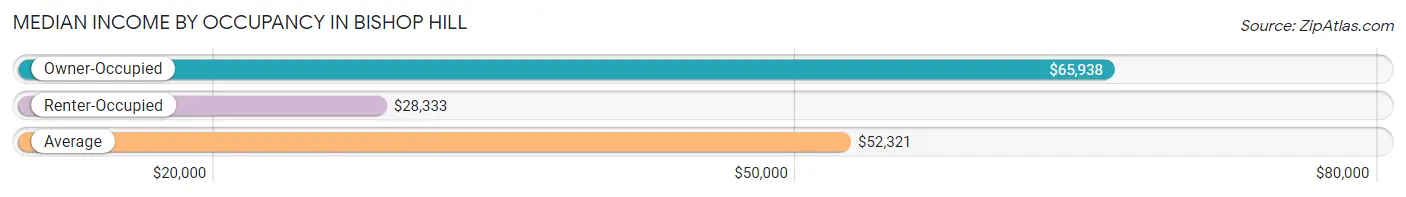
| Occupancy Type | # Households | Median Income |
| Owner-Occupied | 59 (83.1%) | $65,938 |
| Renter-Occupied | 12 (16.9%) | $28,333 |
| Average | 71 (100.0%) | $52,321 |
Occupancy by Householder Income Bracket in Bishop Hill
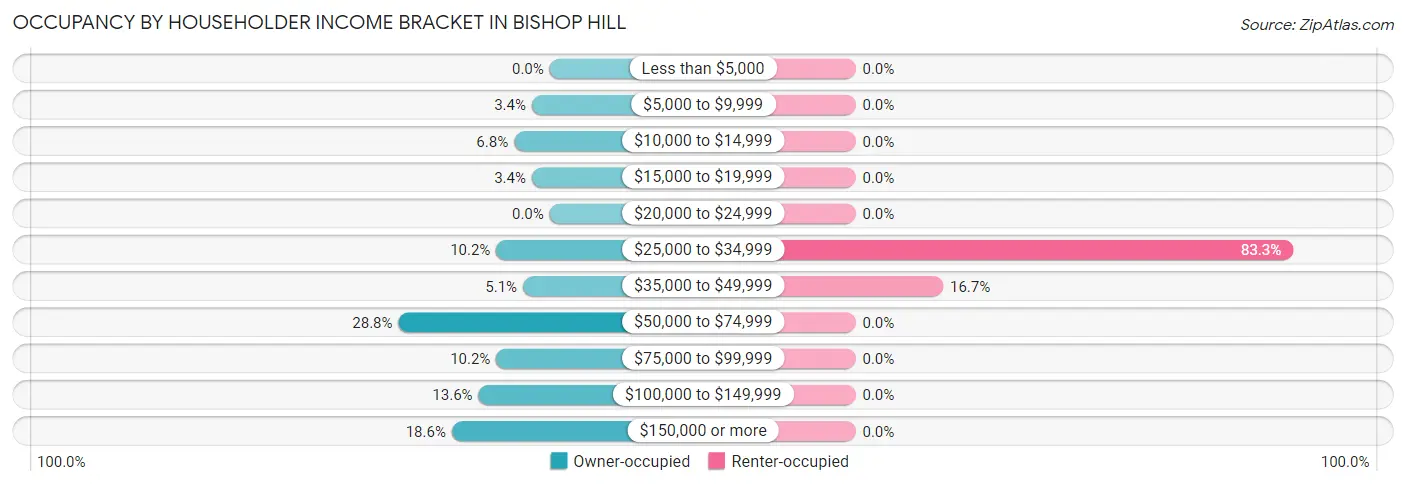
| Income Bracket | Owner-occupied | Renter-occupied |
| Less than $5,000 | 0 (0.0%) | 0 (0.0%) |
| $5,000 to $9,999 | 2 (3.4%) | 0 (0.0%) |
| $10,000 to $14,999 | 4 (6.8%) | 0 (0.0%) |
| $15,000 to $19,999 | 2 (3.4%) | 0 (0.0%) |
| $20,000 to $24,999 | 0 (0.0%) | 0 (0.0%) |
| $25,000 to $34,999 | 6 (10.2%) | 10 (83.3%) |
| $35,000 to $49,999 | 3 (5.1%) | 2 (16.7%) |
| $50,000 to $74,999 | 17 (28.8%) | 0 (0.0%) |
| $75,000 to $99,999 | 6 (10.2%) | 0 (0.0%) |
| $100,000 to $149,999 | 8 (13.6%) | 0 (0.0%) |
| $150,000 or more | 11 (18.6%) | 0 (0.0%) |
| Total | 59 (100.0%) | 12 (100.0%) |
Monthly Housing Cost Tiers in Bishop Hill
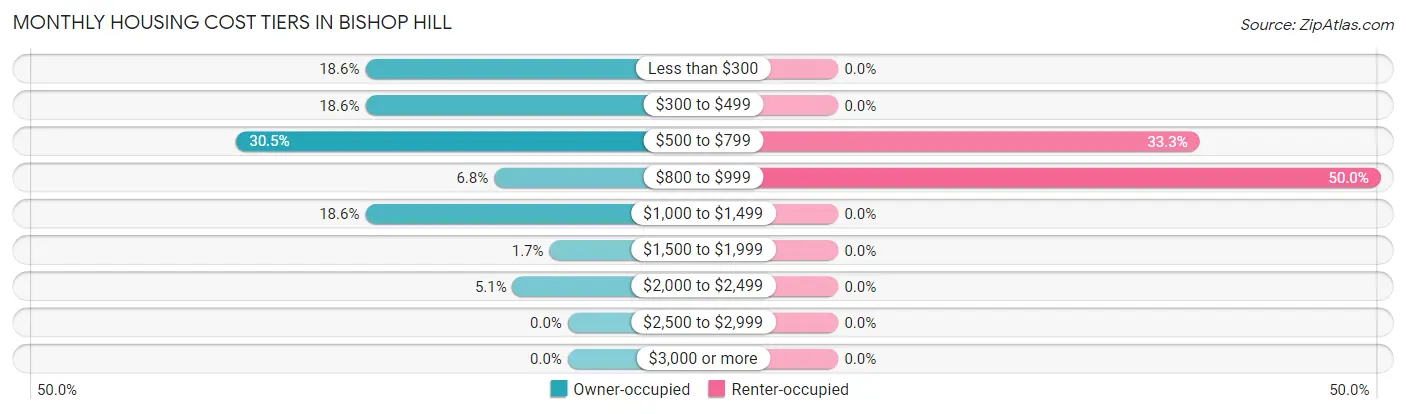
| Monthly Cost | Owner-occupied | Renter-occupied |
| Less than $300 | 11 (18.6%) | 0 (0.0%) |
| $300 to $499 | 11 (18.6%) | 0 (0.0%) |
| $500 to $799 | 18 (30.5%) | 4 (33.3%) |
| $800 to $999 | 4 (6.8%) | 6 (50.0%) |
| $1,000 to $1,499 | 11 (18.6%) | 0 (0.0%) |
| $1,500 to $1,999 | 1 (1.7%) | 0 (0.0%) |
| $2,000 to $2,499 | 3 (5.1%) | 0 (0.0%) |
| $2,500 to $2,999 | 0 (0.0%) | 0 (0.0%) |
| $3,000 or more | 0 (0.0%) | 0 (0.0%) |
| Total | 59 (100.0%) | 12 (100.0%) |
Physical Housing Characteristics in Bishop Hill
Housing Structures in Bishop Hill
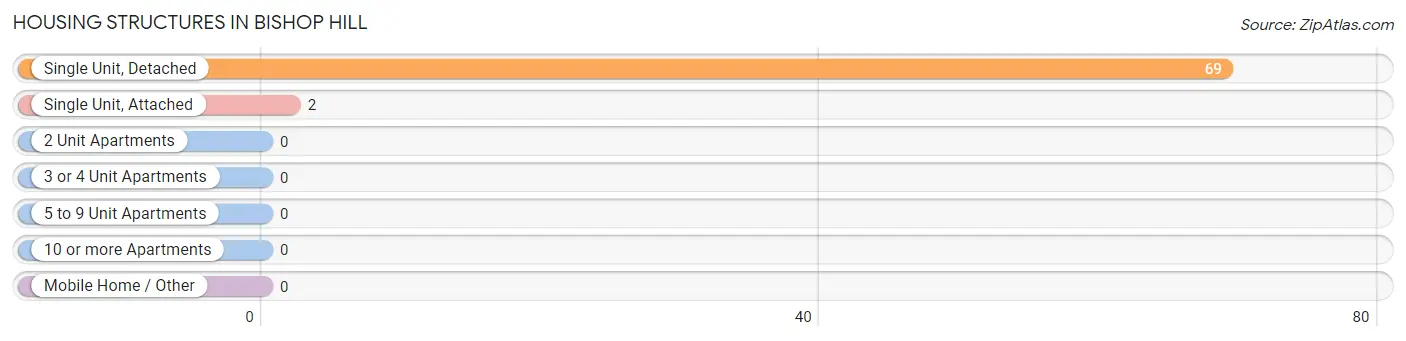
| Structure Type | # Housing Units | % Housing Units |
| Single Unit, Detached | 69 | 97.2% |
| Single Unit, Attached | 2 | 2.8% |
| 2 Unit Apartments | 0 | 0.0% |
| 3 or 4 Unit Apartments | 0 | 0.0% |
| 5 to 9 Unit Apartments | 0 | 0.0% |
| 10 or more Apartments | 0 | 0.0% |
| Mobile Home / Other | 0 | 0.0% |
| Total | 71 | 100.0% |
Housing Structures by Occupancy in Bishop Hill
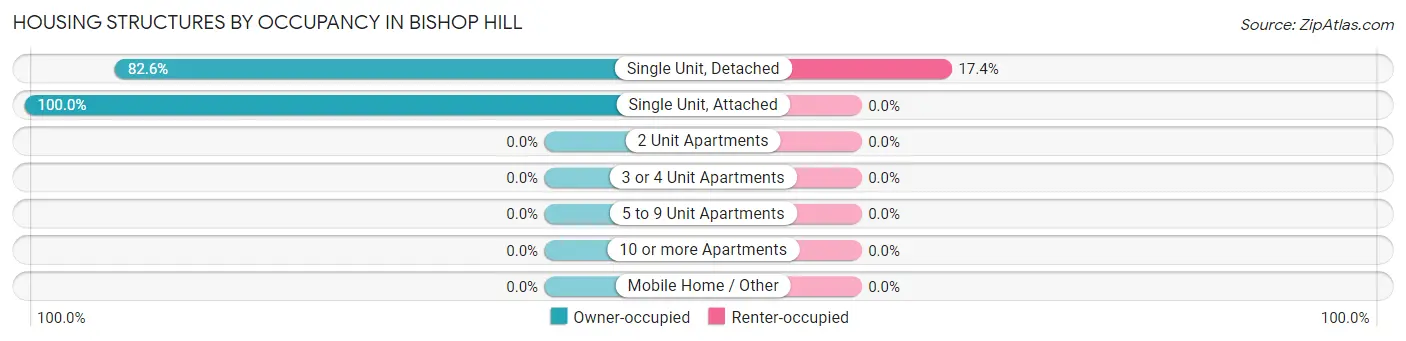
| Structure Type | Owner-occupied | Renter-occupied |
| Single Unit, Detached | 57 (82.6%) | 12 (17.4%) |
| Single Unit, Attached | 2 (100.0%) | 0 (0.0%) |
| 2 Unit Apartments | 0 (0.0%) | 0 (0.0%) |
| 3 or 4 Unit Apartments | 0 (0.0%) | 0 (0.0%) |
| 5 to 9 Unit Apartments | 0 (0.0%) | 0 (0.0%) |
| 10 or more Apartments | 0 (0.0%) | 0 (0.0%) |
| Mobile Home / Other | 0 (0.0%) | 0 (0.0%) |
| Total | 59 (83.1%) | 12 (16.9%) |
Housing Structures by Number of Rooms in Bishop Hill
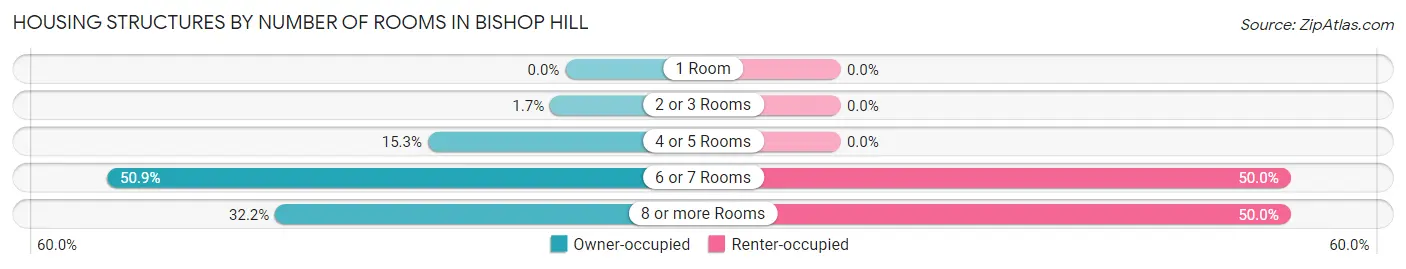
| Number of Rooms | Owner-occupied | Renter-occupied |
| 1 Room | 0 (0.0%) | 0 (0.0%) |
| 2 or 3 Rooms | 1 (1.7%) | 0 (0.0%) |
| 4 or 5 Rooms | 9 (15.2%) | 0 (0.0%) |
| 6 or 7 Rooms | 30 (50.8%) | 6 (50.0%) |
| 8 or more Rooms | 19 (32.2%) | 6 (50.0%) |
| Total | 59 (100.0%) | 12 (100.0%) |
Housing Structure by Heating Type in Bishop Hill
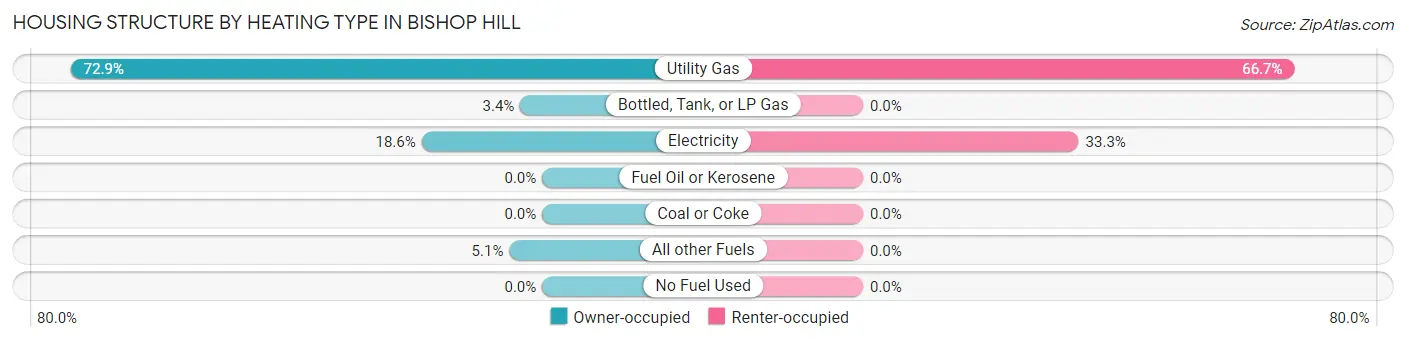
| Heating Type | Owner-occupied | Renter-occupied |
| Utility Gas | 43 (72.9%) | 8 (66.7%) |
| Bottled, Tank, or LP Gas | 2 (3.4%) | 0 (0.0%) |
| Electricity | 11 (18.6%) | 4 (33.3%) |
| Fuel Oil or Kerosene | 0 (0.0%) | 0 (0.0%) |
| Coal or Coke | 0 (0.0%) | 0 (0.0%) |
| All other Fuels | 3 (5.1%) | 0 (0.0%) |
| No Fuel Used | 0 (0.0%) | 0 (0.0%) |
| Total | 59 (100.0%) | 12 (100.0%) |
Household Vehicle Usage in Bishop Hill
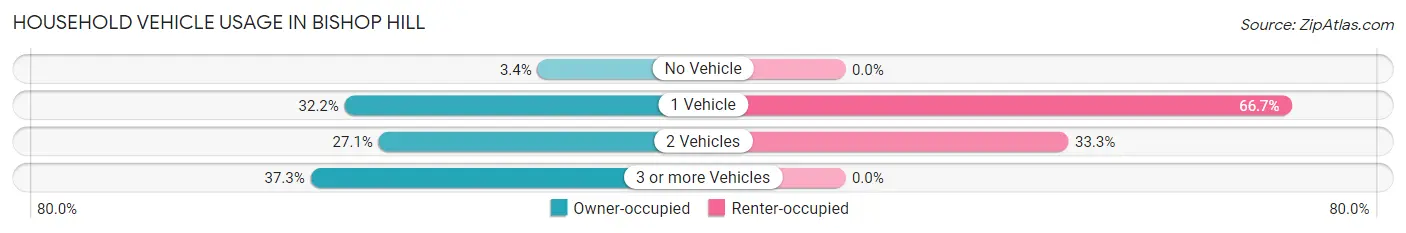
| Vehicles per Household | Owner-occupied | Renter-occupied |
| No Vehicle | 2 (3.4%) | 0 (0.0%) |
| 1 Vehicle | 19 (32.2%) | 8 (66.7%) |
| 2 Vehicles | 16 (27.1%) | 4 (33.3%) |
| 3 or more Vehicles | 22 (37.3%) | 0 (0.0%) |
| Total | 59 (100.0%) | 12 (100.0%) |
Real Estate & Mortgages in Bishop Hill
Real Estate and Mortgage Overview in Bishop Hill
| Characteristic | Without Mortgage | With Mortgage |
| Housing Units | 31 | 28 |
| Median Property Value | $83,000 | $137,500 |
| Median Household Income | $60,625 | $7 |
| Monthly Housing Costs | $407 | $0 |
| Real Estate Taxes | $1,375 | $6 |
Property Value by Mortgage Status in Bishop Hill
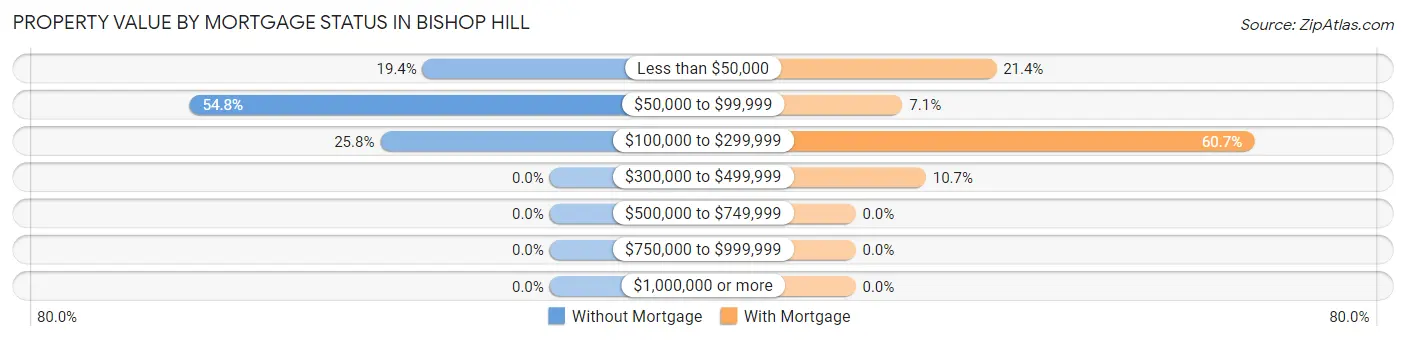
| Property Value | Without Mortgage | With Mortgage |
| Less than $50,000 | 6 (19.4%) | 6 (21.4%) |
| $50,000 to $99,999 | 17 (54.8%) | 2 (7.1%) |
| $100,000 to $299,999 | 8 (25.8%) | 17 (60.7%) |
| $300,000 to $499,999 | 0 (0.0%) | 3 (10.7%) |
| $500,000 to $749,999 | 0 (0.0%) | 0 (0.0%) |
| $750,000 to $999,999 | 0 (0.0%) | 0 (0.0%) |
| $1,000,000 or more | 0 (0.0%) | 0 (0.0%) |
| Total | 31 (100.0%) | 28 (100.0%) |
Household Income by Mortgage Status in Bishop Hill
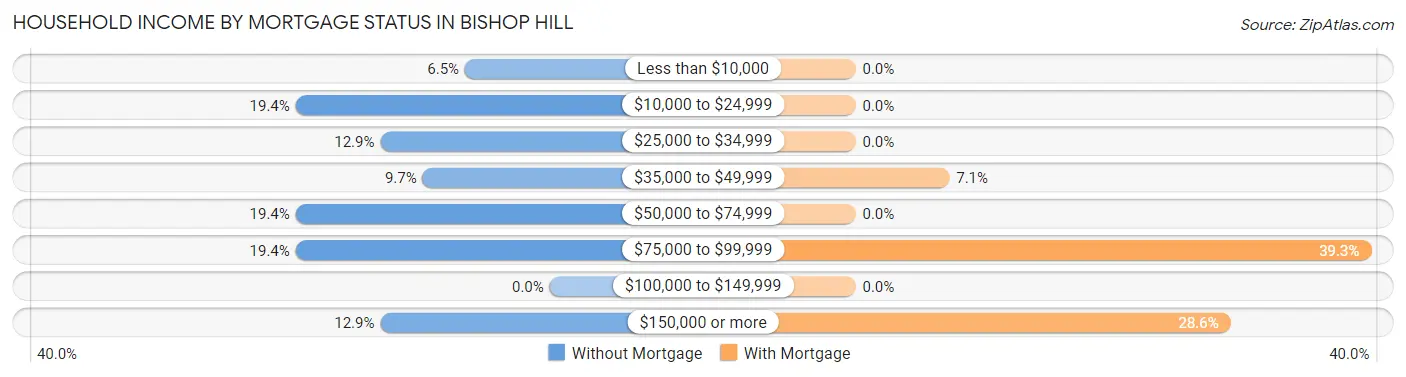
| Household Income | Without Mortgage | With Mortgage |
| Less than $10,000 | 2 (6.5%) | 0 (0.0%) |
| $10,000 to $24,999 | 6 (19.4%) | 0 (0.0%) |
| $25,000 to $34,999 | 4 (12.9%) | 0 (0.0%) |
| $35,000 to $49,999 | 3 (9.7%) | 2 (7.1%) |
| $50,000 to $74,999 | 6 (19.4%) | 0 (0.0%) |
| $75,000 to $99,999 | 6 (19.4%) | 11 (39.3%) |
| $100,000 to $149,999 | 0 (0.0%) | 0 (0.0%) |
| $150,000 or more | 4 (12.9%) | 8 (28.6%) |
| Total | 31 (100.0%) | 28 (100.0%) |
Property Value to Household Income Ratio in Bishop Hill
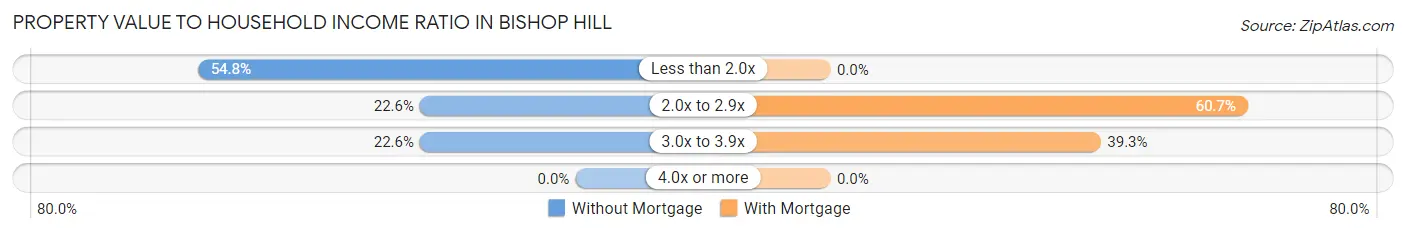
| Value-to-Income Ratio | Without Mortgage | With Mortgage |
| Less than 2.0x | 17 (54.8%) | 0 (0.0%) |
| 2.0x to 2.9x | 7 (22.6%) | 17 (60.7%) |
| 3.0x to 3.9x | 7 (22.6%) | 11 (39.3%) |
| 4.0x or more | 0 (0.0%) | 0 (0.0%) |
| Total | 31 (100.0%) | 28 (100.0%) |
Real Estate Taxes by Mortgage Status in Bishop Hill
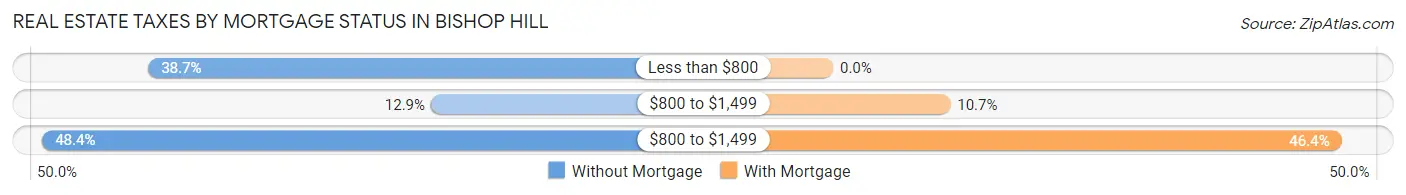
| Property Taxes | Without Mortgage | With Mortgage |
| Less than $800 | 12 (38.7%) | 0 (0.0%) |
| $800 to $1,499 | 4 (12.9%) | 3 (10.7%) |
| $800 to $1,499 | 15 (48.4%) | 13 (46.4%) |
| Total | 31 (100.0%) | 28 (100.0%) |
Health & Disability in Bishop Hill
Health Insurance Coverage by Age in Bishop Hill
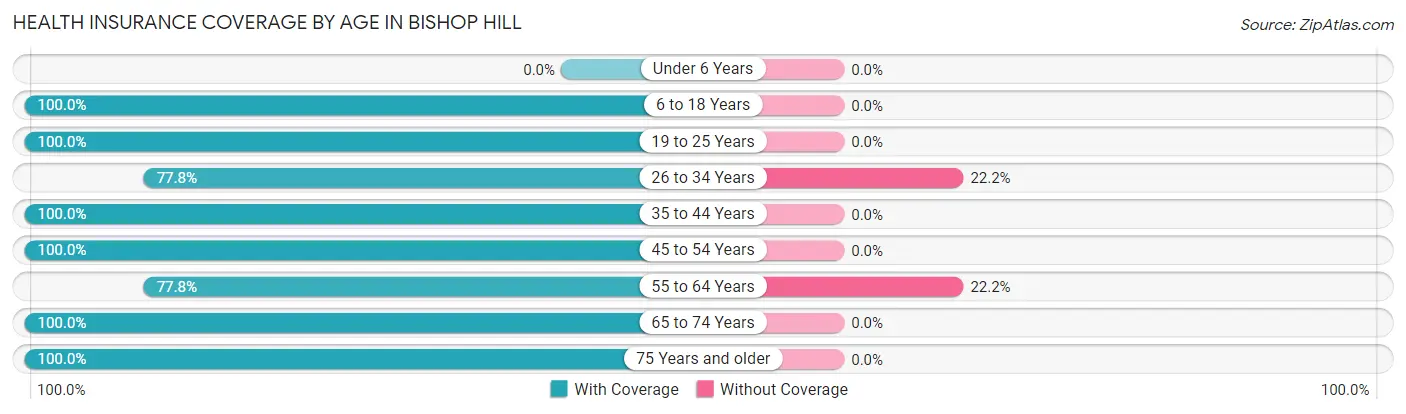
| Age Bracket | With Coverage | Without Coverage |
| Under 6 Years | 0 (0.0%) | 0 (0.0%) |
| 6 to 18 Years | 17 (100.0%) | 0 (0.0%) |
| 19 to 25 Years | 2 (100.0%) | 0 (0.0%) |
| 26 to 34 Years | 14 (77.8%) | 4 (22.2%) |
| 35 to 44 Years | 7 (100.0%) | 0 (0.0%) |
| 45 to 54 Years | 11 (100.0%) | 0 (0.0%) |
| 55 to 64 Years | 35 (77.8%) | 10 (22.2%) |
| 65 to 74 Years | 36 (100.0%) | 0 (0.0%) |
| 75 Years and older | 15 (100.0%) | 0 (0.0%) |
| Total | 137 (90.7%) | 14 (9.3%) |
Health Insurance Coverage by Citizenship Status in Bishop Hill
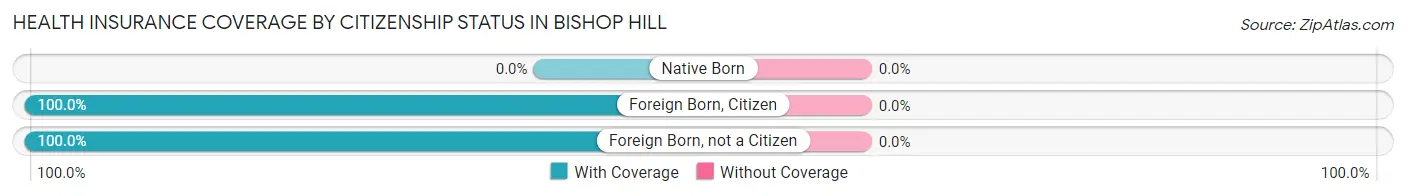
| Citizenship Status | With Coverage | Without Coverage |
| Native Born | 0 (0.0%) | 0 (0.0%) |
| Foreign Born, Citizen | 17 (100.0%) | 0 (0.0%) |
| Foreign Born, not a Citizen | 2 (100.0%) | 0 (0.0%) |
Health Insurance Coverage by Household Income in Bishop Hill
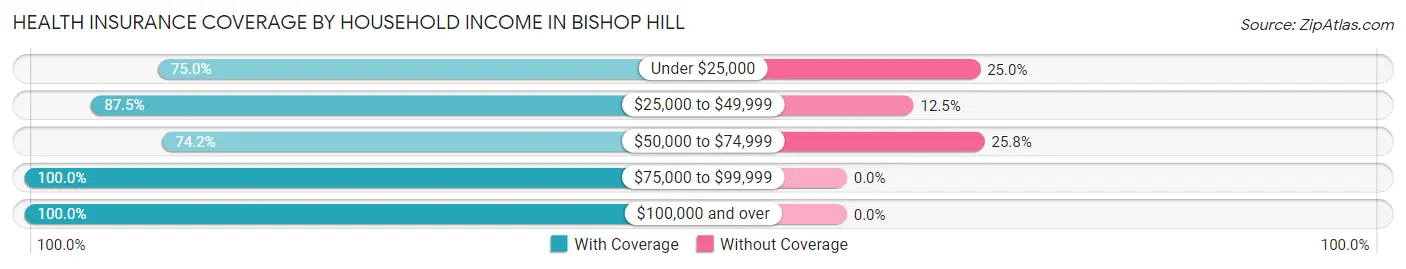
| Household Income | With Coverage | Without Coverage |
| Under $25,000 | 6 (75.0%) | 2 (25.0%) |
| $25,000 to $49,999 | 28 (87.5%) | 4 (12.5%) |
| $50,000 to $74,999 | 23 (74.2%) | 8 (25.8%) |
| $75,000 to $99,999 | 11 (100.0%) | 0 (0.0%) |
| $100,000 and over | 69 (100.0%) | 0 (0.0%) |
Public vs Private Health Insurance Coverage by Age in Bishop Hill
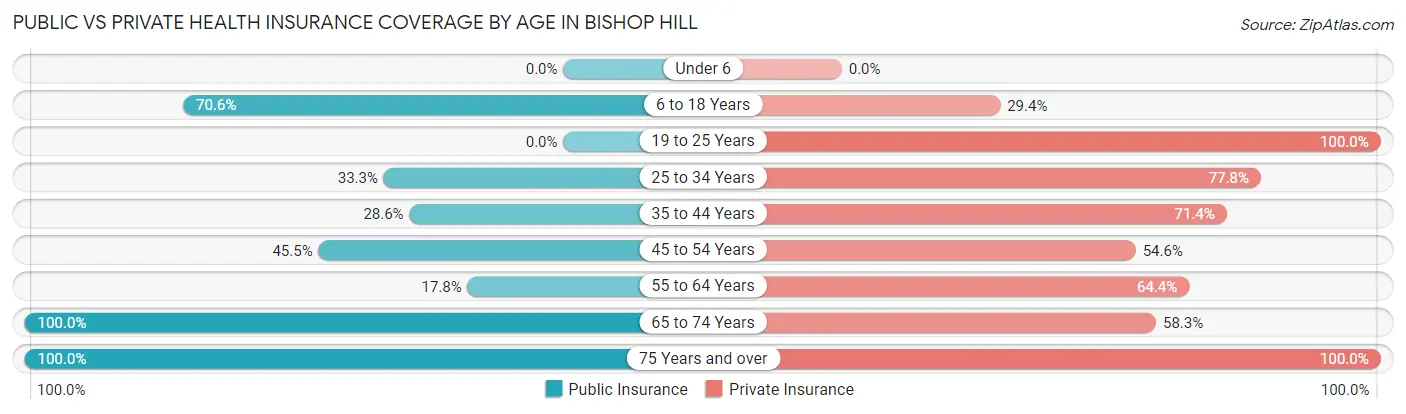
| Age Bracket | Public Insurance | Private Insurance |
| Under 6 | 0 (0.0%) | 0 (0.0%) |
| 6 to 18 Years | 12 (70.6%) | 5 (29.4%) |
| 19 to 25 Years | 0 (0.0%) | 2 (100.0%) |
| 25 to 34 Years | 6 (33.3%) | 14 (77.8%) |
| 35 to 44 Years | 2 (28.6%) | 5 (71.4%) |
| 45 to 54 Years | 5 (45.5%) | 6 (54.5%) |
| 55 to 64 Years | 8 (17.8%) | 29 (64.4%) |
| 65 to 74 Years | 36 (100.0%) | 21 (58.3%) |
| 75 Years and over | 15 (100.0%) | 15 (100.0%) |
| Total | 84 (55.6%) | 97 (64.2%) |
Disability Status by Sex by Age in Bishop Hill
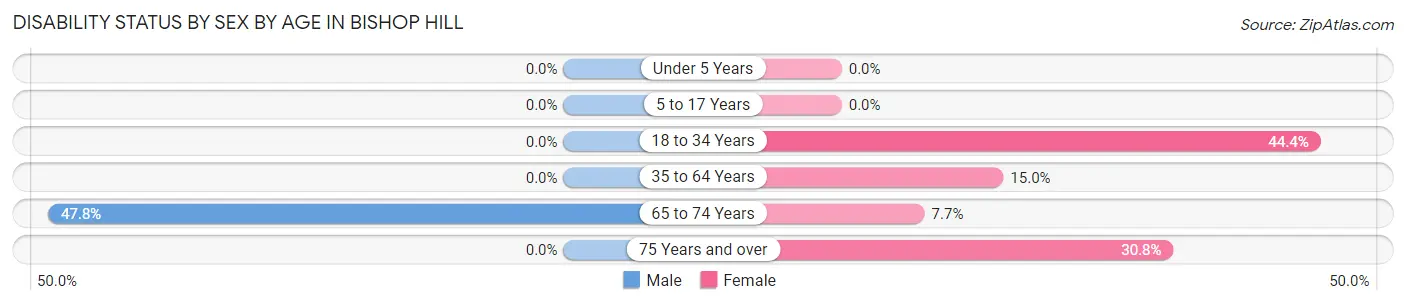
| Age Bracket | Male | Female |
| Under 5 Years | 0 (0.0%) | 0 (0.0%) |
| 5 to 17 Years | 0 (0.0%) | 0 (0.0%) |
| 18 to 34 Years | 0 (0.0%) | 8 (44.4%) |
| 35 to 64 Years | 0 (0.0%) | 6 (15.0%) |
| 65 to 74 Years | 11 (47.8%) | 1 (7.7%) |
| 75 Years and over | 0 (0.0%) | 4 (30.8%) |
Disability Class by Sex by Age in Bishop Hill
Disability Class: Hearing Difficulty
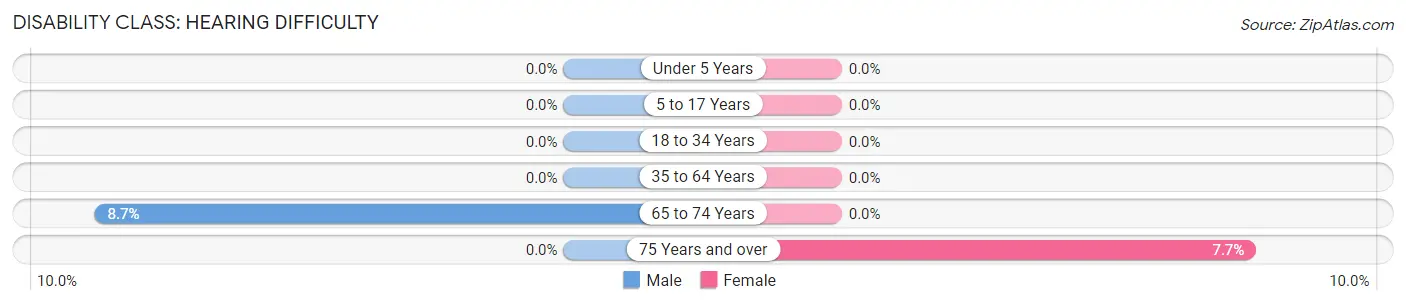
| Age Bracket | Male | Female |
| Under 5 Years | 0 (0.0%) | 0 (0.0%) |
| 5 to 17 Years | 0 (0.0%) | 0 (0.0%) |
| 18 to 34 Years | 0 (0.0%) | 0 (0.0%) |
| 35 to 64 Years | 0 (0.0%) | 0 (0.0%) |
| 65 to 74 Years | 2 (8.7%) | 0 (0.0%) |
| 75 Years and over | 0 (0.0%) | 1 (7.7%) |
Disability Class: Vision Difficulty
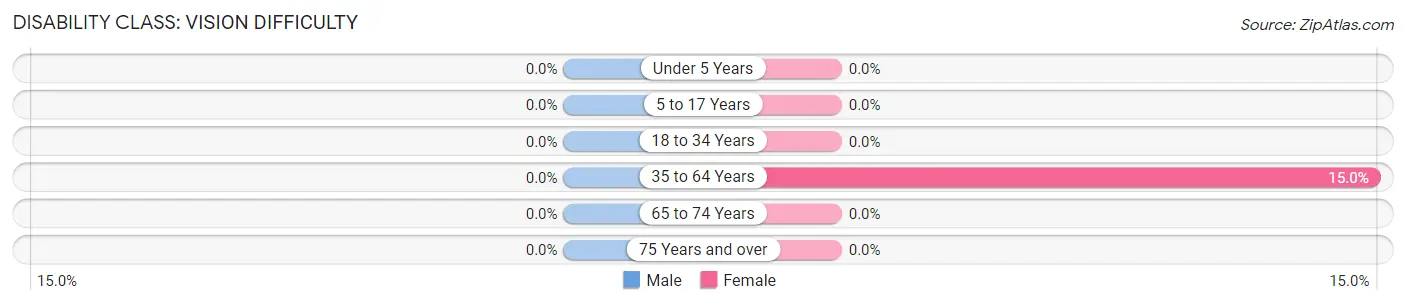
| Age Bracket | Male | Female |
| Under 5 Years | 0 (0.0%) | 0 (0.0%) |
| 5 to 17 Years | 0 (0.0%) | 0 (0.0%) |
| 18 to 34 Years | 0 (0.0%) | 0 (0.0%) |
| 35 to 64 Years | 0 (0.0%) | 6 (15.0%) |
| 65 to 74 Years | 0 (0.0%) | 0 (0.0%) |
| 75 Years and over | 0 (0.0%) | 0 (0.0%) |
Disability Class: Cognitive Difficulty
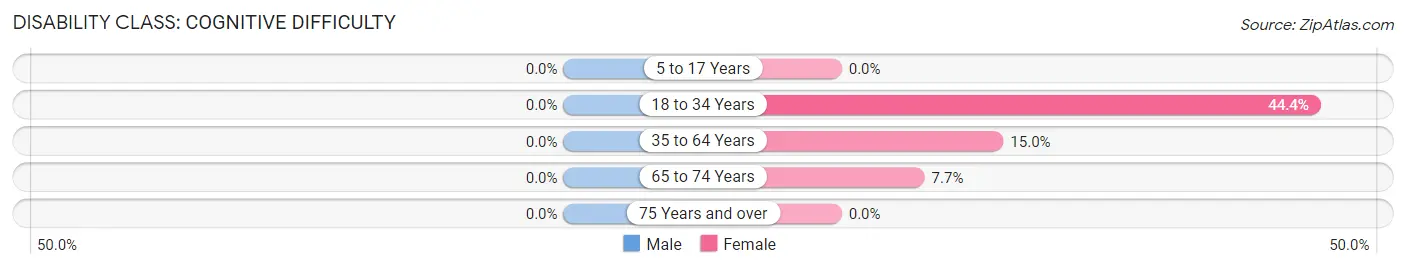
| Age Bracket | Male | Female |
| 5 to 17 Years | 0 (0.0%) | 0 (0.0%) |
| 18 to 34 Years | 0 (0.0%) | 8 (44.4%) |
| 35 to 64 Years | 0 (0.0%) | 6 (15.0%) |
| 65 to 74 Years | 0 (0.0%) | 1 (7.7%) |
| 75 Years and over | 0 (0.0%) | 0 (0.0%) |
Disability Class: Ambulatory Difficulty
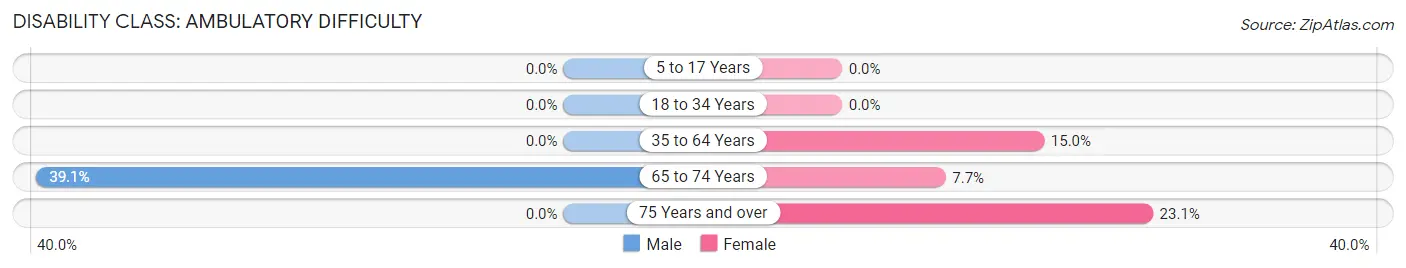
| Age Bracket | Male | Female |
| 5 to 17 Years | 0 (0.0%) | 0 (0.0%) |
| 18 to 34 Years | 0 (0.0%) | 0 (0.0%) |
| 35 to 64 Years | 0 (0.0%) | 6 (15.0%) |
| 65 to 74 Years | 9 (39.1%) | 1 (7.7%) |
| 75 Years and over | 0 (0.0%) | 3 (23.1%) |
Disability Class: Self-Care Difficulty
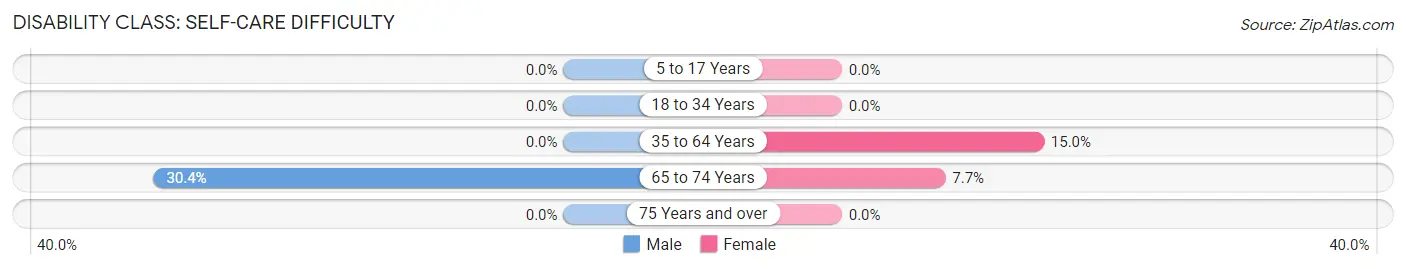
| Age Bracket | Male | Female |
| 5 to 17 Years | 0 (0.0%) | 0 (0.0%) |
| 18 to 34 Years | 0 (0.0%) | 0 (0.0%) |
| 35 to 64 Years | 0 (0.0%) | 6 (15.0%) |
| 65 to 74 Years | 7 (30.4%) | 1 (7.7%) |
| 75 Years and over | 0 (0.0%) | 0 (0.0%) |
Technology Access in Bishop Hill
Computing Device Access in Bishop Hill
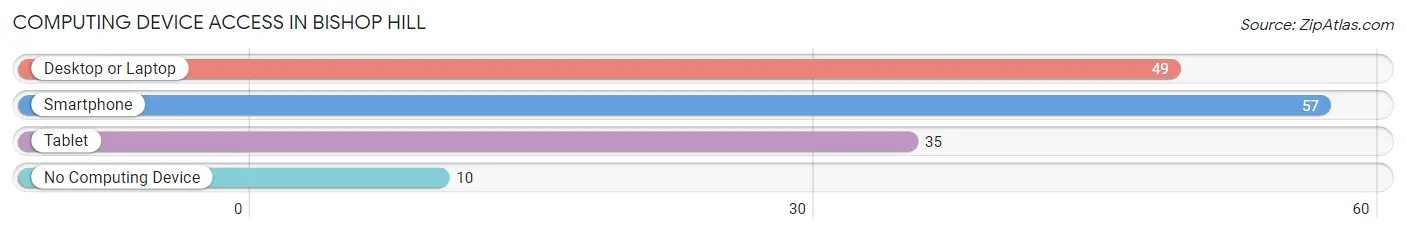
| Device Type | # Households | % Households |
| Desktop or Laptop | 49 | 69.0% |
| Smartphone | 57 | 80.3% |
| Tablet | 35 | 49.3% |
| No Computing Device | 10 | 14.1% |
| Total | 71 | 100.0% |
Internet Access in Bishop Hill
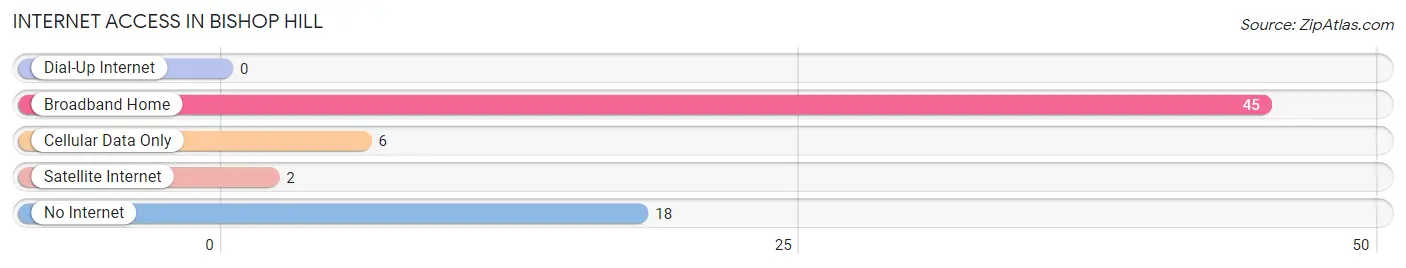
| Internet Type | # Households | % Households |
| Dial-Up Internet | 0 | 0.0% |
| Broadband Home | 45 | 63.4% |
| Cellular Data Only | 6 | 8.5% |
| Satellite Internet | 2 | 2.8% |
| No Internet | 18 | 25.4% |
| Total | 71 | 100.0% |
Bishop Hill Summary
Bishop Hill, Illinois is a small village located in Henry County, Illinois, United States. It is situated on the banks of the Galena River, approximately 30 miles northwest of the city of Peoria. The village was founded in 1846 by Swedish immigrants, led by Erik Jansson, who were seeking religious freedom and a better life. The village was named after the Swedish village of Biskopskulla, which was the birthplace of Jansson.
Geography
Bishop Hill is located at 41°14'N, 90°14'W (41.23, -90.23). It is situated on the banks of the Galena River, approximately 30 miles northwest of the city of Peoria. The village has a total area of 0.3 square miles, all of which is land.
Demographics
As of the 2010 census, Bishop Hill had a population of 128. The racial makeup of the village was 97.7% White, 0.8% African American, 0.8% Native American, and 0.8% from two or more races. Hispanic or Latino of any race were 0.8% of the population.
Economy
Bishop Hill is a small, rural village with a limited economy. The village is home to several small businesses, including a general store, a restaurant, a bed and breakfast, and a museum. The village also has a few small farms and a few small manufacturing businesses.
The village is also home to the Bishop Hill State Historic Site, which is a popular tourist destination. The site includes a museum, a visitor center, and a number of historic buildings. The site is open to the public and offers a variety of educational programs and events.
History
Bishop Hill was founded in 1846 by Swedish immigrants, led by Erik Jansson, who were seeking religious freedom and a better life. The village was named after the Swedish village of Biskopskulla, which was the birthplace of Jansson.
The village was founded as a communal society, with all property and goods held in common. This communal system lasted until 1861, when it was dissolved due to internal conflicts.
The village was home to a number of successful businesses, including a brickyard, a woolen mill, a sawmill, and a flour mill. The village also had a number of successful farms, which produced a variety of crops, including wheat, oats, corn, and hay.
In the late 19th century, the village began to decline due to a number of factors, including the decline of the communal system, the failure of some of the businesses, and the departure of many of the residents. By the early 20th century, the village had become a virtual ghost town.
In the late 20th century, the village began to experience a revival, as people began to move back to the area and restore the historic buildings. Today, Bishop Hill is a popular tourist destination, with a number of historic buildings, a museum, and a variety of educational programs and events.
Common Questions
What is Per Capita Income in Bishop Hill?
Per Capita income in Bishop Hill is $37,317.
What is the Median Family Income in Bishop Hill?
Median Family Income in Bishop Hill is $71,250.
What is the Median Household income in Bishop Hill?
Median Household Income in Bishop Hill is $52,321.
What is Income or Wage Gap in Bishop Hill?
Income or Wage Gap in Bishop Hill is 16.7%.
Women in Bishop Hill earn 83.3 cents for every dollar earned by a man.
What is Inequality or Gini Index in Bishop Hill?
Inequality or Gini Index in Bishop Hill is 0.45.
What is the Total Population of Bishop Hill?
Total Population of Bishop Hill is 151.
What is the Total Male Population of Bishop Hill?
Total Male Population of Bishop Hill is 65.
What is the Total Female Population of Bishop Hill?
Total Female Population of Bishop Hill is 86.
What is the Ratio of Males per 100 Females in Bishop Hill?
There are 75.58 Males per 100 Females in Bishop Hill.
What is the Ratio of Females per 100 Males in Bishop Hill?
There are 132.31 Females per 100 Males in Bishop Hill.
What is the Median Population Age in Bishop Hill?
Median Population Age in Bishop Hill is 62.1 Years.
What is the Average Family Size in Bishop Hill
Average Family Size in Bishop Hill is 2.7 People.
What is the Average Household Size in Bishop Hill
Average Household Size in Bishop Hill is 2.1 People.
How Large is the Labor Force in Bishop Hill?
There are 78 People in the Labor Forcein in Bishop Hill.
What is the Percentage of People in the Labor Force in Bishop Hill?
58.2% of People are in the Labor Force in Bishop Hill.