Batavia, IL Map & Demographics
Batavia Map
Batavia Overview
$52,850
PER CAPITA INCOME
$145,195
AVG FAMILY INCOME
$113,824
AVG HOUSEHOLD INCOME
42.2%
WAGE / INCOME GAP [ % ]
57.8¢/ $1
WAGE / INCOME GAP [ $ ]
$9,045
FAMILY INCOME DEFICIT
0.43
INEQUALITY / GINI INDEX
26,355
TOTAL POPULATION
13,085
MALE POPULATION
13,270
FEMALE POPULATION
98.61
MALES / 100 FEMALES
101.41
FEMALES / 100 MALES
38.9
MEDIAN AGE
3.3
AVG FAMILY SIZE
2.7
AVG HOUSEHOLD SIZE
14,470
LABOR FORCE [ PEOPLE ]
70.7%
PERCENT IN LABOR FORCE
3.7%
UNEMPLOYMENT RATE
Batavia Zip Codes
Batavia Area Codes
Income in Batavia
Income Overview in Batavia
Per Capita Income in Batavia is $52,850, while median incomes of families and households are $145,195 and $113,824 respectively.
| Characteristic | Number | Measure |
| Per Capita Income | 26,355 | $52,850 |
| Median Family Income | 6,751 | $145,195 |
| Mean Family Income | 6,751 | $172,098 |
| Median Household Income | 9,814 | $113,824 |
| Mean Household Income | 9,814 | $140,302 |
| Income Deficit | 6,751 | $9,045 |
| Wage / Income Gap (%) | 26,355 | 42.24% |
| Wage / Income Gap ($) | 26,355 | 57.76¢ per $1 |
| Gini / Inequality Index | 26,355 | 0.43 |
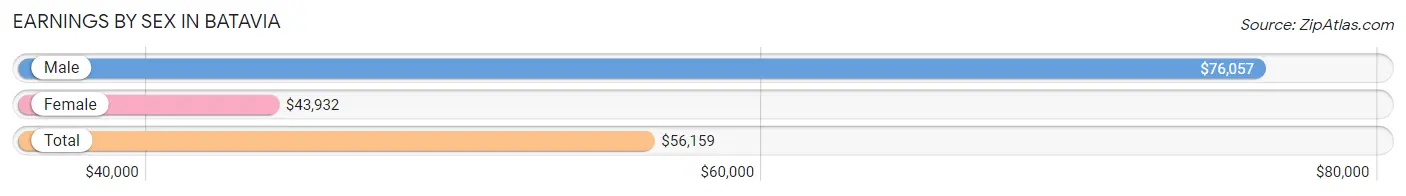
Earnings by Sex in Batavia
Average Earnings in Batavia are $56,159, $76,057 for men and $43,932 for women, a difference of 42.2%.
| Sex | Number | Average Earnings |
| Male | 8,141 (54.3%) | $76,057 |
| Female | 6,848 (45.7%) | $43,932 |
| Total | 14,989 (100.0%) | $56,159 |
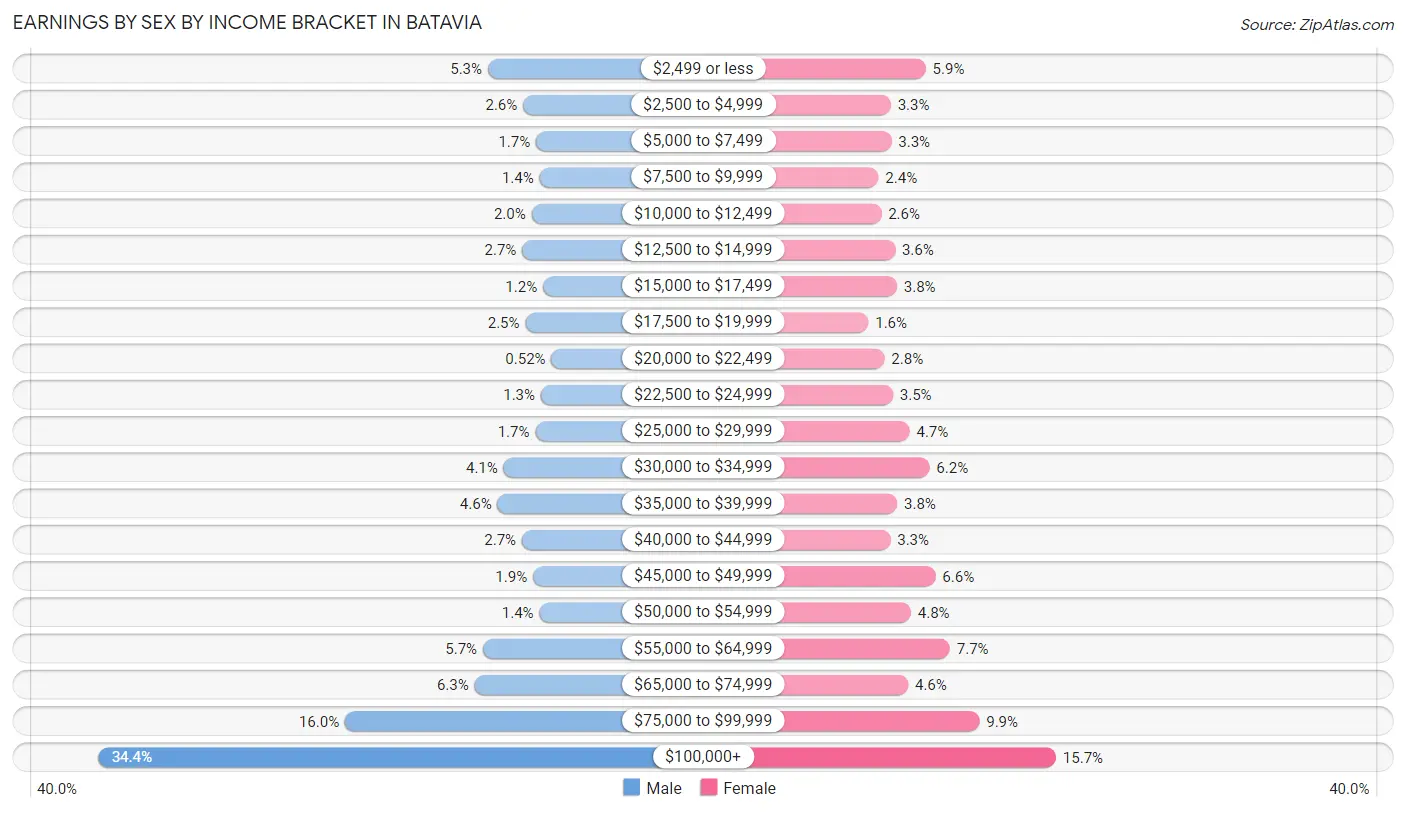
Earnings by Sex by Income Bracket in Batavia
The most common earnings brackets in Batavia are $100,000+ for men (2,804 | 34.4%) and $100,000+ for women (1,073 | 15.7%).
| Income | Male | Female |
| $2,499 or less | 430 (5.3%) | 405 (5.9%) |
| $2,500 to $4,999 | 215 (2.6%) | 225 (3.3%) |
| $5,000 to $7,499 | 136 (1.7%) | 229 (3.3%) |
| $7,500 to $9,999 | 115 (1.4%) | 162 (2.4%) |
| $10,000 to $12,499 | 164 (2.0%) | 177 (2.6%) |
| $12,500 to $14,999 | 221 (2.7%) | 247 (3.6%) |
| $15,000 to $17,499 | 94 (1.1%) | 257 (3.7%) |
| $17,500 to $19,999 | 201 (2.5%) | 110 (1.6%) |
| $20,000 to $22,499 | 42 (0.5%) | 193 (2.8%) |
| $22,500 to $24,999 | 107 (1.3%) | 236 (3.5%) |
| $25,000 to $29,999 | 141 (1.7%) | 322 (4.7%) |
| $30,000 to $34,999 | 334 (4.1%) | 424 (6.2%) |
| $35,000 to $39,999 | 371 (4.6%) | 258 (3.8%) |
| $40,000 to $44,999 | 222 (2.7%) | 223 (3.3%) |
| $45,000 to $49,999 | 155 (1.9%) | 455 (6.6%) |
| $50,000 to $54,999 | 116 (1.4%) | 329 (4.8%) |
| $55,000 to $64,999 | 460 (5.7%) | 529 (7.7%) |
| $65,000 to $74,999 | 511 (6.3%) | 314 (4.6%) |
| $75,000 to $99,999 | 1,302 (16.0%) | 680 (9.9%) |
| $100,000+ | 2,804 (34.4%) | 1,073 (15.7%) |
| Total | 8,141 (100.0%) | 6,848 (100.0%) |
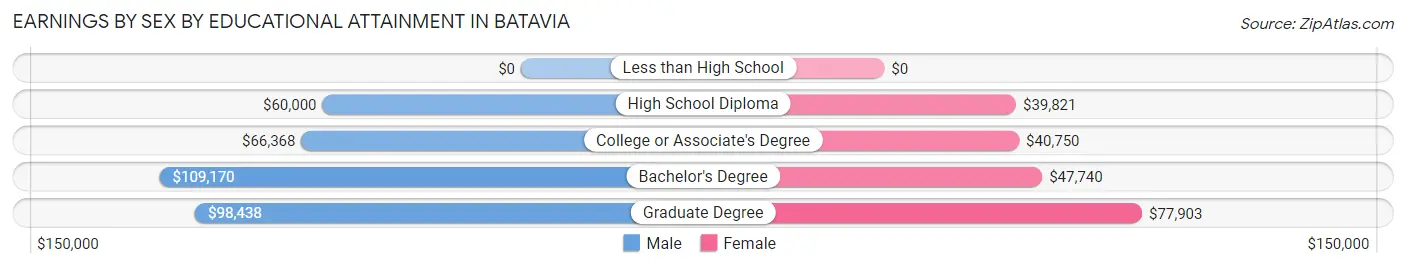
Earnings by Sex by Educational Attainment in Batavia
Average earnings in Batavia are $84,450 for men and $49,000 for women, a difference of 42.0%. Men with an educational attainment of bachelor's degree enjoy the highest average annual earnings of $109,170, while those with high school diploma education earn the least with $60,000. Women with an educational attainment of graduate degree earn the most with the average annual earnings of $77,903, while those with high school diploma education have the smallest earnings of $39,821.
| Educational Attainment | Male Income | Female Income |
| Less than High School | - | - |
| High School Diploma | $60,000 | $39,821 |
| College or Associate's Degree | $66,368 | $40,750 |
| Bachelor's Degree | $109,170 | $47,740 |
| Graduate Degree | $98,438 | $77,903 |
| Total | $84,450 | $49,000 |
Family Income in Batavia
Family Income Brackets in Batavia
According to the Batavia family income data, there are 1,998 families falling into the $200,000+ income range, which is the most common income bracket and makes up 29.6% of all families.
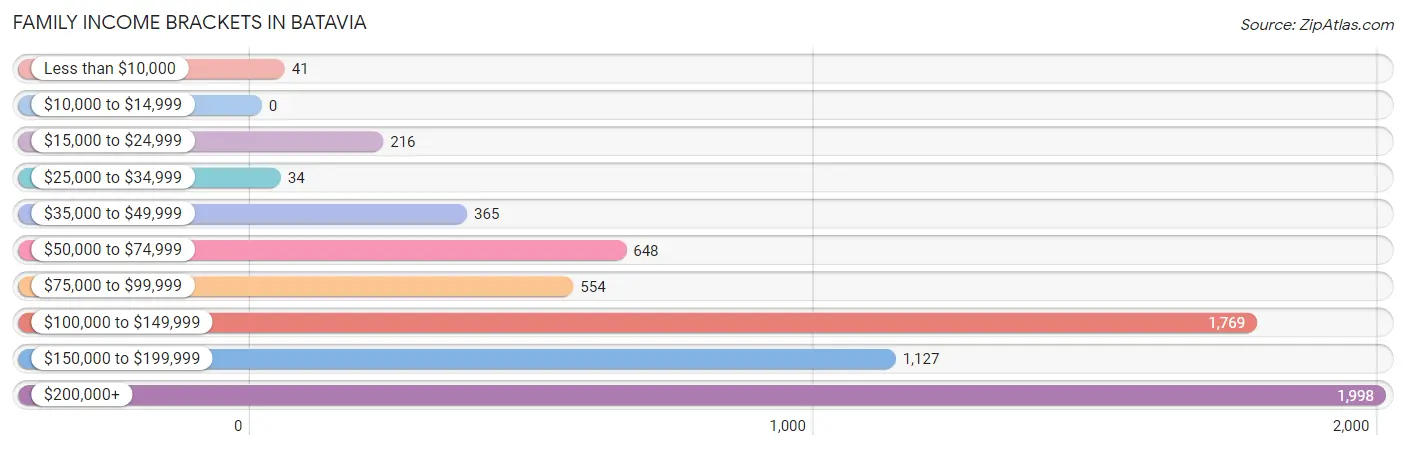
| Income Bracket | # Families | % Families |
| Less than $10,000 | 41 | 0.6% |
| $10,000 to $14,999 | 0 | 0.0% |
| $15,000 to $24,999 | 216 | 3.2% |
| $25,000 to $34,999 | 34 | 0.5% |
| $35,000 to $49,999 | 365 | 5.4% |
| $50,000 to $74,999 | 648 | 9.6% |
| $75,000 to $99,999 | 554 | 8.2% |
| $100,000 to $149,999 | 1,769 | 26.2% |
| $150,000 to $199,999 | 1,127 | 16.7% |
| $200,000+ | 1,998 | 29.6% |
Family Income by Famaliy Size in Batavia
7+ person families (106 | 1.6%) account for the highest median family income in Batavia with $250,001 per family, while 2-person families (2,440 | 36.1%) have the highest median income of $57,587 per family member.
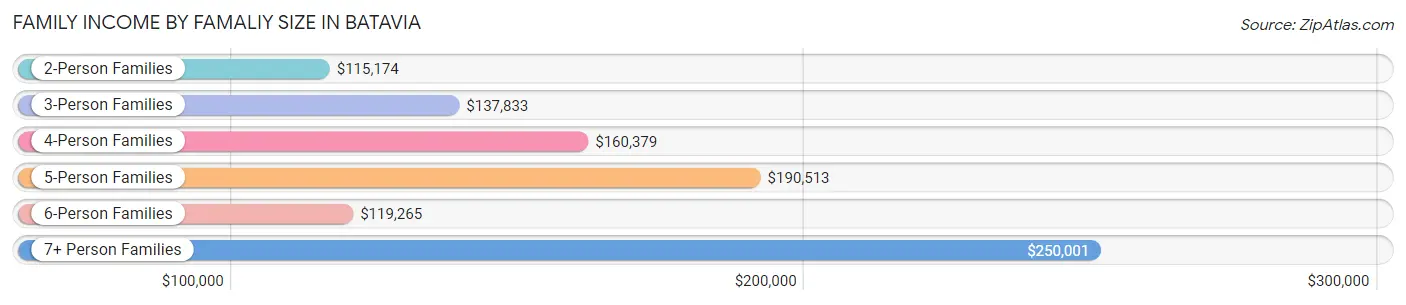
| Income Bracket | # Families | Median Income |
| 2-Person Families | 2,440 (36.1%) | $115,174 |
| 3-Person Families | 1,370 (20.3%) | $137,833 |
| 4-Person Families | 1,875 (27.8%) | $160,379 |
| 5-Person Families | 782 (11.6%) | $190,513 |
| 6-Person Families | 178 (2.6%) | $119,265 |
| 7+ Person Families | 106 (1.6%) | $250,001 |
| Total | 6,751 (100.0%) | $145,195 |
Family Income by Number of Earners in Batavia
The median family income in Batavia is $145,195, with families comprising 3+ earners (1,537) having the highest median family income of $186,895, while families with no earners (741) have the lowest median family income of $85,855, accounting for 22.8% and 11.0% of families, respectively.
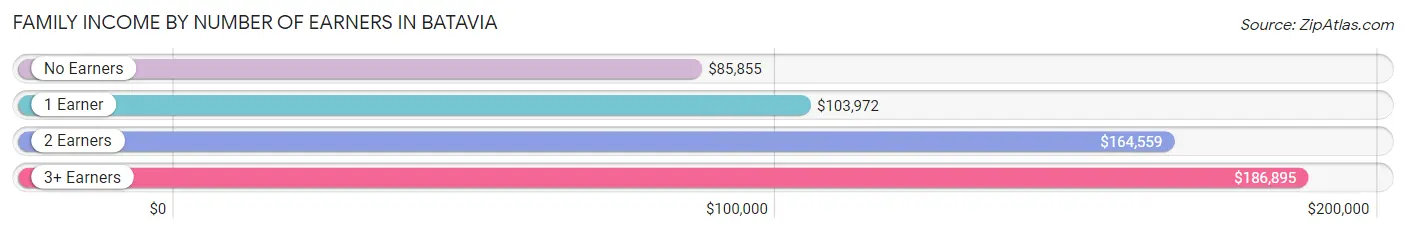
| Number of Earners | # Families | Median Income |
| No Earners | 741 (11.0%) | $85,855 |
| 1 Earner | 1,515 (22.4%) | $103,972 |
| 2 Earners | 2,958 (43.8%) | $164,559 |
| 3+ Earners | 1,537 (22.8%) | $186,895 |
| Total | 6,751 (100.0%) | $145,195 |
Household Income in Batavia
Household Income Brackets in Batavia
With 2,159 households falling in the category, the $200,000+ income range is the most frequent in Batavia, accounting for 22.0% of all households. In contrast, only 118 households (1.2%) fall into the $10,000 to $14,999 income bracket, making it the least populous group.
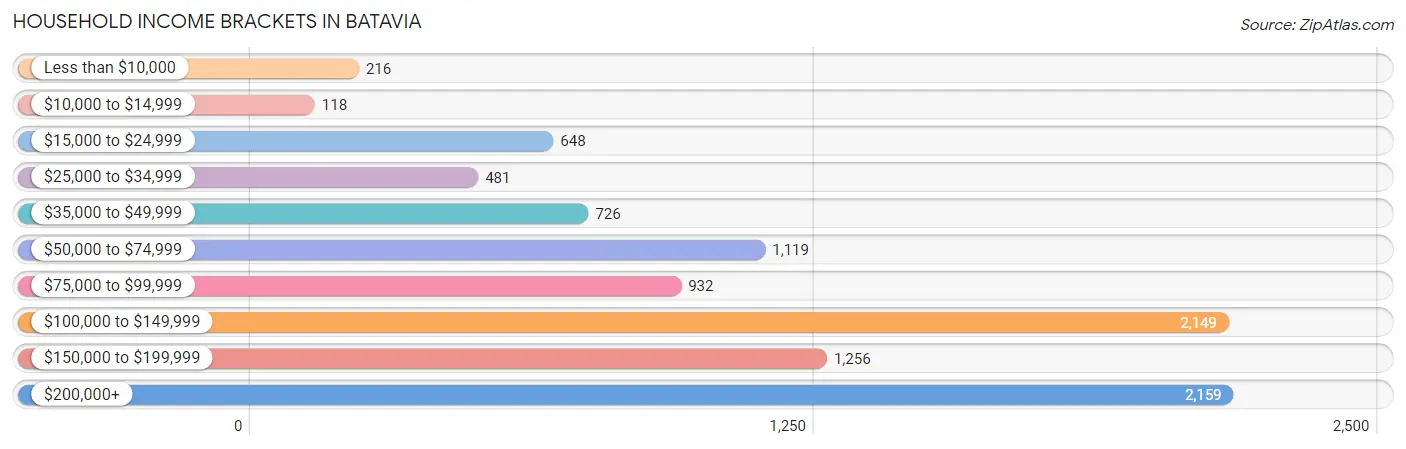
| Income Bracket | # Households | % Households |
| Less than $10,000 | 216 | 2.2% |
| $10,000 to $14,999 | 118 | 1.2% |
| $15,000 to $24,999 | 648 | 6.6% |
| $25,000 to $34,999 | 481 | 4.9% |
| $35,000 to $49,999 | 726 | 7.4% |
| $50,000 to $74,999 | 1,119 | 11.4% |
| $75,000 to $99,999 | 932 | 9.5% |
| $100,000 to $149,999 | 2,149 | 21.9% |
| $150,000 to $199,999 | 1,256 | 12.8% |
| $200,000+ | 2,159 | 22.0% |
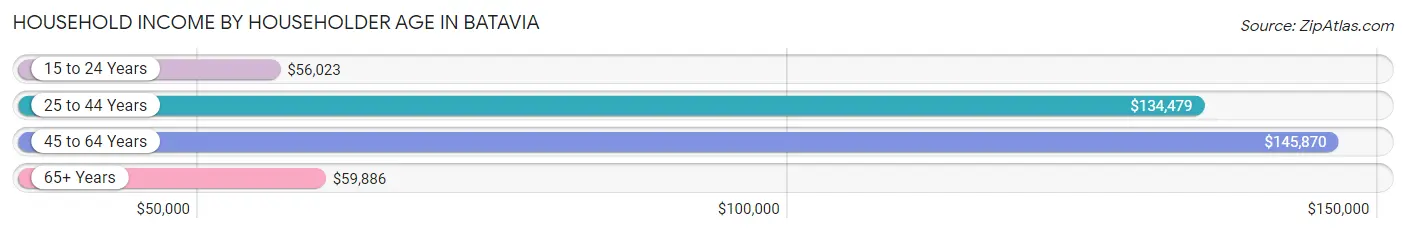
Household Income by Householder Age in Batavia
The median household income in Batavia is $113,824, with the highest median household income of $145,870 found in the 45 to 64 years age bracket for the primary householder. A total of 3,892 households (39.7%) fall into this category. Meanwhile, the 15 to 24 years age bracket for the primary householder has the lowest median household income of $56,023, with 86 households (0.9%) in this group.
| Income Bracket | # Households | Median Income |
| 15 to 24 Years | 86 (0.9%) | $56,023 |
| 25 to 44 Years | 2,982 (30.4%) | $134,479 |
| 45 to 64 Years | 3,892 (39.7%) | $145,870 |
| 65+ Years | 2,854 (29.1%) | $59,886 |
| Total | 9,814 (100.0%) | $113,824 |
Poverty in Batavia
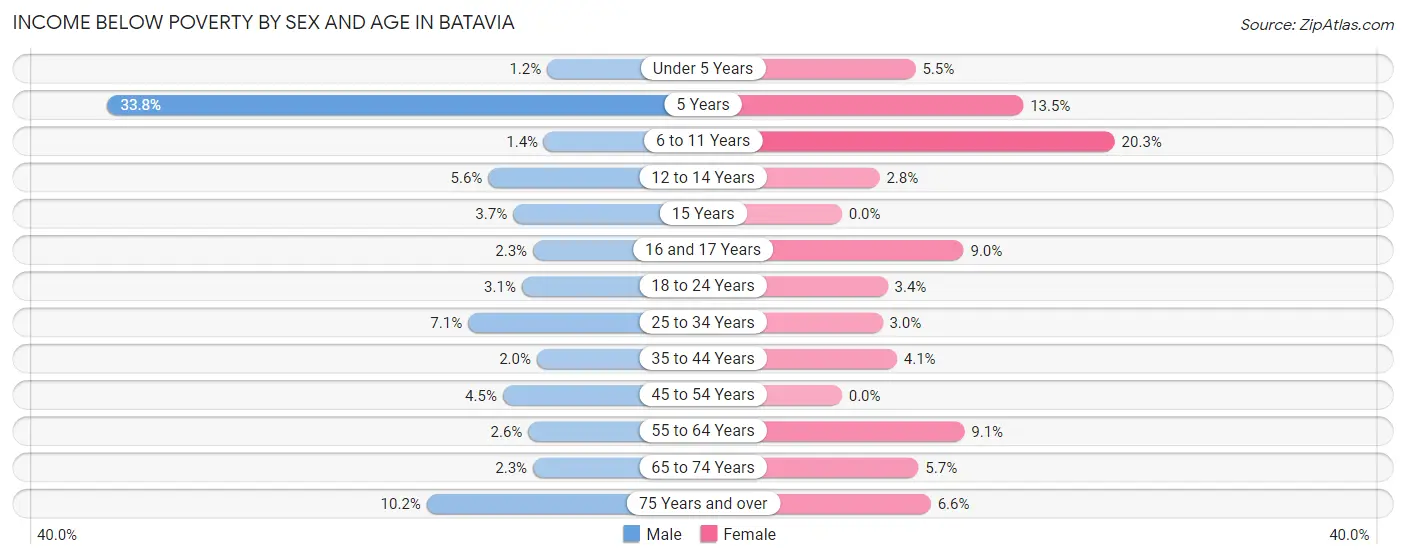
Income Below Poverty by Sex and Age in Batavia
With 4.2% poverty level for males and 5.6% for females among the residents of Batavia, 5 year old males and 6 to 11 year old females are the most vulnerable to poverty, with 68 males (33.8%) and 153 females (20.3%) in their respective age groups living below the poverty level.
| Age Bracket | Male | Female |
| Under 5 Years | 11 (1.2%) | 56 (5.5%) |
| 5 Years | 68 (33.8%) | 33 (13.5%) |
| 6 to 11 Years | 14 (1.4%) | 153 (20.3%) |
| 12 to 14 Years | 46 (5.6%) | 15 (2.8%) |
| 15 Years | 7 (3.7%) | 0 (0.0%) |
| 16 and 17 Years | 12 (2.3%) | 48 (9.0%) |
| 18 to 24 Years | 25 (3.1%) | 29 (3.4%) |
| 25 to 34 Years | 108 (7.1%) | 49 (3.0%) |
| 35 to 44 Years | 38 (2.0%) | 67 (4.1%) |
| 45 to 54 Years | 76 (4.5%) | 0 (0.0%) |
| 55 to 64 Years | 42 (2.6%) | 144 (9.1%) |
| 65 to 74 Years | 27 (2.3%) | 55 (5.7%) |
| 75 Years and over | 69 (10.2%) | 89 (6.6%) |
| Total | 543 (4.2%) | 738 (5.6%) |
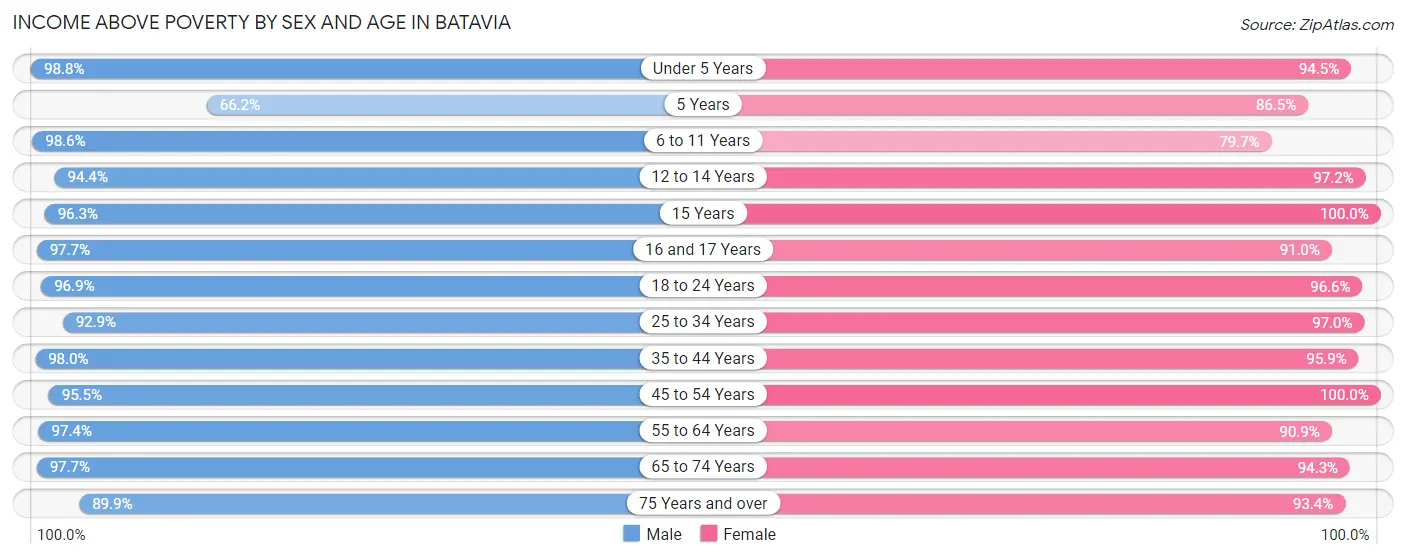
Income Above Poverty by Sex and Age in Batavia
According to the poverty statistics in Batavia, males aged under 5 years and females aged 15 years are the age groups that are most secure financially, with 98.8% of males and 100.0% of females in these age groups living above the poverty line.
| Age Bracket | Male | Female |
| Under 5 Years | 895 (98.8%) | 968 (94.5%) |
| 5 Years | 133 (66.2%) | 212 (86.5%) |
| 6 to 11 Years | 955 (98.6%) | 602 (79.7%) |
| 12 to 14 Years | 778 (94.4%) | 521 (97.2%) |
| 15 Years | 180 (96.3%) | 224 (100.0%) |
| 16 and 17 Years | 519 (97.7%) | 483 (91.0%) |
| 18 to 24 Years | 784 (96.9%) | 824 (96.6%) |
| 25 to 34 Years | 1,418 (92.9%) | 1,571 (97.0%) |
| 35 to 44 Years | 1,892 (98.0%) | 1,571 (95.9%) |
| 45 to 54 Years | 1,612 (95.5%) | 1,880 (100.0%) |
| 55 to 64 Years | 1,568 (97.4%) | 1,439 (90.9%) |
| 65 to 74 Years | 1,168 (97.7%) | 912 (94.3%) |
| 75 Years and over | 611 (89.8%) | 1,259 (93.4%) |
| Total | 12,513 (95.8%) | 12,466 (94.4%) |
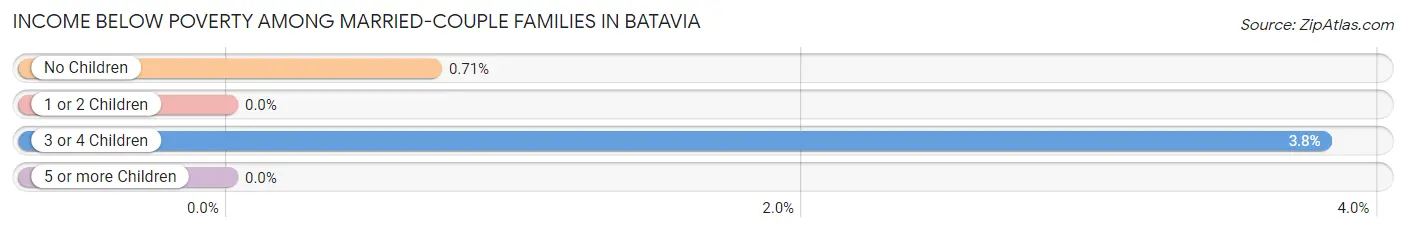
Income Below Poverty Among Married-Couple Families in Batavia
The poverty statistics for married-couple families in Batavia show that 0.8% or 46 of the total 5,857 families live below the poverty line. Families with 3 or 4 children have the highest poverty rate of 3.8%, comprising of 27 families. On the other hand, families with 1 or 2 children have the lowest poverty rate of 0.0%, which includes 0 families.
| Children | Above Poverty | Below Poverty |
| No Children | 2,663 (99.3%) | 19 (0.7%) |
| 1 or 2 Children | 2,467 (100.0%) | 0 (0.0%) |
| 3 or 4 Children | 681 (96.2%) | 27 (3.8%) |
| 5 or more Children | 0 (0.0%) | 0 (0.0%) |
| Total | 5,811 (99.2%) | 46 (0.8%) |
Income Below Poverty Among Single-Parent Households in Batavia
According to the poverty data in Batavia, 36.0% or 112 single-father households and 10.8% or 63 single-mother households are living below the poverty line. Among single-father households, those with 1 or 2 children have the highest poverty rate, with 112 households (39.0%) experiencing poverty. Likewise, among single-mother households, those with 3 or 4 children have the highest poverty rate, with 45 households (83.3%) falling below the poverty line.
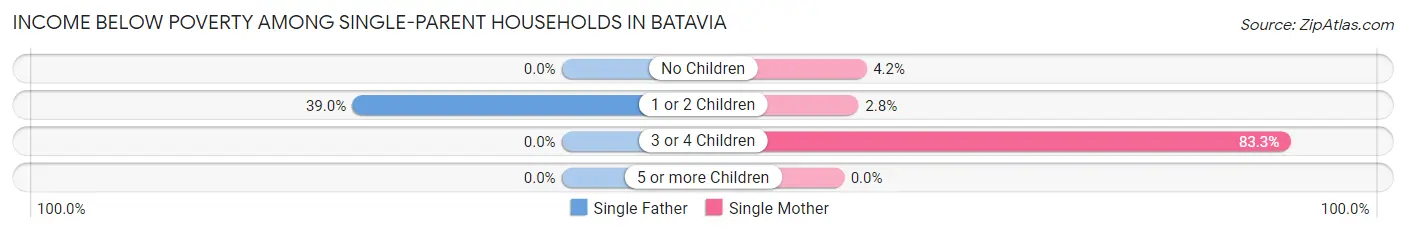
| Children | Single Father | Single Mother |
| No Children | 0 (0.0%) | 10 (4.2%) |
| 1 or 2 Children | 112 (39.0%) | 8 (2.8%) |
| 3 or 4 Children | 0 (0.0%) | 45 (83.3%) |
| 5 or more Children | 0 (0.0%) | 0 (0.0%) |
| Total | 112 (36.0%) | 63 (10.8%) |
Income Below Poverty Among Married-Couple vs Single-Parent Households in Batavia
The poverty data for Batavia shows that 46 of the married-couple family households (0.8%) and 175 of the single-parent households (19.6%) are living below the poverty level. Within the married-couple family households, those with 3 or 4 children have the highest poverty rate, with 27 households (3.8%) falling below the poverty line. Among the single-parent households, those with 3 or 4 children have the highest poverty rate, with 45 household (83.3%) living below poverty.
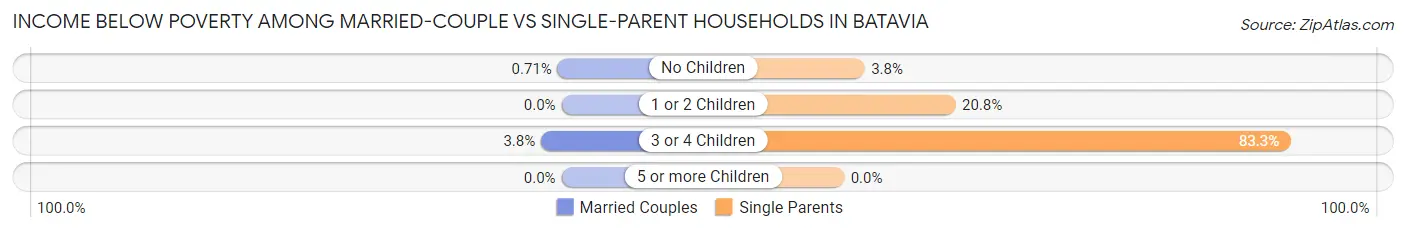
| Children | Married-Couple Families | Single-Parent Households |
| No Children | 19 (0.7%) | 10 (3.8%) |
| 1 or 2 Children | 0 (0.0%) | 120 (20.8%) |
| 3 or 4 Children | 27 (3.8%) | 45 (83.3%) |
| 5 or more Children | 0 (0.0%) | 0 (0.0%) |
| Total | 46 (0.8%) | 175 (19.6%) |
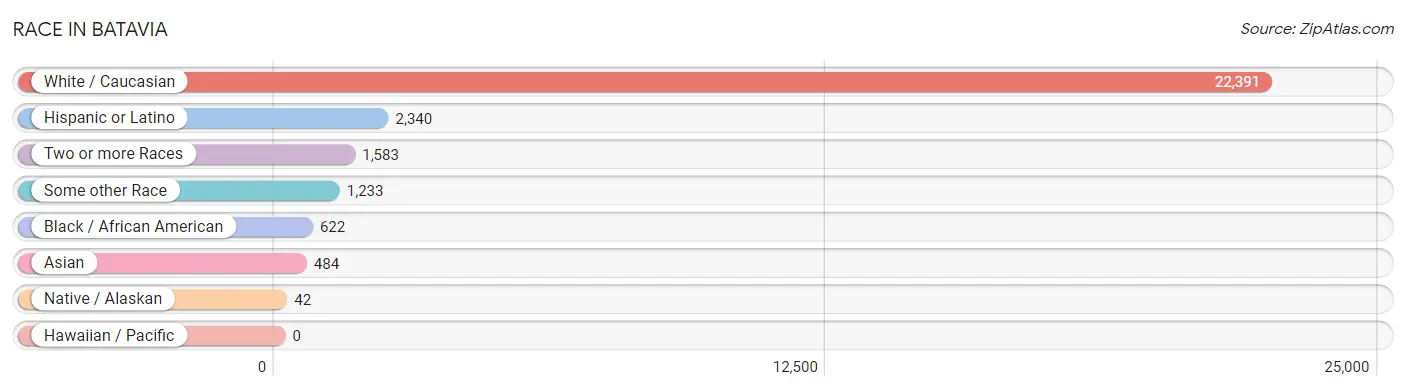
Race in Batavia
The most populous races in Batavia are White / Caucasian (22,391 | 85.0%), Hispanic or Latino (2,340 | 8.9%), and Two or more Races (1,583 | 6.0%).
| Race | # Population | % Population |
| Asian | 484 | 1.8% |
| Black / African American | 622 | 2.4% |
| Hawaiian / Pacific | 0 | 0.0% |
| Hispanic or Latino | 2,340 | 8.9% |
| Native / Alaskan | 42 | 0.2% |
| White / Caucasian | 22,391 | 85.0% |
| Two or more Races | 1,583 | 6.0% |
| Some other Race | 1,233 | 4.7% |
| Total | 26,355 | 100.0% |
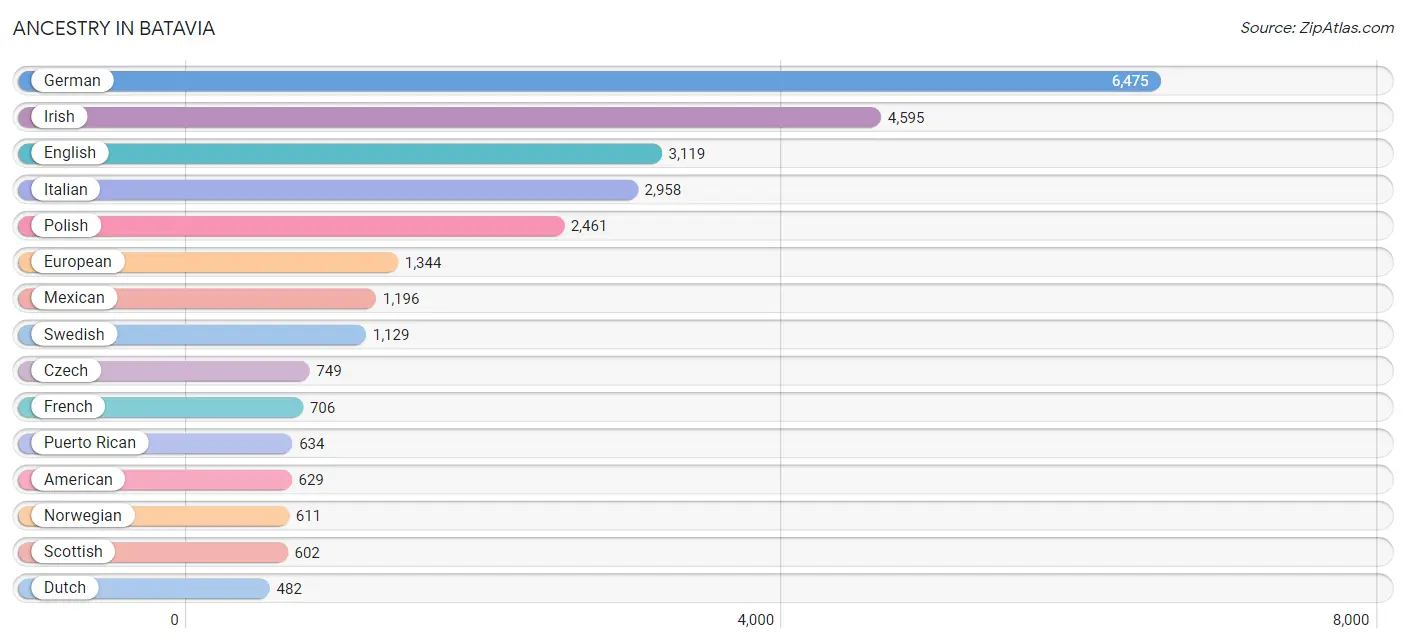
Ancestry in Batavia
The most populous ancestries reported in Batavia are German (6,475 | 24.6%), Irish (4,595 | 17.4%), English (3,119 | 11.8%), Italian (2,958 | 11.2%), and Polish (2,461 | 9.3%), together accounting for 74.4% of all Batavia residents.
| Ancestry | # Population | % Population |
| African | 22 | 0.1% |
| Albanian | 34 | 0.1% |
| American | 629 | 2.4% |
| Arab | 49 | 0.2% |
| Armenian | 70 | 0.3% |
| Austrian | 161 | 0.6% |
| Belgian | 16 | 0.1% |
| Bhutanese | 39 | 0.2% |
| British | 111 | 0.4% |
| Burmese | 145 | 0.5% |
| Canadian | 25 | 0.1% |
| Central American | 38 | 0.1% |
| Cherokee | 40 | 0.2% |
| Chilean | 7 | 0.0% |
| Chinese | 12 | 0.1% |
| Cree | 4 | 0.0% |
| Creek | 21 | 0.1% |
| Croatian | 49 | 0.2% |
| Cuban | 8 | 0.0% |
| Cypriot | 7 | 0.0% |
| Czech | 749 | 2.8% |
| Czechoslovakian | 39 | 0.2% |
| Danish | 210 | 0.8% |
| Delaware | 10 | 0.0% |
| Dutch | 482 | 1.8% |
| Eastern European | 133 | 0.5% |
| Egyptian | 9 | 0.0% |
| English | 3,119 | 11.8% |
| Estonian | 14 | 0.1% |
| European | 1,344 | 5.1% |
| Finnish | 18 | 0.1% |
| French | 706 | 2.7% |
| French Canadian | 203 | 0.8% |
| German | 6,475 | 24.6% |
| Greek | 220 | 0.8% |
| Guatemalan | 27 | 0.1% |
| Hungarian | 172 | 0.6% |
| Indian (Asian) | 66 | 0.3% |
| Irish | 4,595 | 17.4% |
| Italian | 2,958 | 11.2% |
| Korean | 125 | 0.5% |
| Laotian | 18 | 0.1% |
| Latvian | 21 | 0.1% |
| Lithuanian | 281 | 1.1% |
| Luxembourger | 20 | 0.1% |
| Menominee | 7 | 0.0% |
| Mexican | 1,196 | 4.5% |
| Mexican American Indian | 5 | 0.0% |
| Nigerian | 9 | 0.0% |
| Northern European | 15 | 0.1% |
| Norwegian | 611 | 2.3% |
| Peruvian | 73 | 0.3% |
| Polish | 2,461 | 9.3% |
| Puerto Rican | 634 | 2.4% |
| Romanian | 15 | 0.1% |
| Russian | 83 | 0.3% |
| Salvadoran | 11 | 0.0% |
| Scandinavian | 67 | 0.3% |
| Scotch-Irish | 158 | 0.6% |
| Scottish | 602 | 2.3% |
| Serbian | 96 | 0.4% |
| Slovak | 35 | 0.1% |
| Slovene | 24 | 0.1% |
| South American | 80 | 0.3% |
| Spaniard | 141 | 0.5% |
| Spanish | 123 | 0.5% |
| Sri Lankan | 52 | 0.2% |
| Subsaharan African | 31 | 0.1% |
| Swedish | 1,129 | 4.3% |
| Swiss | 149 | 0.6% |
| Syrian | 8 | 0.0% |
| Thai | 462 | 1.8% |
| Trinidadian and Tobagonian | 18 | 0.1% |
| Ukrainian | 100 | 0.4% |
| Welsh | 87 | 0.3% |
| West Indian | 82 | 0.3% |
| Yugoslavian | 23 | 0.1% | View All 77 Rows |
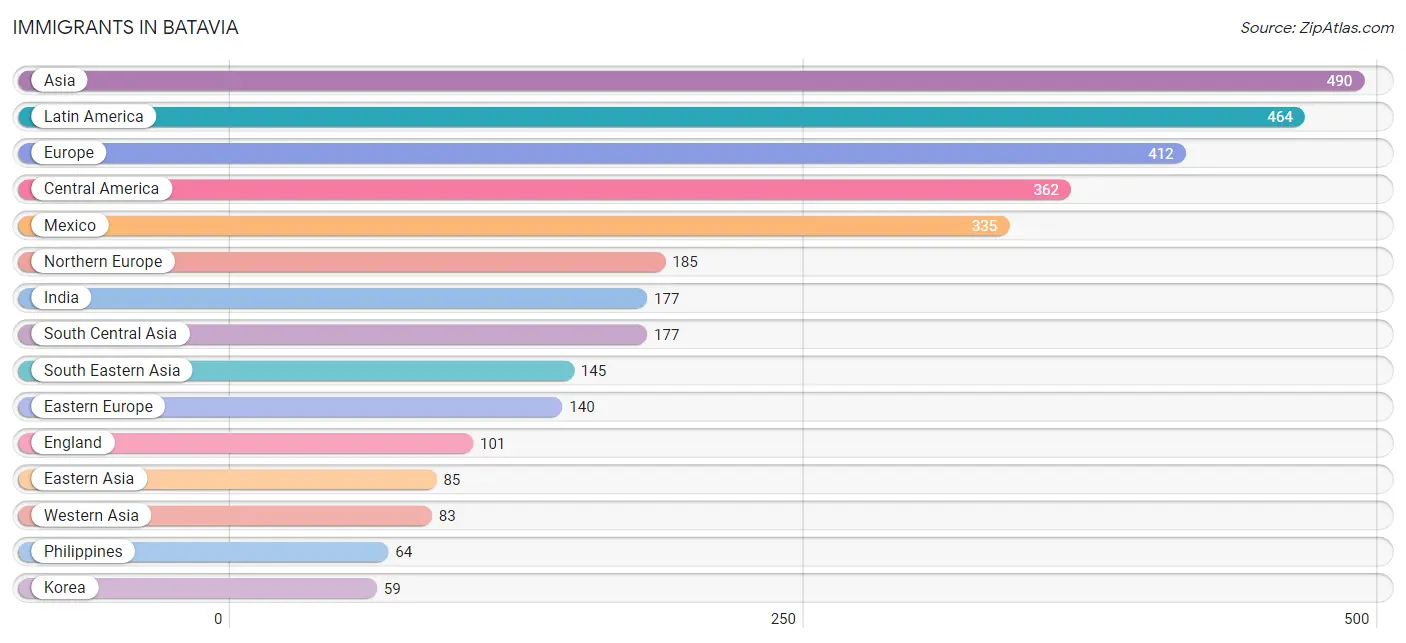
Immigrants in Batavia
The most numerous immigrant groups reported in Batavia came from Asia (490 | 1.9%), Latin America (464 | 1.8%), Europe (412 | 1.6%), Central America (362 | 1.4%), and Mexico (335 | 1.3%), together accounting for 7.8% of all Batavia residents.
| Immigration Origin | # Population | % Population |
| Africa | 37 | 0.1% |
| Asia | 490 | 1.9% |
| Bosnia and Herzegovina | 14 | 0.1% |
| Brazil | 51 | 0.2% |
| Canada | 30 | 0.1% |
| Caribbean | 44 | 0.2% |
| Central America | 362 | 1.4% |
| Chile | 7 | 0.0% |
| China | 26 | 0.1% |
| Eastern Africa | 20 | 0.1% |
| Eastern Asia | 85 | 0.3% |
| Eastern Europe | 140 | 0.5% |
| England | 101 | 0.4% |
| Ethiopia | 9 | 0.0% |
| Europe | 412 | 1.6% |
| France | 17 | 0.1% |
| Germany | 19 | 0.1% |
| Guatemala | 27 | 0.1% |
| Hong Kong | 1 | 0.0% |
| India | 177 | 0.7% |
| Indonesia | 39 | 0.2% |
| Ireland | 45 | 0.2% |
| Italy | 27 | 0.1% |
| Korea | 59 | 0.2% |
| Latin America | 464 | 1.8% |
| Mexico | 335 | 1.3% |
| Nigeria | 9 | 0.0% |
| Northern Europe | 185 | 0.7% |
| Norway | 8 | 0.0% |
| Philippines | 64 | 0.2% |
| Poland | 40 | 0.2% |
| Romania | 51 | 0.2% |
| Saudi Arabia | 27 | 0.1% |
| South Africa | 8 | 0.0% |
| South America | 58 | 0.2% |
| South Central Asia | 177 | 0.7% |
| South Eastern Asia | 145 | 0.5% |
| Southern Europe | 44 | 0.2% |
| Spain | 17 | 0.1% |
| Sweden | 4 | 0.0% |
| Switzerland | 7 | 0.0% |
| Syria | 17 | 0.1% |
| Trinidad and Tobago | 44 | 0.2% |
| Ukraine | 35 | 0.1% |
| Vietnam | 42 | 0.2% |
| Western Africa | 9 | 0.0% |
| Western Asia | 83 | 0.3% |
| Western Europe | 43 | 0.2% | View All 48 Rows |
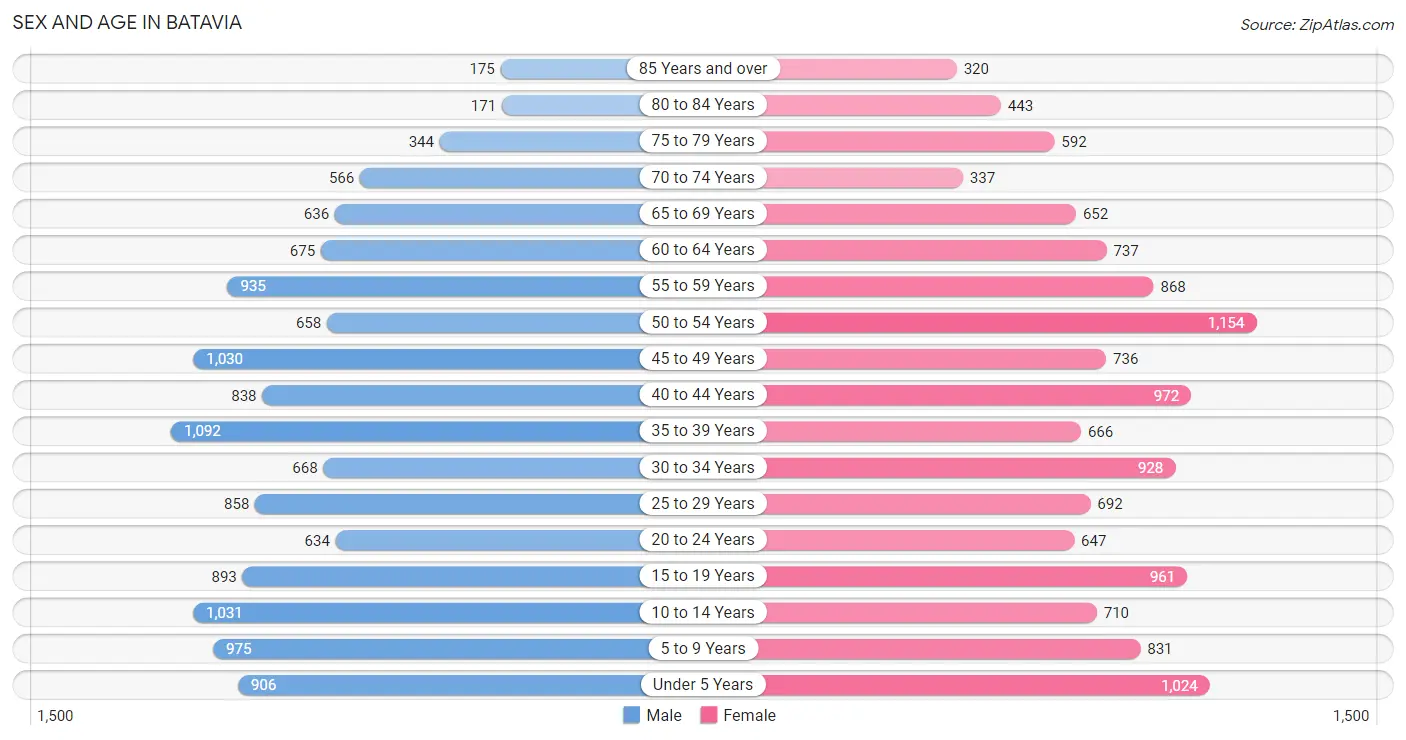
Sex and Age in Batavia
Sex and Age in Batavia
The most populous age groups in Batavia are 35 to 39 Years (1,092 | 8.4%) for men and 50 to 54 Years (1,154 | 8.7%) for women.
| Age Bracket | Male | Female |
| Under 5 Years | 906 (6.9%) | 1,024 (7.7%) |
| 5 to 9 Years | 975 (7.4%) | 831 (6.3%) |
| 10 to 14 Years | 1,031 (7.9%) | 710 (5.3%) |
| 15 to 19 Years | 893 (6.8%) | 961 (7.2%) |
| 20 to 24 Years | 634 (4.9%) | 647 (4.9%) |
| 25 to 29 Years | 858 (6.6%) | 692 (5.2%) |
| 30 to 34 Years | 668 (5.1%) | 928 (7.0%) |
| 35 to 39 Years | 1,092 (8.4%) | 666 (5.0%) |
| 40 to 44 Years | 838 (6.4%) | 972 (7.3%) |
| 45 to 49 Years | 1,030 (7.9%) | 736 (5.6%) |
| 50 to 54 Years | 658 (5.0%) | 1,154 (8.7%) |
| 55 to 59 Years | 935 (7.1%) | 868 (6.5%) |
| 60 to 64 Years | 675 (5.2%) | 737 (5.6%) |
| 65 to 69 Years | 636 (4.9%) | 652 (4.9%) |
| 70 to 74 Years | 566 (4.3%) | 337 (2.5%) |
| 75 to 79 Years | 344 (2.6%) | 592 (4.5%) |
| 80 to 84 Years | 171 (1.3%) | 443 (3.3%) |
| 85 Years and over | 175 (1.3%) | 320 (2.4%) |
| Total | 13,085 (100.0%) | 13,270 (100.0%) |
Families and Households in Batavia
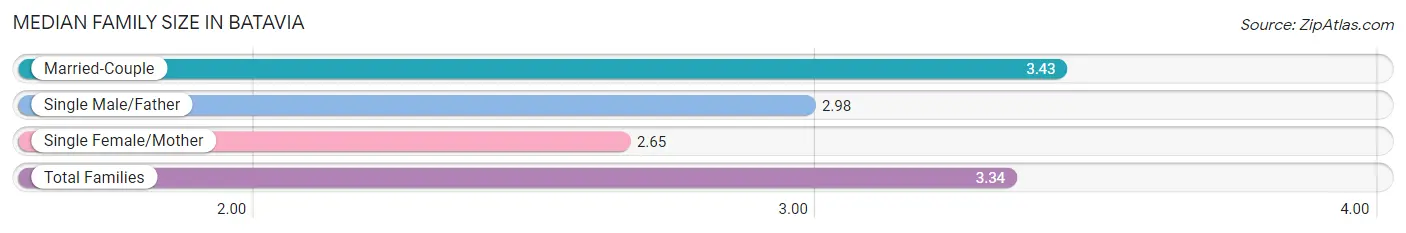
Median Family Size in Batavia
The median family size in Batavia is 3.34 persons per family, with married-couple families (5,857 | 86.8%) accounting for the largest median family size of 3.43 persons per family. On the other hand, single female/mother families (583 | 8.6%) represent the smallest median family size with 2.65 persons per family.
| Family Type | # Families | Family Size |
| Married-Couple | 5,857 (86.8%) | 3.43 |
| Single Male/Father | 311 (4.6%) | 2.98 |
| Single Female/Mother | 583 (8.6%) | 2.65 |
| Total Families | 6,751 (100.0%) | 3.34 |
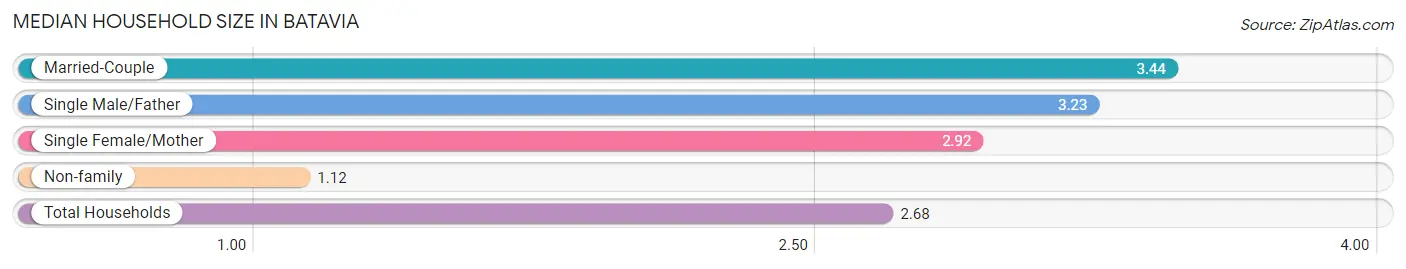
Median Household Size in Batavia
The median household size in Batavia is 2.68 persons per household, with married-couple households (5,857 | 59.7%) accounting for the largest median household size of 3.44 persons per household. non-family households (3,063 | 31.2%) represent the smallest median household size with 1.12 persons per household.
| Household Type | # Households | Household Size |
| Married-Couple | 5,857 (59.7%) | 3.44 |
| Single Male/Father | 311 (3.2%) | 3.23 |
| Single Female/Mother | 583 (5.9%) | 2.92 |
| Non-family | 3,063 (31.2%) | 1.12 |
| Total Households | 9,814 (100.0%) | 2.68 |
Household Size by Marriage Status in Batavia
Out of a total of 9,814 households in Batavia, 6,751 (68.8%) are family households, while 3,063 (31.2%) are nonfamily households. The most numerous type of family households are 2-person households, comprising 2,326, and the most common type of nonfamily households are 1-person households, comprising 2,682.
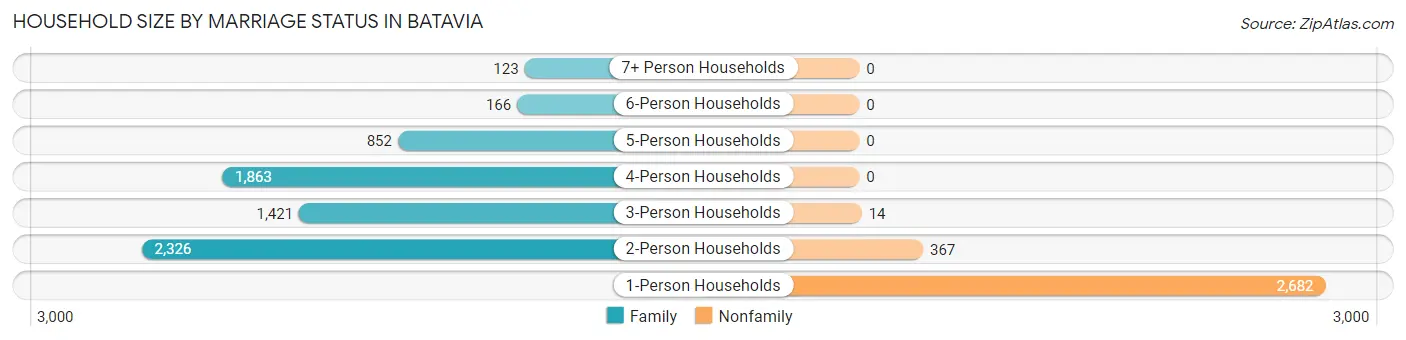
| Household Size | Family Households | Nonfamily Households |
| 1-Person Households | - | 2,682 (27.3%) |
| 2-Person Households | 2,326 (23.7%) | 367 (3.7%) |
| 3-Person Households | 1,421 (14.5%) | 14 (0.1%) |
| 4-Person Households | 1,863 (19.0%) | 0 (0.0%) |
| 5-Person Households | 852 (8.7%) | 0 (0.0%) |
| 6-Person Households | 166 (1.7%) | 0 (0.0%) |
| 7+ Person Households | 123 (1.3%) | 0 (0.0%) |
| Total | 6,751 (68.8%) | 3,063 (31.2%) |
Female Fertility in Batavia
Fertility by Age in Batavia
Average fertility rate in Batavia is 71.0 births per 1,000 women. Women in the age bracket of 20 to 34 years have the highest fertility rate with 147.0 births per 1,000 women. Women in the age bracket of 20 to 34 years acount for 81.1% of all women with births.
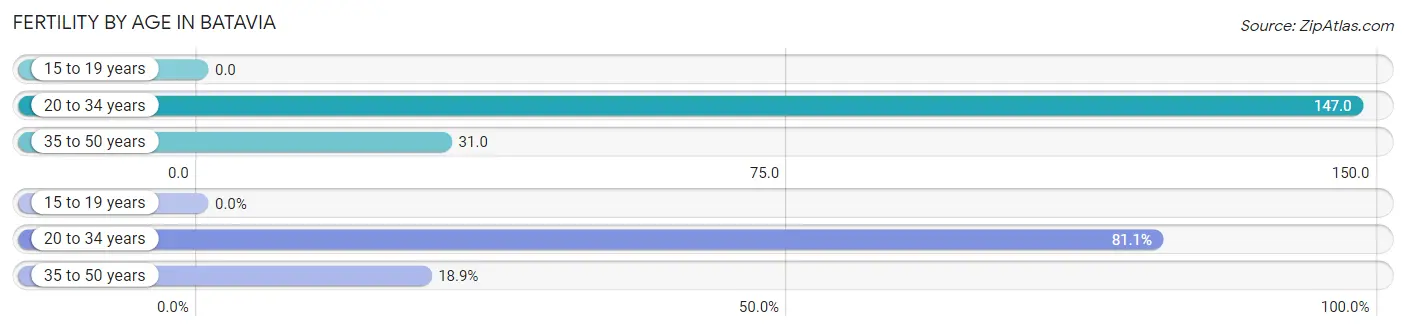
| Age Bracket | Women with Births | Births / 1,000 Women |
| 15 to 19 years | 0 (0.0%) | 0.0 |
| 20 to 34 years | 334 (81.1%) | 147.0 |
| 35 to 50 years | 78 (18.9%) | 31.0 |
| Total | 412 (100.0%) | 71.0 |
Fertility by Age by Marriage Status in Batavia
87.6% of women with births (412) in Batavia are married. The highest percentage of unmarried women with births falls into 20 to 34 years age bracket with 15.3% of them unmarried at the time of birth, while the lowest percentage of unmarried women with births belong to 35 to 50 years age bracket with 0.0% of them unmarried.
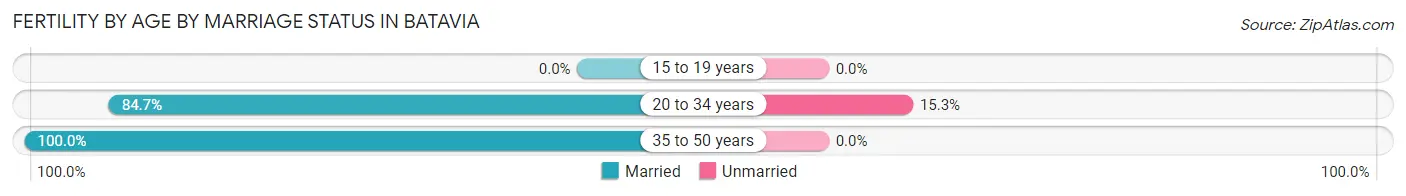
| Age Bracket | Married | Unmarried |
| 15 to 19 years | 0 (0.0%) | 0 (0.0%) |
| 20 to 34 years | 283 (84.7%) | 51 (15.3%) |
| 35 to 50 years | 78 (100.0%) | 0 (0.0%) |
| Total | 361 (87.6%) | 51 (12.4%) |
Fertility by Education in Batavia
Average fertility rate in Batavia is 71.0 births per 1,000 women. Women with the education attainment of college or associate's degree have the highest fertility rate of 138.0 births per 1,000 women, while women with the education attainment of less than high school have the lowest fertility at 6.0 births per 1,000 women. Women with the education attainment of bachelor's degree represent 42.0% of all women with births.
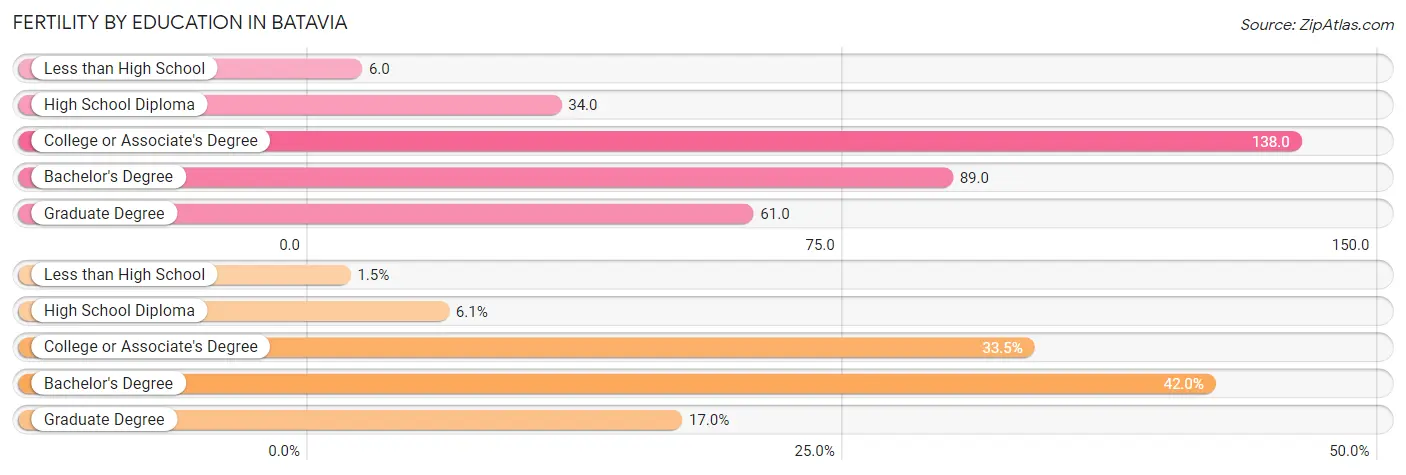
| Educational Attainment | Women with Births | Births / 1,000 Women |
| Less than High School | 6 (1.5%) | 6.0 |
| High School Diploma | 25 (6.1%) | 34.0 |
| College or Associate's Degree | 138 (33.5%) | 138.0 |
| Bachelor's Degree | 173 (42.0%) | 89.0 |
| Graduate Degree | 70 (17.0%) | 61.0 |
| Total | 412 (100.0%) | 71.0 |
Fertility by Education by Marriage Status in Batavia
12.4% of women with births in Batavia are unmarried. Women with the educational attainment of less than high school are most likely to be married with 100.0% of them married at childbirth, while women with the educational attainment of college or associate's degree are least likely to be married with 37.0% of them unmarried at childbirth.
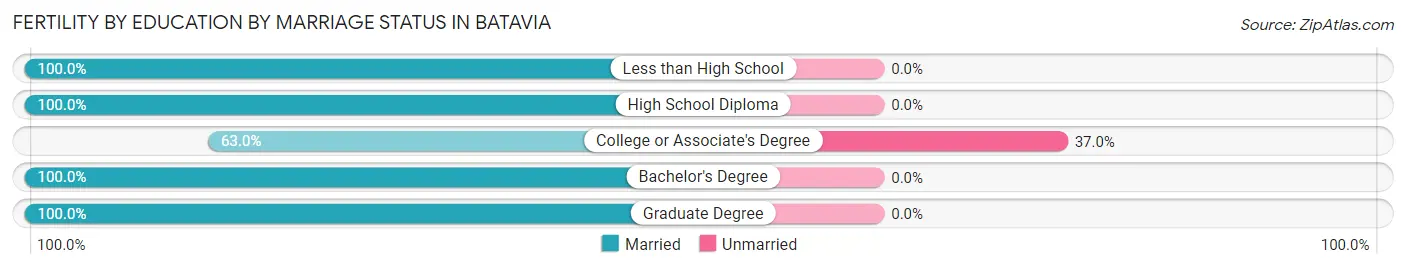
| Educational Attainment | Married | Unmarried |
| Less than High School | 6 (100.0%) | 0 (0.0%) |
| High School Diploma | 25 (100.0%) | 0 (0.0%) |
| College or Associate's Degree | 87 (63.0%) | 51 (37.0%) |
| Bachelor's Degree | 173 (100.0%) | 0 (0.0%) |
| Graduate Degree | 70 (100.0%) | 0 (0.0%) |
| Total | 361 (87.6%) | 51 (12.4%) |
Employment Characteristics in Batavia
Employment by Class of Employer in Batavia
Among the 13,672 employed individuals in Batavia, private company employees (9,514 | 69.6%), not-for-profit organizations (1,184 | 8.7%), and local government employees (1,069 | 7.8%) make up the most common classes of employment.
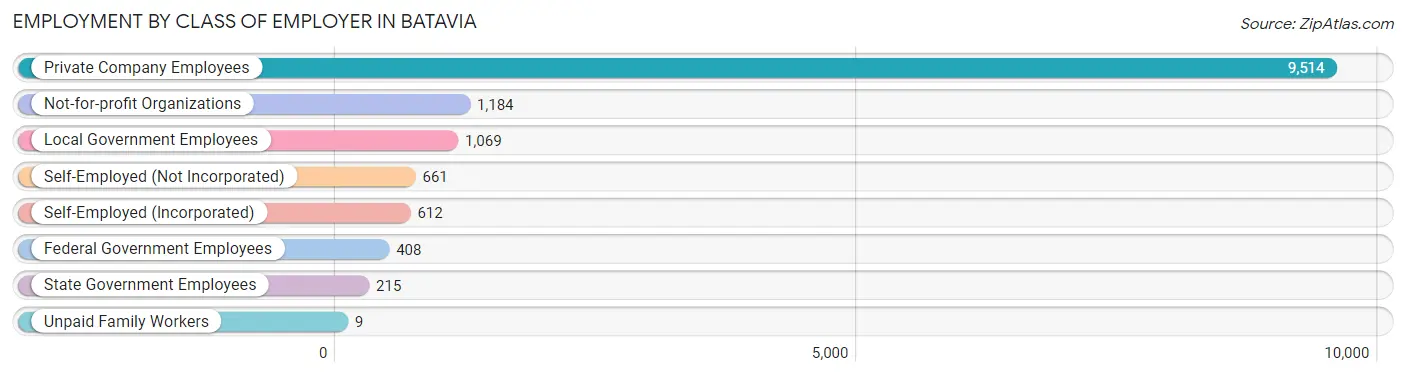
| Employer Class | # Employees | % Employees |
| Private Company Employees | 9,514 | 69.6% |
| Self-Employed (Incorporated) | 612 | 4.5% |
| Self-Employed (Not Incorporated) | 661 | 4.8% |
| Not-for-profit Organizations | 1,184 | 8.7% |
| Local Government Employees | 1,069 | 7.8% |
| State Government Employees | 215 | 1.6% |
| Federal Government Employees | 408 | 3.0% |
| Unpaid Family Workers | 9 | 0.1% |
| Total | 13,672 | 100.0% |
Employment Status by Age in Batavia
According to the labor force statistics for Batavia, out of the total population over 16 years of age (20,467), 70.7% or 14,470 individuals are in the labor force, with 3.7% or 535 of them unemployed. The age group with the highest labor force participation rate is 45 to 54 years, with 94.7% or 3,388 individuals in the labor force. Within the labor force, the 16 to 19 years age range has the highest percentage of unemployed individuals, with 12.1% or 80 of them being unemployed.
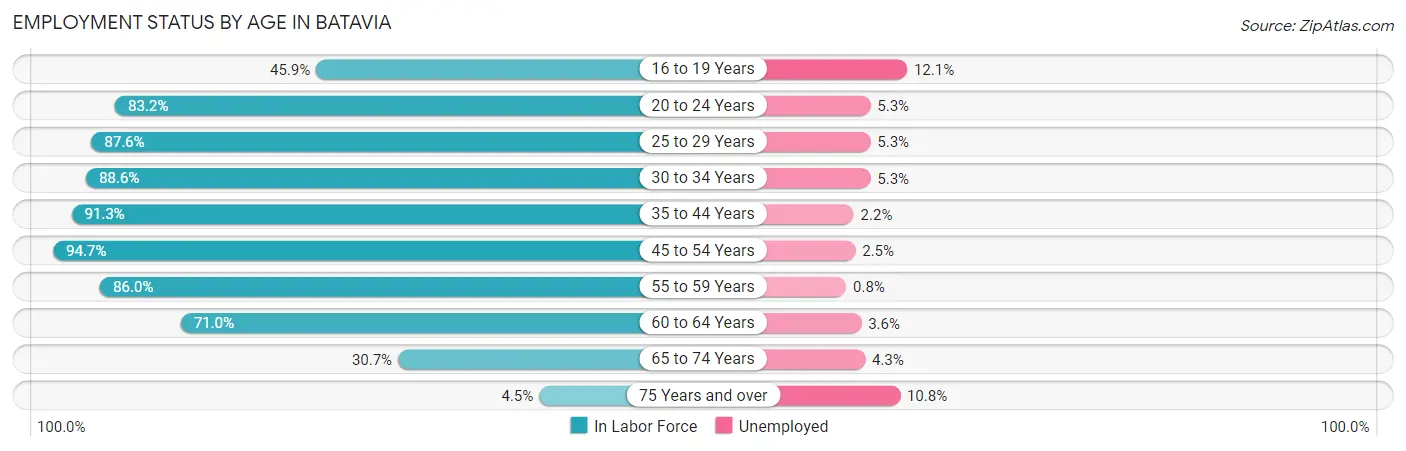
| Age Bracket | In Labor Force | Unemployed |
| 16 to 19 Years | 662 (45.9%) | 80 (12.1%) |
| 20 to 24 Years | 1,066 (83.2%) | 56 (5.3%) |
| 25 to 29 Years | 1,358 (87.6%) | 72 (5.3%) |
| 30 to 34 Years | 1,414 (88.6%) | 75 (5.3%) |
| 35 to 44 Years | 3,258 (91.3%) | 72 (2.2%) |
| 45 to 54 Years | 3,388 (94.7%) | 85 (2.5%) |
| 55 to 59 Years | 1,551 (86.0%) | 12 (0.8%) |
| 60 to 64 Years | 1,003 (71.0%) | 36 (3.6%) |
| 65 to 74 Years | 673 (30.7%) | 29 (4.3%) |
| 75 Years and over | 92 (4.5%) | 10 (10.8%) |
| Total | 14,470 (70.7%) | 535 (3.7%) |
Employment Status by Educational Attainment in Batavia
According to labor force statistics for Batavia, 88.6% of individuals (11,967) out of the total population between 25 and 64 years of age (13,507) are in the labor force, with 2.9% or 347 of them being unemployed. The group with the highest labor force participation rate are those with the educational attainment of bachelor's degree or higher, with 90.3% or 6,970 individuals in the labor force. Within the labor force, individuals with less than high school education have the highest percentage of unemployment, with 9.8% or 30 of them being unemployed.
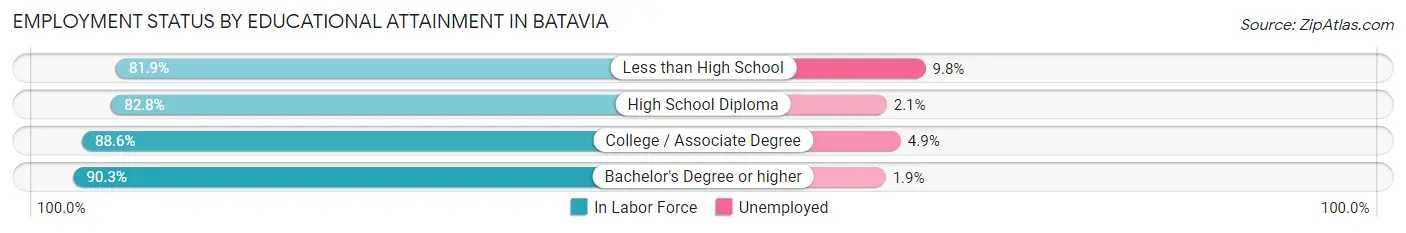
| Educational Attainment | In Labor Force | Unemployed |
| Less than High School | 307 (81.9%) | 37 (9.8%) |
| High School Diploma | 1,496 (82.8%) | 38 (2.1%) |
| College / Associate Degree | 3,195 (88.6%) | 177 (4.9%) |
| Bachelor's Degree or higher | 6,970 (90.3%) | 147 (1.9%) |
| Total | 11,967 (88.6%) | 392 (2.9%) |
Employment Occupations by Sex in Batavia
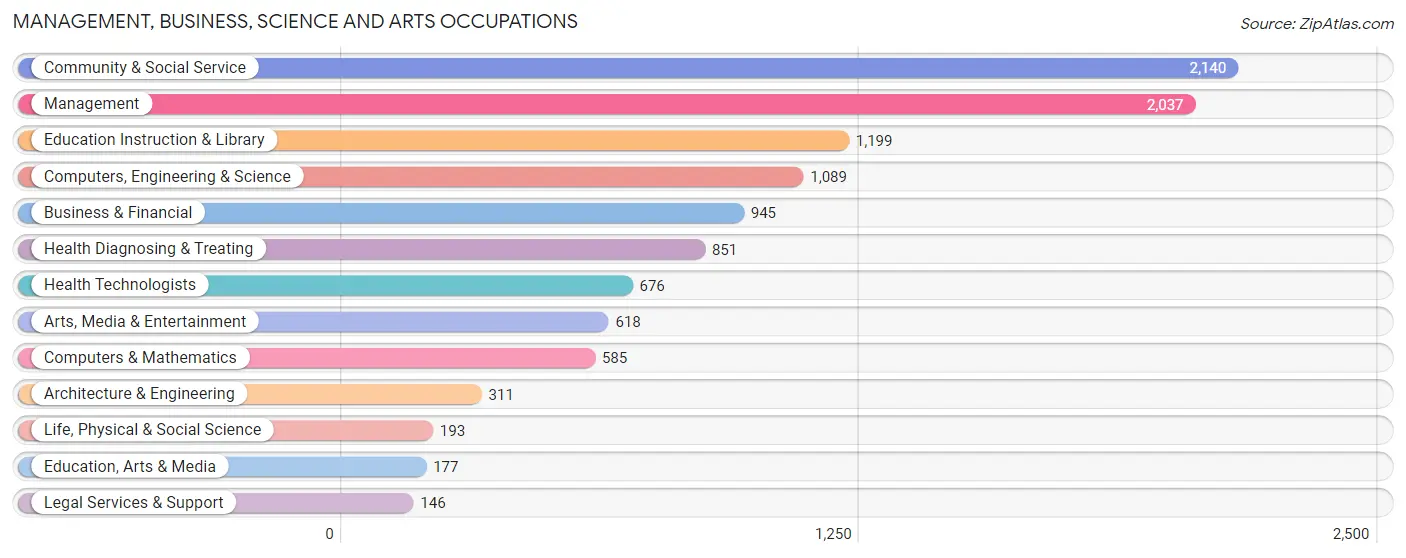
Management, Business, Science and Arts Occupations
The most common Management, Business, Science and Arts occupations in Batavia are Community & Social Service (2,140 | 15.4%), Management (2,037 | 14.6%), Education Instruction & Library (1,199 | 8.6%), Computers, Engineering & Science (1,089 | 7.8%), and Business & Financial (945 | 6.8%).
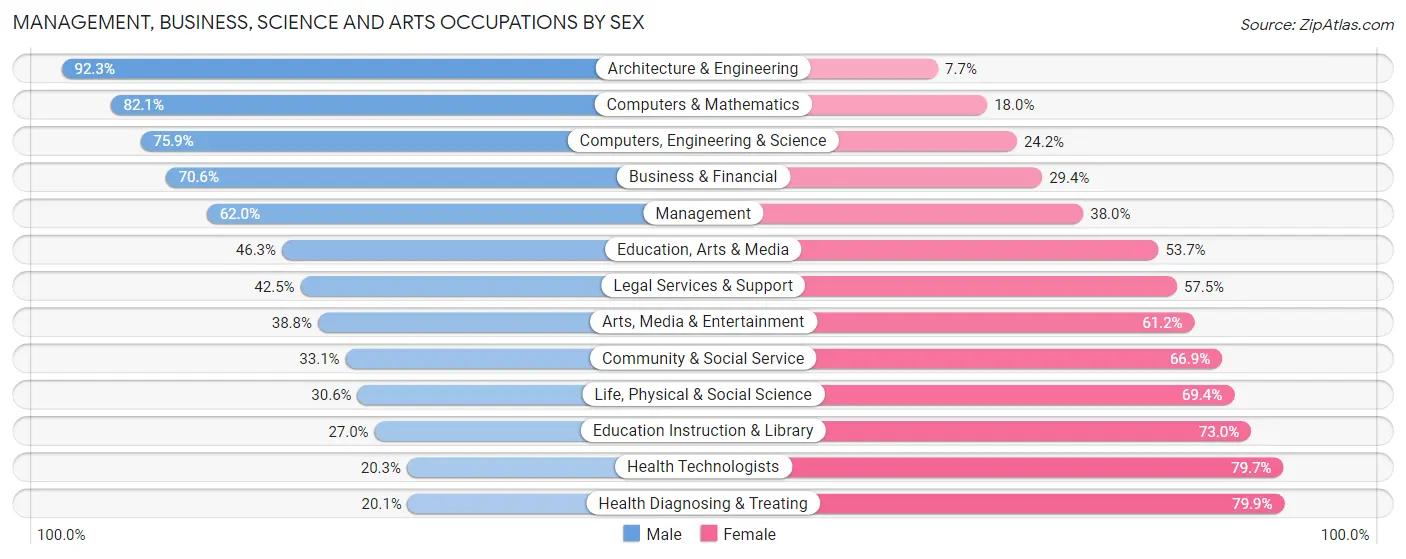
Management, Business, Science and Arts Occupations by Sex
Within the Management, Business, Science and Arts occupations in Batavia, the most male-oriented occupations are Architecture & Engineering (92.3%), Computers & Mathematics (82.1%), and Computers, Engineering & Science (75.8%), while the most female-oriented occupations are Health Diagnosing & Treating (79.9%), Health Technologists (79.7%), and Education Instruction & Library (73.0%).
| Occupation | Male | Female |
| Management | 1,263 (62.0%) | 774 (38.0%) |
| Business & Financial | 667 (70.6%) | 278 (29.4%) |
| Computers, Engineering & Science | 826 (75.8%) | 263 (24.1%) |
| Computers & Mathematics | 480 (82.1%) | 105 (17.9%) |
| Architecture & Engineering | 287 (92.3%) | 24 (7.7%) |
| Life, Physical & Social Science | 59 (30.6%) | 134 (69.4%) |
| Community & Social Service | 708 (33.1%) | 1,432 (66.9%) |
| Education, Arts & Media | 82 (46.3%) | 95 (53.7%) |
| Legal Services & Support | 62 (42.5%) | 84 (57.5%) |
| Education Instruction & Library | 324 (27.0%) | 875 (73.0%) |
| Arts, Media & Entertainment | 240 (38.8%) | 378 (61.2%) |
| Health Diagnosing & Treating | 171 (20.1%) | 680 (79.9%) |
| Health Technologists | 137 (20.3%) | 539 (79.7%) |
| Total (Category) | 3,635 (51.5%) | 3,427 (48.5%) |
| Total (Overall) | 7,502 (53.8%) | 6,432 (46.2%) |
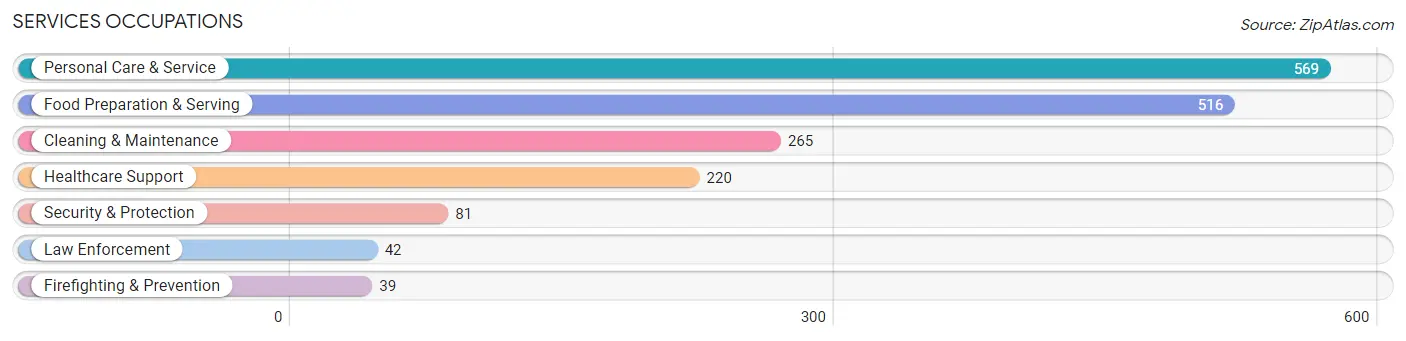
Services Occupations
The most common Services occupations in Batavia are Personal Care & Service (569 | 4.1%), Food Preparation & Serving (516 | 3.7%), Cleaning & Maintenance (265 | 1.9%), Healthcare Support (220 | 1.6%), and Security & Protection (81 | 0.6%).
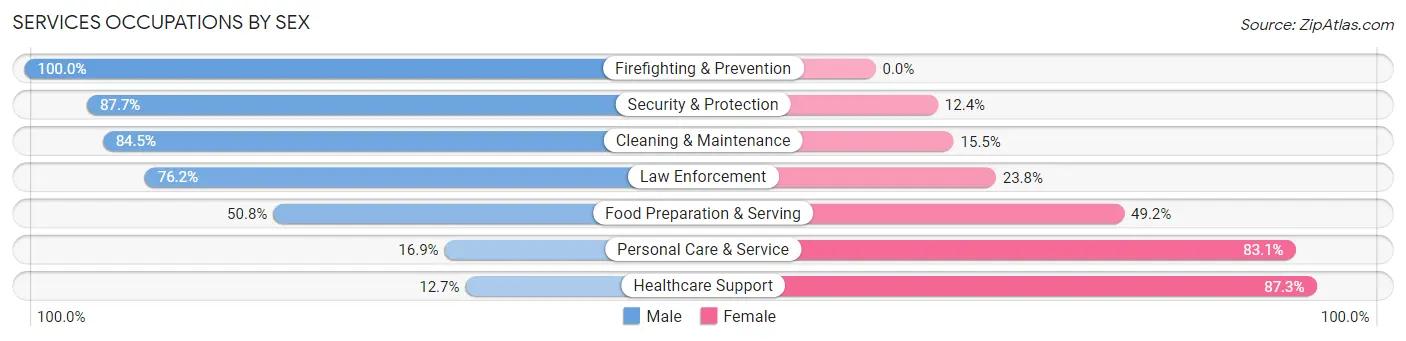
Services Occupations by Sex
Within the Services occupations in Batavia, the most male-oriented occupations are Firefighting & Prevention (100.0%), Security & Protection (87.6%), and Cleaning & Maintenance (84.5%), while the most female-oriented occupations are Healthcare Support (87.3%), Personal Care & Service (83.1%), and Food Preparation & Serving (49.2%).
| Occupation | Male | Female |
| Healthcare Support | 28 (12.7%) | 192 (87.3%) |
| Security & Protection | 71 (87.6%) | 10 (12.3%) |
| Firefighting & Prevention | 39 (100.0%) | 0 (0.0%) |
| Law Enforcement | 32 (76.2%) | 10 (23.8%) |
| Food Preparation & Serving | 262 (50.8%) | 254 (49.2%) |
| Cleaning & Maintenance | 224 (84.5%) | 41 (15.5%) |
| Personal Care & Service | 96 (16.9%) | 473 (83.1%) |
| Total (Category) | 681 (41.2%) | 970 (58.8%) |
| Total (Overall) | 7,502 (53.8%) | 6,432 (46.2%) |
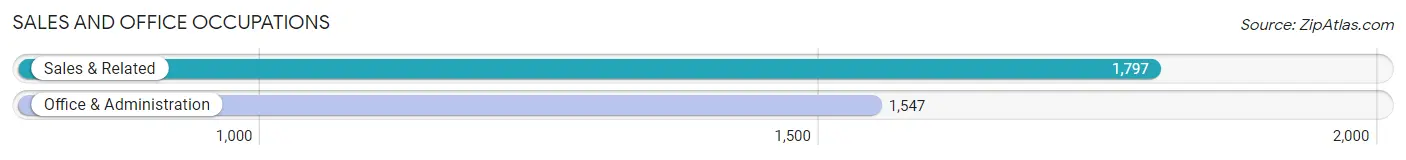
Sales and Office Occupations
The most common Sales and Office occupations in Batavia are Sales & Related (1,797 | 12.9%), and Office & Administration (1,547 | 11.1%).
Sales and Office Occupations by Sex
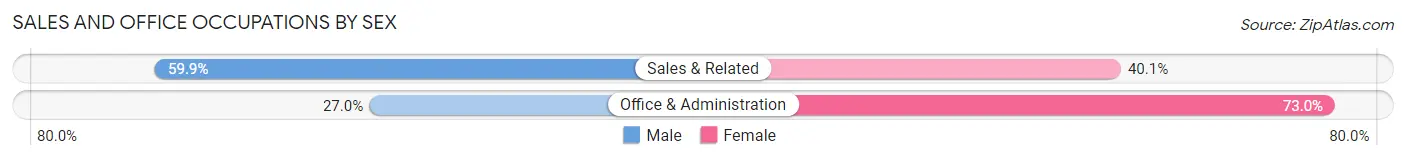
| Occupation | Male | Female |
| Sales & Related | 1,077 (59.9%) | 720 (40.1%) |
| Office & Administration | 418 (27.0%) | 1,129 (73.0%) |
| Total (Category) | 1,495 (44.7%) | 1,849 (55.3%) |
| Total (Overall) | 7,502 (53.8%) | 6,432 (46.2%) |
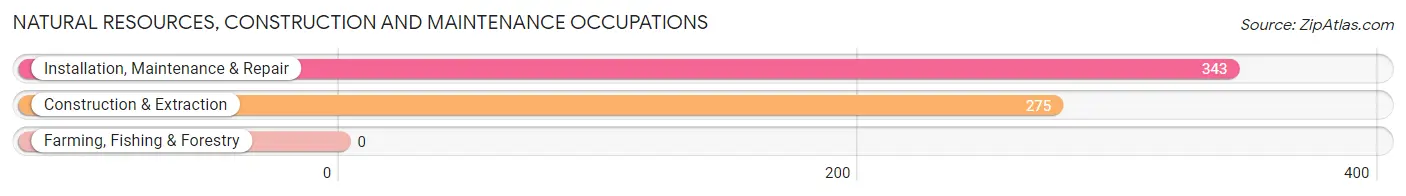
Natural Resources, Construction and Maintenance Occupations
The most common Natural Resources, Construction and Maintenance occupations in Batavia are Installation, Maintenance & Repair (343 | 2.5%), and Construction & Extraction (275 | 2.0%).
Natural Resources, Construction and Maintenance Occupations by Sex
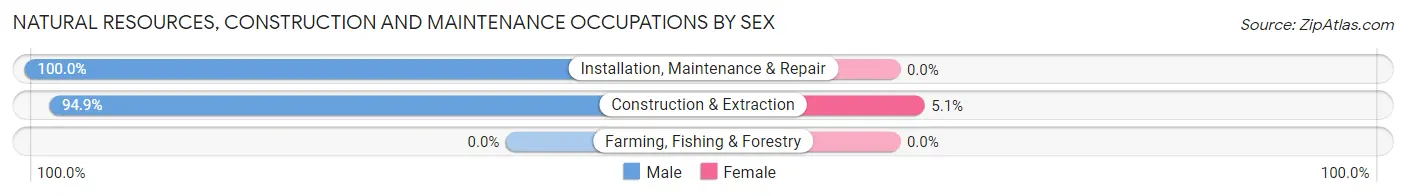
| Occupation | Male | Female |
| Farming, Fishing & Forestry | 0 (0.0%) | 0 (0.0%) |
| Construction & Extraction | 261 (94.9%) | 14 (5.1%) |
| Installation, Maintenance & Repair | 343 (100.0%) | 0 (0.0%) |
| Total (Category) | 604 (97.7%) | 14 (2.3%) |
| Total (Overall) | 7,502 (53.8%) | 6,432 (46.2%) |
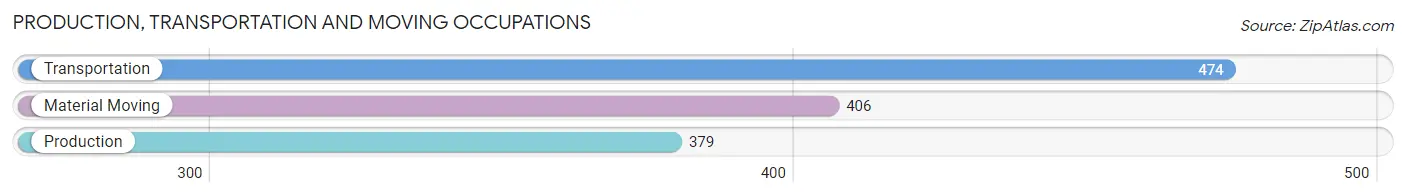
Production, Transportation and Moving Occupations
The most common Production, Transportation and Moving occupations in Batavia are Transportation (474 | 3.4%), Material Moving (406 | 2.9%), and Production (379 | 2.7%).
Production, Transportation and Moving Occupations by Sex
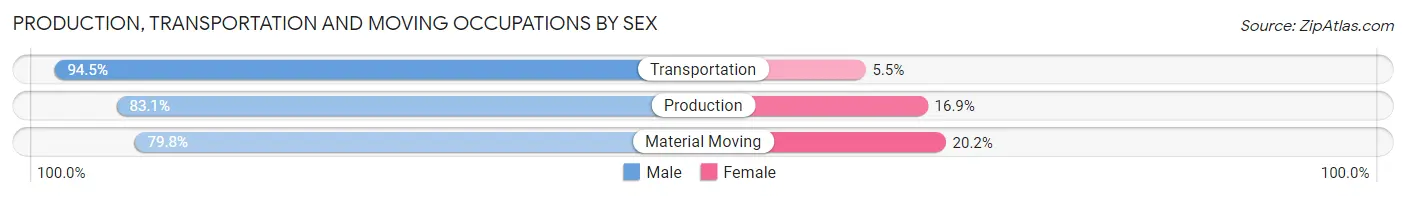
| Occupation | Male | Female |
| Production | 315 (83.1%) | 64 (16.9%) |
| Transportation | 448 (94.5%) | 26 (5.5%) |
| Material Moving | 324 (79.8%) | 82 (20.2%) |
| Total (Category) | 1,087 (86.3%) | 172 (13.7%) |
| Total (Overall) | 7,502 (53.8%) | 6,432 (46.2%) |
Employment Industries by Sex in Batavia
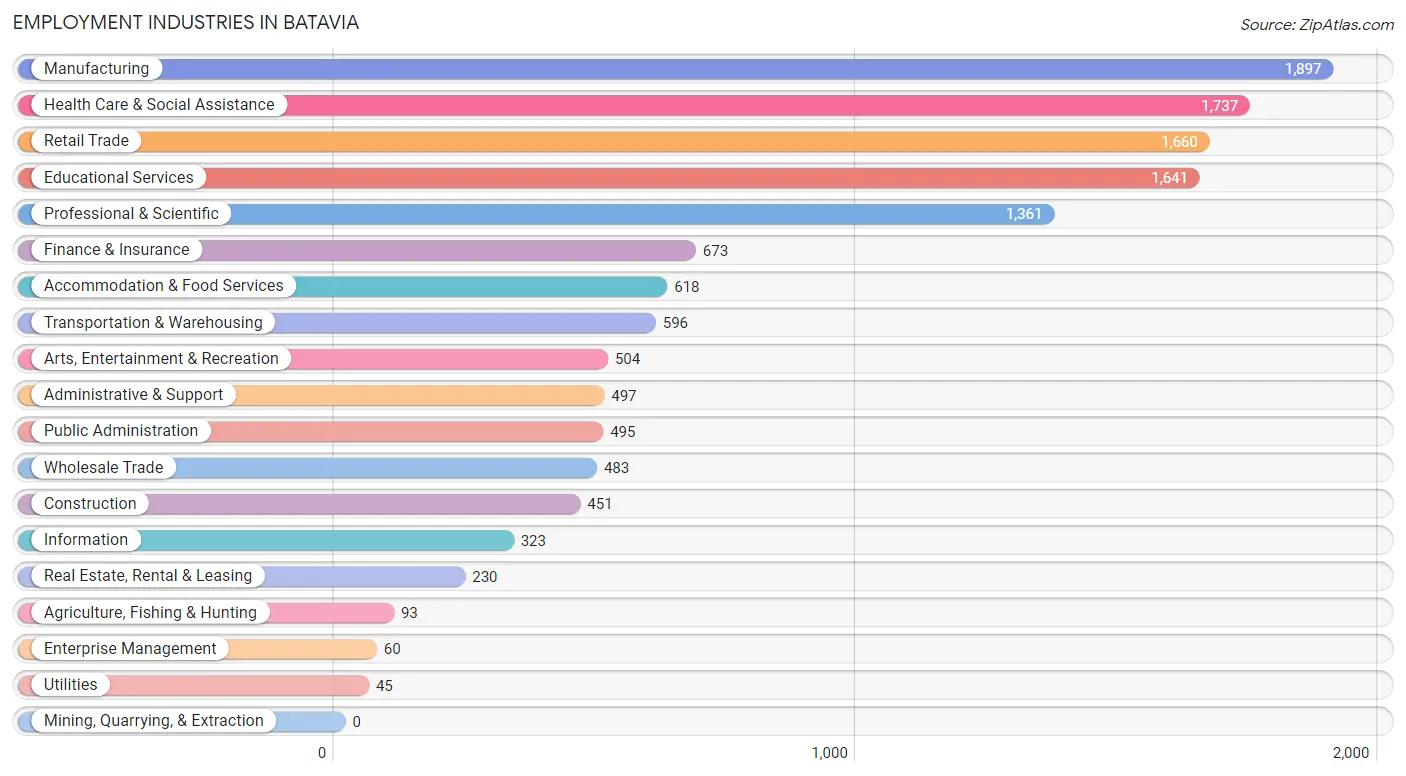
Employment Industries in Batavia
The major employment industries in Batavia include Manufacturing (1,897 | 13.6%), Health Care & Social Assistance (1,737 | 12.5%), Retail Trade (1,660 | 11.9%), Educational Services (1,641 | 11.8%), and Professional & Scientific (1,361 | 9.8%).
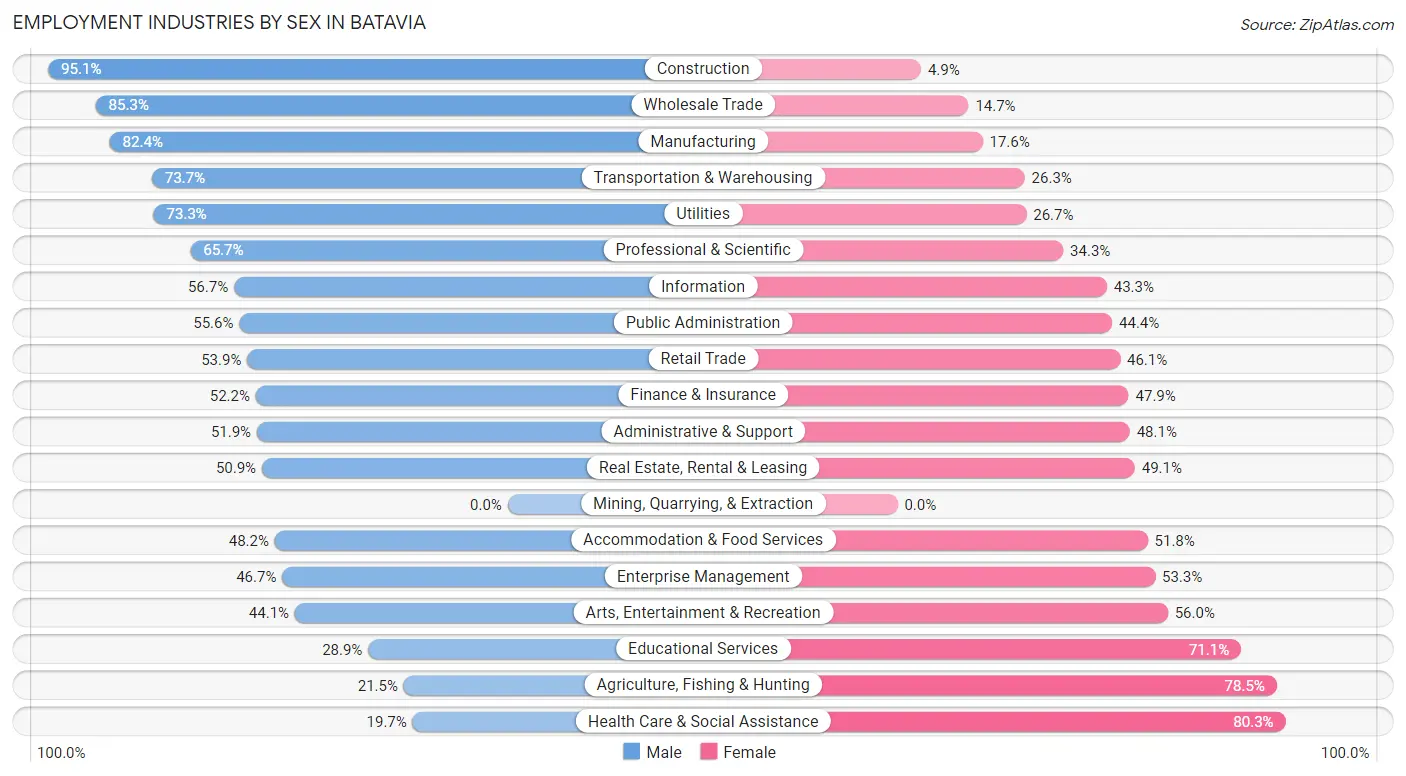
Employment Industries by Sex in Batavia
The Batavia industries that see more men than women are Construction (95.1%), Wholesale Trade (85.3%), and Manufacturing (82.4%), whereas the industries that tend to have a higher number of women are Health Care & Social Assistance (80.3%), Agriculture, Fishing & Hunting (78.5%), and Educational Services (71.1%).
| Industry | Male | Female |
| Agriculture, Fishing & Hunting | 20 (21.5%) | 73 (78.5%) |
| Mining, Quarrying, & Extraction | 0 (0.0%) | 0 (0.0%) |
| Construction | 429 (95.1%) | 22 (4.9%) |
| Manufacturing | 1,563 (82.4%) | 334 (17.6%) |
| Wholesale Trade | 412 (85.3%) | 71 (14.7%) |
| Retail Trade | 895 (53.9%) | 765 (46.1%) |
| Transportation & Warehousing | 439 (73.7%) | 157 (26.3%) |
| Utilities | 33 (73.3%) | 12 (26.7%) |
| Information | 183 (56.7%) | 140 (43.3%) |
| Finance & Insurance | 351 (52.1%) | 322 (47.8%) |
| Real Estate, Rental & Leasing | 117 (50.9%) | 113 (49.1%) |
| Professional & Scientific | 894 (65.7%) | 467 (34.3%) |
| Enterprise Management | 28 (46.7%) | 32 (53.3%) |
| Administrative & Support | 258 (51.9%) | 239 (48.1%) |
| Educational Services | 474 (28.9%) | 1,167 (71.1%) |
| Health Care & Social Assistance | 342 (19.7%) | 1,395 (80.3%) |
| Arts, Entertainment & Recreation | 222 (44.1%) | 282 (55.9%) |
| Accommodation & Food Services | 298 (48.2%) | 320 (51.8%) |
| Public Administration | 275 (55.6%) | 220 (44.4%) |
| Total | 7,502 (53.8%) | 6,432 (46.2%) |
Education in Batavia
School Enrollment in Batavia
The most common levels of schooling among the 6,806 students in Batavia are high school (1,851 | 27.2%), middle school (1,413 | 20.8%), and elementary school (1,235 | 18.1%).
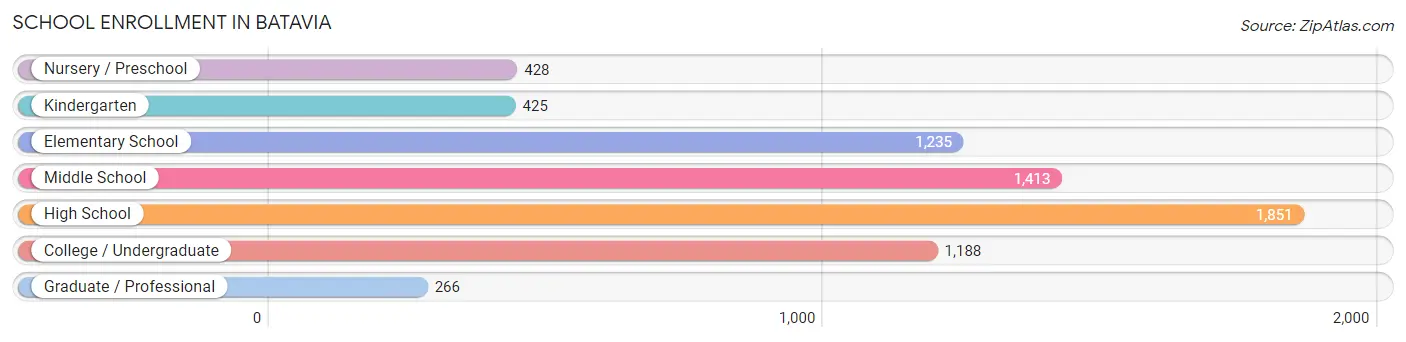
| School Level | # Students | % Students |
| Nursery / Preschool | 428 | 6.3% |
| Kindergarten | 425 | 6.2% |
| Elementary School | 1,235 | 18.1% |
| Middle School | 1,413 | 20.8% |
| High School | 1,851 | 27.2% |
| College / Undergraduate | 1,188 | 17.5% |
| Graduate / Professional | 266 | 3.9% |
| Total | 6,806 | 100.0% |
School Enrollment by Age by Funding Source in Batavia
Out of a total of 6,806 students who are enrolled in schools in Batavia, 851 (12.5%) attend a private institution, while the remaining 5,955 (87.5%) are enrolled in public schools. The age group of 3 to 4 year olds has the highest likelihood of being enrolled in private schools, with 125 (44.3% in the age bracket) enrolled. Conversely, the age group of 15 to 17 year olds has the lowest likelihood of being enrolled in a private school, with 1,368 (95.7% in the age bracket) attending a public institution.
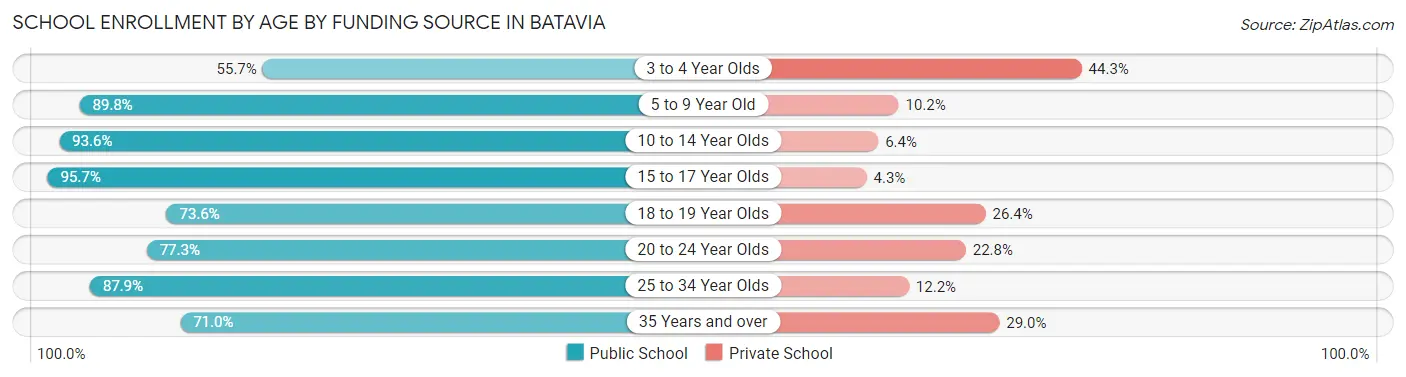
| Age Bracket | Public School | Private School |
| 3 to 4 Year Olds | 157 (55.7%) | 125 (44.3%) |
| 5 to 9 Year Old | 1,520 (89.8%) | 173 (10.2%) |
| 10 to 14 Year Olds | 1,629 (93.6%) | 112 (6.4%) |
| 15 to 17 Year Olds | 1,368 (95.7%) | 61 (4.3%) |
| 18 to 19 Year Olds | 195 (73.6%) | 70 (26.4%) |
| 20 to 24 Year Olds | 455 (77.2%) | 134 (22.8%) |
| 25 to 34 Year Olds | 318 (87.8%) | 44 (12.1%) |
| 35 Years and over | 316 (71.0%) | 129 (29.0%) |
| Total | 5,955 (87.5%) | 851 (12.5%) |
Educational Attainment by Field of Study in Batavia
Business (1,949 | 18.9%), education (1,262 | 12.2%), science & technology (1,140 | 11.1%), engineering (762 | 7.4%), and communications (629 | 6.1%) are the most common fields of study among 10,313 individuals in Batavia who have obtained a bachelor's degree or higher.
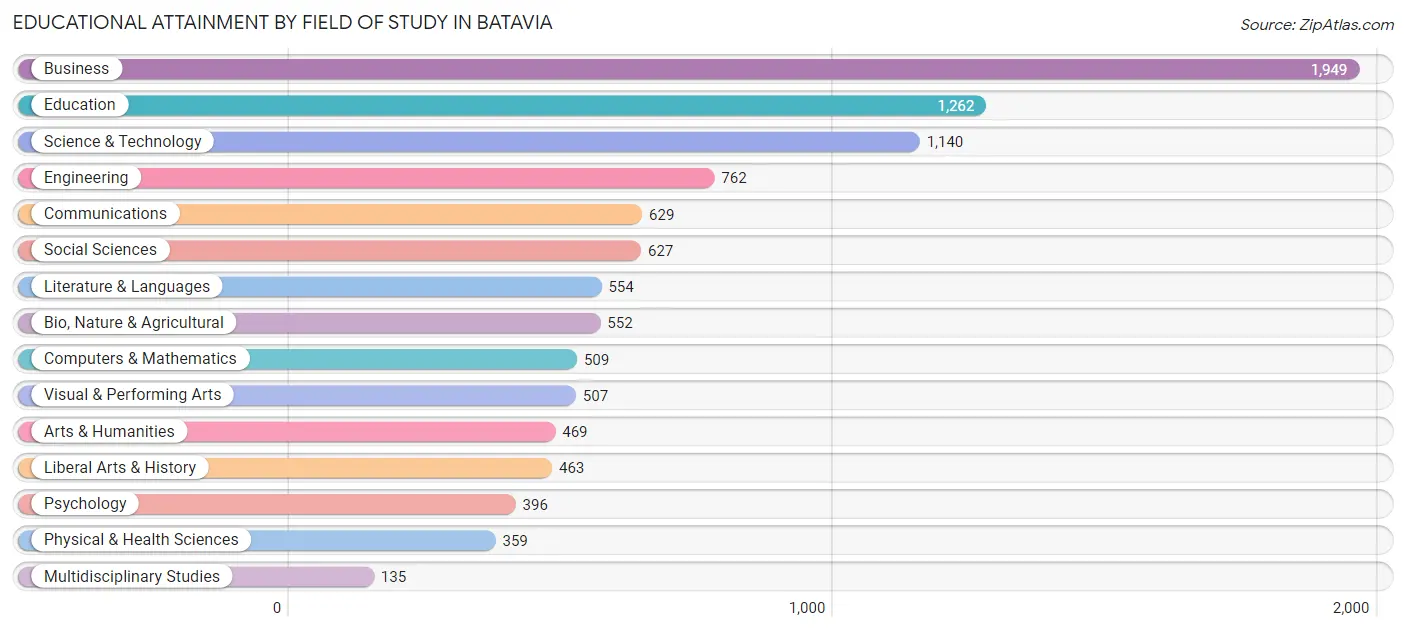
| Field of Study | # Graduates | % Graduates |
| Computers & Mathematics | 509 | 4.9% |
| Bio, Nature & Agricultural | 552 | 5.3% |
| Physical & Health Sciences | 359 | 3.5% |
| Psychology | 396 | 3.8% |
| Social Sciences | 627 | 6.1% |
| Engineering | 762 | 7.4% |
| Multidisciplinary Studies | 135 | 1.3% |
| Science & Technology | 1,140 | 11.1% |
| Business | 1,949 | 18.9% |
| Education | 1,262 | 12.2% |
| Literature & Languages | 554 | 5.4% |
| Liberal Arts & History | 463 | 4.5% |
| Visual & Performing Arts | 507 | 4.9% |
| Communications | 629 | 6.1% |
| Arts & Humanities | 469 | 4.5% |
| Total | 10,313 | 100.0% |
Transportation & Commute in Batavia
Vehicle Availability by Sex in Batavia
The most prevalent vehicle ownership categories in Batavia are males with 2 vehicles (3,268, accounting for 43.9%) and females with 2 vehicles (2,562, making up 52.5%).
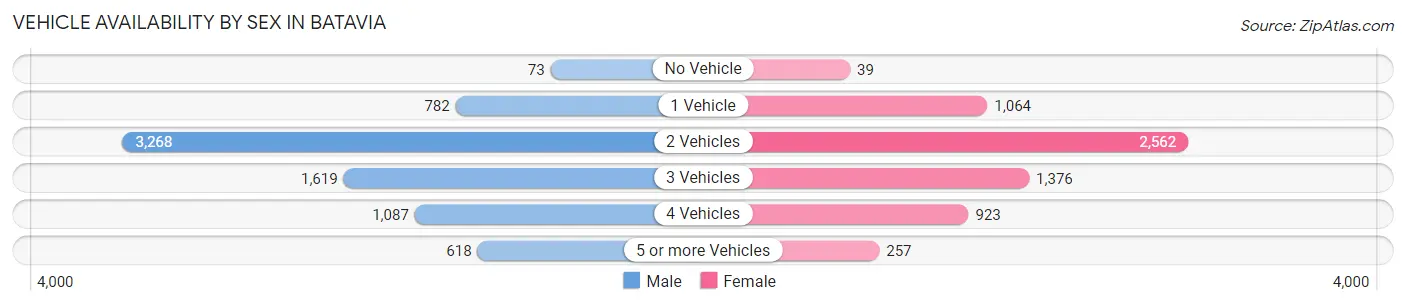
| Vehicles Available | Male | Female |
| No Vehicle | 73 (1.0%) | 39 (0.6%) |
| 1 Vehicle | 782 (10.5%) | 1,064 (17.1%) |
| 2 Vehicles | 3,268 (43.9%) | 2,562 (41.2%) |
| 3 Vehicles | 1,619 (21.7%) | 1,376 (22.1%) |
| 4 Vehicles | 1,087 (14.6%) | 923 (14.8%) |
| 5 or more Vehicles | 618 (8.3%) | 257 (4.1%) |
| Total | 7,447 (100.0%) | 6,221 (100.0%) |
Commute Time in Batavia
The most frequently occuring commute durations in Batavia are 15 to 19 minutes (1,515 commuters, 13.9%), 30 to 34 minutes (1,378 commuters, 12.7%), and 10 to 14 minutes (1,336 commuters, 12.3%).
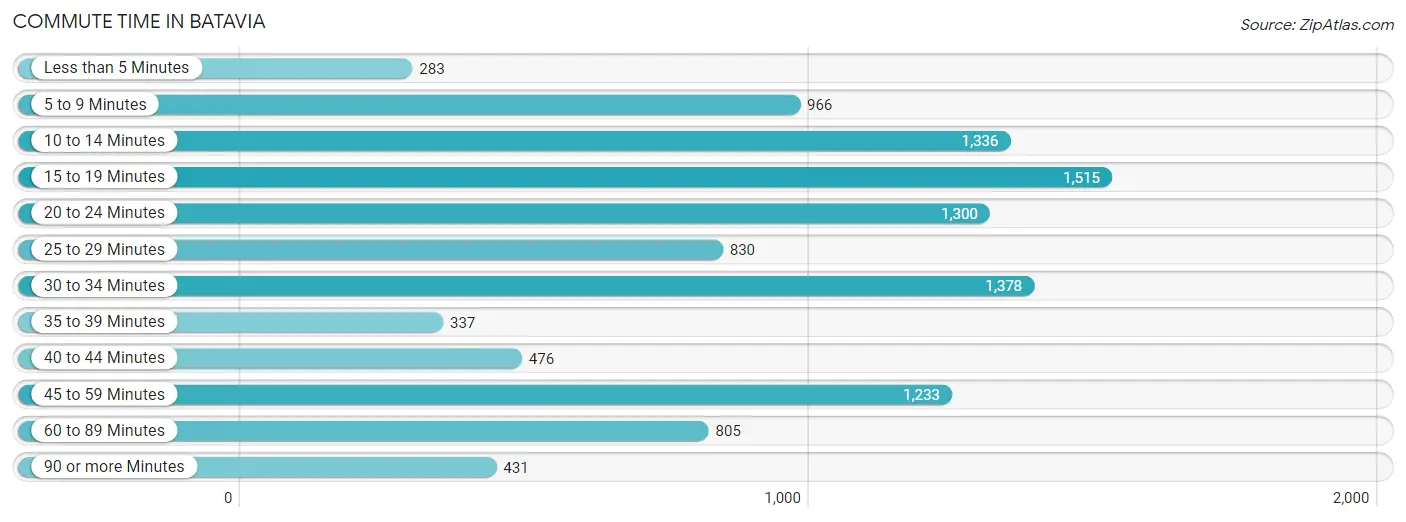
| Commute Time | # Commuters | % Commuters |
| Less than 5 Minutes | 283 | 2.6% |
| 5 to 9 Minutes | 966 | 8.9% |
| 10 to 14 Minutes | 1,336 | 12.3% |
| 15 to 19 Minutes | 1,515 | 13.9% |
| 20 to 24 Minutes | 1,300 | 11.9% |
| 25 to 29 Minutes | 830 | 7.6% |
| 30 to 34 Minutes | 1,378 | 12.7% |
| 35 to 39 Minutes | 337 | 3.1% |
| 40 to 44 Minutes | 476 | 4.4% |
| 45 to 59 Minutes | 1,233 | 11.3% |
| 60 to 89 Minutes | 805 | 7.4% |
| 90 or more Minutes | 431 | 4.0% |
Commute Time by Sex in Batavia
The most common commute times in Batavia are 45 to 59 minutes (909 commuters, 15.4%) for males and 15 to 19 minutes (780 commuters, 15.7%) for females.
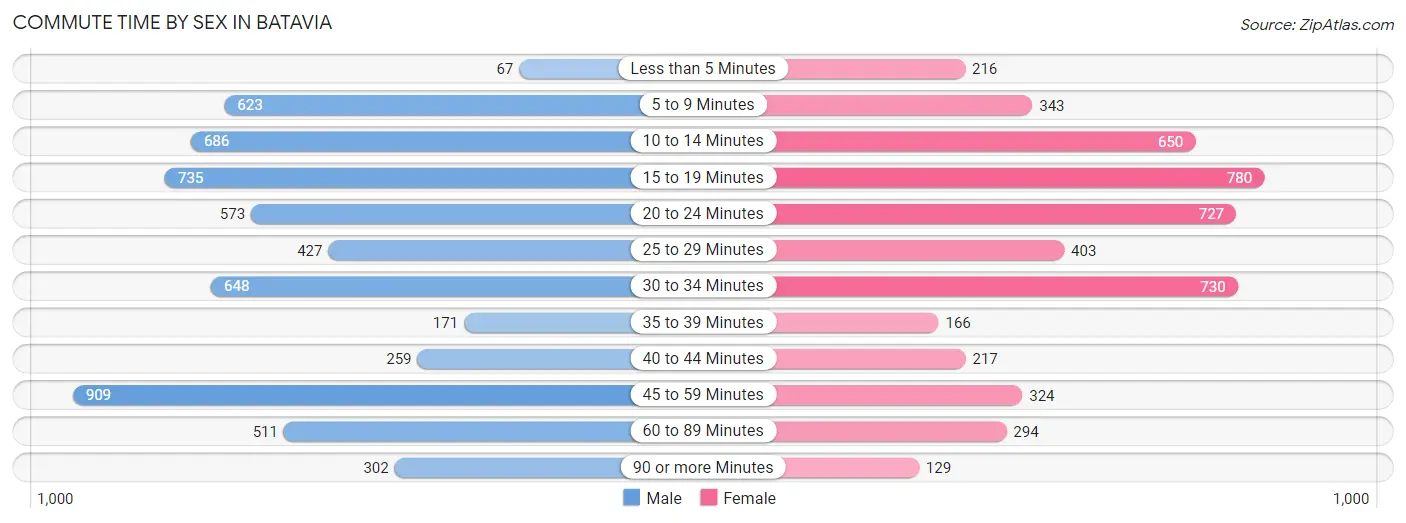
| Commute Time | Male | Female |
| Less than 5 Minutes | 67 (1.1%) | 216 (4.3%) |
| 5 to 9 Minutes | 623 (10.5%) | 343 (6.9%) |
| 10 to 14 Minutes | 686 (11.6%) | 650 (13.1%) |
| 15 to 19 Minutes | 735 (12.4%) | 780 (15.7%) |
| 20 to 24 Minutes | 573 (9.7%) | 727 (14.6%) |
| 25 to 29 Minutes | 427 (7.2%) | 403 (8.1%) |
| 30 to 34 Minutes | 648 (11.0%) | 730 (14.7%) |
| 35 to 39 Minutes | 171 (2.9%) | 166 (3.3%) |
| 40 to 44 Minutes | 259 (4.4%) | 217 (4.4%) |
| 45 to 59 Minutes | 909 (15.4%) | 324 (6.5%) |
| 60 to 89 Minutes | 511 (8.6%) | 294 (5.9%) |
| 90 or more Minutes | 302 (5.1%) | 129 (2.6%) |
Time of Departure to Work by Sex in Batavia
The most frequent times of departure to work in Batavia are 7:00 AM to 7:29 AM (905, 15.3%) for males and 7:30 AM to 7:59 AM (916, 18.4%) for females.
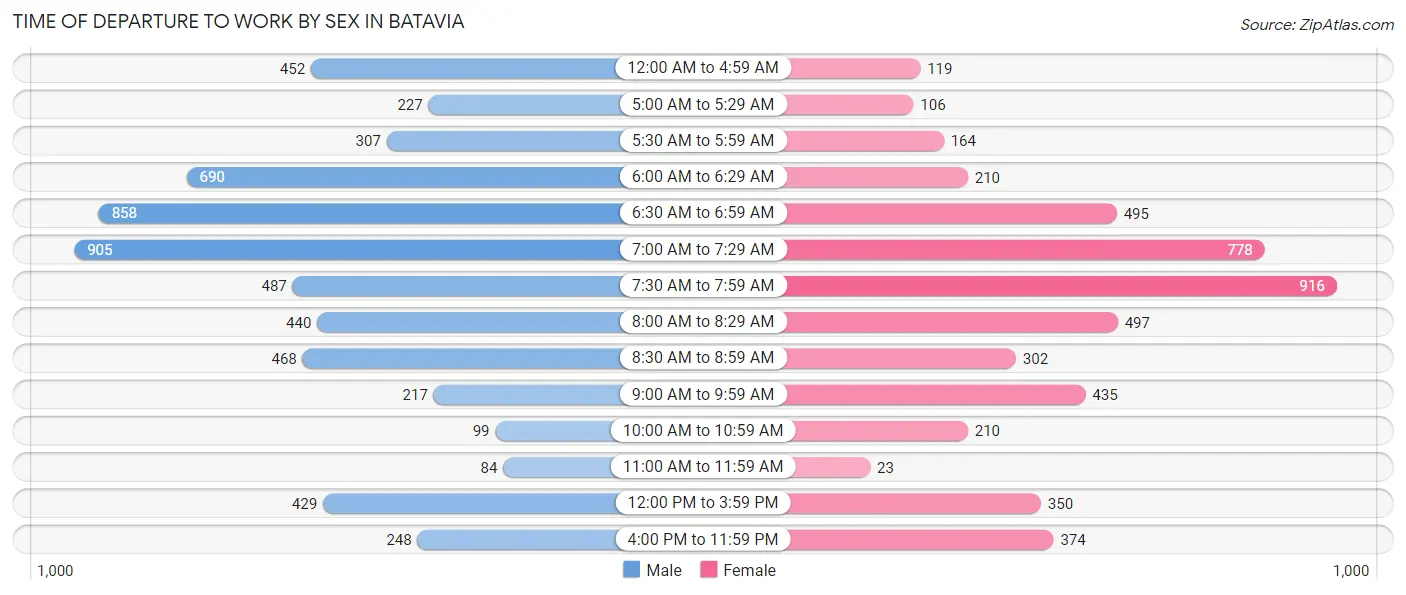
| Time of Departure | Male | Female |
| 12:00 AM to 4:59 AM | 452 (7.6%) | 119 (2.4%) |
| 5:00 AM to 5:29 AM | 227 (3.8%) | 106 (2.1%) |
| 5:30 AM to 5:59 AM | 307 (5.2%) | 164 (3.3%) |
| 6:00 AM to 6:29 AM | 690 (11.7%) | 210 (4.2%) |
| 6:30 AM to 6:59 AM | 858 (14.5%) | 495 (9.9%) |
| 7:00 AM to 7:29 AM | 905 (15.3%) | 778 (15.6%) |
| 7:30 AM to 7:59 AM | 487 (8.2%) | 916 (18.4%) |
| 8:00 AM to 8:29 AM | 440 (7.4%) | 497 (10.0%) |
| 8:30 AM to 8:59 AM | 468 (7.9%) | 302 (6.1%) |
| 9:00 AM to 9:59 AM | 217 (3.7%) | 435 (8.7%) |
| 10:00 AM to 10:59 AM | 99 (1.7%) | 210 (4.2%) |
| 11:00 AM to 11:59 AM | 84 (1.4%) | 23 (0.5%) |
| 12:00 PM to 3:59 PM | 429 (7.3%) | 350 (7.0%) |
| 4:00 PM to 11:59 PM | 248 (4.2%) | 374 (7.5%) |
| Total | 5,911 (100.0%) | 4,979 (100.0%) |
Housing Occupancy in Batavia
Occupancy by Ownership in Batavia
Of the total 9,814 dwellings in Batavia, owner-occupied units account for 7,526 (76.7%), while renter-occupied units make up 2,288 (23.3%).
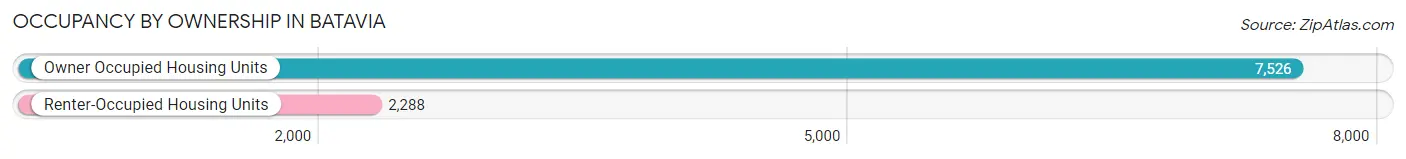
| Occupancy | # Housing Units | % Housing Units |
| Owner Occupied Housing Units | 7,526 | 76.7% |
| Renter-Occupied Housing Units | 2,288 | 23.3% |
| Total Occupied Housing Units | 9,814 | 100.0% |
Occupancy by Household Size in Batavia
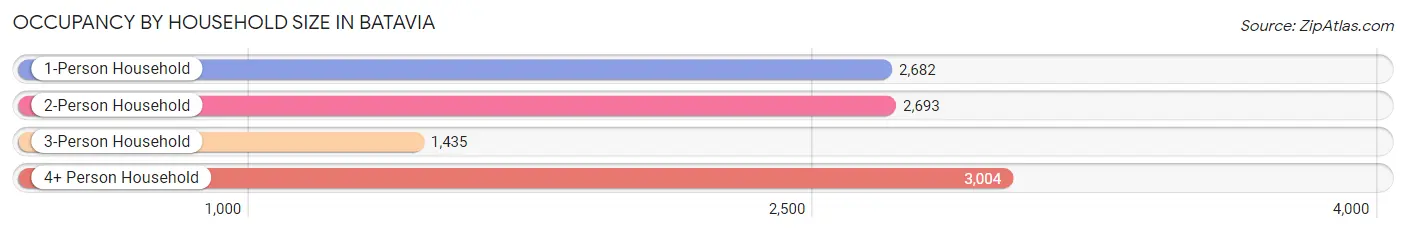
| Household Size | # Housing Units | % Housing Units |
| 1-Person Household | 2,682 | 27.3% |
| 2-Person Household | 2,693 | 27.4% |
| 3-Person Household | 1,435 | 14.6% |
| 4+ Person Household | 3,004 | 30.6% |
| Total Housing Units | 9,814 | 100.0% |
Occupancy by Ownership by Household Size in Batavia
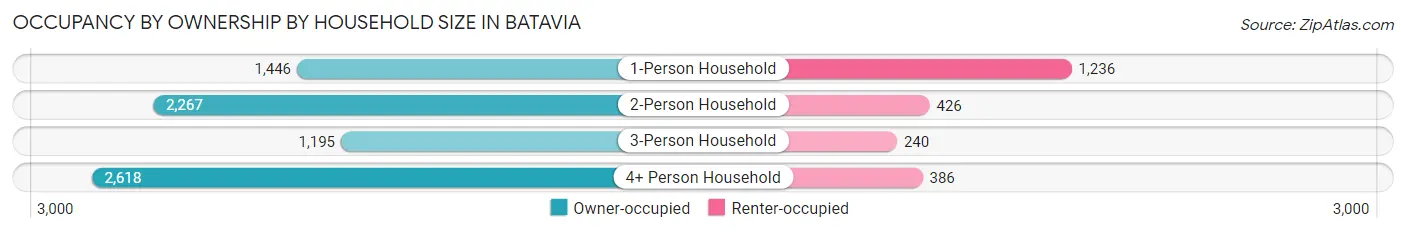
| Household Size | Owner-occupied | Renter-occupied |
| 1-Person Household | 1,446 (53.9%) | 1,236 (46.1%) |
| 2-Person Household | 2,267 (84.2%) | 426 (15.8%) |
| 3-Person Household | 1,195 (83.3%) | 240 (16.7%) |
| 4+ Person Household | 2,618 (87.2%) | 386 (12.9%) |
| Total Housing Units | 7,526 (76.7%) | 2,288 (23.3%) |
Occupancy by Educational Attainment in Batavia
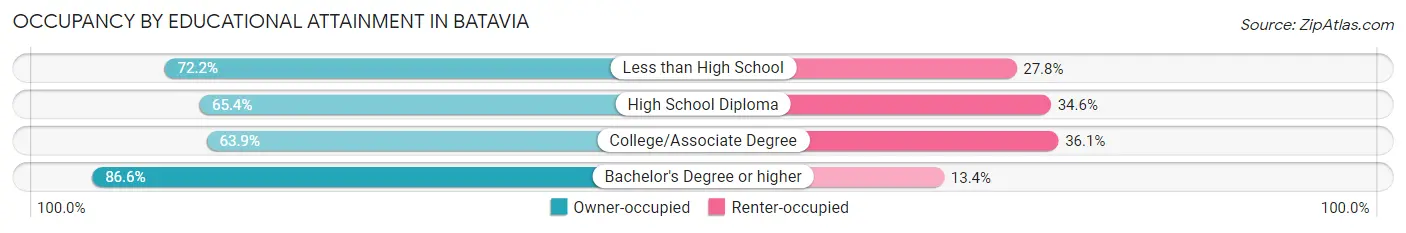
| Household Size | Owner-occupied | Renter-occupied |
| Less than High School | 195 (72.2%) | 75 (27.8%) |
| High School Diploma | 903 (65.4%) | 478 (34.6%) |
| College/Associate Degree | 1,803 (63.9%) | 1,018 (36.1%) |
| Bachelor's Degree or higher | 4,625 (86.6%) | 717 (13.4%) |
Occupancy by Age of Householder in Batavia
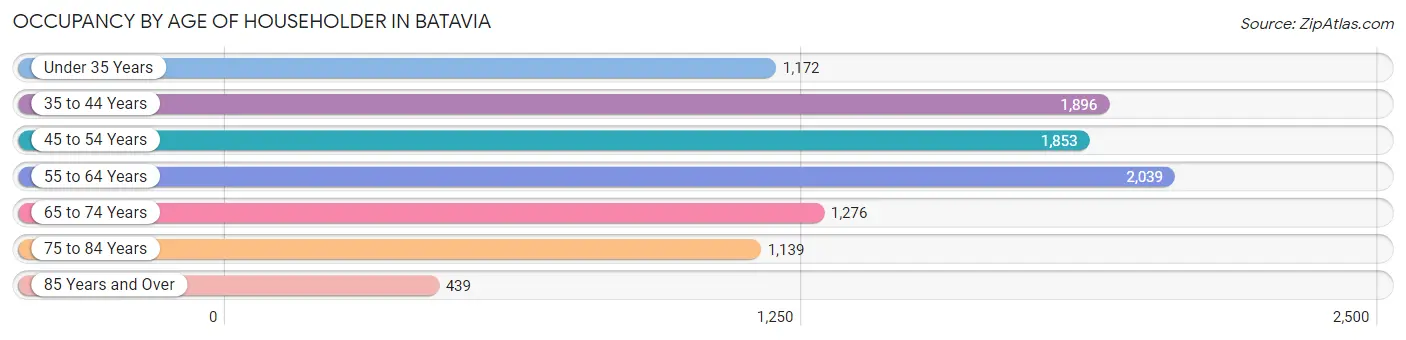
| Age Bracket | # Households | % Households |
| Under 35 Years | 1,172 | 11.9% |
| 35 to 44 Years | 1,896 | 19.3% |
| 45 to 54 Years | 1,853 | 18.9% |
| 55 to 64 Years | 2,039 | 20.8% |
| 65 to 74 Years | 1,276 | 13.0% |
| 75 to 84 Years | 1,139 | 11.6% |
| 85 Years and Over | 439 | 4.5% |
| Total | 9,814 | 100.0% |
Housing Finances in Batavia
Median Income by Occupancy in Batavia
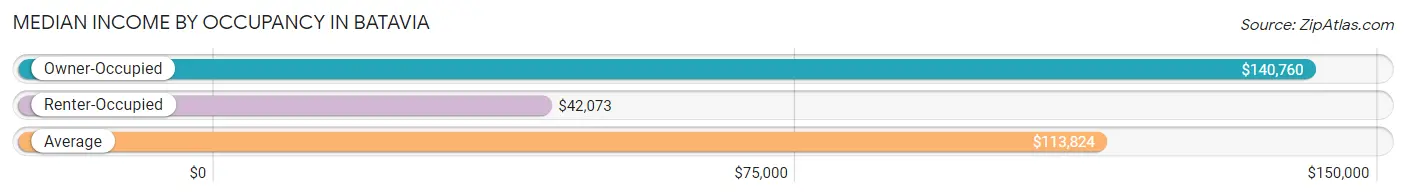
| Occupancy Type | # Households | Median Income |
| Owner-Occupied | 7,526 (76.7%) | $140,760 |
| Renter-Occupied | 2,288 (23.3%) | $42,073 |
| Average | 9,814 (100.0%) | $113,824 |
Occupancy by Householder Income Bracket in Batavia
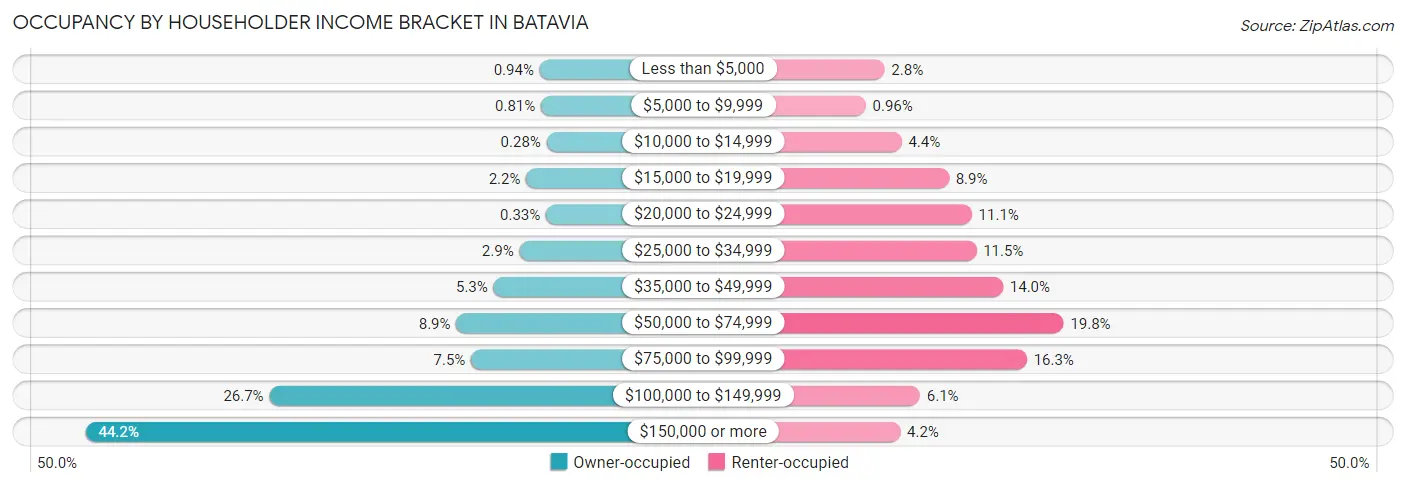
| Income Bracket | Owner-occupied | Renter-occupied |
| Less than $5,000 | 71 (0.9%) | 63 (2.8%) |
| $5,000 to $9,999 | 61 (0.8%) | 22 (1.0%) |
| $10,000 to $14,999 | 21 (0.3%) | 100 (4.4%) |
| $15,000 to $19,999 | 167 (2.2%) | 203 (8.9%) |
| $20,000 to $24,999 | 25 (0.3%) | 253 (11.1%) |
| $25,000 to $34,999 | 216 (2.9%) | 263 (11.5%) |
| $35,000 to $49,999 | 401 (5.3%) | 321 (14.0%) |
| $50,000 to $74,999 | 668 (8.9%) | 453 (19.8%) |
| $75,000 to $99,999 | 562 (7.5%) | 373 (16.3%) |
| $100,000 to $149,999 | 2,008 (26.7%) | 140 (6.1%) |
| $150,000 or more | 3,326 (44.2%) | 97 (4.2%) |
| Total | 7,526 (100.0%) | 2,288 (100.0%) |
Monthly Housing Cost Tiers in Batavia
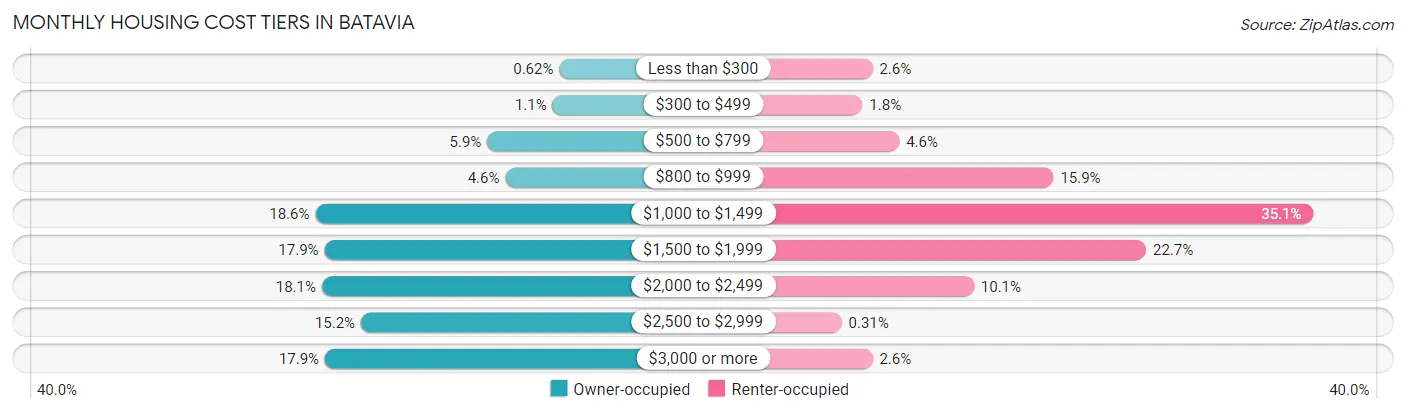
| Monthly Cost | Owner-occupied | Renter-occupied |
| Less than $300 | 47 (0.6%) | 59 (2.6%) |
| $300 to $499 | 84 (1.1%) | 42 (1.8%) |
| $500 to $799 | 446 (5.9%) | 104 (4.5%) |
| $800 to $999 | 346 (4.6%) | 364 (15.9%) |
| $1,000 to $1,499 | 1,399 (18.6%) | 802 (35.0%) |
| $1,500 to $1,999 | 1,349 (17.9%) | 520 (22.7%) |
| $2,000 to $2,499 | 1,363 (18.1%) | 230 (10.1%) |
| $2,500 to $2,999 | 1,146 (15.2%) | 7 (0.3%) |
| $3,000 or more | 1,346 (17.9%) | 59 (2.6%) |
| Total | 7,526 (100.0%) | 2,288 (100.0%) |
Physical Housing Characteristics in Batavia
Housing Structures in Batavia
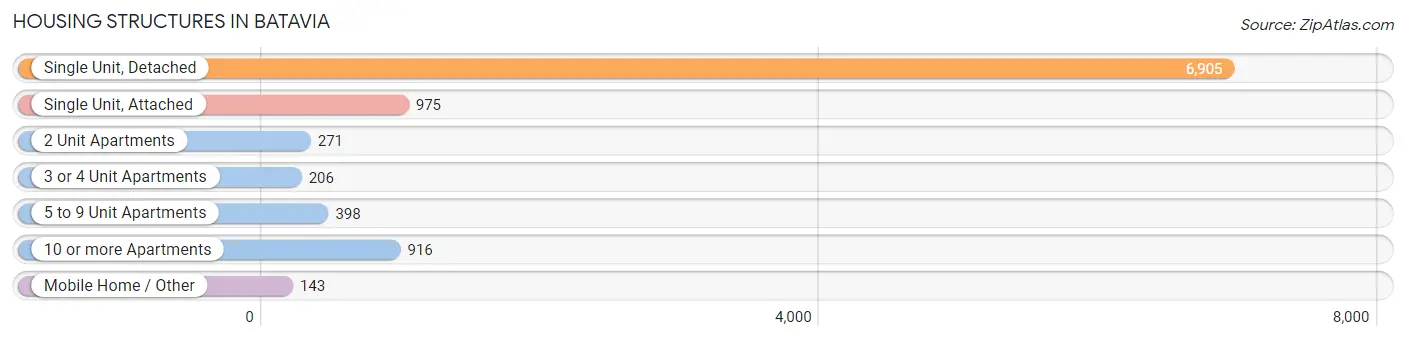
| Structure Type | # Housing Units | % Housing Units |
| Single Unit, Detached | 6,905 | 70.4% |
| Single Unit, Attached | 975 | 9.9% |
| 2 Unit Apartments | 271 | 2.8% |
| 3 or 4 Unit Apartments | 206 | 2.1% |
| 5 to 9 Unit Apartments | 398 | 4.1% |
| 10 or more Apartments | 916 | 9.3% |
| Mobile Home / Other | 143 | 1.5% |
| Total | 9,814 | 100.0% |
Housing Structures by Occupancy in Batavia
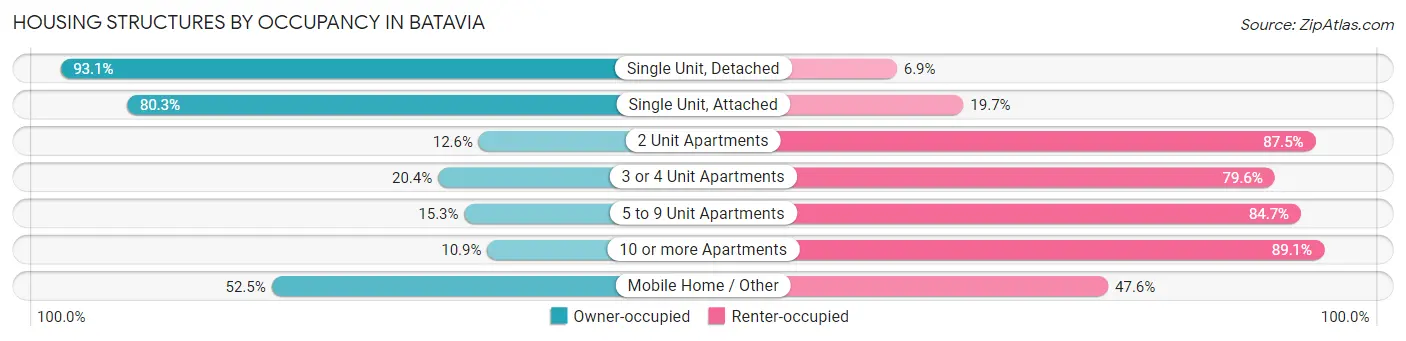
| Structure Type | Owner-occupied | Renter-occupied |
| Single Unit, Detached | 6,431 (93.1%) | 474 (6.9%) |
| Single Unit, Attached | 783 (80.3%) | 192 (19.7%) |
| 2 Unit Apartments | 34 (12.6%) | 237 (87.5%) |
| 3 or 4 Unit Apartments | 42 (20.4%) | 164 (79.6%) |
| 5 to 9 Unit Apartments | 61 (15.3%) | 337 (84.7%) |
| 10 or more Apartments | 100 (10.9%) | 816 (89.1%) |
| Mobile Home / Other | 75 (52.4%) | 68 (47.5%) |
| Total | 7,526 (76.7%) | 2,288 (23.3%) |
Housing Structures by Number of Rooms in Batavia
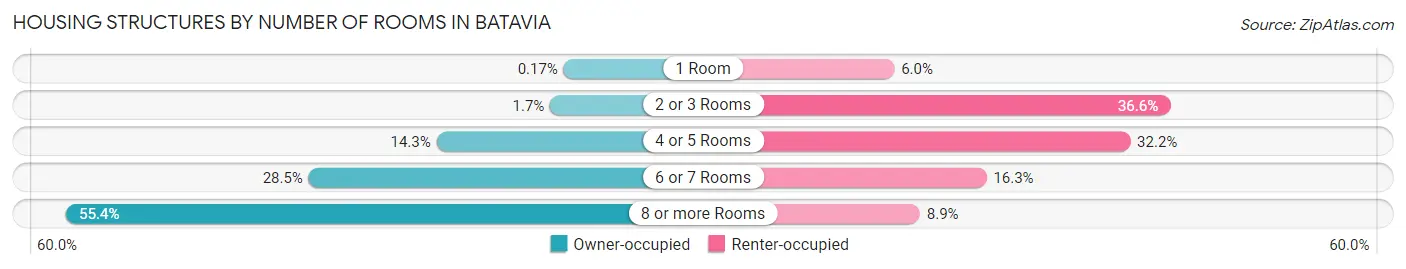
| Number of Rooms | Owner-occupied | Renter-occupied |
| 1 Room | 13 (0.2%) | 138 (6.0%) |
| 2 or 3 Rooms | 126 (1.7%) | 838 (36.6%) |
| 4 or 5 Rooms | 1,075 (14.3%) | 737 (32.2%) |
| 6 or 7 Rooms | 2,143 (28.5%) | 372 (16.3%) |
| 8 or more Rooms | 4,169 (55.4%) | 203 (8.9%) |
| Total | 7,526 (100.0%) | 2,288 (100.0%) |
Housing Structure by Heating Type in Batavia
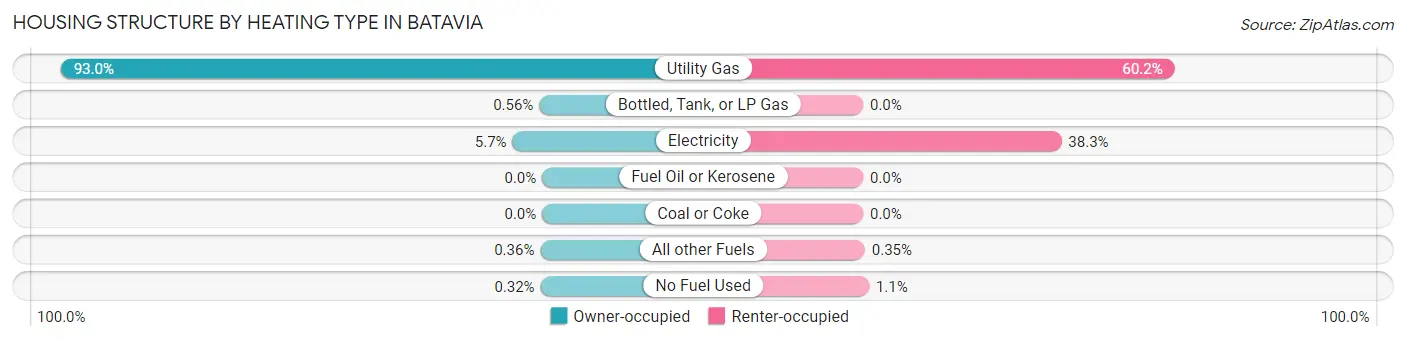
| Heating Type | Owner-occupied | Renter-occupied |
| Utility Gas | 7,001 (93.0%) | 1,377 (60.2%) |
| Bottled, Tank, or LP Gas | 42 (0.6%) | 0 (0.0%) |
| Electricity | 432 (5.7%) | 877 (38.3%) |
| Fuel Oil or Kerosene | 0 (0.0%) | 0 (0.0%) |
| Coal or Coke | 0 (0.0%) | 0 (0.0%) |
| All other Fuels | 27 (0.4%) | 8 (0.4%) |
| No Fuel Used | 24 (0.3%) | 26 (1.1%) |
| Total | 7,526 (100.0%) | 2,288 (100.0%) |
Household Vehicle Usage in Batavia
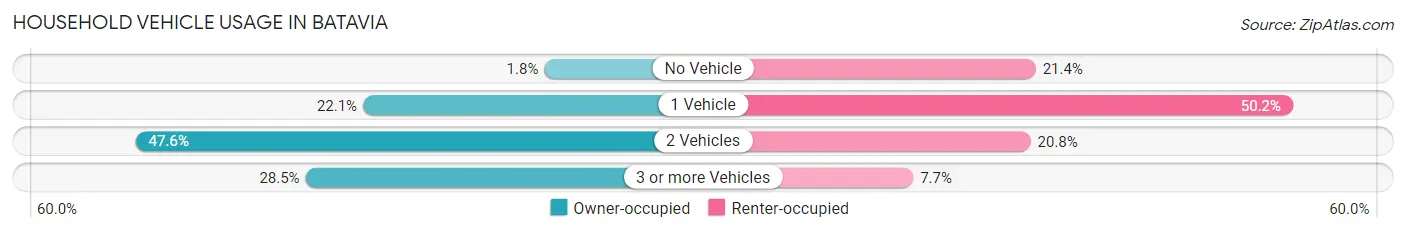
| Vehicles per Household | Owner-occupied | Renter-occupied |
| No Vehicle | 135 (1.8%) | 489 (21.4%) |
| 1 Vehicle | 1,663 (22.1%) | 1,148 (50.2%) |
| 2 Vehicles | 3,580 (47.6%) | 476 (20.8%) |
| 3 or more Vehicles | 2,148 (28.5%) | 175 (7.6%) |
| Total | 7,526 (100.0%) | 2,288 (100.0%) |
Real Estate & Mortgages in Batavia
Real Estate and Mortgage Overview in Batavia
| Characteristic | Without Mortgage | With Mortgage |
| Housing Units | 1,960 | 5,566 |
| Median Property Value | $322,700 | $356,600 |
| Median Household Income | $88,306 | $2,838 |
| Monthly Housing Costs | $1,061 | $1,338 |
| Real Estate Taxes | $8,133 | $7 |
Property Value by Mortgage Status in Batavia
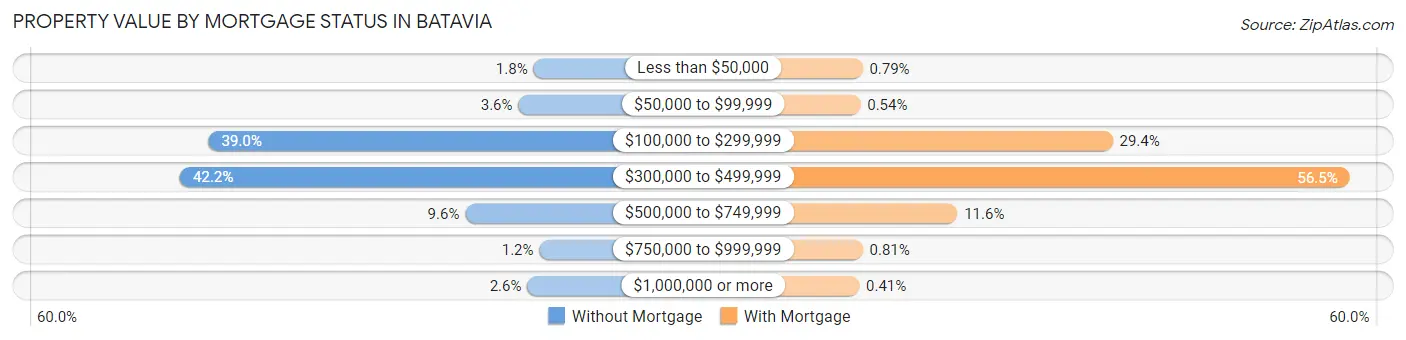
| Property Value | Without Mortgage | With Mortgage |
| Less than $50,000 | 36 (1.8%) | 44 (0.8%) |
| $50,000 to $99,999 | 70 (3.6%) | 30 (0.5%) |
| $100,000 to $299,999 | 764 (39.0%) | 1,635 (29.4%) |
| $300,000 to $499,999 | 828 (42.2%) | 3,142 (56.5%) |
| $500,000 to $749,999 | 189 (9.6%) | 647 (11.6%) |
| $750,000 to $999,999 | 23 (1.2%) | 45 (0.8%) |
| $1,000,000 or more | 50 (2.5%) | 23 (0.4%) |
| Total | 1,960 (100.0%) | 5,566 (100.0%) |
Household Income by Mortgage Status in Batavia
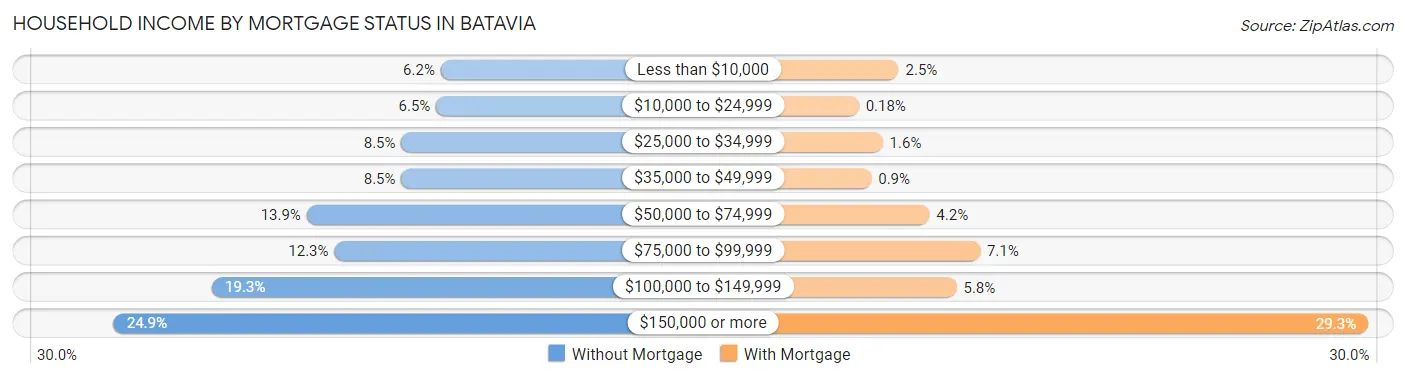
| Household Income | Without Mortgage | With Mortgage |
| Less than $10,000 | 122 (6.2%) | 137 (2.5%) |
| $10,000 to $24,999 | 127 (6.5%) | 10 (0.2%) |
| $25,000 to $34,999 | 166 (8.5%) | 86 (1.5%) |
| $35,000 to $49,999 | 166 (8.5%) | 50 (0.9%) |
| $50,000 to $74,999 | 272 (13.9%) | 235 (4.2%) |
| $75,000 to $99,999 | 241 (12.3%) | 396 (7.1%) |
| $100,000 to $149,999 | 378 (19.3%) | 321 (5.8%) |
| $150,000 or more | 488 (24.9%) | 1,630 (29.3%) |
| Total | 1,960 (100.0%) | 5,566 (100.0%) |
Property Value to Household Income Ratio in Batavia
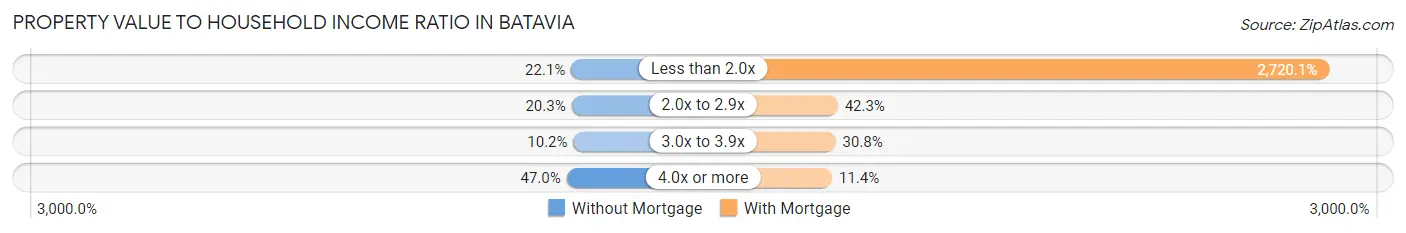
| Value-to-Income Ratio | Without Mortgage | With Mortgage |
| Less than 2.0x | 434 (22.1%) | 151,403 (2,720.1%) |
| 2.0x to 2.9x | 398 (20.3%) | 2,354 (42.3%) |
| 3.0x to 3.9x | 199 (10.2%) | 1,713 (30.8%) |
| 4.0x or more | 922 (47.0%) | 635 (11.4%) |
| Total | 1,960 (100.0%) | 5,566 (100.0%) |
Real Estate Taxes by Mortgage Status in Batavia
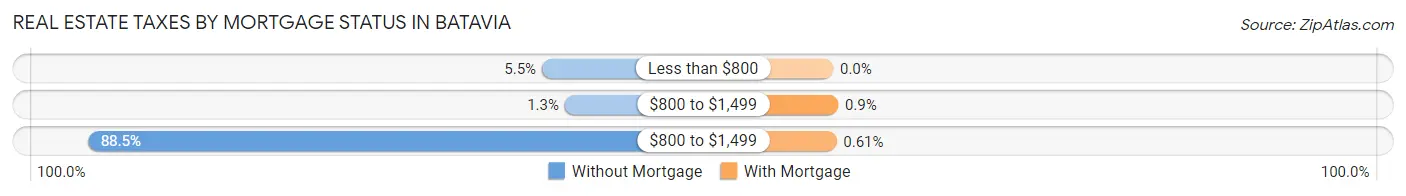
| Property Taxes | Without Mortgage | With Mortgage |
| Less than $800 | 108 (5.5%) | 0 (0.0%) |
| $800 to $1,499 | 26 (1.3%) | 50 (0.9%) |
| $800 to $1,499 | 1,734 (88.5%) | 34 (0.6%) |
| Total | 1,960 (100.0%) | 5,566 (100.0%) |
Health & Disability in Batavia
Health Insurance Coverage by Age in Batavia
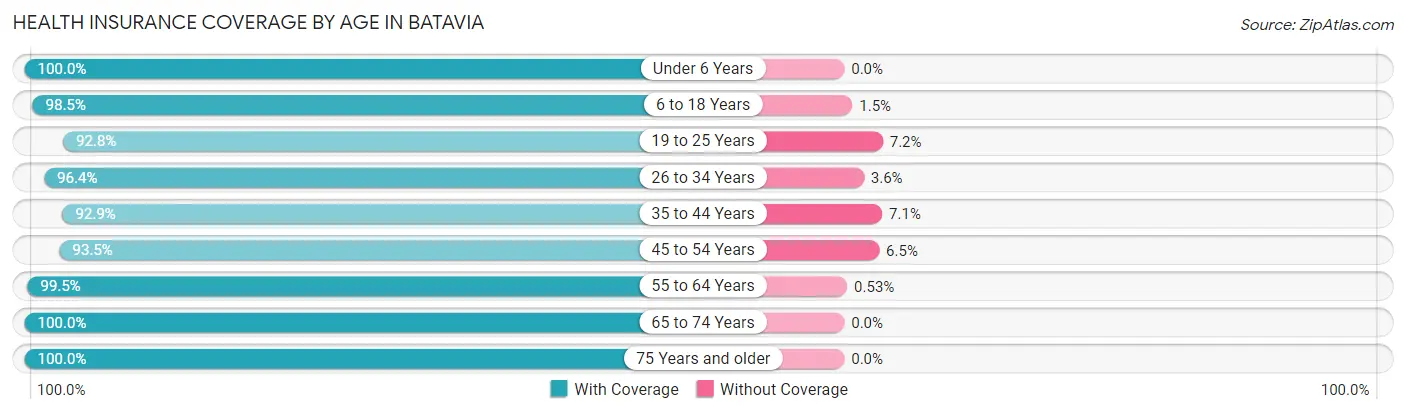
| Age Bracket | With Coverage | Without Coverage |
| Under 6 Years | 2,377 (100.0%) | 0 (0.0%) |
| 6 to 18 Years | 4,735 (98.5%) | 72 (1.5%) |
| 19 to 25 Years | 1,694 (92.8%) | 131 (7.2%) |
| 26 to 34 Years | 2,649 (96.4%) | 100 (3.6%) |
| 35 to 44 Years | 3,316 (92.9%) | 252 (7.1%) |
| 45 to 54 Years | 3,336 (93.5%) | 232 (6.5%) |
| 55 to 64 Years | 3,176 (99.5%) | 17 (0.5%) |
| 65 to 74 Years | 2,162 (100.0%) | 0 (0.0%) |
| 75 Years and older | 2,028 (100.0%) | 0 (0.0%) |
| Total | 25,473 (96.9%) | 804 (3.1%) |
Health Insurance Coverage by Citizenship Status in Batavia
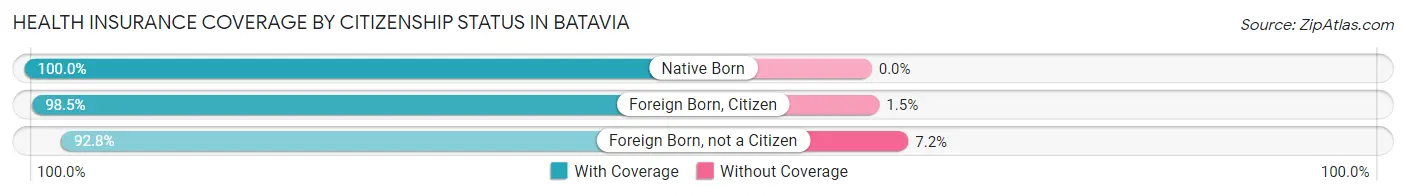
| Citizenship Status | With Coverage | Without Coverage |
| Native Born | 2,377 (100.0%) | 0 (0.0%) |
| Foreign Born, Citizen | 4,735 (98.5%) | 72 (1.5%) |
| Foreign Born, not a Citizen | 1,694 (92.8%) | 131 (7.2%) |
Health Insurance Coverage by Household Income in Batavia
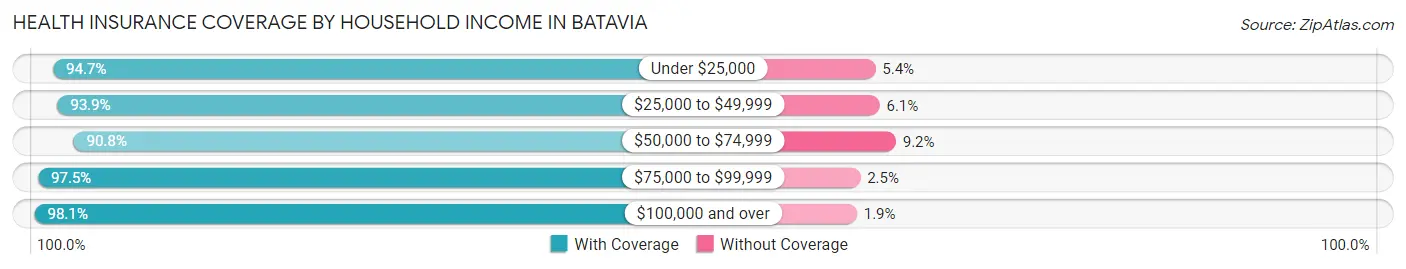
| Household Income | With Coverage | Without Coverage |
| Under $25,000 | 1,344 (94.7%) | 76 (5.3%) |
| $25,000 to $49,999 | 1,989 (93.9%) | 130 (6.1%) |
| $50,000 to $74,999 | 1,960 (90.8%) | 198 (9.2%) |
| $75,000 to $99,999 | 2,211 (97.5%) | 57 (2.5%) |
| $100,000 and over | 17,962 (98.1%) | 343 (1.9%) |
Public vs Private Health Insurance Coverage by Age in Batavia
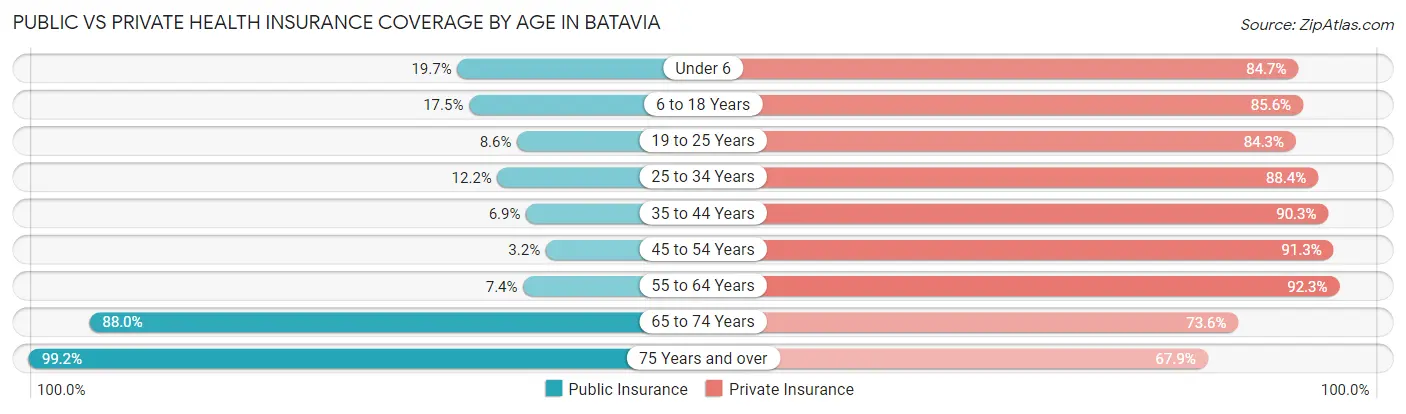
| Age Bracket | Public Insurance | Private Insurance |
| Under 6 | 467 (19.7%) | 2,014 (84.7%) |
| 6 to 18 Years | 840 (17.5%) | 4,114 (85.6%) |
| 19 to 25 Years | 156 (8.6%) | 1,538 (84.3%) |
| 25 to 34 Years | 335 (12.2%) | 2,430 (88.4%) |
| 35 to 44 Years | 245 (6.9%) | 3,222 (90.3%) |
| 45 to 54 Years | 115 (3.2%) | 3,257 (91.3%) |
| 55 to 64 Years | 237 (7.4%) | 2,948 (92.3%) |
| 65 to 74 Years | 1,902 (88.0%) | 1,591 (73.6%) |
| 75 Years and over | 2,012 (99.2%) | 1,377 (67.9%) |
| Total | 6,309 (24.0%) | 22,491 (85.6%) |
Disability Status by Sex by Age in Batavia
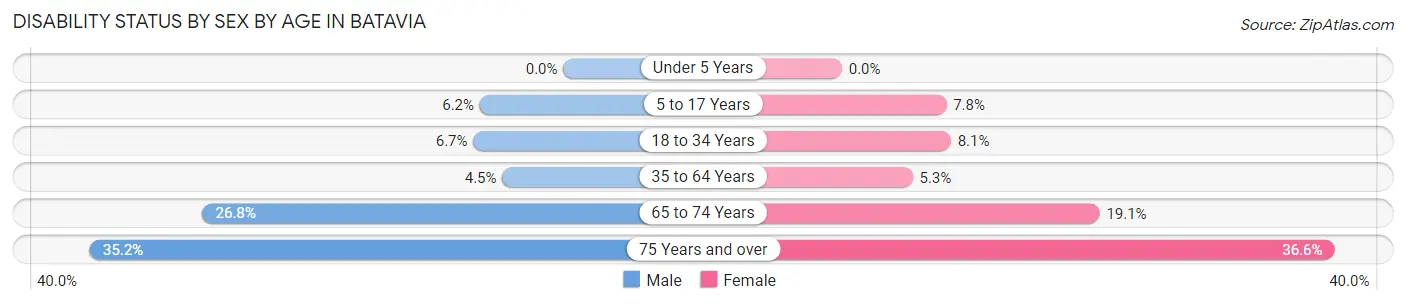
| Age Bracket | Male | Female |
| Under 5 Years | 0 (0.0%) | 0 (0.0%) |
| 5 to 17 Years | 169 (6.2%) | 178 (7.7%) |
| 18 to 34 Years | 156 (6.7%) | 200 (8.1%) |
| 35 to 64 Years | 237 (4.5%) | 268 (5.2%) |
| 65 to 74 Years | 320 (26.8%) | 185 (19.1%) |
| 75 Years and over | 239 (35.1%) | 493 (36.6%) |
Disability Class by Sex by Age in Batavia
Disability Class: Hearing Difficulty
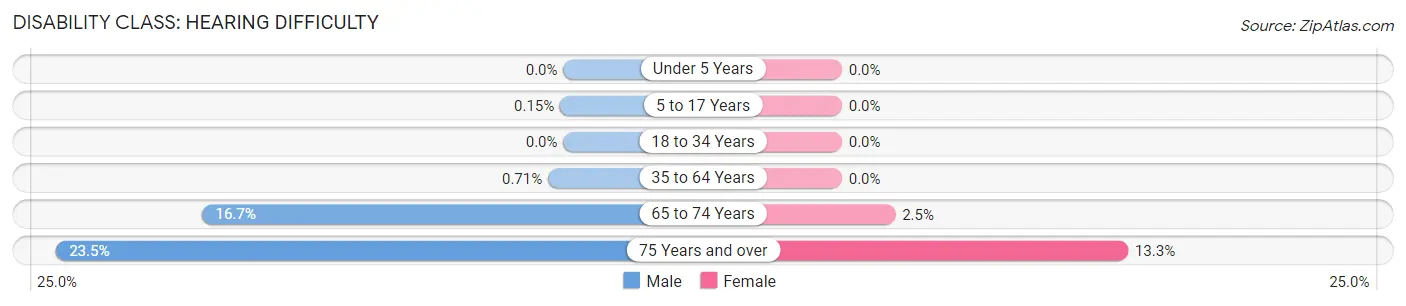
| Age Bracket | Male | Female |
| Under 5 Years | 0 (0.0%) | 0 (0.0%) |
| 5 to 17 Years | 4 (0.2%) | 0 (0.0%) |
| 18 to 34 Years | 0 (0.0%) | 0 (0.0%) |
| 35 to 64 Years | 37 (0.7%) | 0 (0.0%) |
| 65 to 74 Years | 200 (16.7%) | 24 (2.5%) |
| 75 Years and over | 160 (23.5%) | 179 (13.3%) |
Disability Class: Vision Difficulty
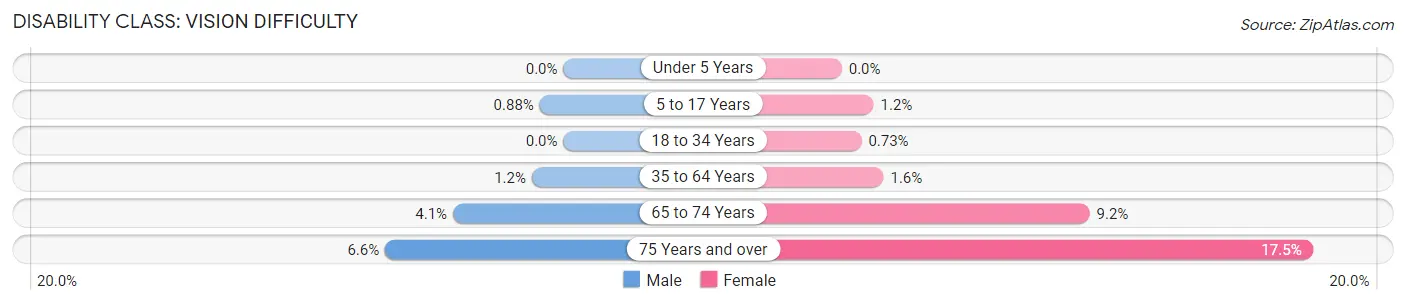
| Age Bracket | Male | Female |
| Under 5 Years | 0 (0.0%) | 0 (0.0%) |
| 5 to 17 Years | 24 (0.9%) | 27 (1.2%) |
| 18 to 34 Years | 0 (0.0%) | 18 (0.7%) |
| 35 to 64 Years | 61 (1.2%) | 79 (1.5%) |
| 65 to 74 Years | 49 (4.1%) | 89 (9.2%) |
| 75 Years and over | 45 (6.6%) | 236 (17.5%) |
Disability Class: Cognitive Difficulty
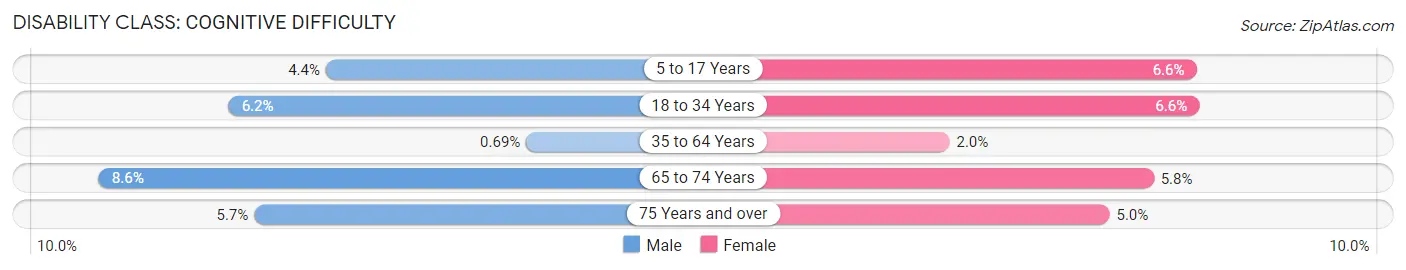
| Age Bracket | Male | Female |
| 5 to 17 Years | 120 (4.4%) | 151 (6.6%) |
| 18 to 34 Years | 145 (6.2%) | 164 (6.6%) |
| 35 to 64 Years | 36 (0.7%) | 102 (2.0%) |
| 65 to 74 Years | 103 (8.6%) | 56 (5.8%) |
| 75 Years and over | 39 (5.7%) | 67 (5.0%) |
Disability Class: Ambulatory Difficulty
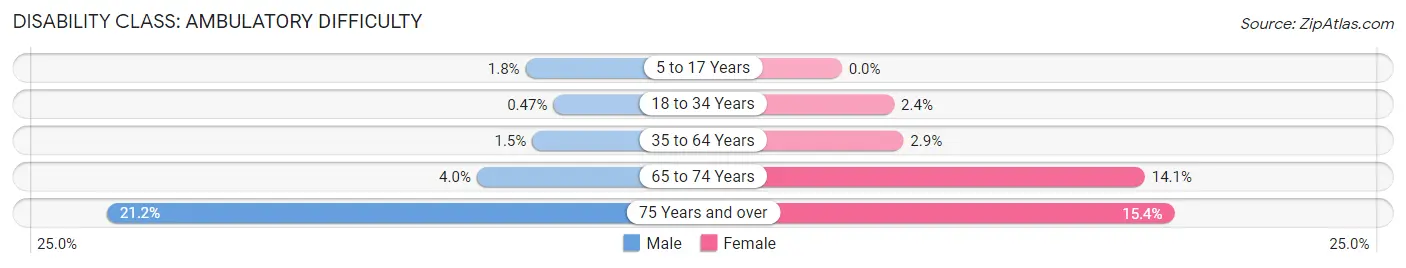
| Age Bracket | Male | Female |
| 5 to 17 Years | 48 (1.8%) | 0 (0.0%) |
| 18 to 34 Years | 11 (0.5%) | 60 (2.4%) |
| 35 to 64 Years | 76 (1.5%) | 146 (2.9%) |
| 65 to 74 Years | 48 (4.0%) | 136 (14.1%) |
| 75 Years and over | 144 (21.2%) | 208 (15.4%) |
Disability Class: Self-Care Difficulty
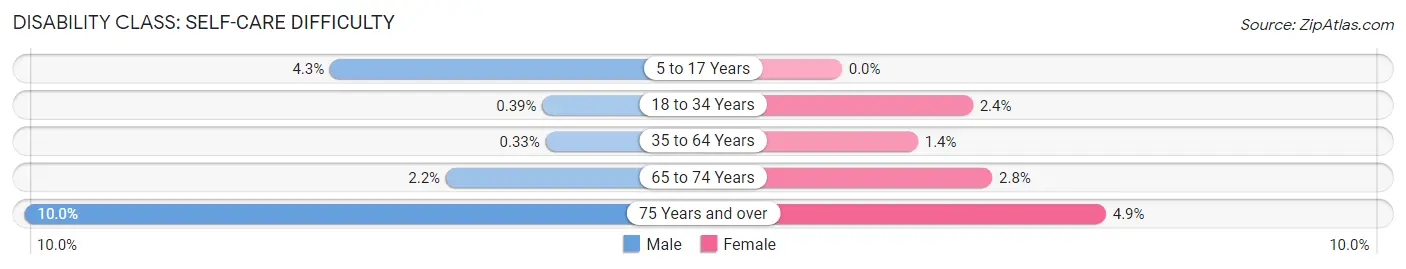
| Age Bracket | Male | Female |
| 5 to 17 Years | 118 (4.3%) | 0 (0.0%) |
| 18 to 34 Years | 9 (0.4%) | 60 (2.4%) |
| 35 to 64 Years | 17 (0.3%) | 72 (1.4%) |
| 65 to 74 Years | 26 (2.2%) | 27 (2.8%) |
| 75 Years and over | 68 (10.0%) | 66 (4.9%) |
Technology Access in Batavia
Computing Device Access in Batavia
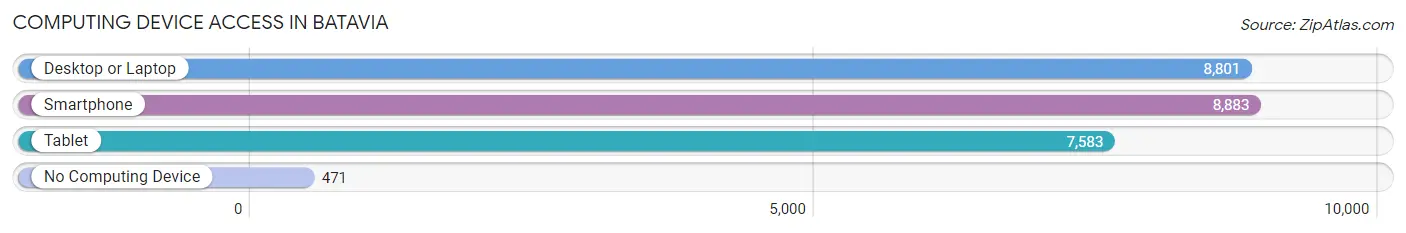
| Device Type | # Households | % Households |
| Desktop or Laptop | 8,801 | 89.7% |
| Smartphone | 8,883 | 90.5% |
| Tablet | 7,583 | 77.3% |
| No Computing Device | 471 | 4.8% |
| Total | 9,814 | 100.0% |
Internet Access in Batavia
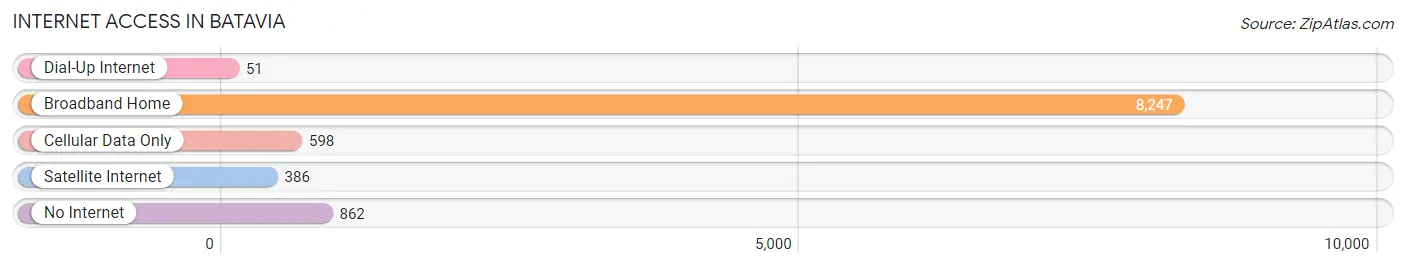
| Internet Type | # Households | % Households |
| Dial-Up Internet | 51 | 0.5% |
| Broadband Home | 8,247 | 84.0% |
| Cellular Data Only | 598 | 6.1% |
| Satellite Internet | 386 | 3.9% |
| No Internet | 862 | 8.8% |
| Total | 9,814 | 100.0% |
Batavia Summary
Batavia, Illinois is a city located in Kane County, Illinois, United States. It is located approximately 40 miles west of Chicago and is part of the Chicago metropolitan area. The population of Batavia was 26,045 at the 2010 census, and the estimated population in 2019 was 28,945.
History
Batavia was first settled in 1833 by Christopher Payne and his family. Payne was a veteran of the War of 1812 and was granted a land patent for the area. The city was named after the city of Batavia in New York, which was the hometown of one of the first settlers.
In 1856, the Chicago, Burlington and Quincy Railroad arrived in Batavia, connecting the city to the rest of the country. This allowed for the growth of the city and the development of industry. In the late 19th century, Batavia became a center for the production of farm equipment, including the first combine harvester.
In the early 20th century, Batavia was a popular destination for Chicagoans looking to escape the city. The city was known for its resorts and recreational activities, including golf, boating, and fishing.
Geography
Batavia is located in Kane County, Illinois, approximately 40 miles west of Chicago. The city is situated on the Fox River, which flows through the city. The city has a total area of 8.3 square miles, of which 8.2 square miles is land and 0.1 square miles is water.
The city is located in the Fox Valley region of Illinois, which is known for its rolling hills and wooded areas. The city is also located near the Fermi National Accelerator Laboratory, which is a particle physics laboratory operated by the United States Department of Energy.
Economy
Batavia's economy is largely based on manufacturing and retail. The city is home to several large manufacturing companies, including Fermilab, a particle physics laboratory operated by the United States Department of Energy, and the Batavia Manufacturing Company, which produces farm equipment.
The city is also home to several retail stores, including Walmart, Target, and Kohl's. The city is also home to several restaurants, including the popular Batavia Bistro.
Demographics
As of the 2010 census, the population of Batavia was 26,045. The racial makeup of the city was 87.3% White, 5.3% African American, 0.3% Native American, 2.2% Asian, 0.1% Pacific Islander, 2.7% from other races, and 2.2% from two or more races. Hispanic or Latino of any race were 8.2% of the population.
The median income for a household in Batavia was $68,945, and the median income for a family was $77,945. The per capita income for the city was $30,945. About 4.3% of families and 5.7% of the population were below the poverty line, including 6.7% of those under age 18 and 4.3% of those age 65 or over.
Batavia is served by several school districts, including Batavia Public Schools, Geneva Community Unit School District 304, and St. Charles Community Unit School District 303. The city is also home to several higher education institutions, including Waubonsee Community College and Aurora University.
Common Questions
What is Per Capita Income in Batavia?
Per Capita income in Batavia is $52,850.
What is the Median Family Income in Batavia?
Median Family Income in Batavia is $145,195.
What is the Median Household income in Batavia?
Median Household Income in Batavia is $113,824.
What is Income or Wage Gap in Batavia?
Income or Wage Gap in Batavia is 42.2%.
Women in Batavia earn 57.8 cents for every dollar earned by a man.
What is Family Income Deficit in Batavia?
Family Income Deficit in Batavia is $9,045.
Families that are below poverty line in Batavia earn $9,045 less on average than the poverty threshold level.
What is Inequality or Gini Index in Batavia?
Inequality or Gini Index in Batavia is 0.43.
What is the Total Population of Batavia?
Total Population of Batavia is 26,355.
What is the Total Male Population of Batavia?
Total Male Population of Batavia is 13,085.
What is the Total Female Population of Batavia?
Total Female Population of Batavia is 13,270.
What is the Ratio of Males per 100 Females in Batavia?
There are 98.61 Males per 100 Females in Batavia.
What is the Ratio of Females per 100 Males in Batavia?
There are 101.41 Females per 100 Males in Batavia.
What is the Median Population Age in Batavia?
Median Population Age in Batavia is 38.9 Years.
What is the Average Family Size in Batavia
Average Family Size in Batavia is 3.3 People.
What is the Average Household Size in Batavia
Average Household Size in Batavia is 2.7 People.
How Large is the Labor Force in Batavia?
There are 14,470 People in the Labor Forcein in Batavia.
What is the Percentage of People in the Labor Force in Batavia?
70.7% of People are in the Labor Force in Batavia.
What is the Unemployment Rate in Batavia?
Unemployment Rate in Batavia is 3.7%.