Bushnell, IL Map & Demographics
Bushnell Map
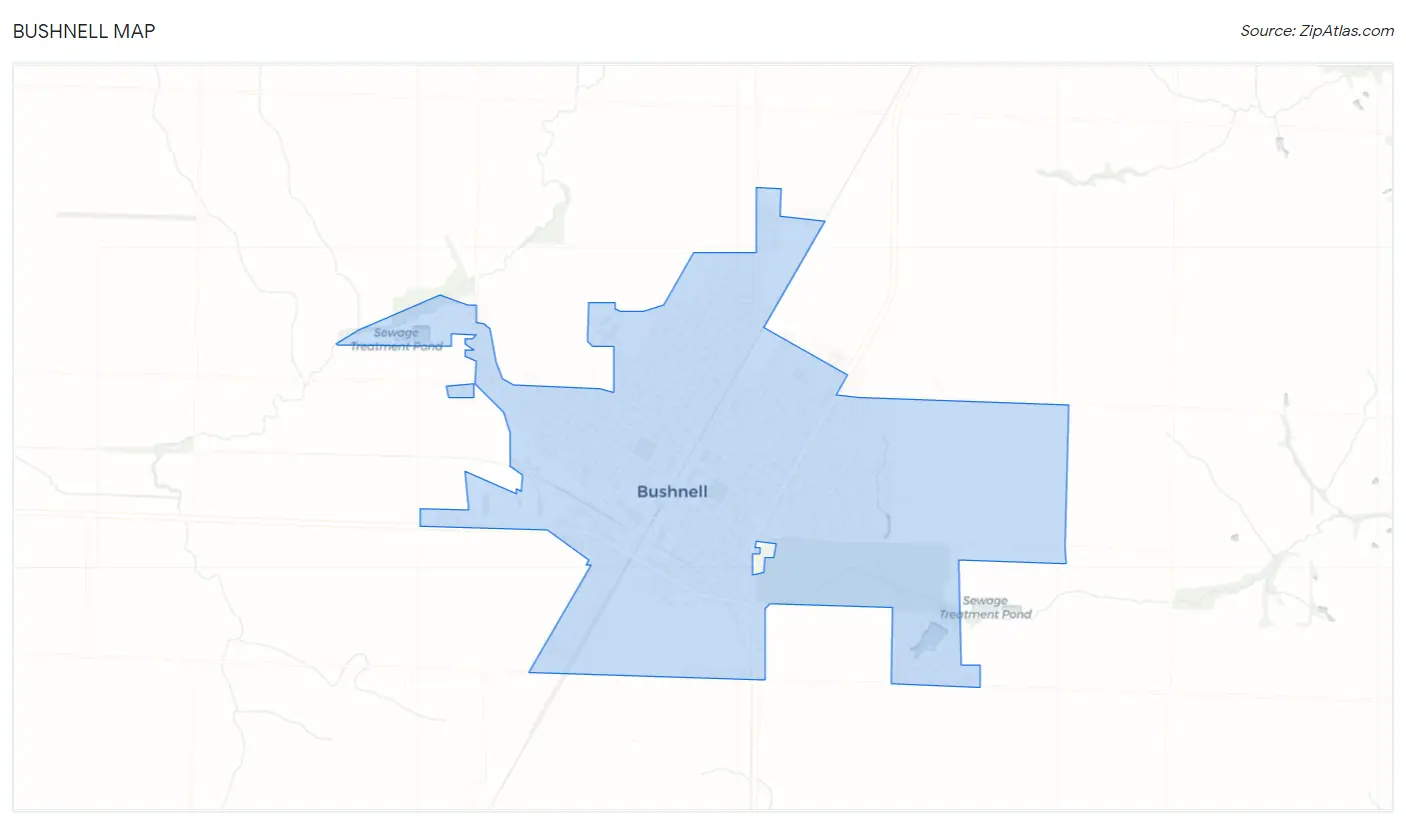
Bushnell Overview
$26,522
PER CAPITA INCOME
$64,405
AVG FAMILY INCOME
$52,227
AVG HOUSEHOLD INCOME
12.4%
WAGE / INCOME GAP [ % ]
87.6¢/ $1
WAGE / INCOME GAP [ $ ]
$10,314
FAMILY INCOME DEFICIT
0.40
INEQUALITY / GINI INDEX
2,850
TOTAL POPULATION
1,361
MALE POPULATION
1,489
FEMALE POPULATION
91.40
MALES / 100 FEMALES
109.40
FEMALES / 100 MALES
42.1
MEDIAN AGE
3.0
AVG FAMILY SIZE
2.4
AVG HOUSEHOLD SIZE
1,468
LABOR FORCE [ PEOPLE ]
63.0%
PERCENT IN LABOR FORCE
5.2%
UNEMPLOYMENT RATE
Bushnell Zip Codes
Bushnell Area Codes
Income in Bushnell
Income Overview in Bushnell
Per Capita Income in Bushnell is $26,522, while median incomes of families and households are $64,405 and $52,227 respectively.
| Characteristic | Number | Measure |
| Per Capita Income | 2,850 | $26,522 |
| Median Family Income | 746 | $64,405 |
| Mean Family Income | 746 | $72,146 |
| Median Household Income | 1,190 | $52,227 |
| Mean Household Income | 1,190 | $57,134 |
| Income Deficit | 746 | $10,314 |
| Wage / Income Gap (%) | 2,850 | 12.42% |
| Wage / Income Gap ($) | 2,850 | 87.58¢ per $1 |
| Gini / Inequality Index | 2,850 | 0.40 |
Earnings by Sex in Bushnell
Average Earnings in Bushnell are $35,885, $37,261 for men and $32,632 for women, a difference of 12.4%.
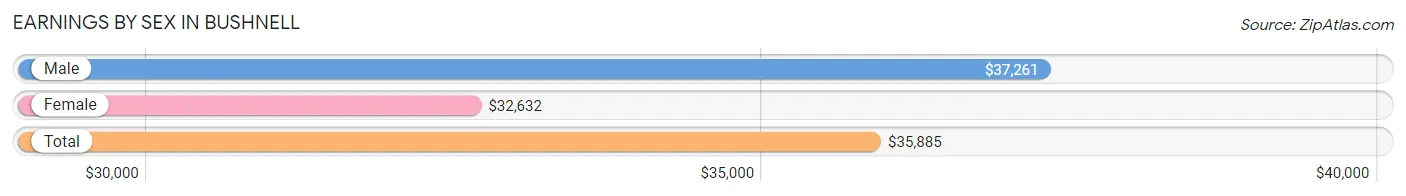
| Sex | Number | Average Earnings |
| Male | 753 (50.8%) | $37,261 |
| Female | 730 (49.2%) | $32,632 |
| Total | 1,483 (100.0%) | $35,885 |
Earnings by Sex by Income Bracket in Bushnell
The most common earnings brackets in Bushnell are $35,000 to $39,999 for men (111 | 14.7%) and $40,000 to $44,999 for women (102 | 14.0%).
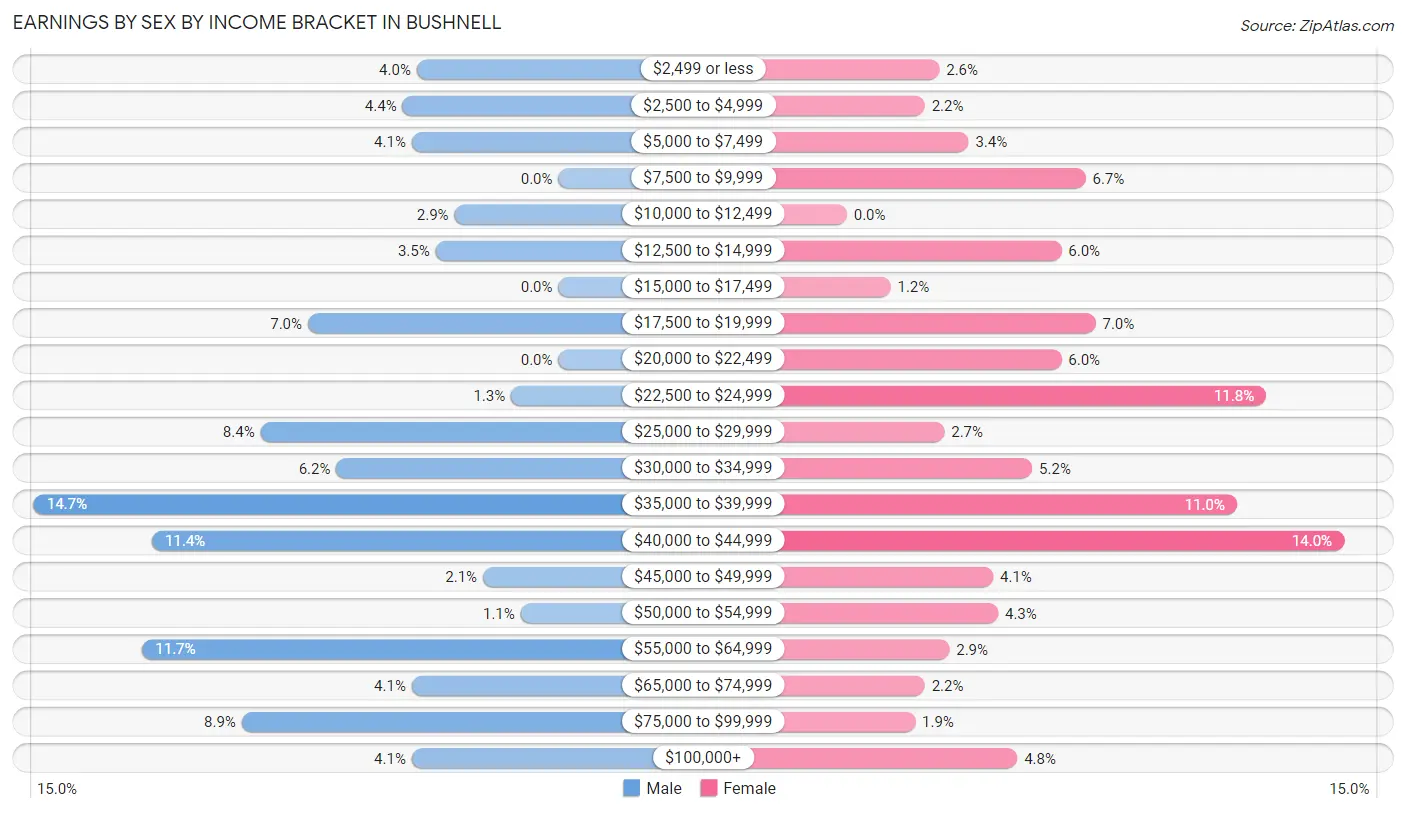
| Income | Male | Female |
| $2,499 or less | 30 (4.0%) | 19 (2.6%) |
| $2,500 to $4,999 | 33 (4.4%) | 16 (2.2%) |
| $5,000 to $7,499 | 31 (4.1%) | 25 (3.4%) |
| $7,500 to $9,999 | 0 (0.0%) | 49 (6.7%) |
| $10,000 to $12,499 | 22 (2.9%) | 0 (0.0%) |
| $12,500 to $14,999 | 26 (3.5%) | 44 (6.0%) |
| $15,000 to $17,499 | 0 (0.0%) | 9 (1.2%) |
| $17,500 to $19,999 | 53 (7.0%) | 51 (7.0%) |
| $20,000 to $22,499 | 0 (0.0%) | 44 (6.0%) |
| $22,500 to $24,999 | 10 (1.3%) | 86 (11.8%) |
| $25,000 to $29,999 | 63 (8.4%) | 20 (2.7%) |
| $30,000 to $34,999 | 47 (6.2%) | 38 (5.2%) |
| $35,000 to $39,999 | 111 (14.7%) | 80 (11.0%) |
| $40,000 to $44,999 | 86 (11.4%) | 102 (14.0%) |
| $45,000 to $49,999 | 16 (2.1%) | 30 (4.1%) |
| $50,000 to $54,999 | 8 (1.1%) | 31 (4.3%) |
| $55,000 to $64,999 | 88 (11.7%) | 21 (2.9%) |
| $65,000 to $74,999 | 31 (4.1%) | 16 (2.2%) |
| $75,000 to $99,999 | 67 (8.9%) | 14 (1.9%) |
| $100,000+ | 31 (4.1%) | 35 (4.8%) |
| Total | 753 (100.0%) | 730 (100.0%) |
Earnings by Sex by Educational Attainment in Bushnell
Average earnings in Bushnell are $40,641 for men and $38,454 for women, a difference of 5.4%. Men with an educational attainment of bachelor's degree enjoy the highest average annual earnings of $60,833, while those with college or associate's degree education earn the least with $39,071. Women with an educational attainment of bachelor's degree earn the most with the average annual earnings of $43,639, while those with college or associate's degree education have the smallest earnings of $24,948.
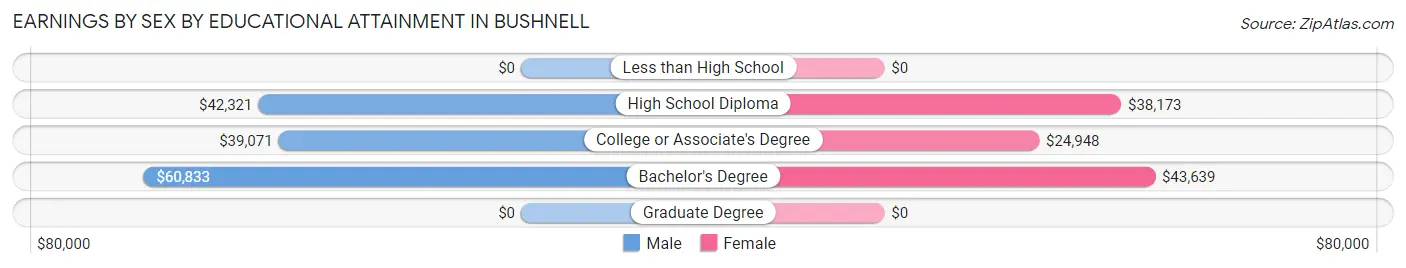
| Educational Attainment | Male Income | Female Income |
| Less than High School | - | - |
| High School Diploma | $42,321 | $38,173 |
| College or Associate's Degree | $39,071 | $24,948 |
| Bachelor's Degree | $60,833 | $43,639 |
| Graduate Degree | - | - |
| Total | $40,641 | $38,454 |
Family Income in Bushnell
Family Income Brackets in Bushnell
According to the Bushnell family income data, there are 212 families falling into the $50,000 to $74,999 income range, which is the most common income bracket and makes up 28.4% of all families.
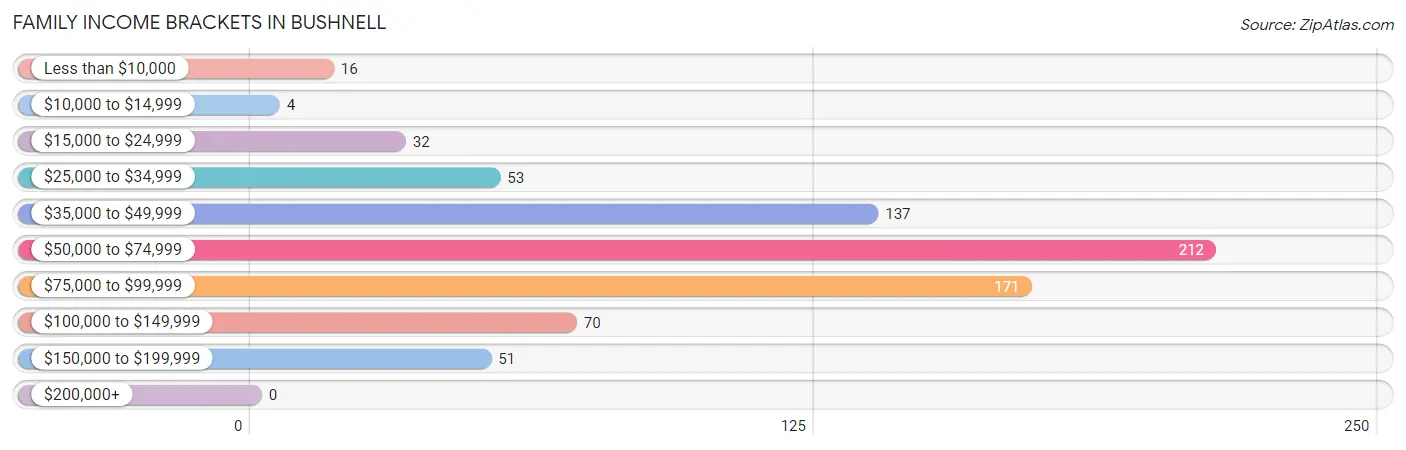
| Income Bracket | # Families | % Families |
| Less than $10,000 | 16 | 2.1% |
| $10,000 to $14,999 | 4 | 0.5% |
| $15,000 to $24,999 | 32 | 4.3% |
| $25,000 to $34,999 | 53 | 7.1% |
| $35,000 to $49,999 | 137 | 18.4% |
| $50,000 to $74,999 | 212 | 28.4% |
| $75,000 to $99,999 | 171 | 22.9% |
| $100,000 to $149,999 | 70 | 9.4% |
| $150,000 to $199,999 | 51 | 6.8% |
| $200,000+ | 0 | 0.0% |
Family Income by Famaliy Size in Bushnell
4-person families (112 | 15.0%) account for the highest median family income in Bushnell with $91,563 per family, while 2-person families (413 | 55.4%) have the highest median income of $33,834 per family member.
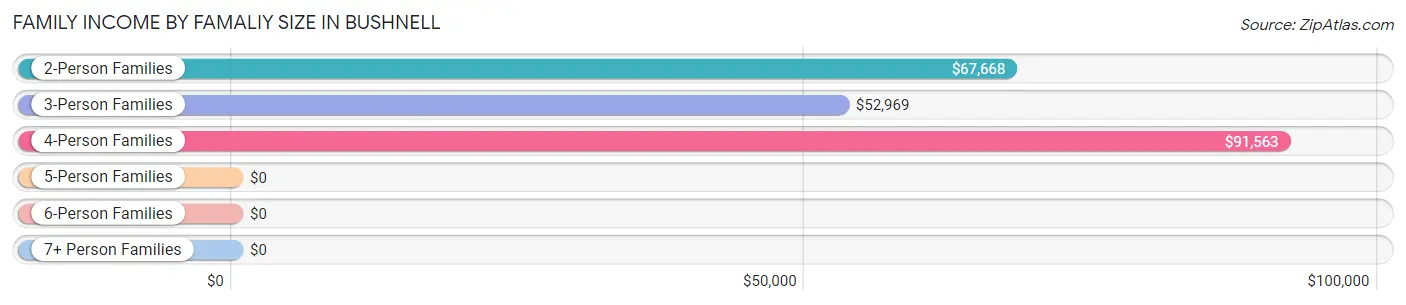
| Income Bracket | # Families | Median Income |
| 2-Person Families | 413 (55.4%) | $67,668 |
| 3-Person Families | 175 (23.5%) | $52,969 |
| 4-Person Families | 112 (15.0%) | $91,563 |
| 5-Person Families | 32 (4.3%) | $0 |
| 6-Person Families | 14 (1.9%) | $0 |
| 7+ Person Families | 0 (0.0%) | $0 |
| Total | 746 (100.0%) | $64,405 |
Family Income by Number of Earners in Bushnell
The median family income in Bushnell is $64,405, with families comprising 3+ earners (33) having the highest median family income of $108,558, while families with 1 earner (280) have the lowest median family income of $44,554, accounting for 4.4% and 37.5% of families, respectively.
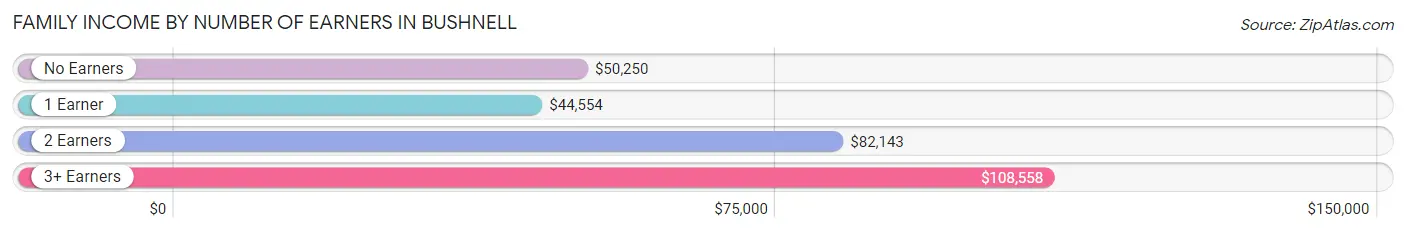
| Number of Earners | # Families | Median Income |
| No Earners | 121 (16.2%) | $50,250 |
| 1 Earner | 280 (37.5%) | $44,554 |
| 2 Earners | 312 (41.8%) | $82,143 |
| 3+ Earners | 33 (4.4%) | $108,558 |
| Total | 746 (100.0%) | $64,405 |
Household Income in Bushnell
Household Income Brackets in Bushnell
With 326 households falling in the category, the $50,000 to $74,999 income range is the most frequent in Bushnell, accounting for 27.4% of all households.
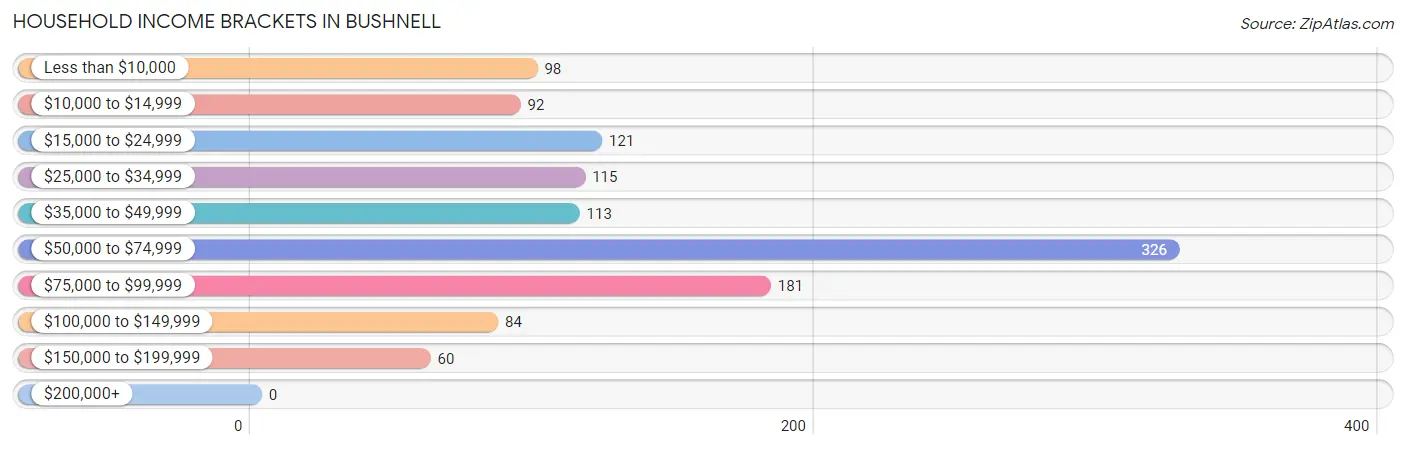
| Income Bracket | # Households | % Households |
| Less than $10,000 | 98 | 8.2% |
| $10,000 to $14,999 | 92 | 7.7% |
| $15,000 to $24,999 | 121 | 10.2% |
| $25,000 to $34,999 | 115 | 9.7% |
| $35,000 to $49,999 | 113 | 9.5% |
| $50,000 to $74,999 | 326 | 27.4% |
| $75,000 to $99,999 | 181 | 15.2% |
| $100,000 to $149,999 | 84 | 7.1% |
| $150,000 to $199,999 | 60 | 5.0% |
| $200,000+ | 0 | 0.0% |
Household Income by Householder Age in Bushnell
The median household income in Bushnell is $52,227, with the highest median household income of $73,393 found in the 45 to 64 years age bracket for the primary householder. A total of 421 households (35.4%) fall into this category. Meanwhile, the 65+ years age bracket for the primary householder has the lowest median household income of $34,293, with 339 households (28.5%) in this group.
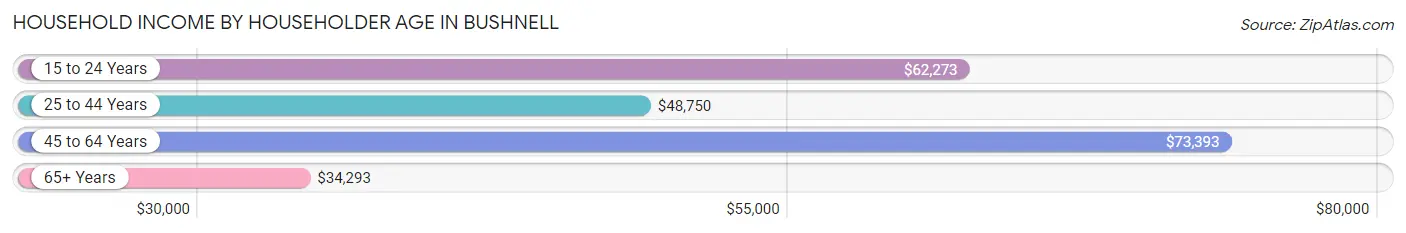
| Income Bracket | # Households | Median Income |
| 15 to 24 Years | 82 (6.9%) | $62,273 |
| 25 to 44 Years | 348 (29.2%) | $48,750 |
| 45 to 64 Years | 421 (35.4%) | $73,393 |
| 65+ Years | 339 (28.5%) | $34,293 |
| Total | 1,190 (100.0%) | $52,227 |
Poverty in Bushnell
Income Below Poverty by Sex and Age in Bushnell
With 11.1% poverty level for males and 13.2% for females among the residents of Bushnell, 35 to 44 year old males and 35 to 44 year old females are the most vulnerable to poverty, with 38 males (39.2%) and 65 females (32.7%) in their respective age groups living below the poverty level.
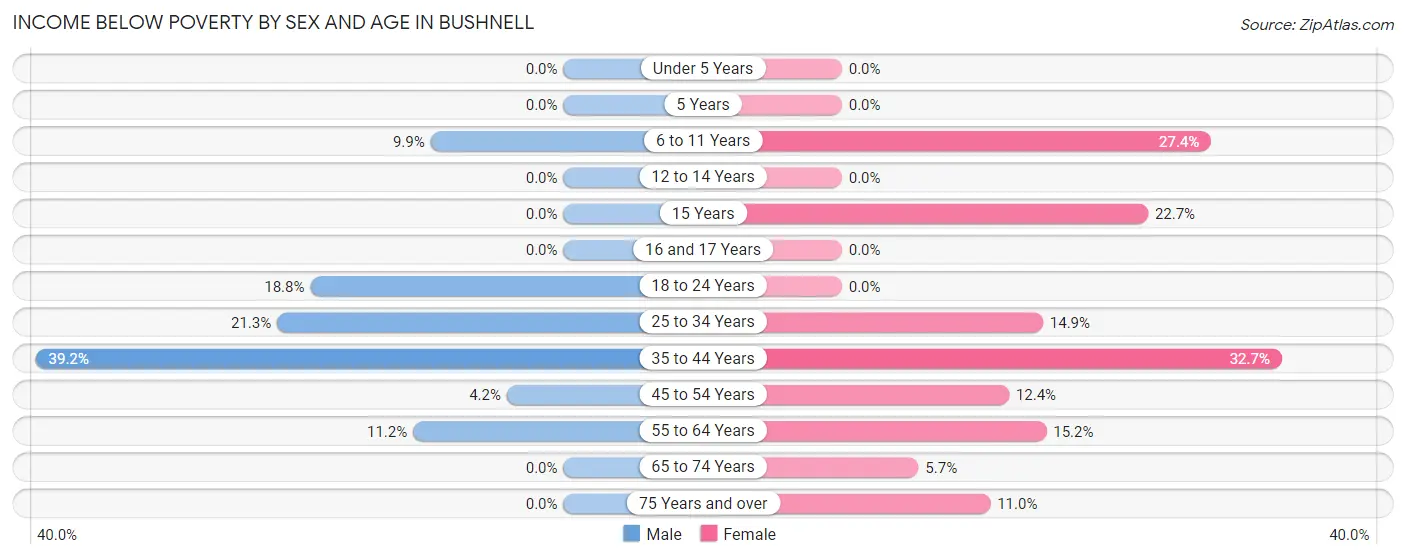
| Age Bracket | Male | Female |
| Under 5 Years | 0 (0.0%) | 0 (0.0%) |
| 5 Years | 0 (0.0%) | 0 (0.0%) |
| 6 to 11 Years | 7 (9.9%) | 17 (27.4%) |
| 12 to 14 Years | 0 (0.0%) | 0 (0.0%) |
| 15 Years | 0 (0.0%) | 10 (22.7%) |
| 16 and 17 Years | 0 (0.0%) | 0 (0.0%) |
| 18 to 24 Years | 31 (18.8%) | 0 (0.0%) |
| 25 to 34 Years | 44 (21.3%) | 20 (14.9%) |
| 35 to 44 Years | 38 (39.2%) | 65 (32.7%) |
| 45 to 54 Years | 6 (4.2%) | 34 (12.4%) |
| 55 to 64 Years | 24 (11.2%) | 29 (15.2%) |
| 65 to 74 Years | 0 (0.0%) | 7 (5.7%) |
| 75 Years and over | 0 (0.0%) | 14 (11.0%) |
| Total | 150 (11.1%) | 196 (13.2%) |
Income Above Poverty by Sex and Age in Bushnell
According to the poverty statistics in Bushnell, males aged under 5 years and females aged under 5 years are the age groups that are most secure financially, with 100.0% of males and 100.0% of females in these age groups living above the poverty line.
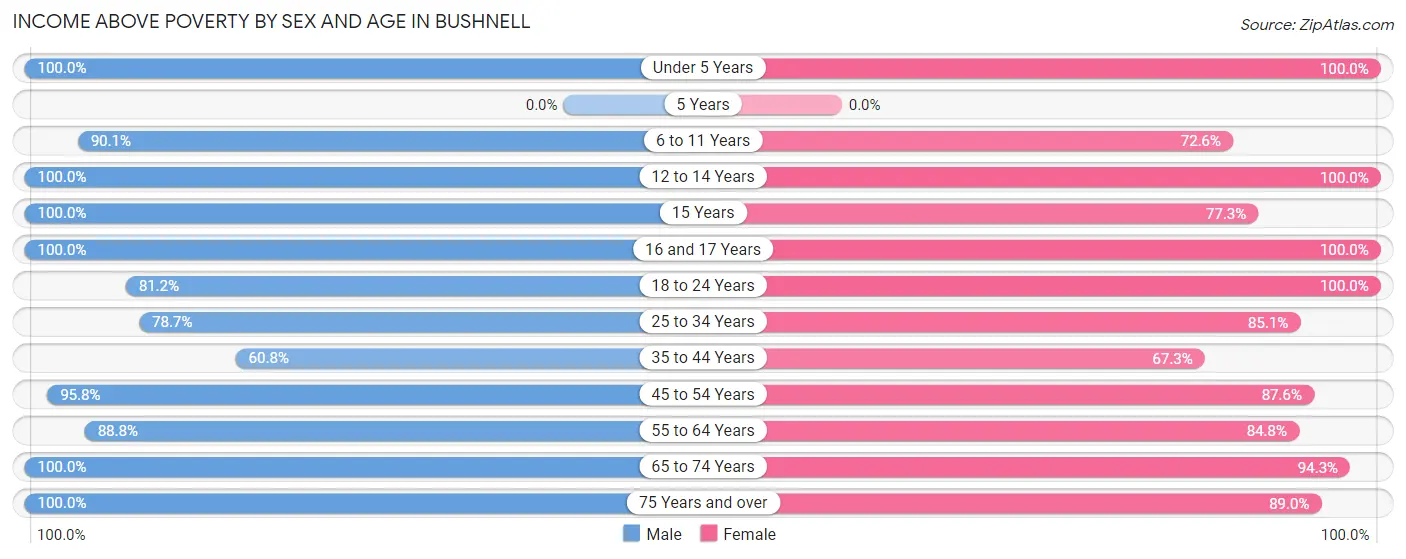
| Age Bracket | Male | Female |
| Under 5 Years | 124 (100.0%) | 119 (100.0%) |
| 5 Years | 0 (0.0%) | 0 (0.0%) |
| 6 to 11 Years | 64 (90.1%) | 45 (72.6%) |
| 12 to 14 Years | 14 (100.0%) | 60 (100.0%) |
| 15 Years | 18 (100.0%) | 34 (77.3%) |
| 16 and 17 Years | 52 (100.0%) | 15 (100.0%) |
| 18 to 24 Years | 134 (81.2%) | 141 (100.0%) |
| 25 to 34 Years | 163 (78.7%) | 114 (85.1%) |
| 35 to 44 Years | 59 (60.8%) | 134 (67.3%) |
| 45 to 54 Years | 137 (95.8%) | 240 (87.6%) |
| 55 to 64 Years | 191 (88.8%) | 162 (84.8%) |
| 65 to 74 Years | 182 (100.0%) | 116 (94.3%) |
| 75 Years and over | 65 (100.0%) | 113 (89.0%) |
| Total | 1,203 (88.9%) | 1,293 (86.8%) |
Income Below Poverty Among Married-Couple Families in Bushnell
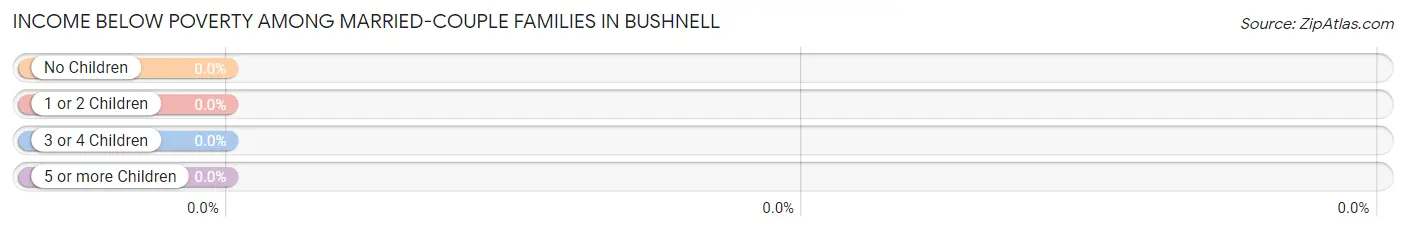
| Children | Above Poverty | Below Poverty |
| No Children | 345 (100.0%) | 0 (0.0%) |
| 1 or 2 Children | 115 (100.0%) | 0 (0.0%) |
| 3 or 4 Children | 21 (100.0%) | 0 (0.0%) |
| 5 or more Children | 0 (0.0%) | 0 (0.0%) |
| Total | 481 (100.0%) | 0 (0.0%) |
Income Below Poverty Among Single-Parent Households in Bushnell
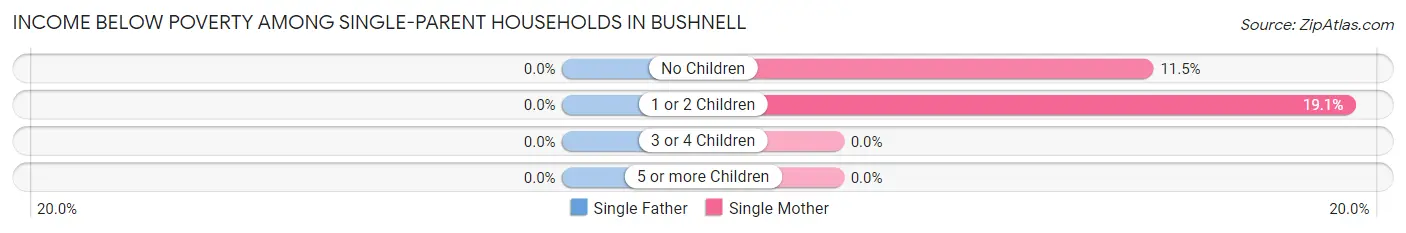
| Children | Single Father | Single Mother |
| No Children | 0 (0.0%) | 9 (11.5%) |
| 1 or 2 Children | 0 (0.0%) | 20 (19.1%) |
| 3 or 4 Children | 0 (0.0%) | 0 (0.0%) |
| 5 or more Children | 0 (0.0%) | 0 (0.0%) |
| Total | 0 (0.0%) | 29 (15.9%) |
Income Below Poverty Among Married-Couple vs Single-Parent Households in Bushnell
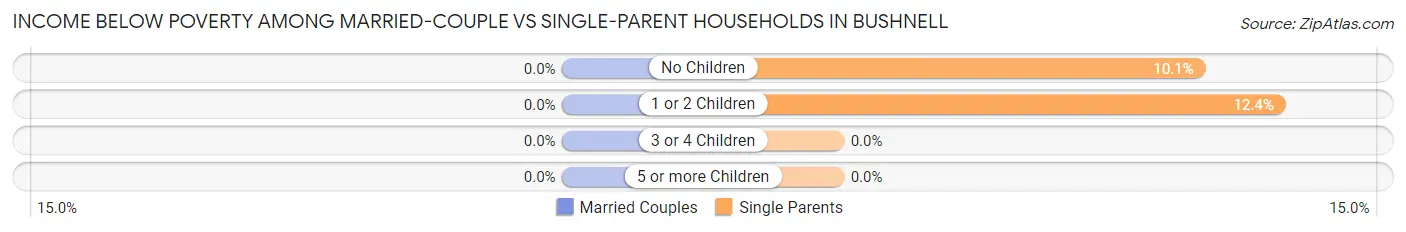
| Children | Married-Couple Families | Single-Parent Households |
| No Children | 0 (0.0%) | 9 (10.1%) |
| 1 or 2 Children | 0 (0.0%) | 20 (12.3%) |
| 3 or 4 Children | 0 (0.0%) | 0 (0.0%) |
| 5 or more Children | 0 (0.0%) | 0 (0.0%) |
| Total | 0 (0.0%) | 29 (10.9%) |
Race in Bushnell
The most populous races in Bushnell are White / Caucasian (2,725 | 95.6%), Some other Race (65 | 2.3%), and Two or more Races (38 | 1.3%).
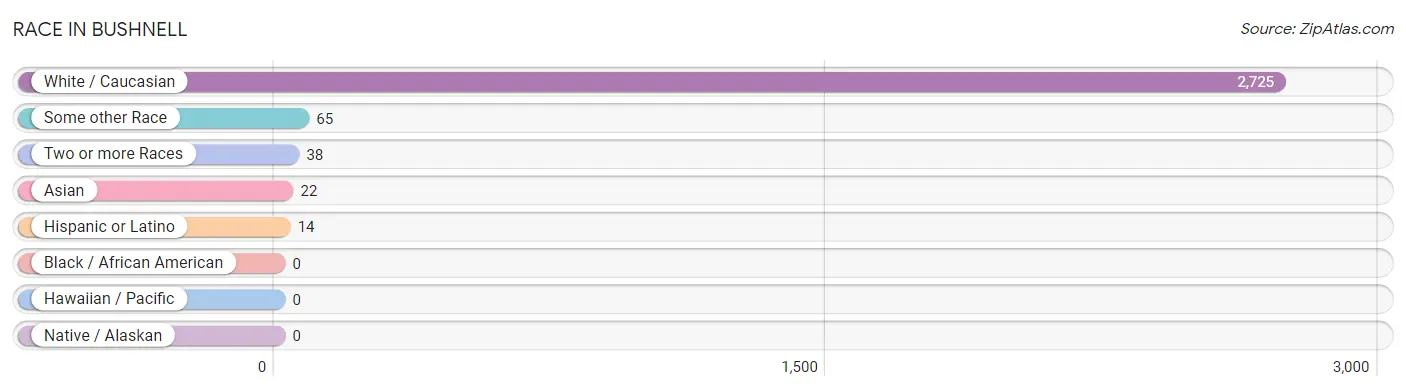
| Race | # Population | % Population |
| Asian | 22 | 0.8% |
| Black / African American | 0 | 0.0% |
| Hawaiian / Pacific | 0 | 0.0% |
| Hispanic or Latino | 14 | 0.5% |
| Native / Alaskan | 0 | 0.0% |
| White / Caucasian | 2,725 | 95.6% |
| Two or more Races | 38 | 1.3% |
| Some other Race | 65 | 2.3% |
| Total | 2,850 | 100.0% |
Ancestry in Bushnell
The most populous ancestries reported in Bushnell are German (507 | 17.8%), American (487 | 17.1%), English (304 | 10.7%), Irish (179 | 6.3%), and Scottish (100 | 3.5%), together accounting for 55.3% of all Bushnell residents.
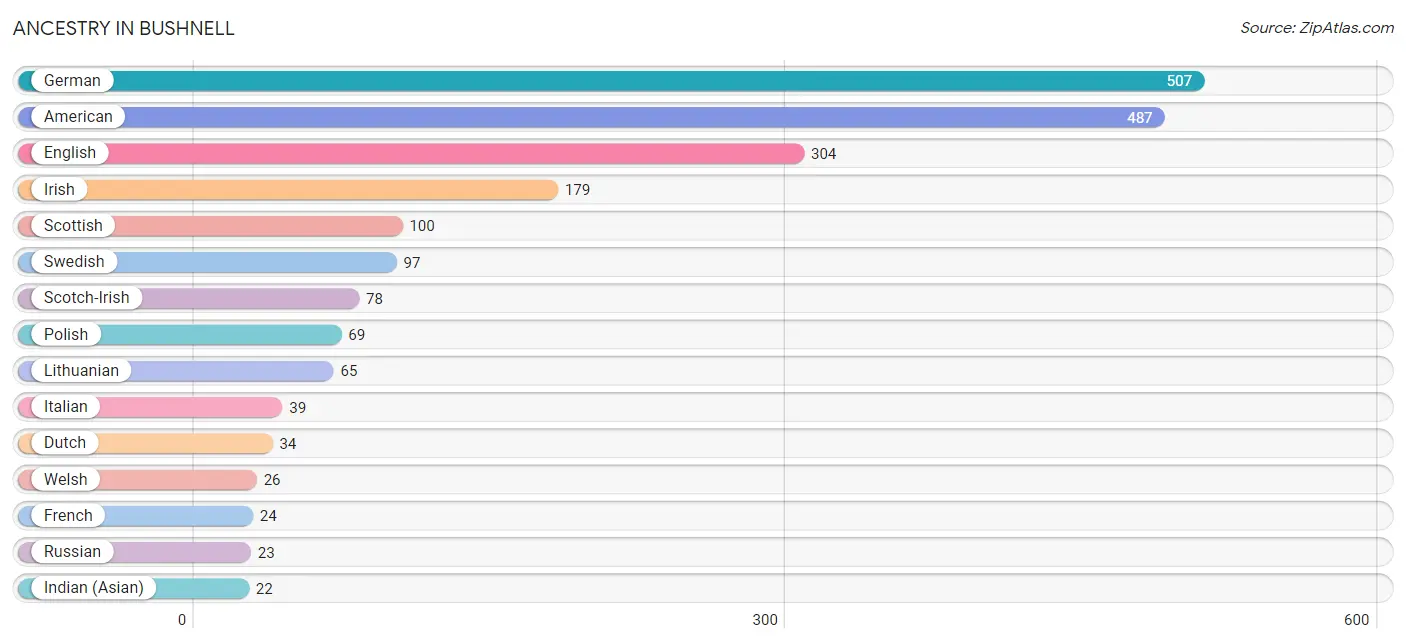
| Ancestry | # Population | % Population |
| American | 487 | 17.1% |
| British | 7 | 0.3% |
| Cherokee | 3 | 0.1% |
| Chippewa | 4 | 0.1% |
| Dutch | 34 | 1.2% |
| English | 304 | 10.7% |
| European | 14 | 0.5% |
| French | 24 | 0.8% |
| German | 507 | 17.8% |
| Hungarian | 9 | 0.3% |
| Indian (Asian) | 22 | 0.8% |
| Irish | 179 | 6.3% |
| Italian | 39 | 1.4% |
| Lithuanian | 65 | 2.3% |
| Mexican | 14 | 0.5% |
| Norwegian | 7 | 0.3% |
| Polish | 69 | 2.4% |
| Russian | 23 | 0.8% |
| Scotch-Irish | 78 | 2.7% |
| Scottish | 100 | 3.5% |
| Swedish | 97 | 3.4% |
| Swiss | 8 | 0.3% |
| Welsh | 26 | 0.9% | View All 23 Rows |
Immigrants in Bushnell
The most numerous immigrant groups reported in Bushnell came from Asia (22 | 0.8%), China (22 | 0.8%), Eastern Asia (22 | 0.8%), England (9 | 0.3%), and Europe (9 | 0.3%), together accounting for 3.0% of all Bushnell residents.
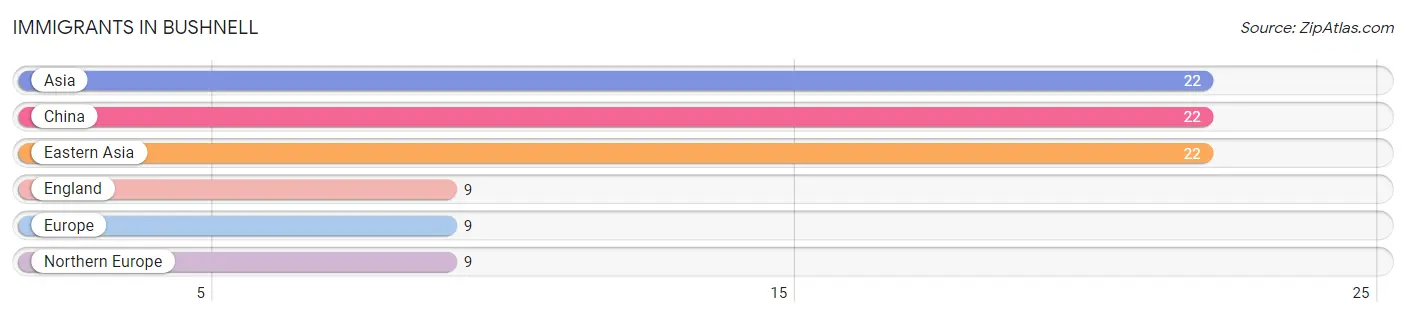
| Immigration Origin | # Population | % Population |
| Asia | 22 | 0.8% |
| China | 22 | 0.8% |
| Eastern Asia | 22 | 0.8% |
| England | 9 | 0.3% |
| Europe | 9 | 0.3% |
| Northern Europe | 9 | 0.3% | View All 6 Rows |
Sex and Age in Bushnell
Sex and Age in Bushnell
The most populous age groups in Bushnell are 20 to 24 Years (151 | 11.1%) for men and 50 to 54 Years (153 | 10.3%) for women.
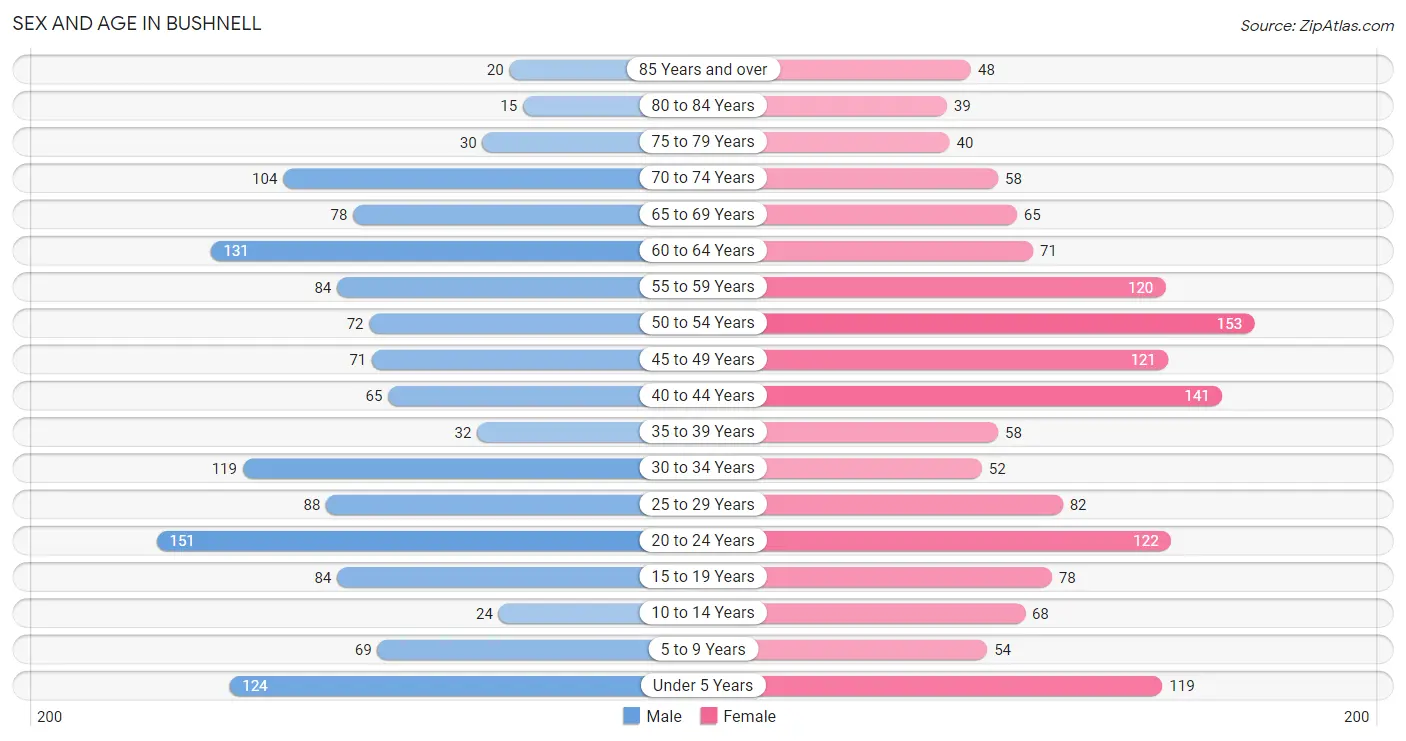
| Age Bracket | Male | Female |
| Under 5 Years | 124 (9.1%) | 119 (8.0%) |
| 5 to 9 Years | 69 (5.1%) | 54 (3.6%) |
| 10 to 14 Years | 24 (1.8%) | 68 (4.6%) |
| 15 to 19 Years | 84 (6.2%) | 78 (5.2%) |
| 20 to 24 Years | 151 (11.1%) | 122 (8.2%) |
| 25 to 29 Years | 88 (6.5%) | 82 (5.5%) |
| 30 to 34 Years | 119 (8.7%) | 52 (3.5%) |
| 35 to 39 Years | 32 (2.4%) | 58 (3.9%) |
| 40 to 44 Years | 65 (4.8%) | 141 (9.5%) |
| 45 to 49 Years | 71 (5.2%) | 121 (8.1%) |
| 50 to 54 Years | 72 (5.3%) | 153 (10.3%) |
| 55 to 59 Years | 84 (6.2%) | 120 (8.1%) |
| 60 to 64 Years | 131 (9.6%) | 71 (4.8%) |
| 65 to 69 Years | 78 (5.7%) | 65 (4.4%) |
| 70 to 74 Years | 104 (7.6%) | 58 (3.9%) |
| 75 to 79 Years | 30 (2.2%) | 40 (2.7%) |
| 80 to 84 Years | 15 (1.1%) | 39 (2.6%) |
| 85 Years and over | 20 (1.5%) | 48 (3.2%) |
| Total | 1,361 (100.0%) | 1,489 (100.0%) |
Families and Households in Bushnell
Median Family Size in Bushnell
The median family size in Bushnell is 2.97 persons per family, with single male/father families (82 | 11.0%) accounting for the largest median family size of 3.01 persons per family. On the other hand, single female/mother families (183 | 24.5%) represent the smallest median family size with 2.86 persons per family.
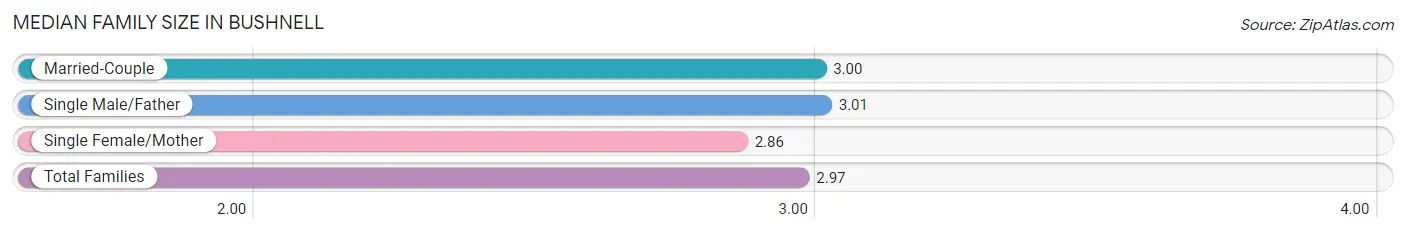
| Family Type | # Families | Family Size |
| Married-Couple | 481 (64.5%) | 3.00 |
| Single Male/Father | 82 (11.0%) | 3.01 |
| Single Female/Mother | 183 (24.5%) | 2.86 |
| Total Families | 746 (100.0%) | 2.97 |
Median Household Size in Bushnell
The median household size in Bushnell is 2.37 persons per household, with single male/father households (82 | 6.9%) accounting for the largest median household size of 3.57 persons per household. non-family households (444 | 37.3%) represent the smallest median household size with 1.09 persons per household.
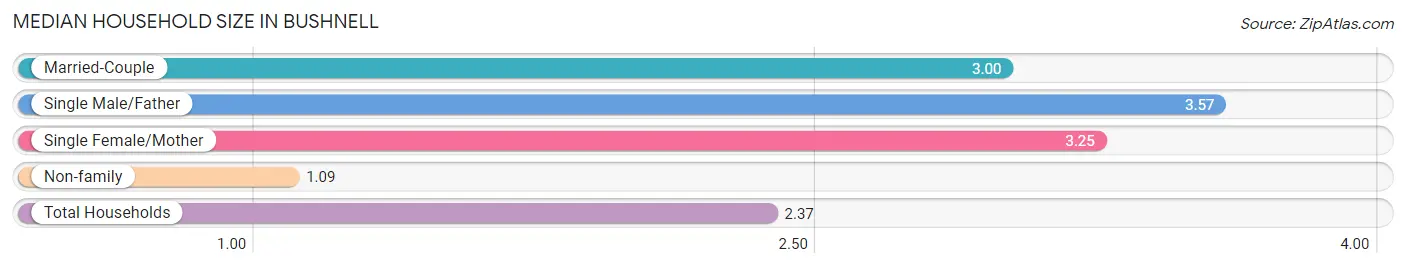
| Household Type | # Households | Household Size |
| Married-Couple | 481 (40.4%) | 3.00 |
| Single Male/Father | 82 (6.9%) | 3.57 |
| Single Female/Mother | 183 (15.4%) | 3.25 |
| Non-family | 444 (37.3%) | 1.09 |
| Total Households | 1,190 (100.0%) | 2.37 |
Household Size by Marriage Status in Bushnell
Out of a total of 1,190 households in Bushnell, 746 (62.7%) are family households, while 444 (37.3%) are nonfamily households. The most numerous type of family households are 2-person households, comprising 404, and the most common type of nonfamily households are 1-person households, comprising 402.
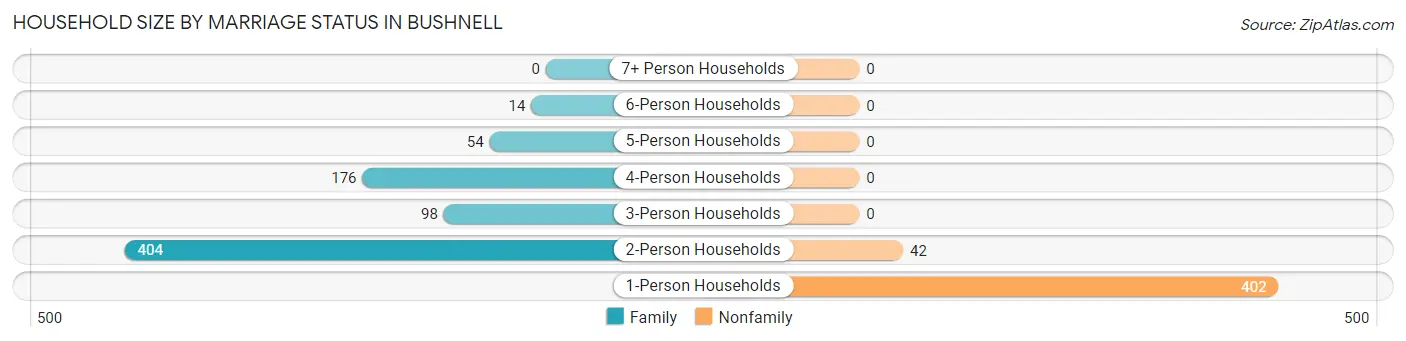
| Household Size | Family Households | Nonfamily Households |
| 1-Person Households | - | 402 (33.8%) |
| 2-Person Households | 404 (34.0%) | 42 (3.5%) |
| 3-Person Households | 98 (8.2%) | 0 (0.0%) |
| 4-Person Households | 176 (14.8%) | 0 (0.0%) |
| 5-Person Households | 54 (4.5%) | 0 (0.0%) |
| 6-Person Households | 14 (1.2%) | 0 (0.0%) |
| 7+ Person Households | 0 (0.0%) | 0 (0.0%) |
| Total | 746 (62.7%) | 444 (37.3%) |
Female Fertility in Bushnell
Fertility by Age in Bushnell
Average fertility rate in Bushnell is 102.0 births per 1,000 women. Women in the age bracket of 20 to 34 years have the highest fertility rate with 270.0 births per 1,000 women. Women in the age bracket of 20 to 34 years acount for 100.0% of all women with births.
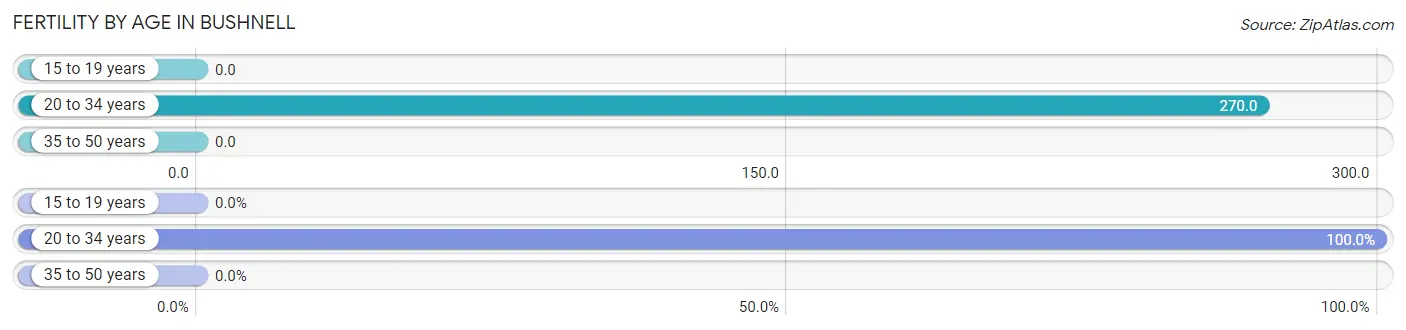
| Age Bracket | Women with Births | Births / 1,000 Women |
| 15 to 19 years | 0 (0.0%) | 0.0 |
| 20 to 34 years | 69 (100.0%) | 270.0 |
| 35 to 50 years | 0 (0.0%) | 0.0 |
| Total | 69 (100.0%) | 102.0 |
Fertility by Age by Marriage Status in Bushnell
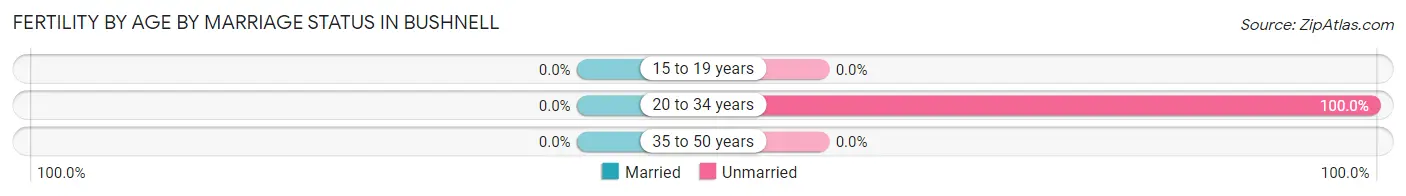
| Age Bracket | Married | Unmarried |
| 15 to 19 years | 0 (0.0%) | 0 (0.0%) |
| 20 to 34 years | 0 (0.0%) | 69 (100.0%) |
| 35 to 50 years | 0 (0.0%) | 0 (0.0%) |
| Total | 0 (0.0%) | 69 (100.0%) |
Fertility by Education in Bushnell
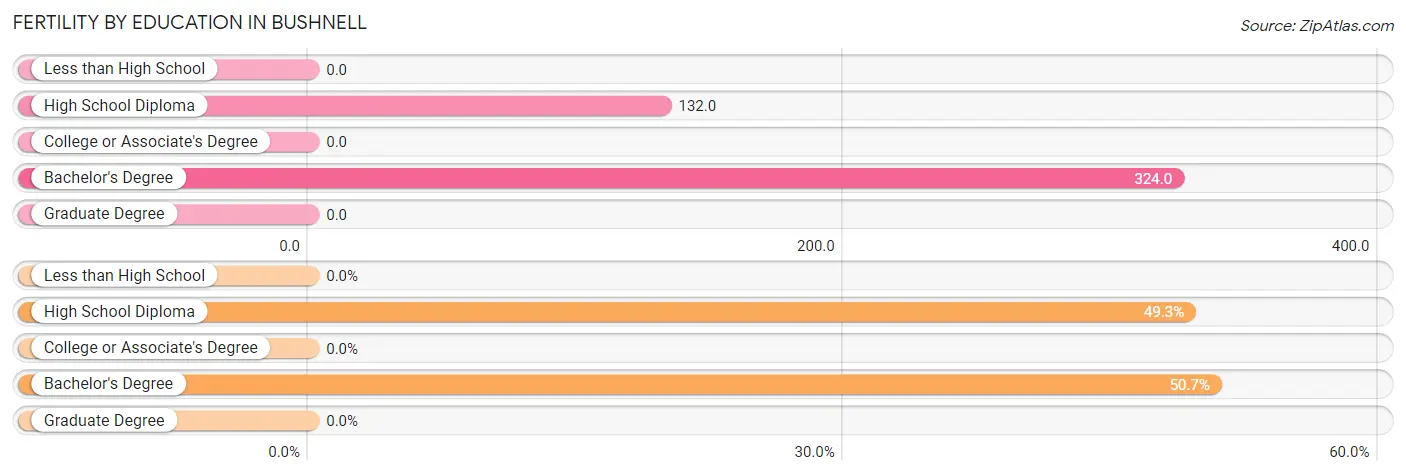
| Educational Attainment | Women with Births | Births / 1,000 Women |
| Less than High School | 0 (0.0%) | 0.0 |
| High School Diploma | 34 (49.3%) | 132.0 |
| College or Associate's Degree | 0 (0.0%) | 0.0 |
| Bachelor's Degree | 35 (50.7%) | 324.0 |
| Graduate Degree | 0 (0.0%) | 0.0 |
| Total | 69 (100.0%) | 102.0 |
Fertility by Education by Marriage Status in Bushnell
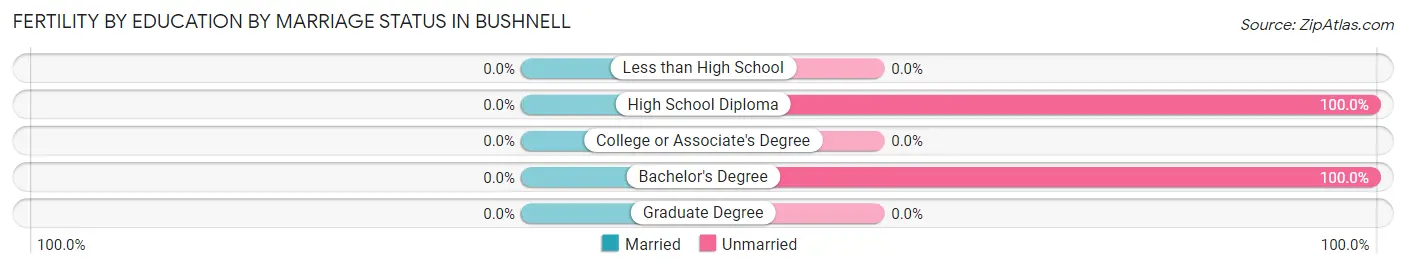
| Educational Attainment | Married | Unmarried |
| Less than High School | 0 (0.0%) | 0 (0.0%) |
| High School Diploma | 0 (0.0%) | 34 (100.0%) |
| College or Associate's Degree | 0 (0.0%) | 0 (0.0%) |
| Bachelor's Degree | 0 (0.0%) | 35 (100.0%) |
| Graduate Degree | 0 (0.0%) | 0 (0.0%) |
| Total | 0 (0.0%) | 69 (100.0%) |
Employment Characteristics in Bushnell
Employment by Class of Employer in Bushnell
Among the 1,382 employed individuals in Bushnell, private company employees (984 | 71.2%), state government employees (135 | 9.8%), and not-for-profit organizations (133 | 9.6%) make up the most common classes of employment.
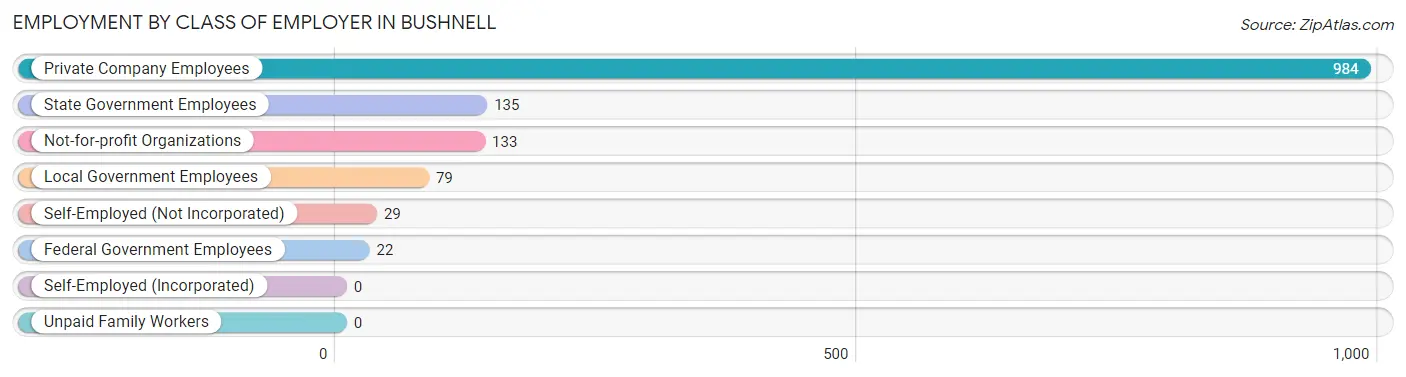
| Employer Class | # Employees | % Employees |
| Private Company Employees | 984 | 71.2% |
| Self-Employed (Incorporated) | 0 | 0.0% |
| Self-Employed (Not Incorporated) | 29 | 2.1% |
| Not-for-profit Organizations | 133 | 9.6% |
| Local Government Employees | 79 | 5.7% |
| State Government Employees | 135 | 9.8% |
| Federal Government Employees | 22 | 1.6% |
| Unpaid Family Workers | 0 | 0.0% |
| Total | 1,382 | 100.0% |
Employment Status by Age in Bushnell
According to the labor force statistics for Bushnell, out of the total population over 16 years of age (2,330), 63.0% or 1,468 individuals are in the labor force, with 5.2% or 76 of them unemployed. The age group with the highest labor force participation rate is 20 to 24 years, with 93.4% or 255 individuals in the labor force. Within the labor force, the 16 to 19 years age range has the highest percentage of unemployed individuals, with 24.4% or 11 of them being unemployed.
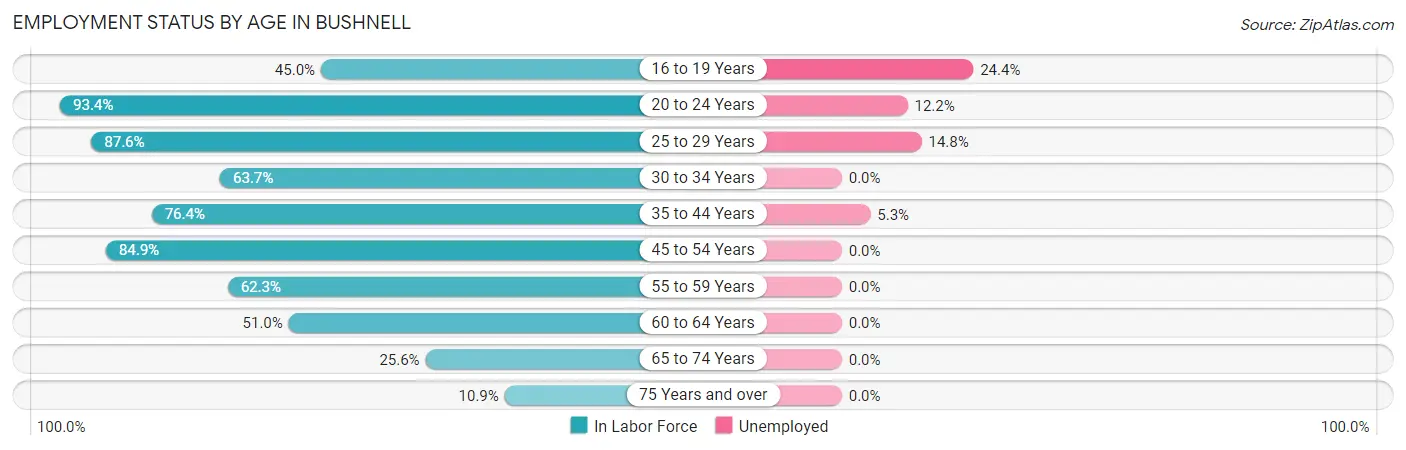
| Age Bracket | In Labor Force | Unemployed |
| 16 to 19 Years | 45 (45.0%) | 11 (24.4%) |
| 20 to 24 Years | 255 (93.4%) | 31 (12.2%) |
| 25 to 29 Years | 149 (87.6%) | 22 (14.8%) |
| 30 to 34 Years | 109 (63.7%) | 0 (0.0%) |
| 35 to 44 Years | 226 (76.4%) | 12 (5.3%) |
| 45 to 54 Years | 354 (84.9%) | 0 (0.0%) |
| 55 to 59 Years | 127 (62.3%) | 0 (0.0%) |
| 60 to 64 Years | 103 (51.0%) | 0 (0.0%) |
| 65 to 74 Years | 78 (25.6%) | 0 (0.0%) |
| 75 Years and over | 21 (10.9%) | 0 (0.0%) |
| Total | 1,468 (63.0%) | 76 (5.2%) |
Employment Status by Educational Attainment in Bushnell
According to labor force statistics for Bushnell, 73.2% of individuals (1,069) out of the total population between 25 and 64 years of age (1,460) are in the labor force, with 3.2% or 34 of them being unemployed. The group with the highest labor force participation rate are those with the educational attainment of bachelor's degree or higher, with 91.2% or 238 individuals in the labor force. Within the labor force, individuals with high school diploma education have the highest percentage of unemployment, with 5.3% or 27 of them being unemployed.
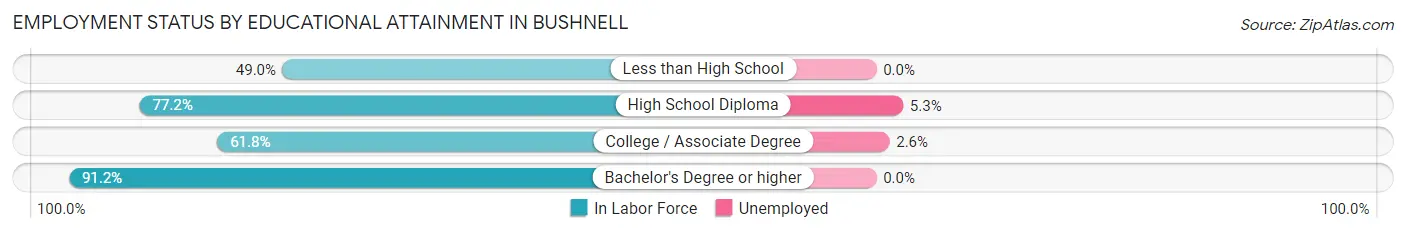
| Educational Attainment | In Labor Force | Unemployed |
| Less than High School | 50 (49.0%) | 0 (0.0%) |
| High School Diploma | 512 (77.2%) | 35 (5.3%) |
| College / Associate Degree | 268 (61.8%) | 11 (2.6%) |
| Bachelor's Degree or higher | 238 (91.2%) | 0 (0.0%) |
| Total | 1,069 (73.2%) | 47 (3.2%) |
Employment Occupations by Sex in Bushnell
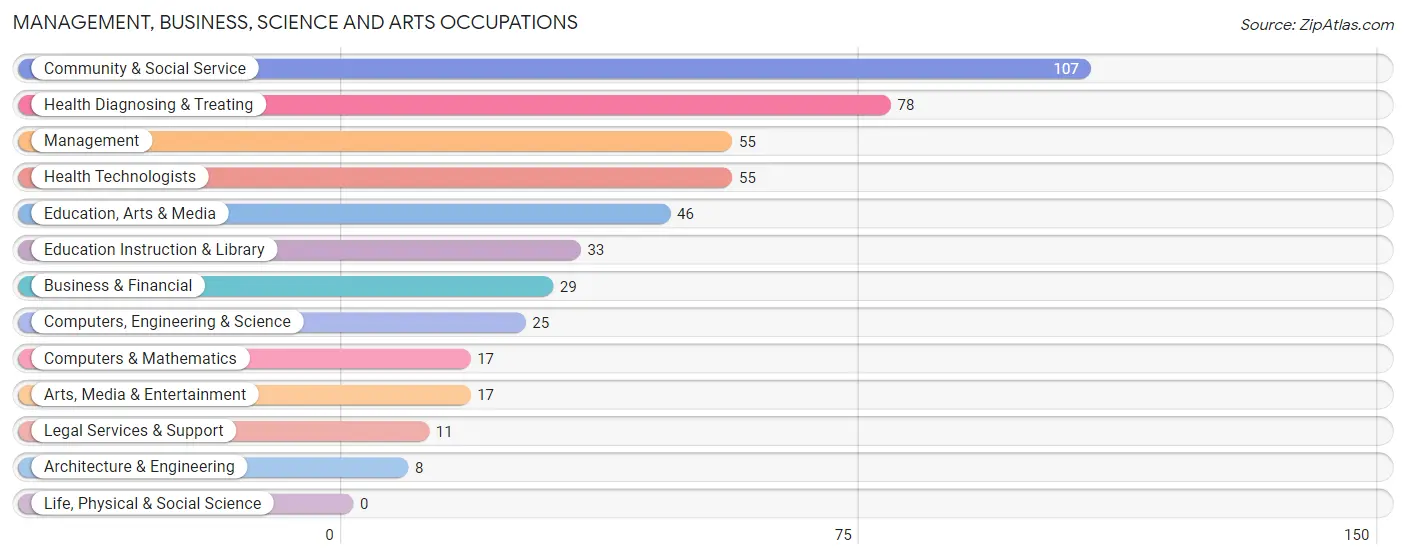
Management, Business, Science and Arts Occupations
The most common Management, Business, Science and Arts occupations in Bushnell are Community & Social Service (107 | 7.7%), Health Diagnosing & Treating (78 | 5.6%), Management (55 | 4.0%), Health Technologists (55 | 4.0%), and Education, Arts & Media (46 | 3.3%).
Management, Business, Science and Arts Occupations by Sex
Within the Management, Business, Science and Arts occupations in Bushnell, the most male-oriented occupations are Computers, Engineering & Science (100.0%), Computers & Mathematics (100.0%), and Architecture & Engineering (100.0%), while the most female-oriented occupations are Legal Services & Support (100.0%), Education Instruction & Library (100.0%), and Arts, Media & Entertainment (100.0%).
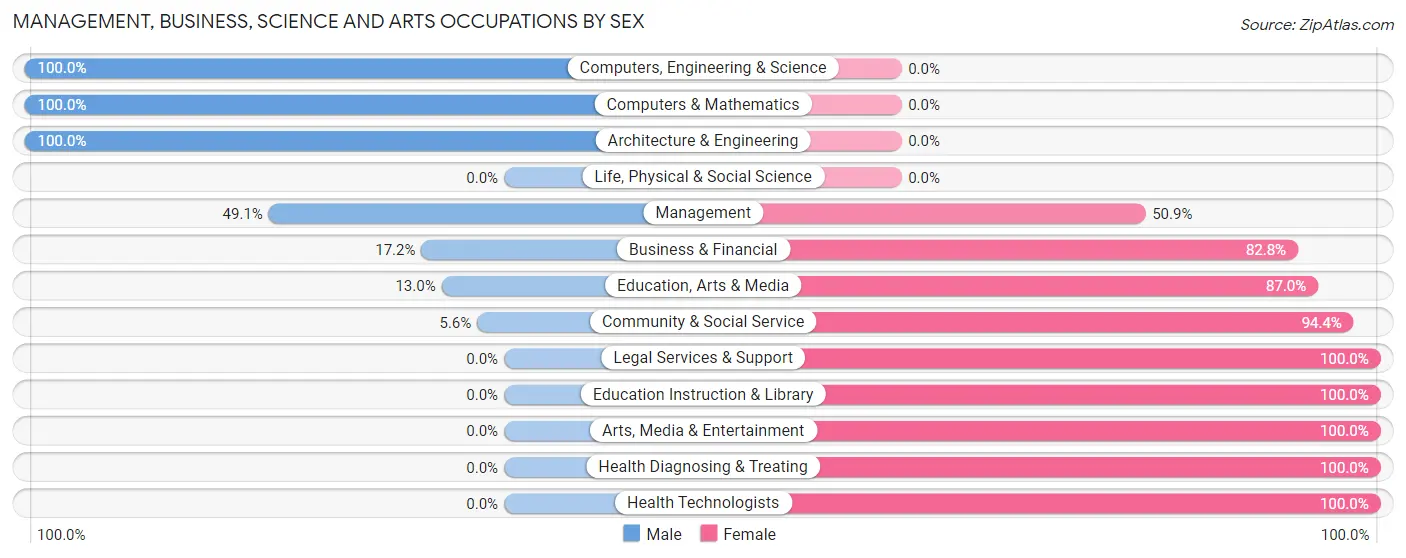
| Occupation | Male | Female |
| Management | 27 (49.1%) | 28 (50.9%) |
| Business & Financial | 5 (17.2%) | 24 (82.8%) |
| Computers, Engineering & Science | 25 (100.0%) | 0 (0.0%) |
| Computers & Mathematics | 17 (100.0%) | 0 (0.0%) |
| Architecture & Engineering | 8 (100.0%) | 0 (0.0%) |
| Life, Physical & Social Science | 0 (0.0%) | 0 (0.0%) |
| Community & Social Service | 6 (5.6%) | 101 (94.4%) |
| Education, Arts & Media | 6 (13.0%) | 40 (87.0%) |
| Legal Services & Support | 0 (0.0%) | 11 (100.0%) |
| Education Instruction & Library | 0 (0.0%) | 33 (100.0%) |
| Arts, Media & Entertainment | 0 (0.0%) | 17 (100.0%) |
| Health Diagnosing & Treating | 0 (0.0%) | 78 (100.0%) |
| Health Technologists | 0 (0.0%) | 55 (100.0%) |
| Total (Category) | 63 (21.4%) | 231 (78.6%) |
| Total (Overall) | 683 (49.1%) | 708 (50.9%) |
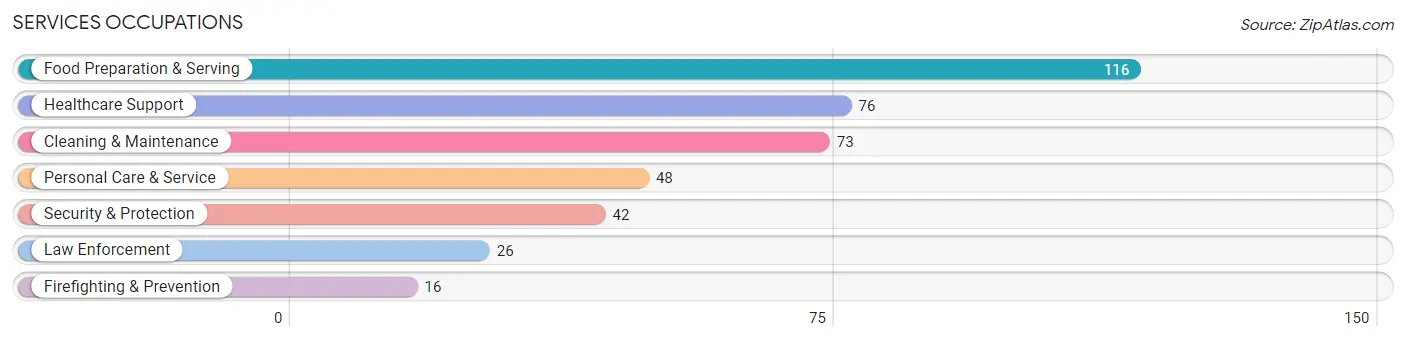
Services Occupations
The most common Services occupations in Bushnell are Food Preparation & Serving (116 | 8.3%), Healthcare Support (76 | 5.5%), Cleaning & Maintenance (73 | 5.2%), Personal Care & Service (48 | 3.5%), and Security & Protection (42 | 3.0%).
Services Occupations by Sex
Within the Services occupations in Bushnell, the most male-oriented occupations are Security & Protection (100.0%), Firefighting & Prevention (100.0%), and Law Enforcement (100.0%), while the most female-oriented occupations are Healthcare Support (100.0%), Personal Care & Service (100.0%), and Food Preparation & Serving (41.4%).
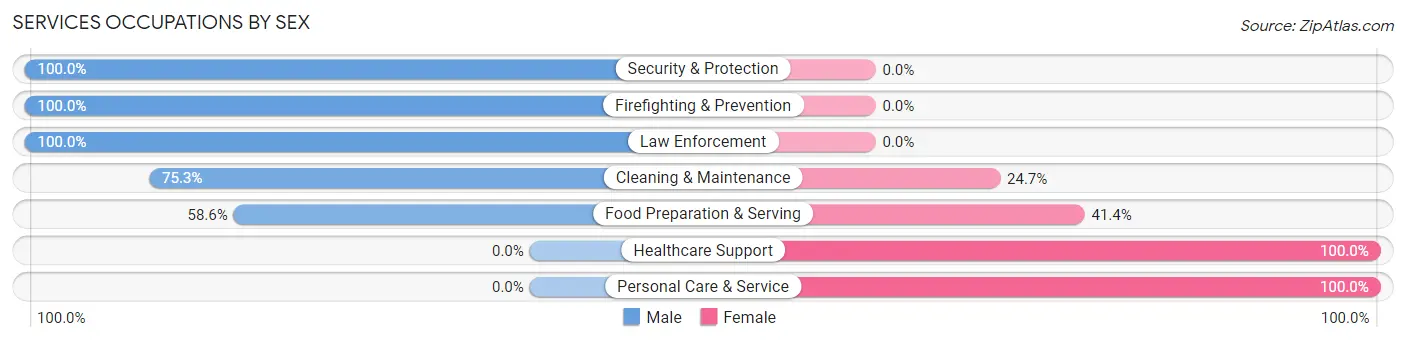
| Occupation | Male | Female |
| Healthcare Support | 0 (0.0%) | 76 (100.0%) |
| Security & Protection | 42 (100.0%) | 0 (0.0%) |
| Firefighting & Prevention | 16 (100.0%) | 0 (0.0%) |
| Law Enforcement | 26 (100.0%) | 0 (0.0%) |
| Food Preparation & Serving | 68 (58.6%) | 48 (41.4%) |
| Cleaning & Maintenance | 55 (75.3%) | 18 (24.7%) |
| Personal Care & Service | 0 (0.0%) | 48 (100.0%) |
| Total (Category) | 165 (46.5%) | 190 (53.5%) |
| Total (Overall) | 683 (49.1%) | 708 (50.9%) |
Sales and Office Occupations
The most common Sales and Office occupations in Bushnell are Office & Administration (131 | 9.4%), and Sales & Related (126 | 9.1%).

Sales and Office Occupations by Sex

| Occupation | Male | Female |
| Sales & Related | 78 (61.9%) | 48 (38.1%) |
| Office & Administration | 23 (17.6%) | 108 (82.4%) |
| Total (Category) | 101 (39.3%) | 156 (60.7%) |
| Total (Overall) | 683 (49.1%) | 708 (50.9%) |
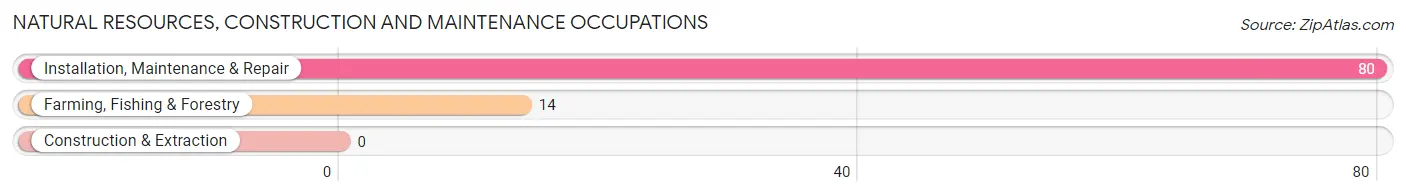
Natural Resources, Construction and Maintenance Occupations
The most common Natural Resources, Construction and Maintenance occupations in Bushnell are Installation, Maintenance & Repair (80 | 5.8%), and Farming, Fishing & Forestry (14 | 1.0%).
Natural Resources, Construction and Maintenance Occupations by Sex
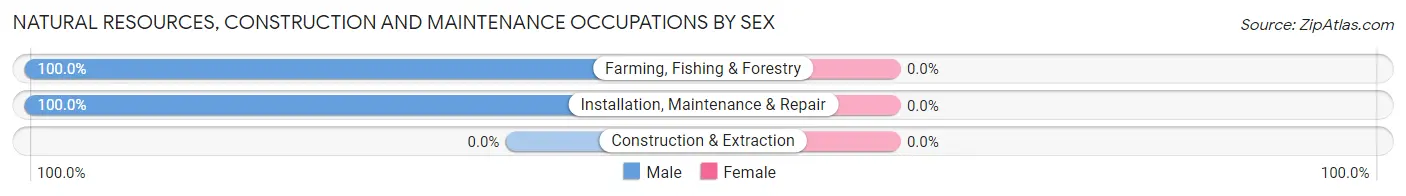
| Occupation | Male | Female |
| Farming, Fishing & Forestry | 14 (100.0%) | 0 (0.0%) |
| Construction & Extraction | 0 (0.0%) | 0 (0.0%) |
| Installation, Maintenance & Repair | 80 (100.0%) | 0 (0.0%) |
| Total (Category) | 94 (100.0%) | 0 (0.0%) |
| Total (Overall) | 683 (49.1%) | 708 (50.9%) |
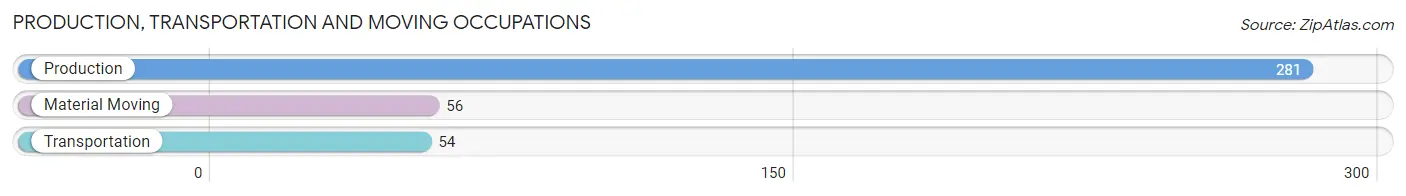
Production, Transportation and Moving Occupations
The most common Production, Transportation and Moving occupations in Bushnell are Production (281 | 20.2%), Material Moving (56 | 4.0%), and Transportation (54 | 3.9%).
Production, Transportation and Moving Occupations by Sex
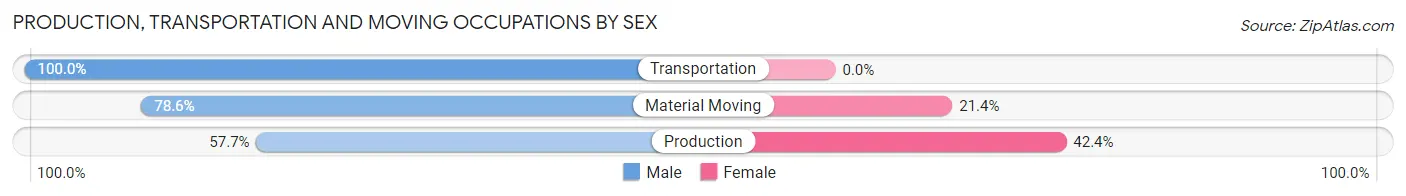
| Occupation | Male | Female |
| Production | 162 (57.7%) | 119 (42.3%) |
| Transportation | 54 (100.0%) | 0 (0.0%) |
| Material Moving | 44 (78.6%) | 12 (21.4%) |
| Total (Category) | 260 (66.5%) | 131 (33.5%) |
| Total (Overall) | 683 (49.1%) | 708 (50.9%) |
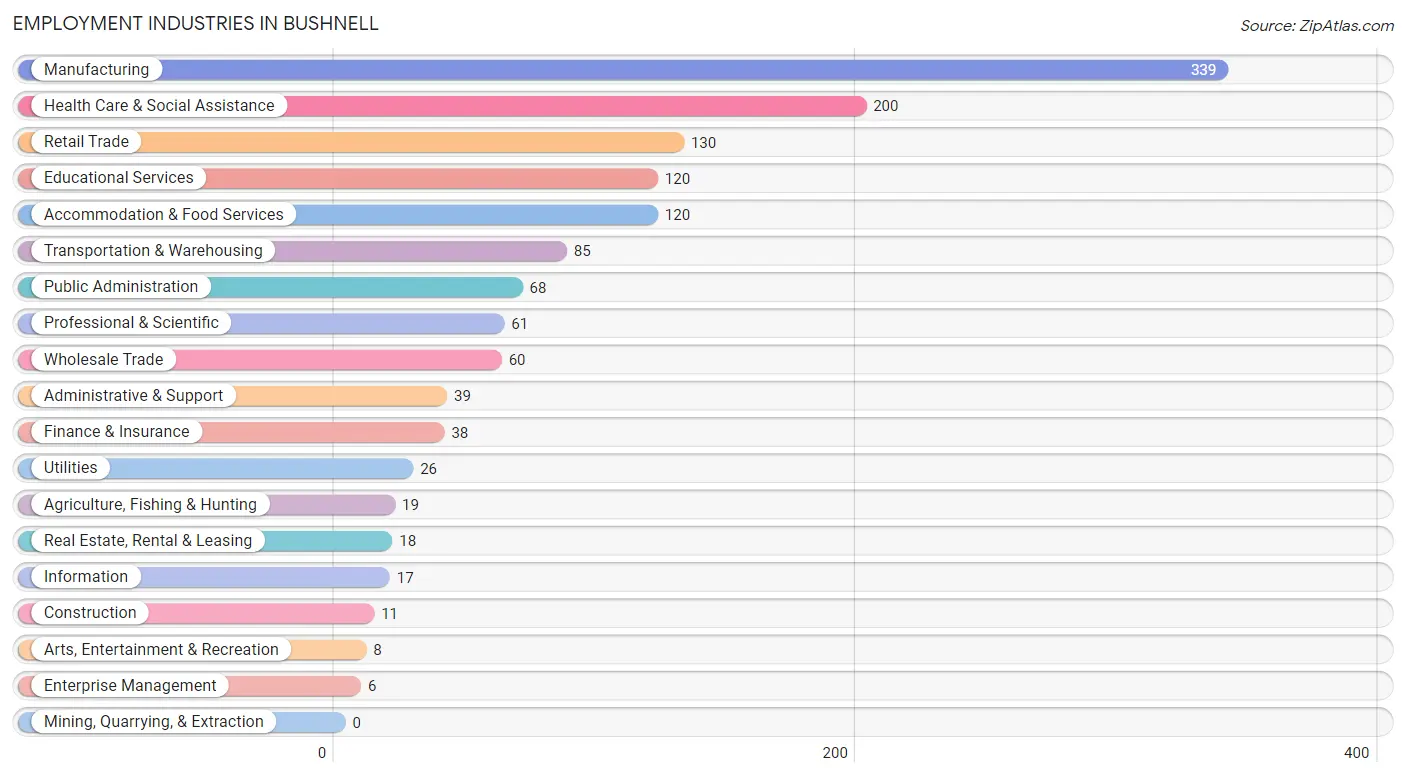
Employment Industries by Sex in Bushnell
Employment Industries in Bushnell
The major employment industries in Bushnell include Manufacturing (339 | 24.4%), Health Care & Social Assistance (200 | 14.4%), Retail Trade (130 | 9.3%), Educational Services (120 | 8.6%), and Accommodation & Food Services (120 | 8.6%).
Employment Industries by Sex in Bushnell
The Bushnell industries that see more men than women are Agriculture, Fishing & Hunting (100.0%), Construction (100.0%), and Wholesale Trade (100.0%), whereas the industries that tend to have a higher number of women are Information (100.0%), Professional & Scientific (100.0%), and Health Care & Social Assistance (85.5%).
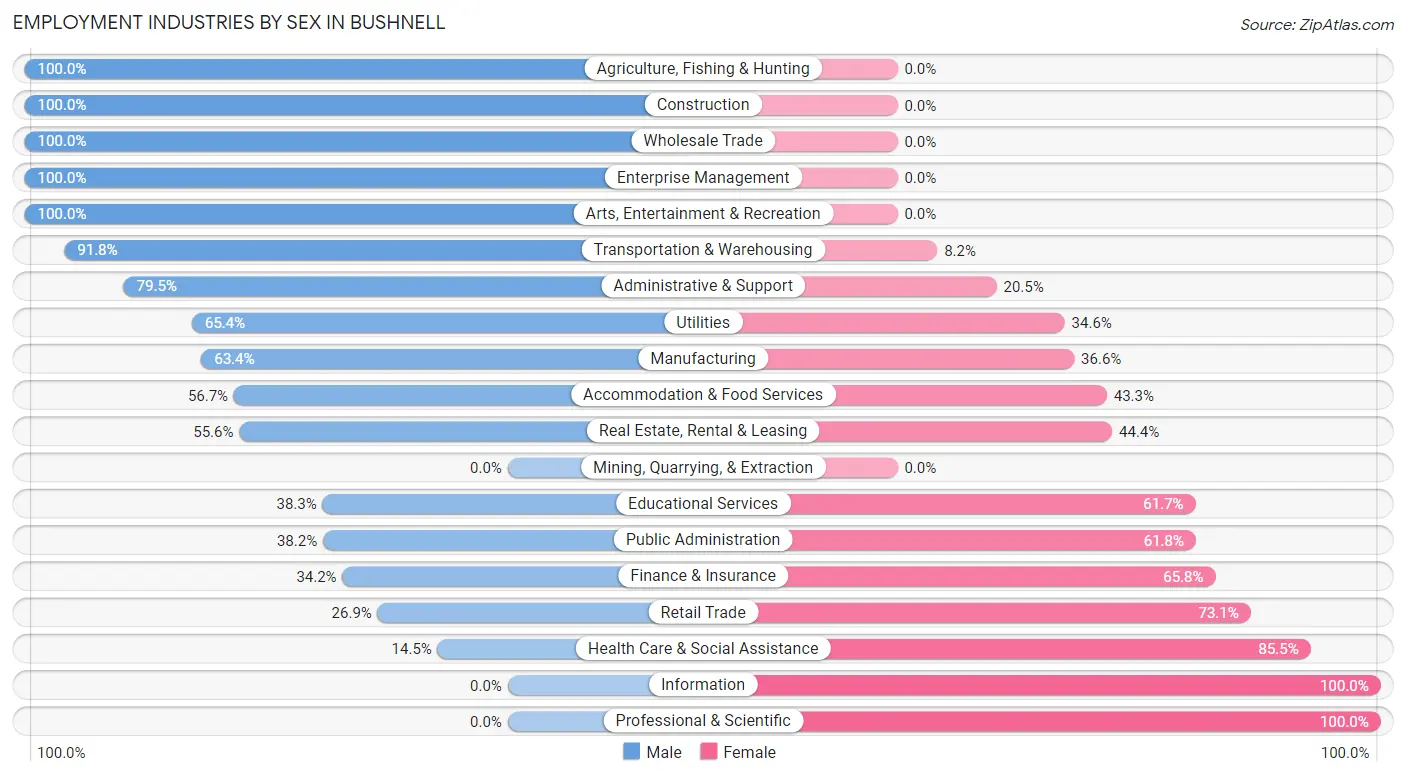
| Industry | Male | Female |
| Agriculture, Fishing & Hunting | 19 (100.0%) | 0 (0.0%) |
| Mining, Quarrying, & Extraction | 0 (0.0%) | 0 (0.0%) |
| Construction | 11 (100.0%) | 0 (0.0%) |
| Manufacturing | 215 (63.4%) | 124 (36.6%) |
| Wholesale Trade | 60 (100.0%) | 0 (0.0%) |
| Retail Trade | 35 (26.9%) | 95 (73.1%) |
| Transportation & Warehousing | 78 (91.8%) | 7 (8.2%) |
| Utilities | 17 (65.4%) | 9 (34.6%) |
| Information | 0 (0.0%) | 17 (100.0%) |
| Finance & Insurance | 13 (34.2%) | 25 (65.8%) |
| Real Estate, Rental & Leasing | 10 (55.6%) | 8 (44.4%) |
| Professional & Scientific | 0 (0.0%) | 61 (100.0%) |
| Enterprise Management | 6 (100.0%) | 0 (0.0%) |
| Administrative & Support | 31 (79.5%) | 8 (20.5%) |
| Educational Services | 46 (38.3%) | 74 (61.7%) |
| Health Care & Social Assistance | 29 (14.5%) | 171 (85.5%) |
| Arts, Entertainment & Recreation | 8 (100.0%) | 0 (0.0%) |
| Accommodation & Food Services | 68 (56.7%) | 52 (43.3%) |
| Public Administration | 26 (38.2%) | 42 (61.8%) |
| Total | 683 (49.1%) | 708 (50.9%) |
Education in Bushnell
School Enrollment in Bushnell
The most common levels of schooling among the 540 students in Bushnell are college / undergraduate (122 | 22.6%), high school (104 | 19.3%), and elementary school (99 | 18.3%).
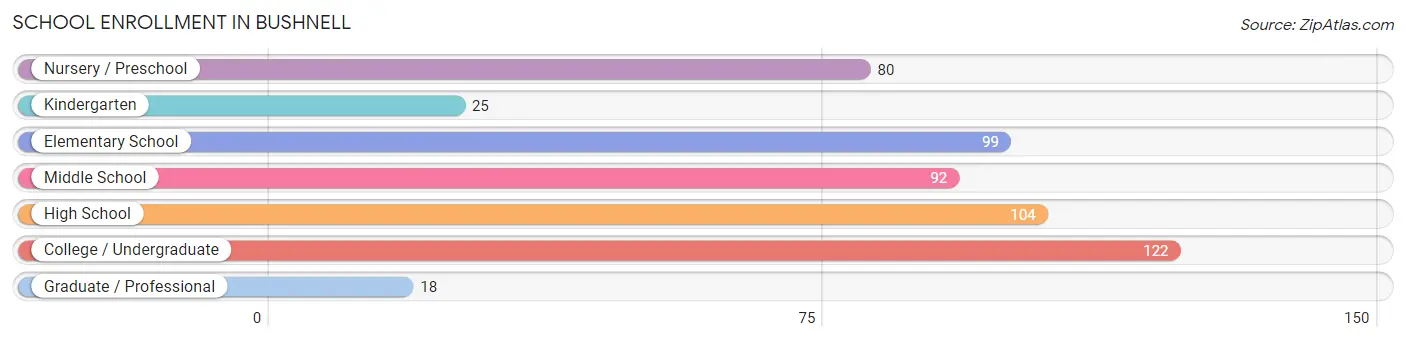
| School Level | # Students | % Students |
| Nursery / Preschool | 80 | 14.8% |
| Kindergarten | 25 | 4.6% |
| Elementary School | 99 | 18.3% |
| Middle School | 92 | 17.0% |
| High School | 104 | 19.3% |
| College / Undergraduate | 122 | 22.6% |
| Graduate / Professional | 18 | 3.3% |
| Total | 540 | 100.0% |
School Enrollment by Age by Funding Source in Bushnell
Out of a total of 540 students who are enrolled in schools in Bushnell, 35 (6.5%) attend a private institution, while the remaining 505 (93.5%) are enrolled in public schools. The age group of 35 years and over has the highest likelihood of being enrolled in private schools, with 9 (40.9% in the age bracket) enrolled. Conversely, the age group of 3 to 4 year olds has the lowest likelihood of being enrolled in a private school, with 80 (100.0% in the age bracket) attending a public institution.
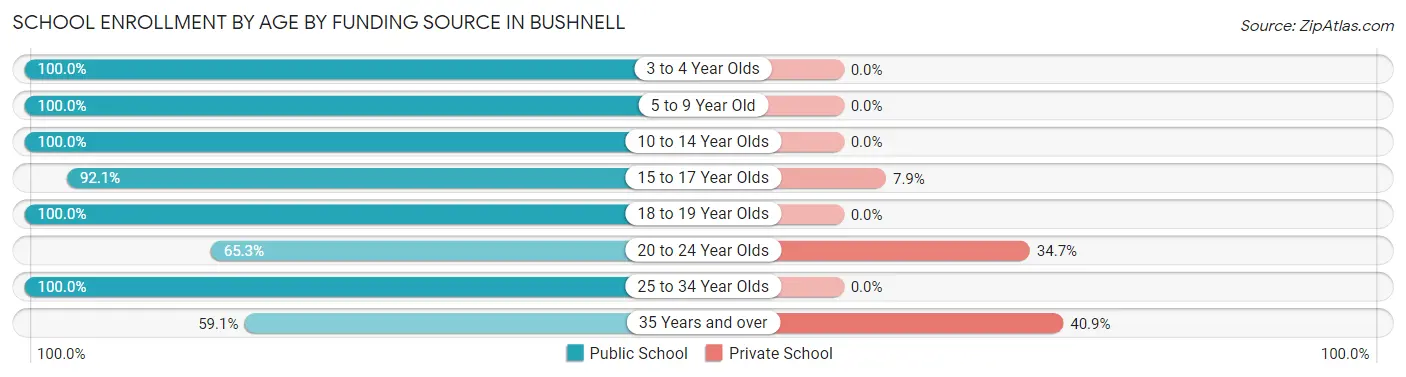
| Age Bracket | Public School | Private School |
| 3 to 4 Year Olds | 80 (100.0%) | 0 (0.0%) |
| 5 to 9 Year Old | 114 (100.0%) | 0 (0.0%) |
| 10 to 14 Year Olds | 92 (100.0%) | 0 (0.0%) |
| 15 to 17 Year Olds | 105 (92.1%) | 9 (7.9%) |
| 18 to 19 Year Olds | 33 (100.0%) | 0 (0.0%) |
| 20 to 24 Year Olds | 32 (65.3%) | 17 (34.7%) |
| 25 to 34 Year Olds | 36 (100.0%) | 0 (0.0%) |
| 35 Years and over | 13 (59.1%) | 9 (40.9%) |
| Total | 505 (93.5%) | 35 (6.5%) |
Educational Attainment by Field of Study in Bushnell
Social sciences (78 | 26.4%), communications (43 | 14.6%), arts & humanities (43 | 14.6%), business (35 | 11.9%), and science & technology (28 | 9.5%) are the most common fields of study among 295 individuals in Bushnell who have obtained a bachelor's degree or higher.
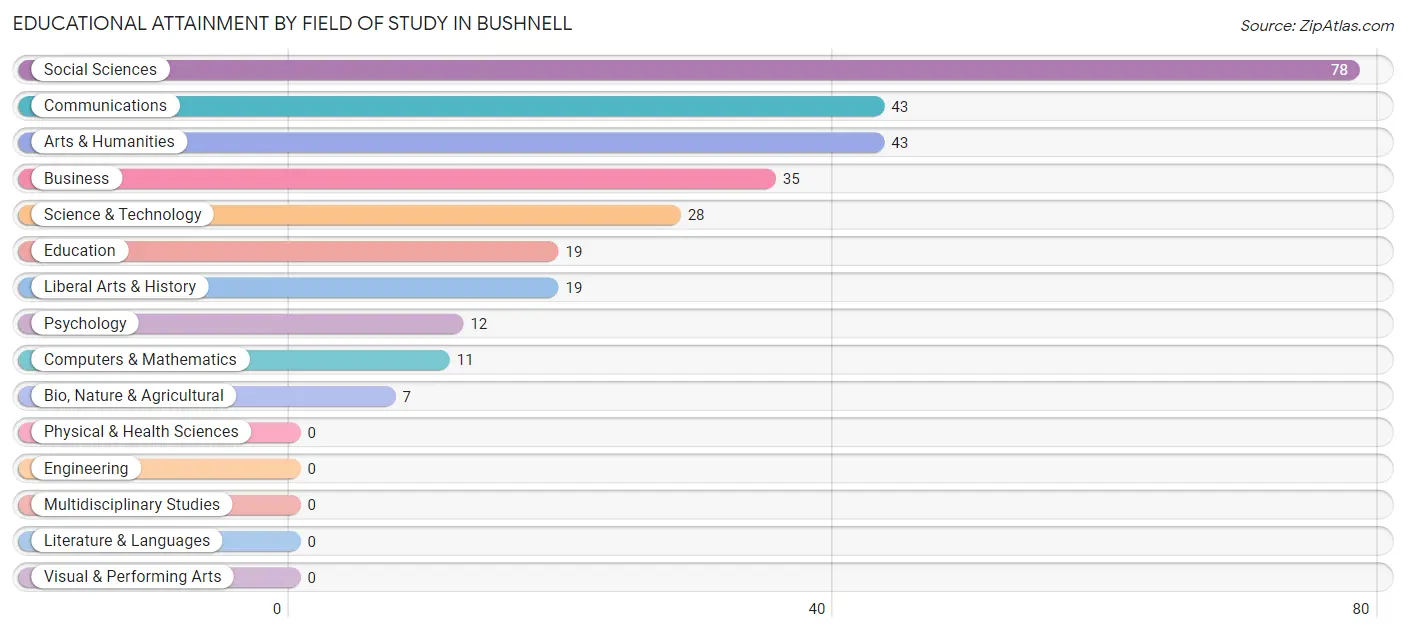
| Field of Study | # Graduates | % Graduates |
| Computers & Mathematics | 11 | 3.7% |
| Bio, Nature & Agricultural | 7 | 2.4% |
| Physical & Health Sciences | 0 | 0.0% |
| Psychology | 12 | 4.1% |
| Social Sciences | 78 | 26.4% |
| Engineering | 0 | 0.0% |
| Multidisciplinary Studies | 0 | 0.0% |
| Science & Technology | 28 | 9.5% |
| Business | 35 | 11.9% |
| Education | 19 | 6.4% |
| Literature & Languages | 0 | 0.0% |
| Liberal Arts & History | 19 | 6.4% |
| Visual & Performing Arts | 0 | 0.0% |
| Communications | 43 | 14.6% |
| Arts & Humanities | 43 | 14.6% |
| Total | 295 | 100.0% |
Transportation & Commute in Bushnell
Vehicle Availability by Sex in Bushnell
The most prevalent vehicle ownership categories in Bushnell are males with 2 vehicles (334, accounting for 50.1%) and females with 2 vehicles (222, making up 47.8%).
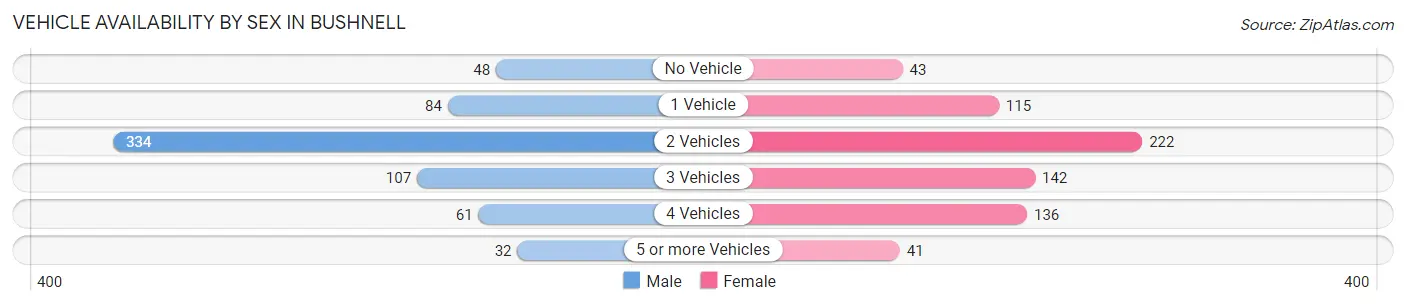
| Vehicles Available | Male | Female |
| No Vehicle | 48 (7.2%) | 43 (6.1%) |
| 1 Vehicle | 84 (12.6%) | 115 (16.5%) |
| 2 Vehicles | 334 (50.1%) | 222 (31.8%) |
| 3 Vehicles | 107 (16.1%) | 142 (20.3%) |
| 4 Vehicles | 61 (9.2%) | 136 (19.5%) |
| 5 or more Vehicles | 32 (4.8%) | 41 (5.9%) |
| Total | 666 (100.0%) | 699 (100.0%) |
Commute Time in Bushnell
The most frequently occuring commute durations in Bushnell are 20 to 24 minutes (258 commuters, 19.2%), 5 to 9 minutes (199 commuters, 14.8%), and 15 to 19 minutes (164 commuters, 12.2%).
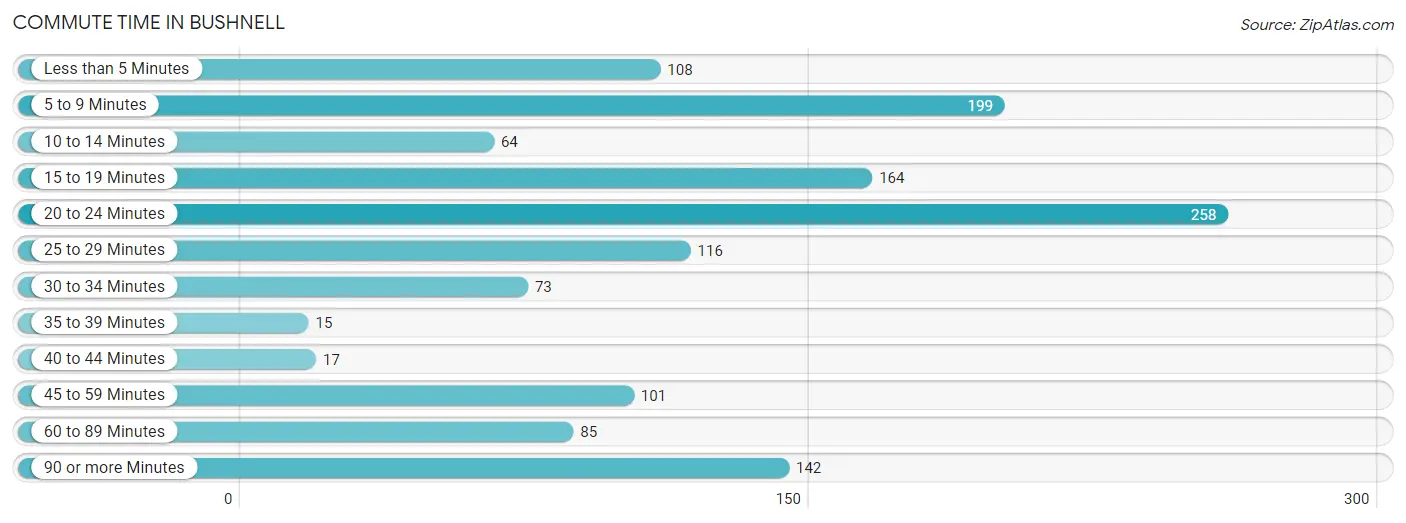
| Commute Time | # Commuters | % Commuters |
| Less than 5 Minutes | 108 | 8.1% |
| 5 to 9 Minutes | 199 | 14.8% |
| 10 to 14 Minutes | 64 | 4.8% |
| 15 to 19 Minutes | 164 | 12.2% |
| 20 to 24 Minutes | 258 | 19.2% |
| 25 to 29 Minutes | 116 | 8.6% |
| 30 to 34 Minutes | 73 | 5.4% |
| 35 to 39 Minutes | 15 | 1.1% |
| 40 to 44 Minutes | 17 | 1.3% |
| 45 to 59 Minutes | 101 | 7.5% |
| 60 to 89 Minutes | 85 | 6.3% |
| 90 or more Minutes | 142 | 10.6% |
Commute Time by Sex in Bushnell
The most common commute times in Bushnell are 20 to 24 minutes (163 commuters, 24.1%) for males and 5 to 9 minutes (137 commuters, 20.6%) for females.
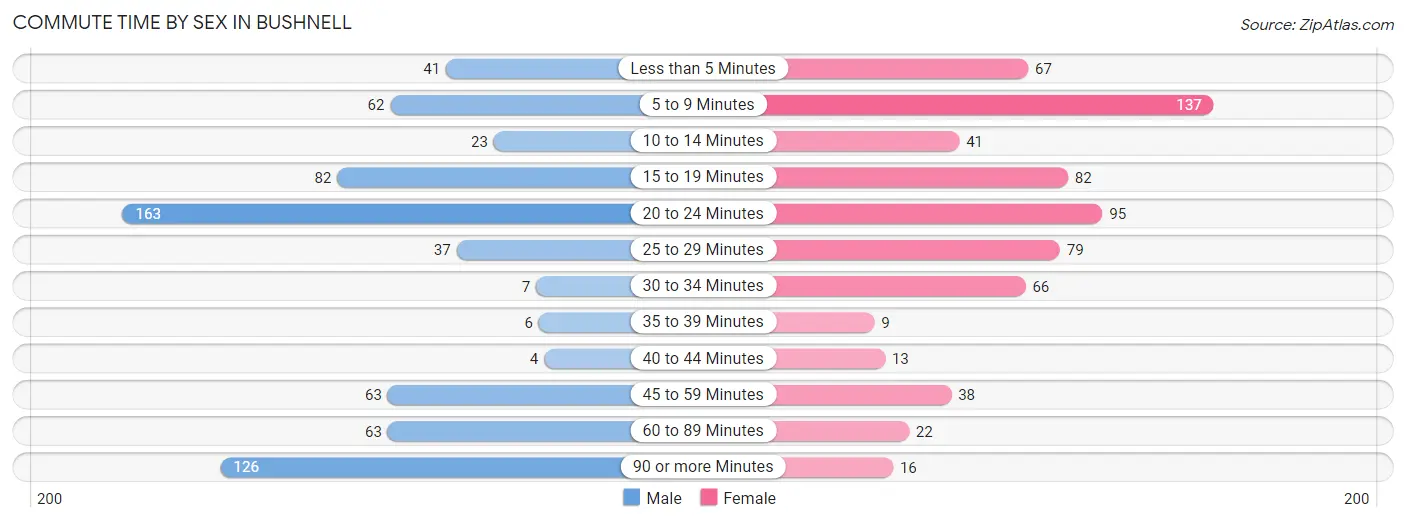
| Commute Time | Male | Female |
| Less than 5 Minutes | 41 (6.1%) | 67 (10.1%) |
| 5 to 9 Minutes | 62 (9.2%) | 137 (20.6%) |
| 10 to 14 Minutes | 23 (3.4%) | 41 (6.2%) |
| 15 to 19 Minutes | 82 (12.1%) | 82 (12.3%) |
| 20 to 24 Minutes | 163 (24.1%) | 95 (14.3%) |
| 25 to 29 Minutes | 37 (5.5%) | 79 (11.9%) |
| 30 to 34 Minutes | 7 (1.0%) | 66 (9.9%) |
| 35 to 39 Minutes | 6 (0.9%) | 9 (1.3%) |
| 40 to 44 Minutes | 4 (0.6%) | 13 (1.9%) |
| 45 to 59 Minutes | 63 (9.3%) | 38 (5.7%) |
| 60 to 89 Minutes | 63 (9.3%) | 22 (3.3%) |
| 90 or more Minutes | 126 (18.6%) | 16 (2.4%) |
Time of Departure to Work by Sex in Bushnell
The most frequent times of departure to work in Bushnell are 7:00 AM to 7:29 AM (185, 27.3%) for males and 5:30 AM to 5:59 AM (141, 21.2%) for females.
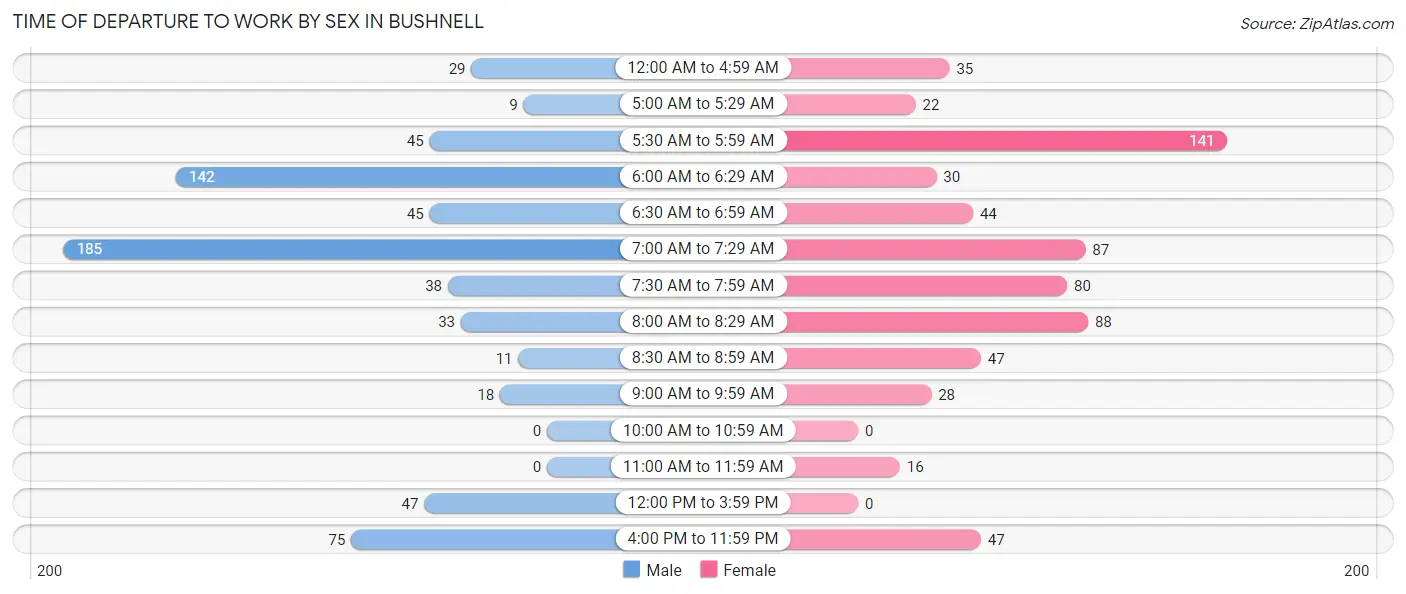
| Time of Departure | Male | Female |
| 12:00 AM to 4:59 AM | 29 (4.3%) | 35 (5.3%) |
| 5:00 AM to 5:29 AM | 9 (1.3%) | 22 (3.3%) |
| 5:30 AM to 5:59 AM | 45 (6.7%) | 141 (21.2%) |
| 6:00 AM to 6:29 AM | 142 (21.0%) | 30 (4.5%) |
| 6:30 AM to 6:59 AM | 45 (6.7%) | 44 (6.6%) |
| 7:00 AM to 7:29 AM | 185 (27.3%) | 87 (13.1%) |
| 7:30 AM to 7:59 AM | 38 (5.6%) | 80 (12.0%) |
| 8:00 AM to 8:29 AM | 33 (4.9%) | 88 (13.2%) |
| 8:30 AM to 8:59 AM | 11 (1.6%) | 47 (7.1%) |
| 9:00 AM to 9:59 AM | 18 (2.7%) | 28 (4.2%) |
| 10:00 AM to 10:59 AM | 0 (0.0%) | 0 (0.0%) |
| 11:00 AM to 11:59 AM | 0 (0.0%) | 16 (2.4%) |
| 12:00 PM to 3:59 PM | 47 (6.9%) | 0 (0.0%) |
| 4:00 PM to 11:59 PM | 75 (11.1%) | 47 (7.1%) |
| Total | 677 (100.0%) | 665 (100.0%) |
Housing Occupancy in Bushnell
Occupancy by Ownership in Bushnell
Of the total 1,190 dwellings in Bushnell, owner-occupied units account for 852 (71.6%), while renter-occupied units make up 338 (28.4%).
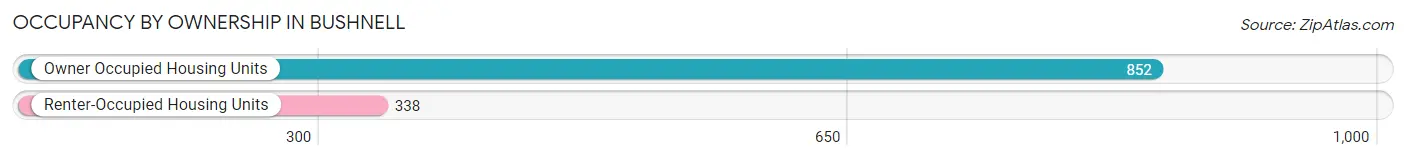
| Occupancy | # Housing Units | % Housing Units |
| Owner Occupied Housing Units | 852 | 71.6% |
| Renter-Occupied Housing Units | 338 | 28.4% |
| Total Occupied Housing Units | 1,190 | 100.0% |
Occupancy by Household Size in Bushnell
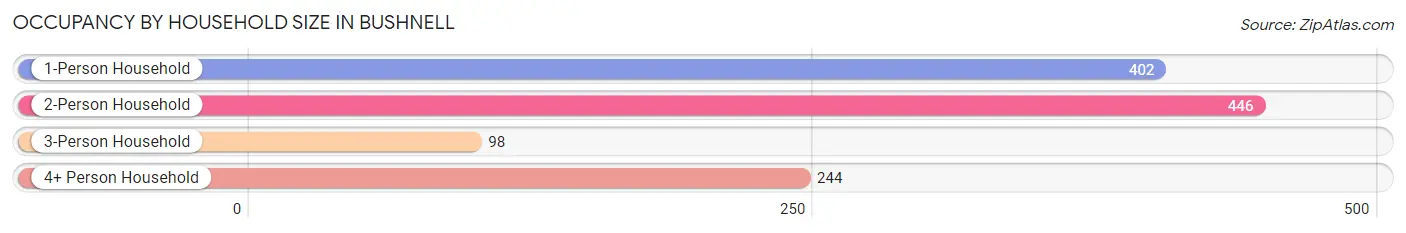
| Household Size | # Housing Units | % Housing Units |
| 1-Person Household | 402 | 33.8% |
| 2-Person Household | 446 | 37.5% |
| 3-Person Household | 98 | 8.2% |
| 4+ Person Household | 244 | 20.5% |
| Total Housing Units | 1,190 | 100.0% |
Occupancy by Ownership by Household Size in Bushnell
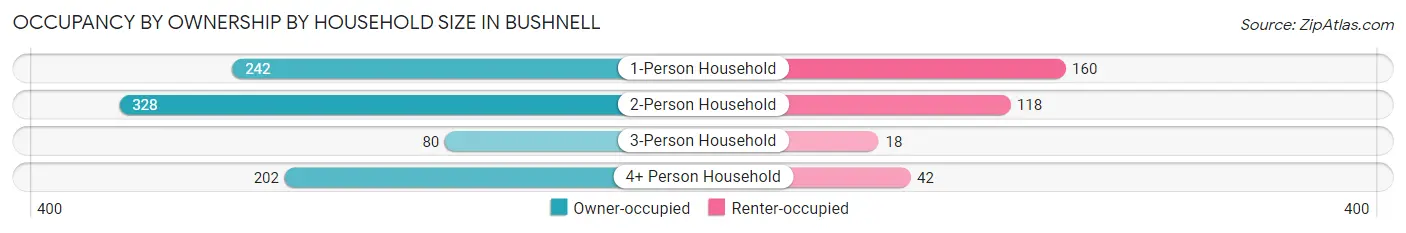
| Household Size | Owner-occupied | Renter-occupied |
| 1-Person Household | 242 (60.2%) | 160 (39.8%) |
| 2-Person Household | 328 (73.5%) | 118 (26.5%) |
| 3-Person Household | 80 (81.6%) | 18 (18.4%) |
| 4+ Person Household | 202 (82.8%) | 42 (17.2%) |
| Total Housing Units | 852 (71.6%) | 338 (28.4%) |
Occupancy by Educational Attainment in Bushnell
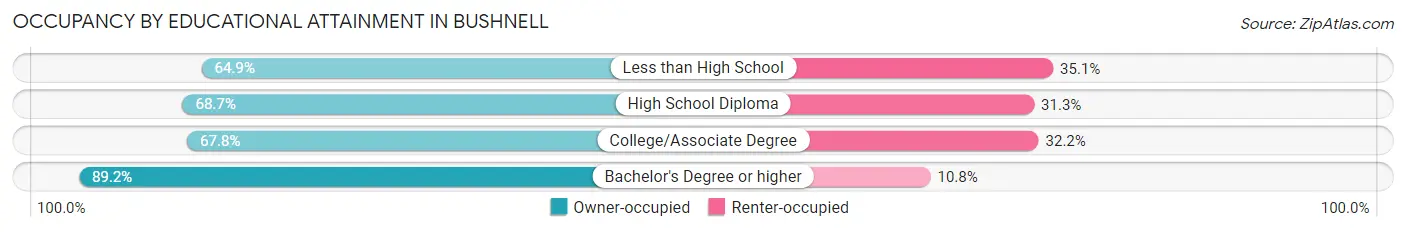
| Household Size | Owner-occupied | Renter-occupied |
| Less than High School | 74 (64.9%) | 40 (35.1%) |
| High School Diploma | 375 (68.7%) | 171 (31.3%) |
| College/Associate Degree | 221 (67.8%) | 105 (32.2%) |
| Bachelor's Degree or higher | 182 (89.2%) | 22 (10.8%) |
Occupancy by Age of Householder in Bushnell
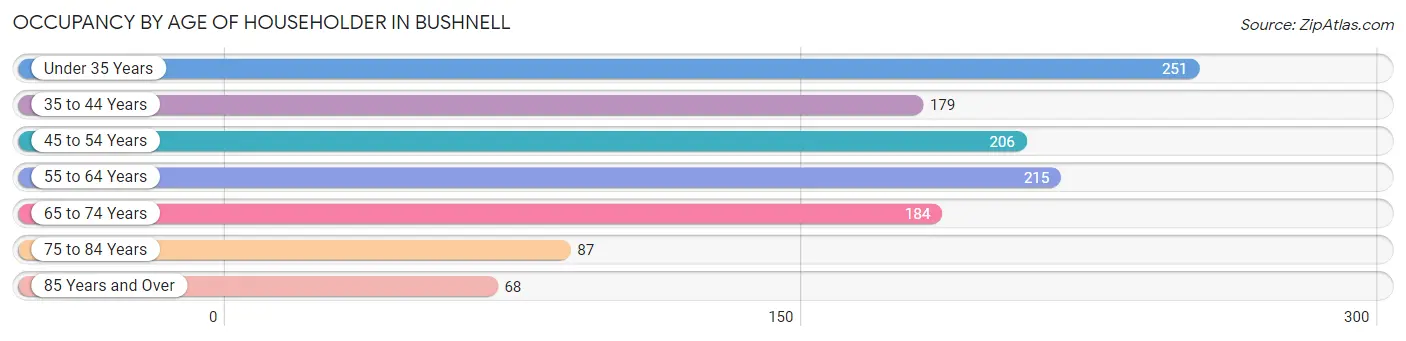
| Age Bracket | # Households | % Households |
| Under 35 Years | 251 | 21.1% |
| 35 to 44 Years | 179 | 15.0% |
| 45 to 54 Years | 206 | 17.3% |
| 55 to 64 Years | 215 | 18.1% |
| 65 to 74 Years | 184 | 15.5% |
| 75 to 84 Years | 87 | 7.3% |
| 85 Years and Over | 68 | 5.7% |
| Total | 1,190 | 100.0% |
Housing Finances in Bushnell
Median Income by Occupancy in Bushnell
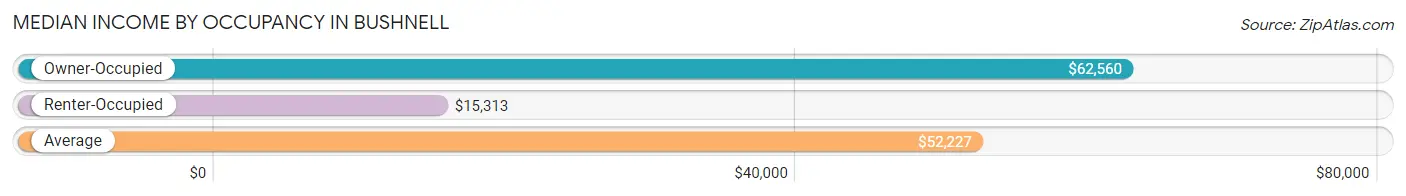
| Occupancy Type | # Households | Median Income |
| Owner-Occupied | 852 (71.6%) | $62,560 |
| Renter-Occupied | 338 (28.4%) | $15,313 |
| Average | 1,190 (100.0%) | $52,227 |
Occupancy by Householder Income Bracket in Bushnell
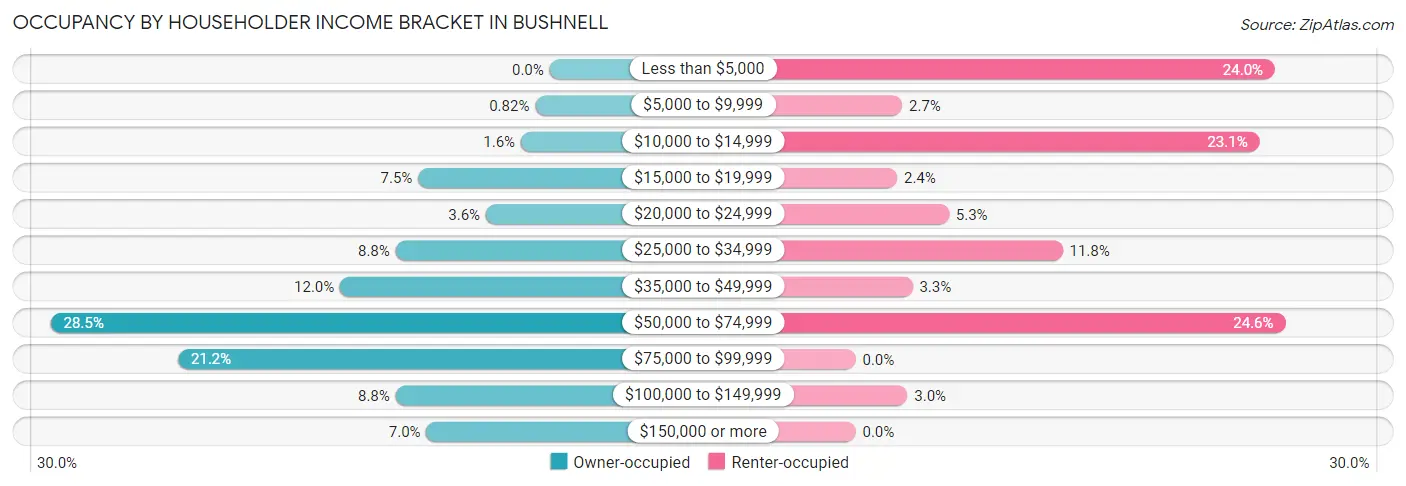
| Income Bracket | Owner-occupied | Renter-occupied |
| Less than $5,000 | 0 (0.0%) | 81 (24.0%) |
| $5,000 to $9,999 | 7 (0.8%) | 9 (2.7%) |
| $10,000 to $14,999 | 14 (1.6%) | 78 (23.1%) |
| $15,000 to $19,999 | 64 (7.5%) | 8 (2.4%) |
| $20,000 to $24,999 | 31 (3.6%) | 18 (5.3%) |
| $25,000 to $34,999 | 75 (8.8%) | 40 (11.8%) |
| $35,000 to $49,999 | 102 (12.0%) | 11 (3.3%) |
| $50,000 to $74,999 | 243 (28.5%) | 83 (24.6%) |
| $75,000 to $99,999 | 181 (21.2%) | 0 (0.0%) |
| $100,000 to $149,999 | 75 (8.8%) | 10 (3.0%) |
| $150,000 or more | 60 (7.0%) | 0 (0.0%) |
| Total | 852 (100.0%) | 338 (100.0%) |
Monthly Housing Cost Tiers in Bushnell
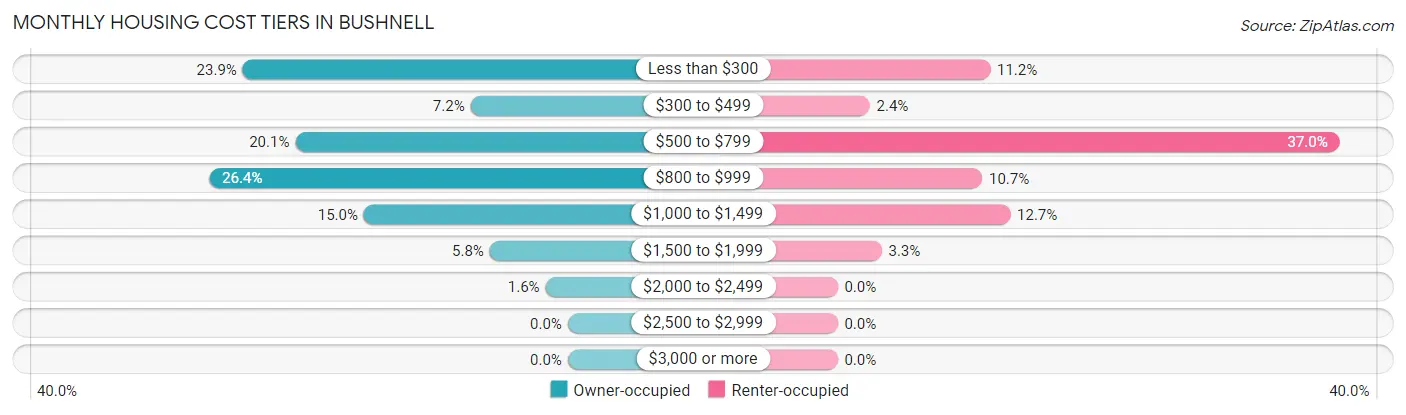
| Monthly Cost | Owner-occupied | Renter-occupied |
| Less than $300 | 204 (23.9%) | 38 (11.2%) |
| $300 to $499 | 61 (7.2%) | 8 (2.4%) |
| $500 to $799 | 171 (20.1%) | 125 (37.0%) |
| $800 to $999 | 225 (26.4%) | 36 (10.6%) |
| $1,000 to $1,499 | 128 (15.0%) | 43 (12.7%) |
| $1,500 to $1,999 | 49 (5.8%) | 11 (3.3%) |
| $2,000 to $2,499 | 14 (1.6%) | 0 (0.0%) |
| $2,500 to $2,999 | 0 (0.0%) | 0 (0.0%) |
| $3,000 or more | 0 (0.0%) | 0 (0.0%) |
| Total | 852 (100.0%) | 338 (100.0%) |
Physical Housing Characteristics in Bushnell
Housing Structures in Bushnell
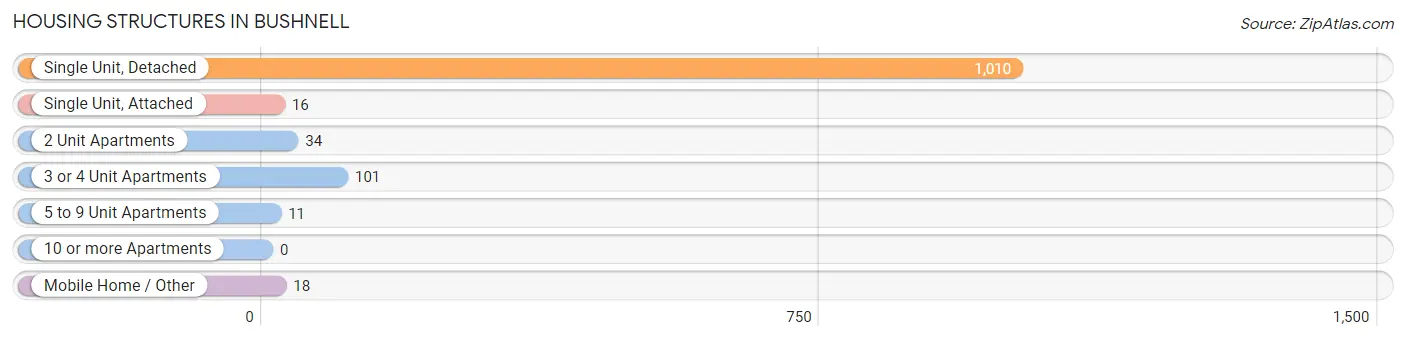
| Structure Type | # Housing Units | % Housing Units |
| Single Unit, Detached | 1,010 | 84.9% |
| Single Unit, Attached | 16 | 1.3% |
| 2 Unit Apartments | 34 | 2.9% |
| 3 or 4 Unit Apartments | 101 | 8.5% |
| 5 to 9 Unit Apartments | 11 | 0.9% |
| 10 or more Apartments | 0 | 0.0% |
| Mobile Home / Other | 18 | 1.5% |
| Total | 1,190 | 100.0% |
Housing Structures by Occupancy in Bushnell
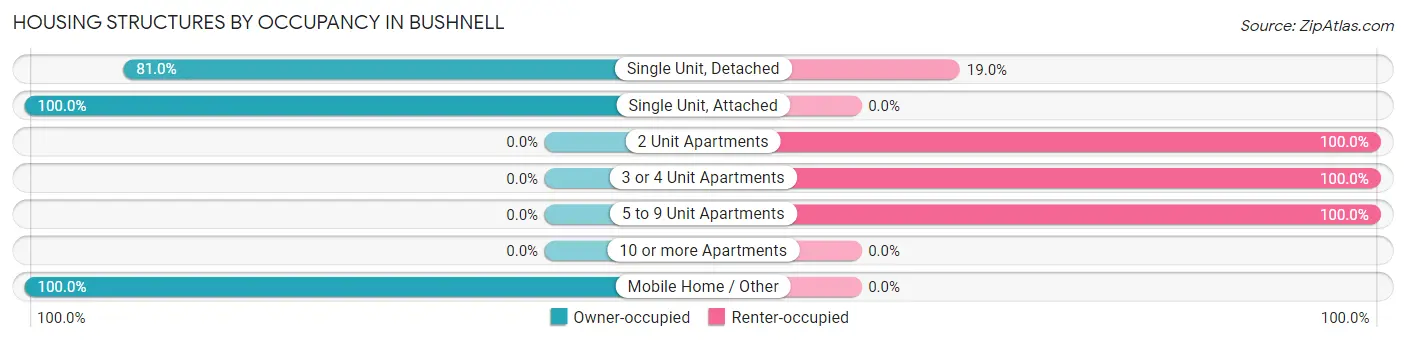
| Structure Type | Owner-occupied | Renter-occupied |
| Single Unit, Detached | 818 (81.0%) | 192 (19.0%) |
| Single Unit, Attached | 16 (100.0%) | 0 (0.0%) |
| 2 Unit Apartments | 0 (0.0%) | 34 (100.0%) |
| 3 or 4 Unit Apartments | 0 (0.0%) | 101 (100.0%) |
| 5 to 9 Unit Apartments | 0 (0.0%) | 11 (100.0%) |
| 10 or more Apartments | 0 (0.0%) | 0 (0.0%) |
| Mobile Home / Other | 18 (100.0%) | 0 (0.0%) |
| Total | 852 (71.6%) | 338 (28.4%) |
Housing Structures by Number of Rooms in Bushnell
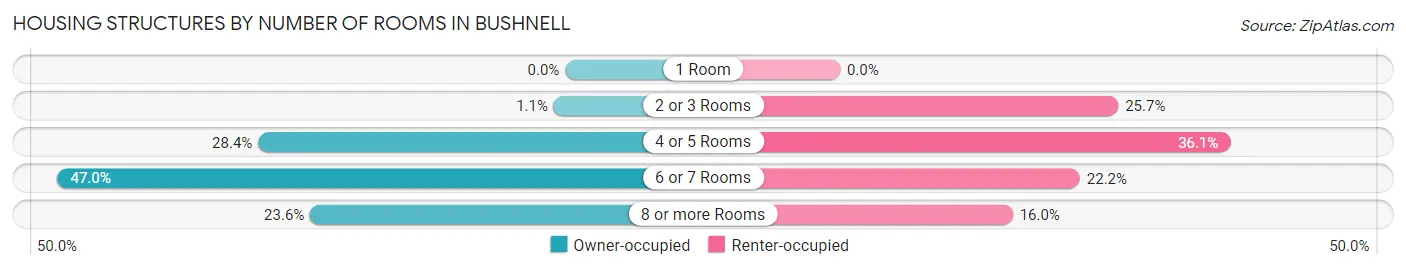
| Number of Rooms | Owner-occupied | Renter-occupied |
| 1 Room | 0 (0.0%) | 0 (0.0%) |
| 2 or 3 Rooms | 9 (1.1%) | 87 (25.7%) |
| 4 or 5 Rooms | 242 (28.4%) | 122 (36.1%) |
| 6 or 7 Rooms | 400 (46.9%) | 75 (22.2%) |
| 8 or more Rooms | 201 (23.6%) | 54 (16.0%) |
| Total | 852 (100.0%) | 338 (100.0%) |
Housing Structure by Heating Type in Bushnell
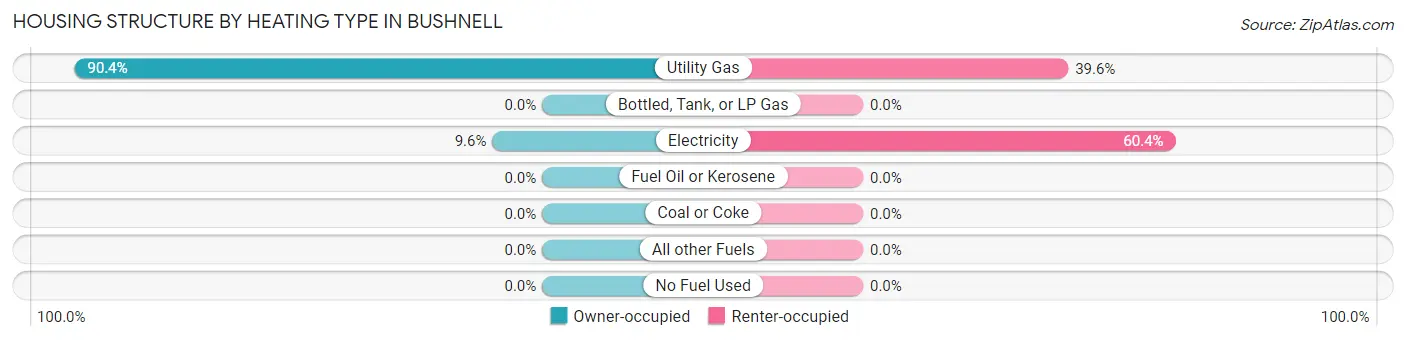
| Heating Type | Owner-occupied | Renter-occupied |
| Utility Gas | 770 (90.4%) | 134 (39.6%) |
| Bottled, Tank, or LP Gas | 0 (0.0%) | 0 (0.0%) |
| Electricity | 82 (9.6%) | 204 (60.4%) |
| Fuel Oil or Kerosene | 0 (0.0%) | 0 (0.0%) |
| Coal or Coke | 0 (0.0%) | 0 (0.0%) |
| All other Fuels | 0 (0.0%) | 0 (0.0%) |
| No Fuel Used | 0 (0.0%) | 0 (0.0%) |
| Total | 852 (100.0%) | 338 (100.0%) |
Household Vehicle Usage in Bushnell
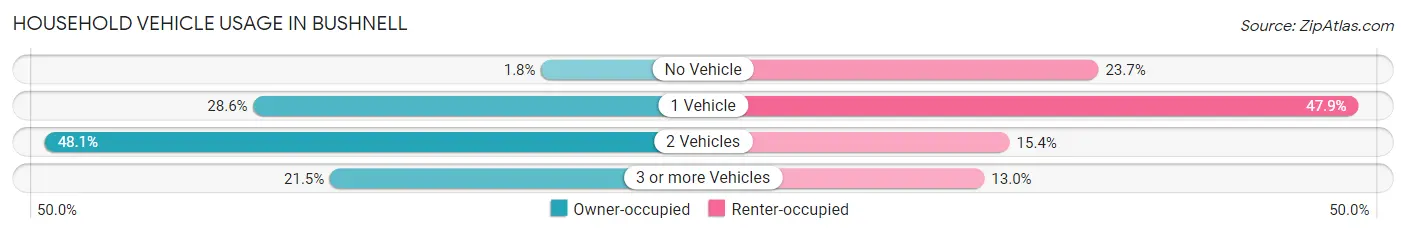
| Vehicles per Household | Owner-occupied | Renter-occupied |
| No Vehicle | 15 (1.8%) | 80 (23.7%) |
| 1 Vehicle | 244 (28.6%) | 162 (47.9%) |
| 2 Vehicles | 410 (48.1%) | 52 (15.4%) |
| 3 or more Vehicles | 183 (21.5%) | 44 (13.0%) |
| Total | 852 (100.0%) | 338 (100.0%) |
Real Estate & Mortgages in Bushnell
Real Estate and Mortgage Overview in Bushnell
| Characteristic | Without Mortgage | With Mortgage |
| Housing Units | 383 | 469 |
| Median Property Value | $59,900 | $89,400 |
| Median Household Income | $44,940 | $60 |
| Monthly Housing Costs | $290 | $0 |
| Real Estate Taxes | $770 | $16 |
Property Value by Mortgage Status in Bushnell
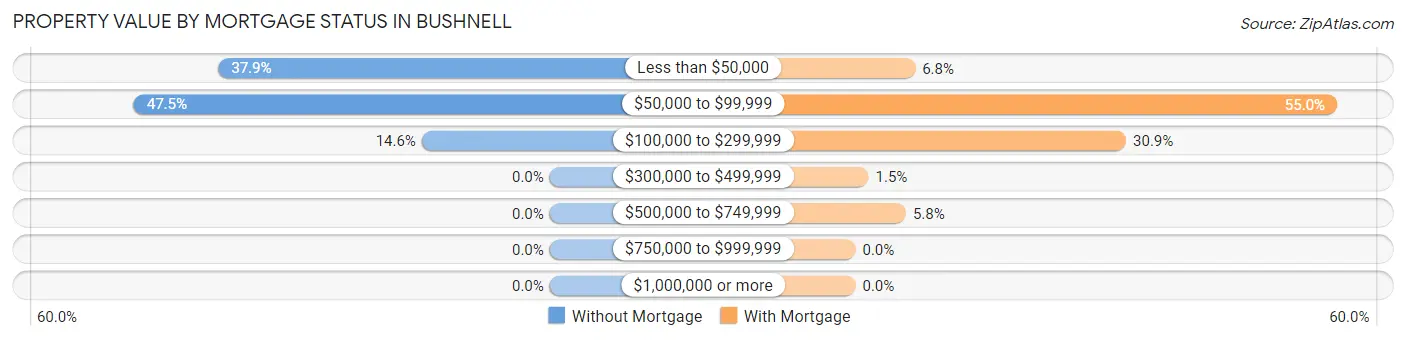
| Property Value | Without Mortgage | With Mortgage |
| Less than $50,000 | 145 (37.9%) | 32 (6.8%) |
| $50,000 to $99,999 | 182 (47.5%) | 258 (55.0%) |
| $100,000 to $299,999 | 56 (14.6%) | 145 (30.9%) |
| $300,000 to $499,999 | 0 (0.0%) | 7 (1.5%) |
| $500,000 to $749,999 | 0 (0.0%) | 27 (5.8%) |
| $750,000 to $999,999 | 0 (0.0%) | 0 (0.0%) |
| $1,000,000 or more | 0 (0.0%) | 0 (0.0%) |
| Total | 383 (100.0%) | 469 (100.0%) |
Household Income by Mortgage Status in Bushnell
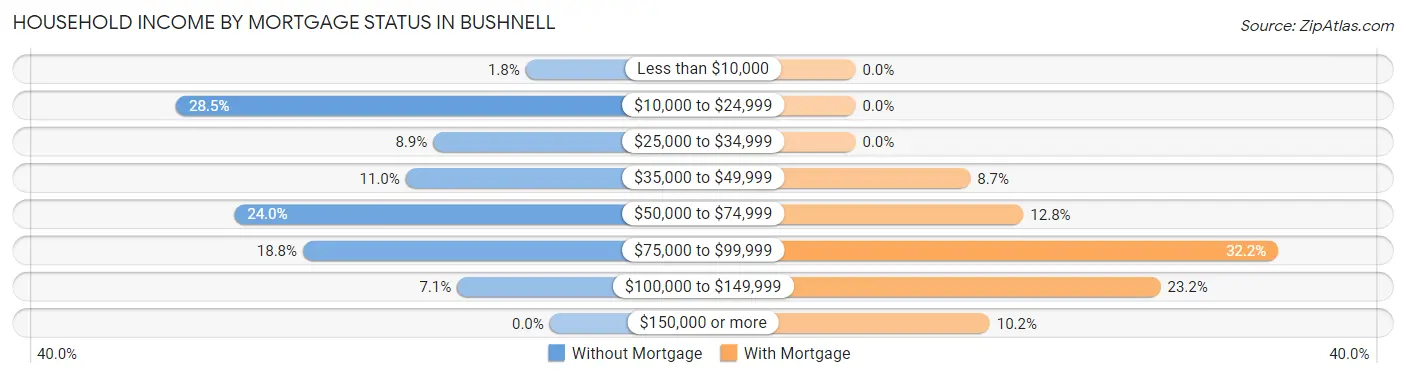
| Household Income | Without Mortgage | With Mortgage |
| Less than $10,000 | 7 (1.8%) | 0 (0.0%) |
| $10,000 to $24,999 | 109 (28.5%) | 0 (0.0%) |
| $25,000 to $34,999 | 34 (8.9%) | 0 (0.0%) |
| $35,000 to $49,999 | 42 (11.0%) | 41 (8.7%) |
| $50,000 to $74,999 | 92 (24.0%) | 60 (12.8%) |
| $75,000 to $99,999 | 72 (18.8%) | 151 (32.2%) |
| $100,000 to $149,999 | 27 (7.0%) | 109 (23.2%) |
| $150,000 or more | 0 (0.0%) | 48 (10.2%) |
| Total | 383 (100.0%) | 469 (100.0%) |
Property Value to Household Income Ratio in Bushnell
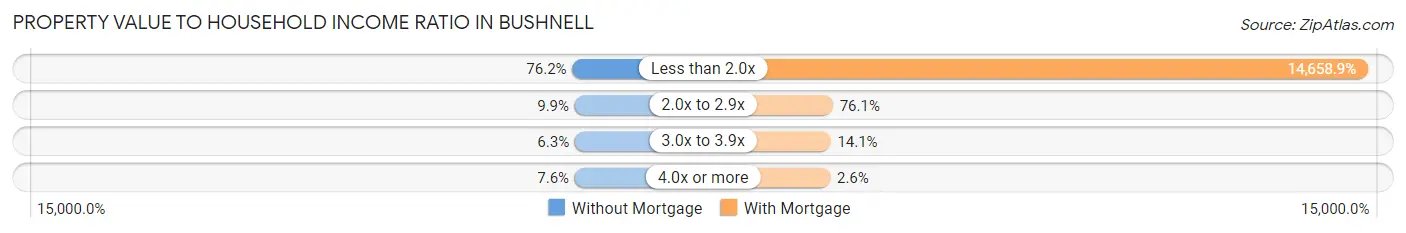
| Value-to-Income Ratio | Without Mortgage | With Mortgage |
| Less than 2.0x | 292 (76.2%) | 68,750 (14,658.9%) |
| 2.0x to 2.9x | 38 (9.9%) | 357 (76.1%) |
| 3.0x to 3.9x | 24 (6.3%) | 66 (14.1%) |
| 4.0x or more | 29 (7.6%) | 12 (2.6%) |
| Total | 383 (100.0%) | 469 (100.0%) |
Real Estate Taxes by Mortgage Status in Bushnell
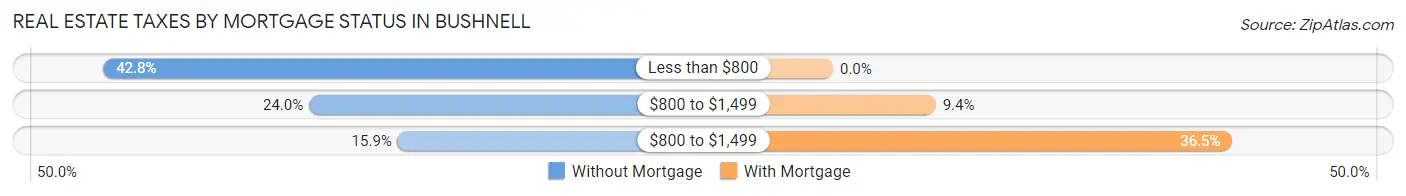
| Property Taxes | Without Mortgage | With Mortgage |
| Less than $800 | 164 (42.8%) | 0 (0.0%) |
| $800 to $1,499 | 92 (24.0%) | 44 (9.4%) |
| $800 to $1,499 | 61 (15.9%) | 171 (36.5%) |
| Total | 383 (100.0%) | 469 (100.0%) |
Health & Disability in Bushnell
Health Insurance Coverage by Age in Bushnell
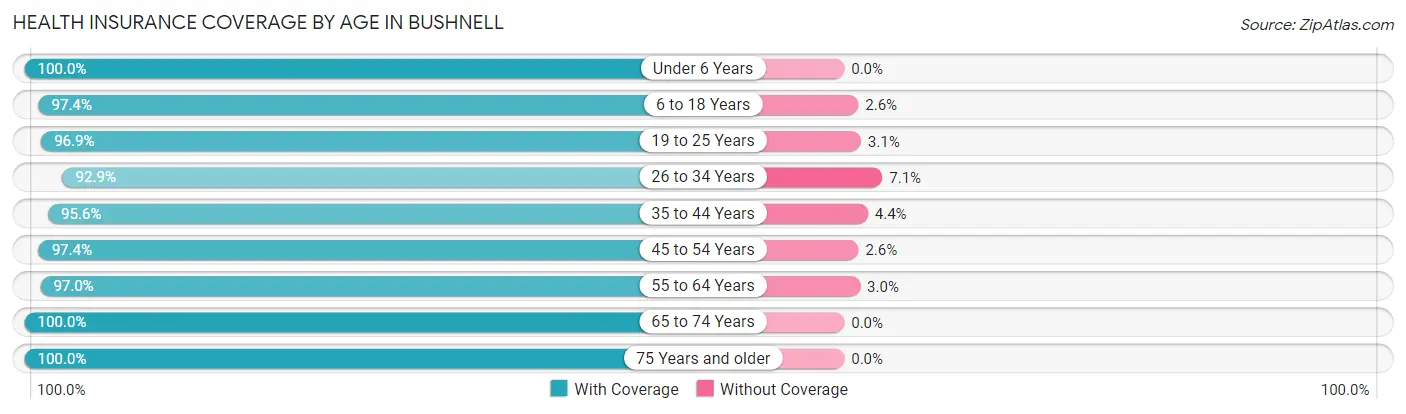
| Age Bracket | With Coverage | Without Coverage |
| Under 6 Years | 243 (100.0%) | 0 (0.0%) |
| 6 to 18 Years | 335 (97.4%) | 9 (2.6%) |
| 19 to 25 Years | 313 (96.9%) | 10 (3.1%) |
| 26 to 34 Years | 301 (92.9%) | 23 (7.1%) |
| 35 to 44 Years | 283 (95.6%) | 13 (4.4%) |
| 45 to 54 Years | 406 (97.4%) | 11 (2.6%) |
| 55 to 64 Years | 394 (97.0%) | 12 (3.0%) |
| 65 to 74 Years | 305 (100.0%) | 0 (0.0%) |
| 75 Years and older | 192 (100.0%) | 0 (0.0%) |
| Total | 2,772 (97.3%) | 78 (2.7%) |
Health Insurance Coverage by Citizenship Status in Bushnell
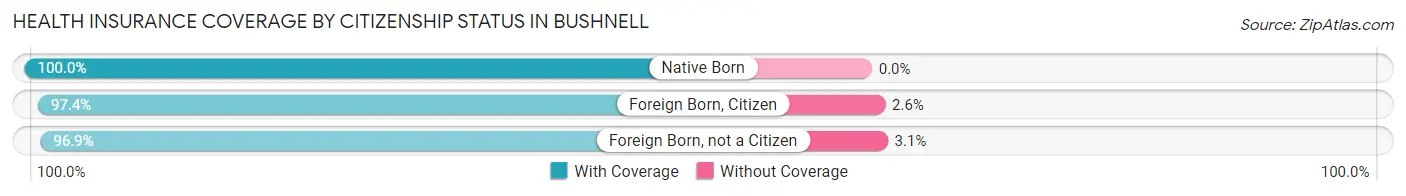
| Citizenship Status | With Coverage | Without Coverage |
| Native Born | 243 (100.0%) | 0 (0.0%) |
| Foreign Born, Citizen | 335 (97.4%) | 9 (2.6%) |
| Foreign Born, not a Citizen | 313 (96.9%) | 10 (3.1%) |
Health Insurance Coverage by Household Income in Bushnell
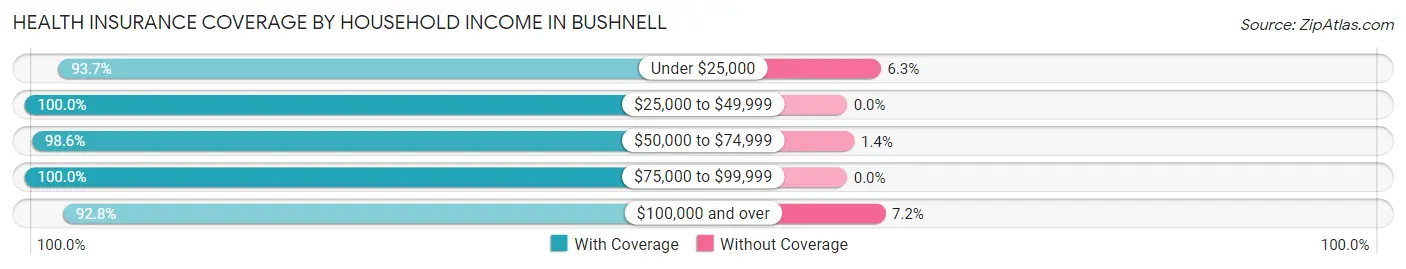
| Household Income | With Coverage | Without Coverage |
| Under $25,000 | 416 (93.7%) | 28 (6.3%) |
| $25,000 to $49,999 | 440 (100.0%) | 0 (0.0%) |
| $50,000 to $74,999 | 864 (98.6%) | 12 (1.4%) |
| $75,000 to $99,999 | 528 (100.0%) | 0 (0.0%) |
| $100,000 and over | 491 (92.8%) | 38 (7.2%) |
Public vs Private Health Insurance Coverage by Age in Bushnell
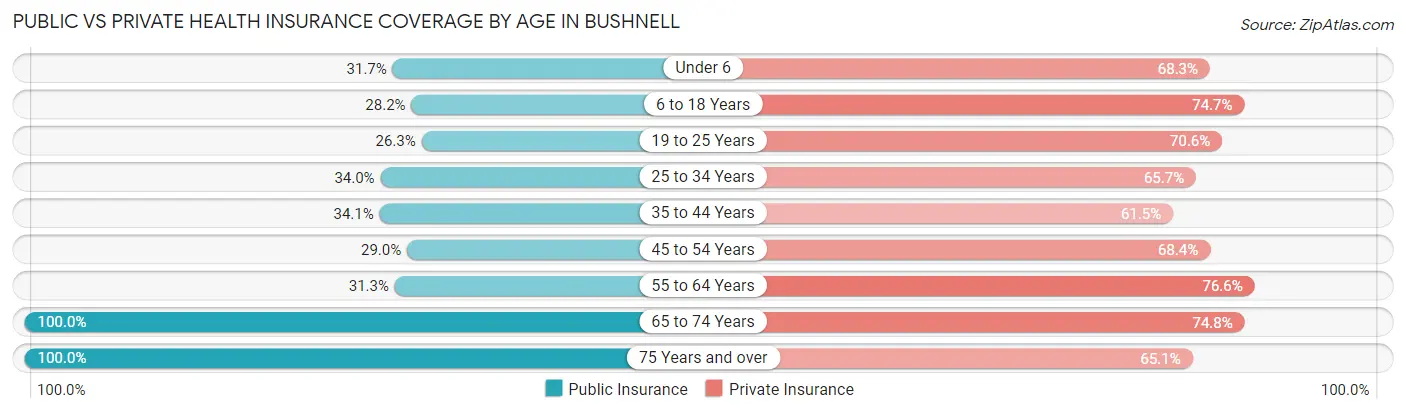
| Age Bracket | Public Insurance | Private Insurance |
| Under 6 | 77 (31.7%) | 166 (68.3%) |
| 6 to 18 Years | 97 (28.2%) | 257 (74.7%) |
| 19 to 25 Years | 85 (26.3%) | 228 (70.6%) |
| 25 to 34 Years | 110 (34.0%) | 213 (65.7%) |
| 35 to 44 Years | 101 (34.1%) | 182 (61.5%) |
| 45 to 54 Years | 121 (29.0%) | 285 (68.3%) |
| 55 to 64 Years | 127 (31.3%) | 311 (76.6%) |
| 65 to 74 Years | 305 (100.0%) | 228 (74.8%) |
| 75 Years and over | 192 (100.0%) | 125 (65.1%) |
| Total | 1,215 (42.6%) | 1,995 (70.0%) |
Disability Status by Sex by Age in Bushnell
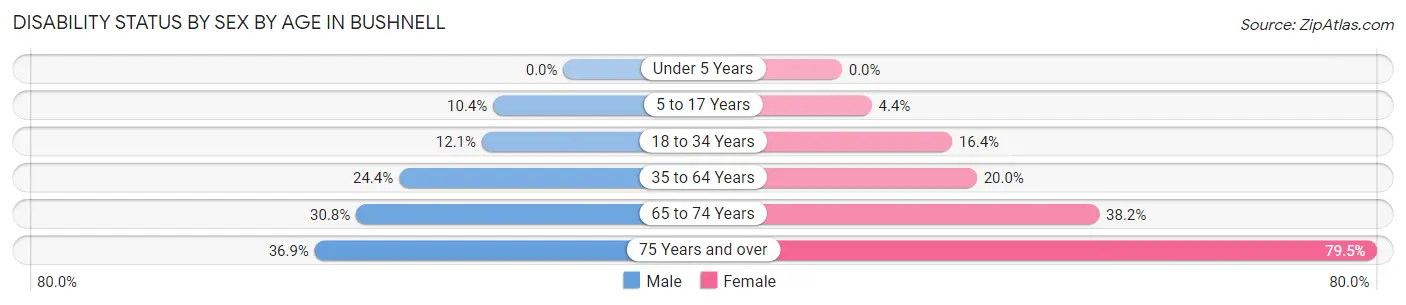
| Age Bracket | Male | Female |
| Under 5 Years | 0 (0.0%) | 0 (0.0%) |
| 5 to 17 Years | 17 (10.4%) | 8 (4.4%) |
| 18 to 34 Years | 45 (12.1%) | 45 (16.4%) |
| 35 to 64 Years | 111 (24.4%) | 133 (20.0%) |
| 65 to 74 Years | 56 (30.8%) | 47 (38.2%) |
| 75 Years and over | 24 (36.9%) | 101 (79.5%) |
Disability Class by Sex by Age in Bushnell
Disability Class: Hearing Difficulty
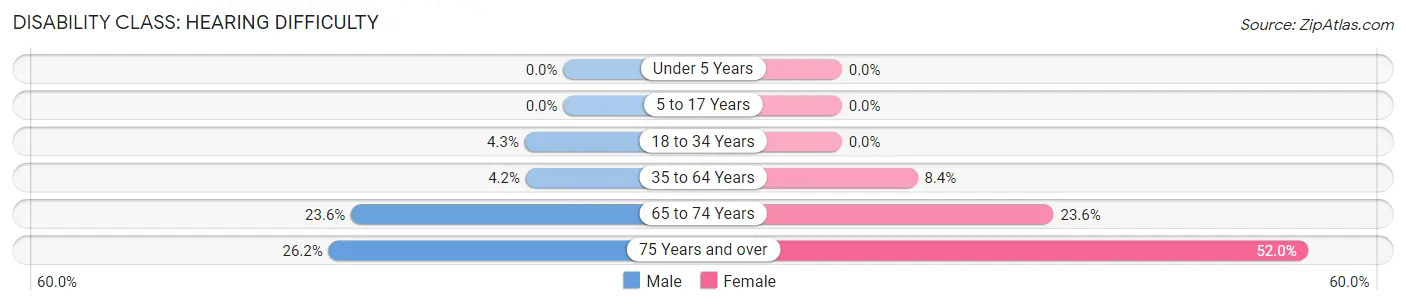
| Age Bracket | Male | Female |
| Under 5 Years | 0 (0.0%) | 0 (0.0%) |
| 5 to 17 Years | 0 (0.0%) | 0 (0.0%) |
| 18 to 34 Years | 16 (4.3%) | 0 (0.0%) |
| 35 to 64 Years | 19 (4.2%) | 56 (8.4%) |
| 65 to 74 Years | 43 (23.6%) | 29 (23.6%) |
| 75 Years and over | 17 (26.2%) | 66 (52.0%) |
Disability Class: Vision Difficulty
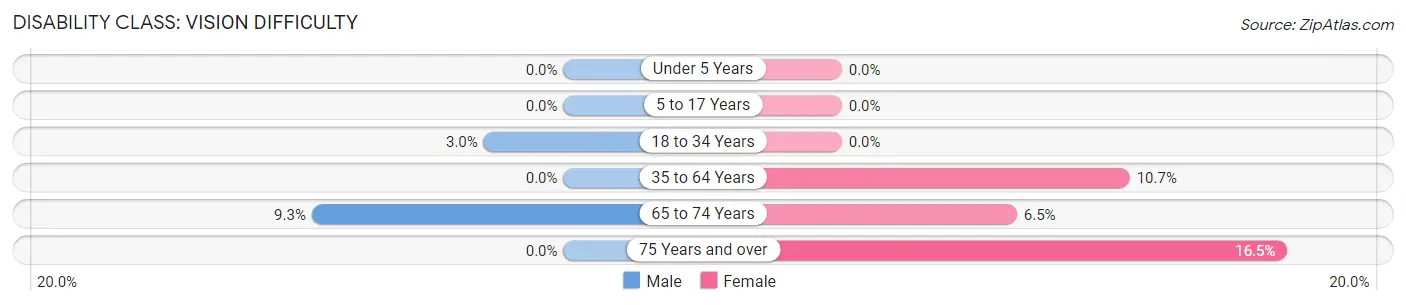
| Age Bracket | Male | Female |
| Under 5 Years | 0 (0.0%) | 0 (0.0%) |
| 5 to 17 Years | 0 (0.0%) | 0 (0.0%) |
| 18 to 34 Years | 11 (3.0%) | 0 (0.0%) |
| 35 to 64 Years | 0 (0.0%) | 71 (10.7%) |
| 65 to 74 Years | 17 (9.3%) | 8 (6.5%) |
| 75 Years and over | 0 (0.0%) | 21 (16.5%) |
Disability Class: Cognitive Difficulty
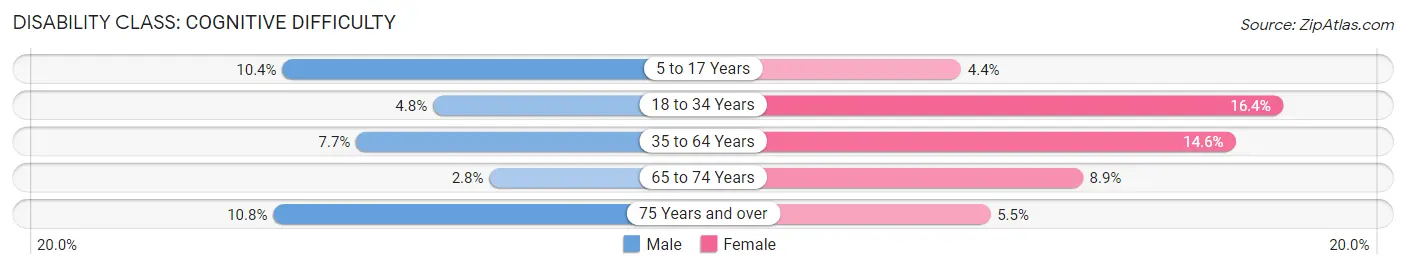
| Age Bracket | Male | Female |
| 5 to 17 Years | 17 (10.4%) | 8 (4.4%) |
| 18 to 34 Years | 18 (4.8%) | 45 (16.4%) |
| 35 to 64 Years | 35 (7.7%) | 97 (14.6%) |
| 65 to 74 Years | 5 (2.8%) | 11 (8.9%) |
| 75 Years and over | 7 (10.8%) | 7 (5.5%) |
Disability Class: Ambulatory Difficulty
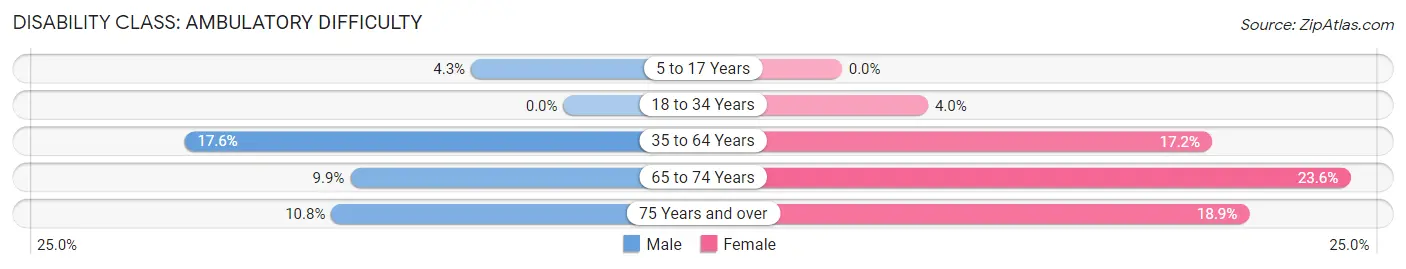
| Age Bracket | Male | Female |
| 5 to 17 Years | 7 (4.3%) | 0 (0.0%) |
| 18 to 34 Years | 0 (0.0%) | 11 (4.0%) |
| 35 to 64 Years | 80 (17.6%) | 114 (17.2%) |
| 65 to 74 Years | 18 (9.9%) | 29 (23.6%) |
| 75 Years and over | 7 (10.8%) | 24 (18.9%) |
Disability Class: Self-Care Difficulty

| Age Bracket | Male | Female |
| 5 to 17 Years | 17 (10.4%) | 8 (4.4%) |
| 18 to 34 Years | 0 (0.0%) | 11 (4.0%) |
| 35 to 64 Years | 37 (8.1%) | 91 (13.7%) |
| 65 to 74 Years | 13 (7.1%) | 11 (8.9%) |
| 75 Years and over | 0 (0.0%) | 8 (6.3%) |
Technology Access in Bushnell
Computing Device Access in Bushnell
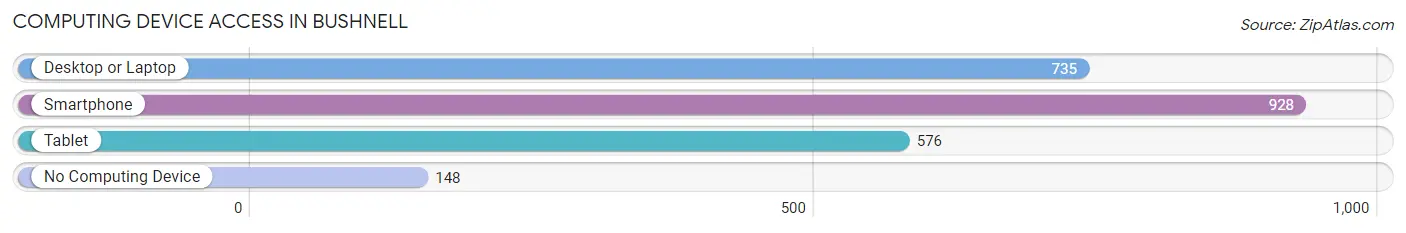
| Device Type | # Households | % Households |
| Desktop or Laptop | 735 | 61.8% |
| Smartphone | 928 | 78.0% |
| Tablet | 576 | 48.4% |
| No Computing Device | 148 | 12.4% |
| Total | 1,190 | 100.0% |
Internet Access in Bushnell
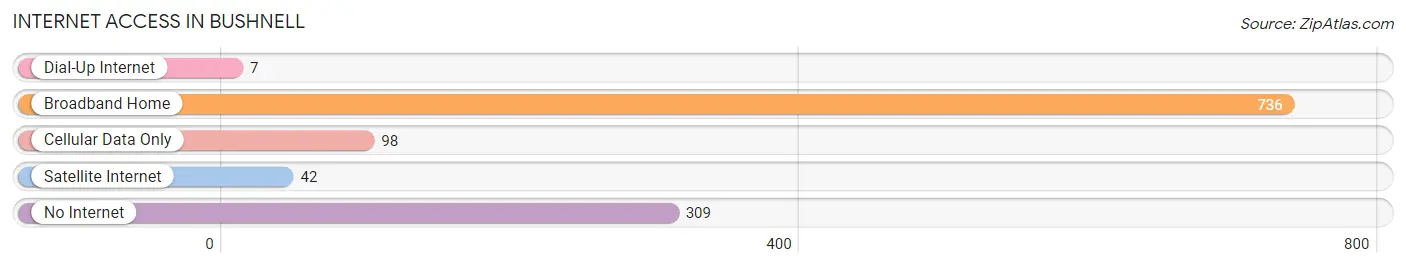
| Internet Type | # Households | % Households |
| Dial-Up Internet | 7 | 0.6% |
| Broadband Home | 736 | 61.9% |
| Cellular Data Only | 98 | 8.2% |
| Satellite Internet | 42 | 3.5% |
| No Internet | 309 | 26.0% |
| Total | 1,190 | 100.0% |
Bushnell Summary
History
The small town of Bushnell, Illinois is located in McDonough County, in the western part of the state. It is situated on the banks of the Spoon River, and is home to a population of just over 3,000 people. The town was founded in 1854 by William Bushnell, a local farmer who had purchased the land from the government. The town was originally known as Bushnell’s Grove, and was a popular stop for travelers on the stagecoach line that ran through the area.
In the late 19th century, Bushnell was a thriving agricultural community, with a variety of crops being grown in the area. The town was also home to a number of businesses, including a flour mill, a sawmill, a brickyard, and a furniture factory. The town was also home to a number of churches, including the Methodist Episcopal Church, the Presbyterian Church, and the Baptist Church.
In the early 20th century, Bushnell experienced a period of growth and prosperity. The town was home to a number of businesses, including a bank, a hotel, a movie theater, and a variety of stores. The town was also home to a number of schools, including a high school, a junior high school, and an elementary school.
In the mid-20th century, Bushnell experienced a period of decline. The town’s population began to decline, and many of the businesses and schools closed. The town was also hit hard by the Great Depression, and many of the residents were forced to leave in search of work.
In recent years, Bushnell has experienced a period of revitalization. The town has seen an influx of new businesses, including a grocery store, a hardware store, and a variety of restaurants. The town has also seen an increase in tourism, with visitors coming to explore the town’s history and enjoy the natural beauty of the area.
Geography
Bushnell is located in McDonough County, in the western part of the state of Illinois. The town is situated on the banks of the Spoon River, and is surrounded by rolling hills and farmland. The town is located approximately 30 miles south of the city of Peoria, and is about a two-hour drive from Chicago.
The climate in Bushnell is typical of the Midwest, with hot summers and cold winters. The average temperature in the summer is around 80 degrees Fahrenheit, and the average temperature in the winter is around 20 degrees Fahrenheit. The town receives an average of 40 inches of precipitation each year.
Economy
The economy of Bushnell is largely based on agriculture. The town is home to a number of farms, and the surrounding area is known for its production of corn, soybeans, and wheat. The town is also home to a number of businesses, including a grocery store, a hardware store, and a variety of restaurants.
The town is also home to a number of manufacturing companies, including a furniture factory and a brickyard. The town is also home to a number of service-based businesses, including a bank, a hotel, and a movie theater.
Demographics
As of the 2010 census, the population of Bushnell was 3,072. The town is predominantly white, with 92.3% of the population identifying as white. The town is also home to a small Hispanic population, with 4.3% of the population identifying as Hispanic or Latino. The town is also home to a small African American population, with 1.3% of the population identifying as African American. The median household income in Bushnell is $41,944, and the median home value is $90,000.
Common Questions
What is Per Capita Income in Bushnell?
Per Capita income in Bushnell is $26,522.
What is the Median Family Income in Bushnell?
Median Family Income in Bushnell is $64,405.
What is the Median Household income in Bushnell?
Median Household Income in Bushnell is $52,227.
What is Income or Wage Gap in Bushnell?
Income or Wage Gap in Bushnell is 12.4%.
Women in Bushnell earn 87.6 cents for every dollar earned by a man.
What is Family Income Deficit in Bushnell?
Family Income Deficit in Bushnell is $10,314.
Families that are below poverty line in Bushnell earn $10,314 less on average than the poverty threshold level.
What is Inequality or Gini Index in Bushnell?
Inequality or Gini Index in Bushnell is 0.40.
What is the Total Population of Bushnell?
Total Population of Bushnell is 2,850.
What is the Total Male Population of Bushnell?
Total Male Population of Bushnell is 1,361.
What is the Total Female Population of Bushnell?
Total Female Population of Bushnell is 1,489.
What is the Ratio of Males per 100 Females in Bushnell?
There are 91.40 Males per 100 Females in Bushnell.
What is the Ratio of Females per 100 Males in Bushnell?
There are 109.40 Females per 100 Males in Bushnell.
What is the Median Population Age in Bushnell?
Median Population Age in Bushnell is 42.1 Years.
What is the Average Family Size in Bushnell
Average Family Size in Bushnell is 3.0 People.
What is the Average Household Size in Bushnell
Average Household Size in Bushnell is 2.4 People.
How Large is the Labor Force in Bushnell?
There are 1,468 People in the Labor Forcein in Bushnell.
What is the Percentage of People in the Labor Force in Bushnell?
63.0% of People are in the Labor Force in Bushnell.
What is the Unemployment Rate in Bushnell?
Unemployment Rate in Bushnell is 5.2%.