Plainville, IL Map & Demographics
Plainville Map
Plainville Overview
$25,681
PER CAPITA INCOME
$66,563
AVG FAMILY INCOME
$65,750
AVG HOUSEHOLD INCOME
49.5%
WAGE / INCOME GAP [ % ]
50.5¢/ $1
WAGE / INCOME GAP [ $ ]
0.29
INEQUALITY / GINI INDEX
269
TOTAL POPULATION
148
MALE POPULATION
121
FEMALE POPULATION
122.31
MALES / 100 FEMALES
81.76
FEMALES / 100 MALES
33.2
MEDIAN AGE
3.4
AVG FAMILY SIZE
2.8
AVG HOUSEHOLD SIZE
108
LABOR FORCE [ PEOPLE ]
57.8%
PERCENT IN LABOR FORCE
9.3%
UNEMPLOYMENT RATE
Plainville Zip Codes
Plainville Area Codes
Income in Plainville
Income Overview in Plainville
Per Capita Income in Plainville is $25,681, while median incomes of families and households are $66,563 and $65,750 respectively.
| Characteristic | Number | Measure |
| Per Capita Income | 269 | $25,681 |
| Median Family Income | 67 | $66,563 |
| Mean Family Income | 67 | $79,976 |
| Median Household Income | 95 | $65,750 |
| Mean Household Income | 95 | $72,746 |
| Income Deficit | 67 | $0 |
| Wage / Income Gap (%) | 269 | 49.50% |
| Wage / Income Gap ($) | 269 | 50.50¢ per $1 |
| Gini / Inequality Index | 269 | 0.29 |
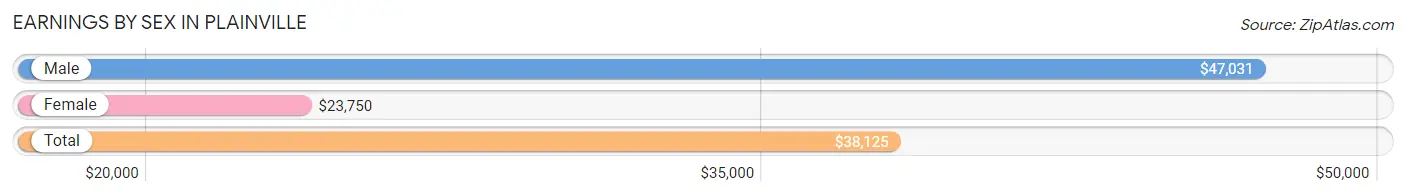
Earnings by Sex in Plainville
Average Earnings in Plainville are $38,125, $47,031 for men and $23,750 for women, a difference of 49.5%.
| Sex | Number | Average Earnings |
| Male | 77 (64.7%) | $47,031 |
| Female | 42 (35.3%) | $23,750 |
| Total | 119 (100.0%) | $38,125 |
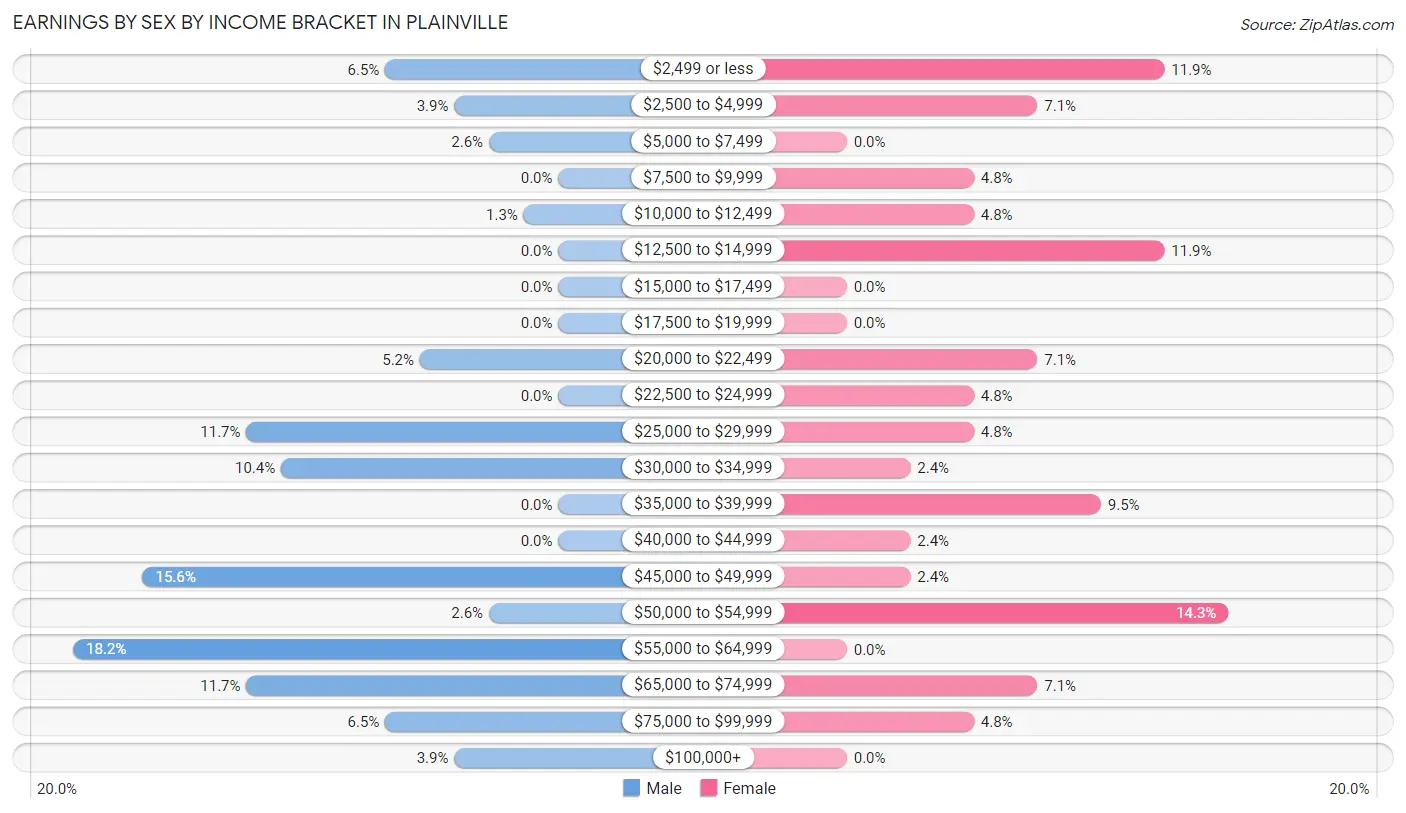
Earnings by Sex by Income Bracket in Plainville
The most common earnings brackets in Plainville are $55,000 to $64,999 for men (14 | 18.2%) and $50,000 to $54,999 for women (6 | 14.3%).
| Income | Male | Female |
| $2,499 or less | 5 (6.5%) | 5 (11.9%) |
| $2,500 to $4,999 | 3 (3.9%) | 3 (7.1%) |
| $5,000 to $7,499 | 2 (2.6%) | 0 (0.0%) |
| $7,500 to $9,999 | 0 (0.0%) | 2 (4.8%) |
| $10,000 to $12,499 | 1 (1.3%) | 2 (4.8%) |
| $12,500 to $14,999 | 0 (0.0%) | 5 (11.9%) |
| $15,000 to $17,499 | 0 (0.0%) | 0 (0.0%) |
| $17,500 to $19,999 | 0 (0.0%) | 0 (0.0%) |
| $20,000 to $22,499 | 4 (5.2%) | 3 (7.1%) |
| $22,500 to $24,999 | 0 (0.0%) | 2 (4.8%) |
| $25,000 to $29,999 | 9 (11.7%) | 2 (4.8%) |
| $30,000 to $34,999 | 8 (10.4%) | 1 (2.4%) |
| $35,000 to $39,999 | 0 (0.0%) | 4 (9.5%) |
| $40,000 to $44,999 | 0 (0.0%) | 1 (2.4%) |
| $45,000 to $49,999 | 12 (15.6%) | 1 (2.4%) |
| $50,000 to $54,999 | 2 (2.6%) | 6 (14.3%) |
| $55,000 to $64,999 | 14 (18.2%) | 0 (0.0%) |
| $65,000 to $74,999 | 9 (11.7%) | 3 (7.1%) |
| $75,000 to $99,999 | 5 (6.5%) | 2 (4.8%) |
| $100,000+ | 3 (3.9%) | 0 (0.0%) |
| Total | 77 (100.0%) | 42 (100.0%) |
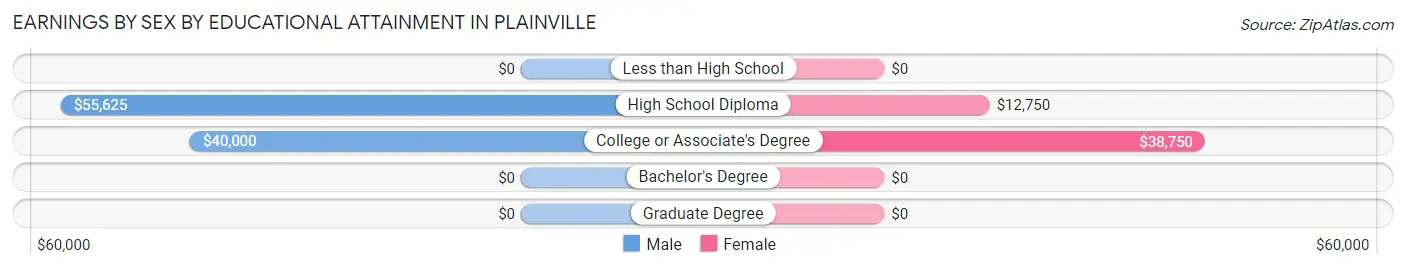
Earnings by Sex by Educational Attainment in Plainville
Average earnings in Plainville are $49,063 for men and $23,750 for women, a difference of 51.6%. Men with an educational attainment of high school diploma enjoy the highest average annual earnings of $55,625, while those with college or associate's degree education earn the least with $40,000. Women with an educational attainment of college or associate's degree earn the most with the average annual earnings of $38,750, while those with high school diploma education have the smallest earnings of $12,750.
| Educational Attainment | Male Income | Female Income |
| Less than High School | - | - |
| High School Diploma | $55,625 | $12,750 |
| College or Associate's Degree | $40,000 | $38,750 |
| Bachelor's Degree | - | - |
| Graduate Degree | - | - |
| Total | $49,063 | $23,750 |
Family Income in Plainville
Family Income Brackets in Plainville
According to the Plainville family income data, there are 19 families falling into the $50,000 to $74,999 income range, which is the most common income bracket and makes up 28.4% of all families.
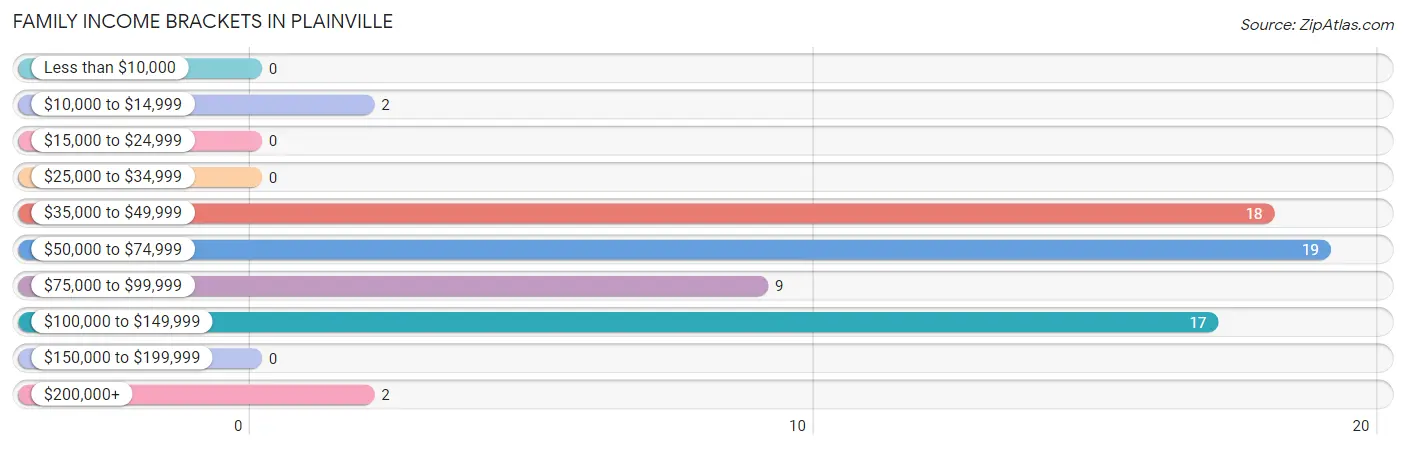
| Income Bracket | # Families | % Families |
| Less than $10,000 | 0 | 0.0% |
| $10,000 to $14,999 | 2 | 3.0% |
| $15,000 to $24,999 | 0 | 0.0% |
| $25,000 to $34,999 | 0 | 0.0% |
| $35,000 to $49,999 | 18 | 26.9% |
| $50,000 to $74,999 | 19 | 28.4% |
| $75,000 to $99,999 | 9 | 13.4% |
| $100,000 to $149,999 | 17 | 25.4% |
| $150,000 to $199,999 | 0 | 0.0% |
| $200,000+ | 2 | 3.0% |
Family Income by Famaliy Size in Plainville
6-person families (9 | 13.4%) account for the highest median family income in Plainville with $125,625 per family, while 3-person families (6 | 9.0%) have the highest median income of $37,917 per family member.
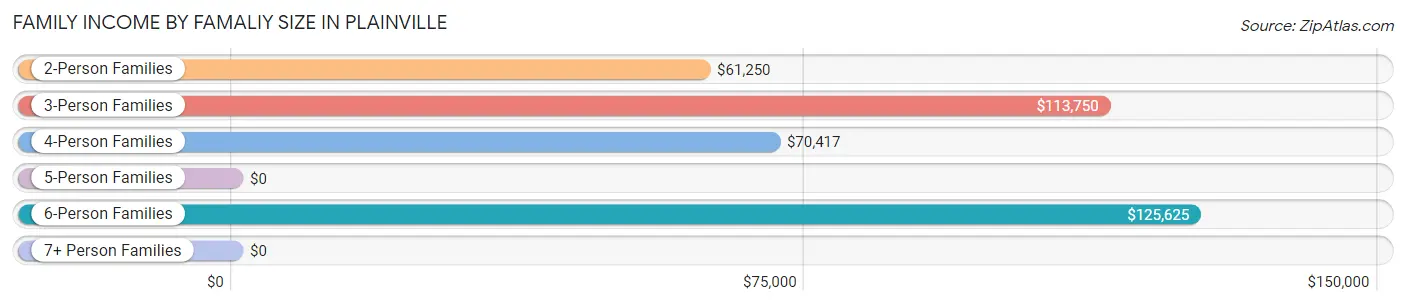
| Income Bracket | # Families | Median Income |
| 2-Person Families | 37 (55.2%) | $61,250 |
| 3-Person Families | 6 (9.0%) | $113,750 |
| 4-Person Families | 15 (22.4%) | $70,417 |
| 5-Person Families | 0 (0.0%) | $0 |
| 6-Person Families | 9 (13.4%) | $125,625 |
| 7+ Person Families | 0 (0.0%) | $0 |
| Total | 67 (100.0%) | $66,563 |
Family Income by Number of Earners in Plainville
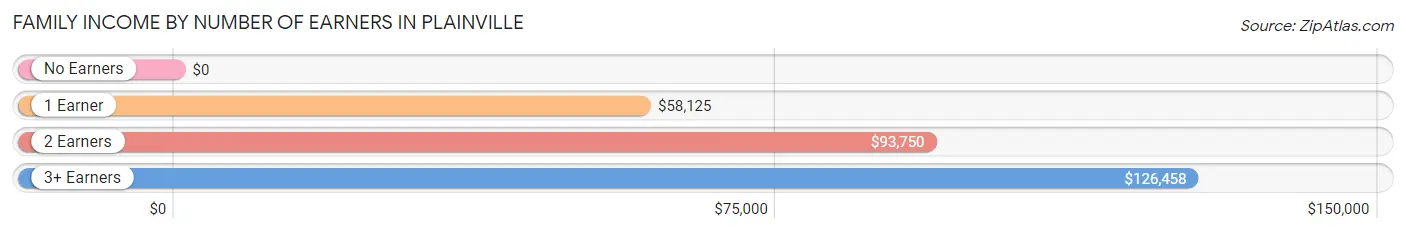
| Number of Earners | # Families | Median Income |
| No Earners | 13 (19.4%) | $0 |
| 1 Earner | 31 (46.3%) | $58,125 |
| 2 Earners | 12 (17.9%) | $93,750 |
| 3+ Earners | 11 (16.4%) | $126,458 |
| Total | 67 (100.0%) | $66,563 |
Household Income in Plainville
Household Income Brackets in Plainville
With 31 households falling in the category, the $50,000 to $74,999 income range is the most frequent in Plainville, accounting for 32.6% of all households.
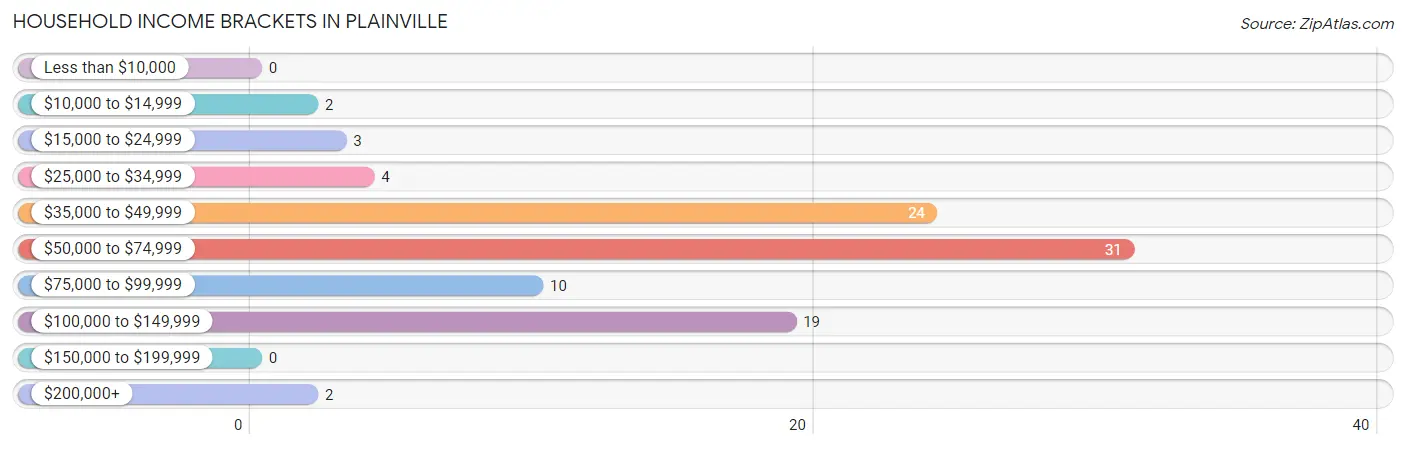
| Income Bracket | # Households | % Households |
| Less than $10,000 | 0 | 0.0% |
| $10,000 to $14,999 | 2 | 2.1% |
| $15,000 to $24,999 | 3 | 3.2% |
| $25,000 to $34,999 | 4 | 4.2% |
| $35,000 to $49,999 | 24 | 25.3% |
| $50,000 to $74,999 | 31 | 32.6% |
| $75,000 to $99,999 | 10 | 10.5% |
| $100,000 to $149,999 | 19 | 20.0% |
| $150,000 to $199,999 | 0 | 0.0% |
| $200,000+ | 2 | 2.1% |
Household Income by Householder Age in Plainville
The median household income in Plainville is $65,750, with the highest median household income of $77,083 found in the 45 to 64 years age bracket for the primary householder. A total of 31 households (32.6%) fall into this category.
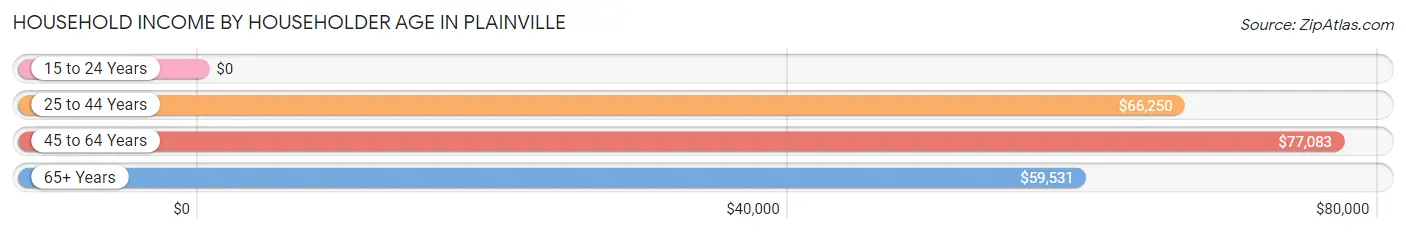
| Income Bracket | # Households | Median Income |
| 15 to 24 Years | 0 (0.0%) | $0 |
| 25 to 44 Years | 33 (34.7%) | $66,250 |
| 45 to 64 Years | 31 (32.6%) | $77,083 |
| 65+ Years | 31 (32.6%) | $59,531 |
| Total | 95 (100.0%) | $65,750 |
Poverty in Plainville
Income Below Poverty by Sex and Age in Plainville
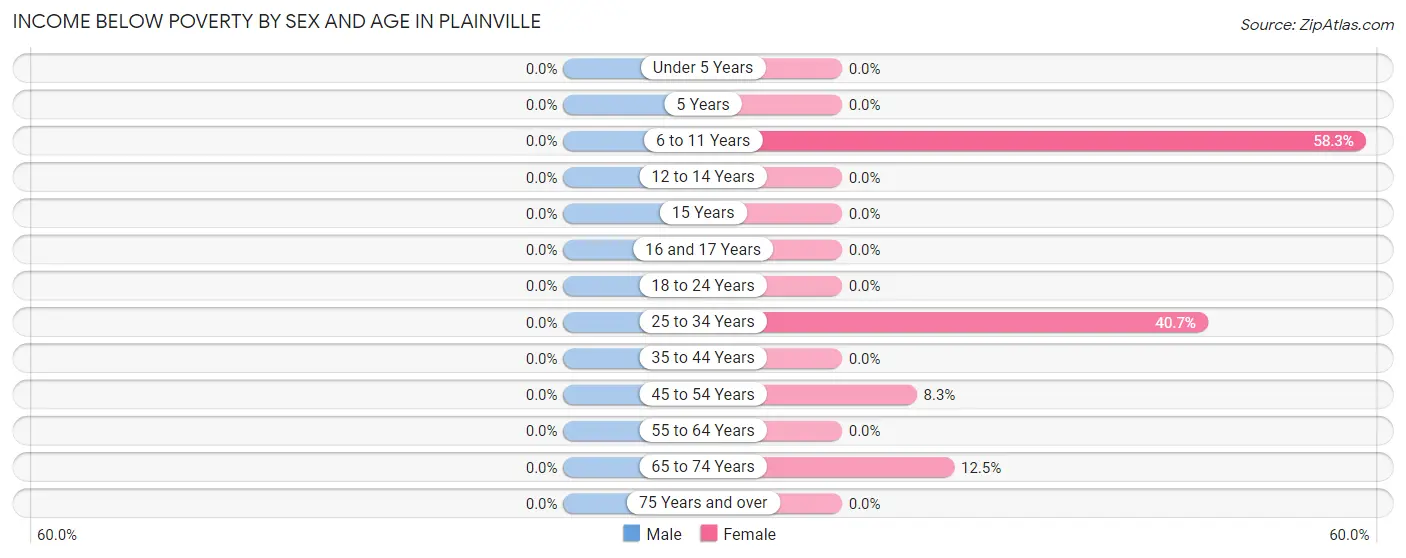
| Age Bracket | Male | Female |
| Under 5 Years | 0 (0.0%) | 0 (0.0%) |
| 5 Years | 0 (0.0%) | 0 (0.0%) |
| 6 to 11 Years | 0 (0.0%) | 14 (58.3%) |
| 12 to 14 Years | 0 (0.0%) | 0 (0.0%) |
| 15 Years | 0 (0.0%) | 0 (0.0%) |
| 16 and 17 Years | 0 (0.0%) | 0 (0.0%) |
| 18 to 24 Years | 0 (0.0%) | 0 (0.0%) |
| 25 to 34 Years | 0 (0.0%) | 11 (40.7%) |
| 35 to 44 Years | 0 (0.0%) | 0 (0.0%) |
| 45 to 54 Years | 0 (0.0%) | 1 (8.3%) |
| 55 to 64 Years | 0 (0.0%) | 0 (0.0%) |
| 65 to 74 Years | 0 (0.0%) | 2 (12.5%) |
| 75 Years and over | 0 (0.0%) | 0 (0.0%) |
| Total | 0 (0.0%) | 28 (23.1%) |
Income Above Poverty by Sex and Age in Plainville
According to the poverty statistics in Plainville, males aged under 5 years and females aged under 5 years are the age groups that are most secure financially, with 100.0% of males and 100.0% of females in these age groups living above the poverty line.
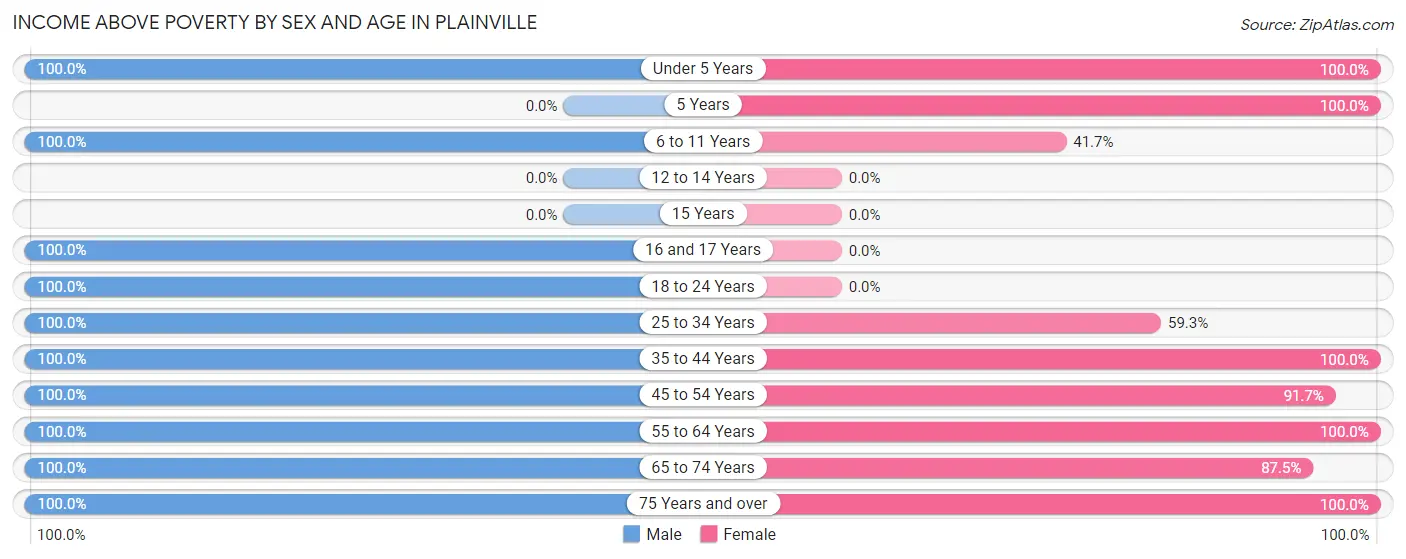
| Age Bracket | Male | Female |
| Under 5 Years | 23 (100.0%) | 14 (100.0%) |
| 5 Years | 0 (0.0%) | 2 (100.0%) |
| 6 to 11 Years | 19 (100.0%) | 10 (41.7%) |
| 12 to 14 Years | 0 (0.0%) | 0 (0.0%) |
| 15 Years | 0 (0.0%) | 0 (0.0%) |
| 16 and 17 Years | 8 (100.0%) | 0 (0.0%) |
| 18 to 24 Years | 8 (100.0%) | 0 (0.0%) |
| 25 to 34 Years | 14 (100.0%) | 16 (59.3%) |
| 35 to 44 Years | 13 (100.0%) | 6 (100.0%) |
| 45 to 54 Years | 15 (100.0%) | 11 (91.7%) |
| 55 to 64 Years | 23 (100.0%) | 12 (100.0%) |
| 65 to 74 Years | 20 (100.0%) | 14 (87.5%) |
| 75 Years and over | 5 (100.0%) | 8 (100.0%) |
| Total | 148 (100.0%) | 93 (76.9%) |
Income Below Poverty Among Married-Couple Families in Plainville
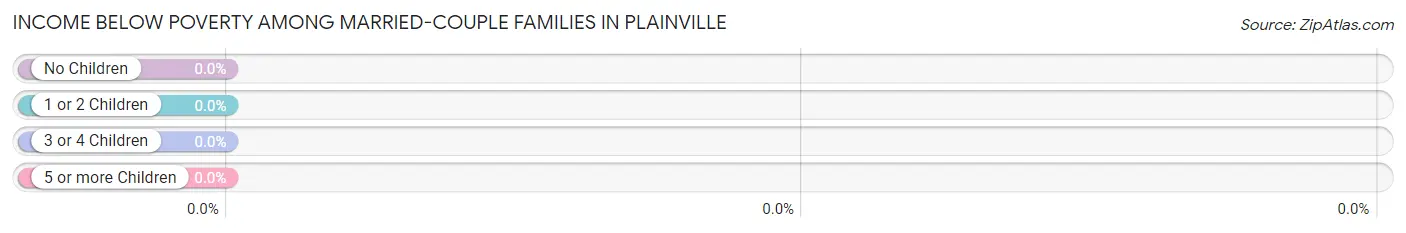
| Children | Above Poverty | Below Poverty |
| No Children | 28 (100.0%) | 0 (0.0%) |
| 1 or 2 Children | 14 (100.0%) | 0 (0.0%) |
| 3 or 4 Children | 9 (100.0%) | 0 (0.0%) |
| 5 or more Children | 0 (0.0%) | 0 (0.0%) |
| Total | 51 (100.0%) | 0 (0.0%) |
Income Below Poverty Among Single-Parent Households in Plainville
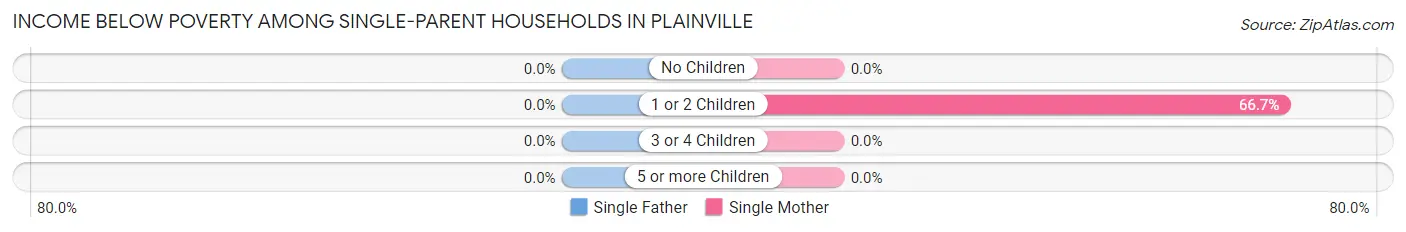
| Children | Single Father | Single Mother |
| No Children | 0 (0.0%) | 0 (0.0%) |
| 1 or 2 Children | 0 (0.0%) | 2 (66.7%) |
| 3 or 4 Children | 0 (0.0%) | 0 (0.0%) |
| 5 or more Children | 0 (0.0%) | 0 (0.0%) |
| Total | 0 (0.0%) | 2 (28.6%) |
Income Below Poverty Among Married-Couple vs Single-Parent Households in Plainville
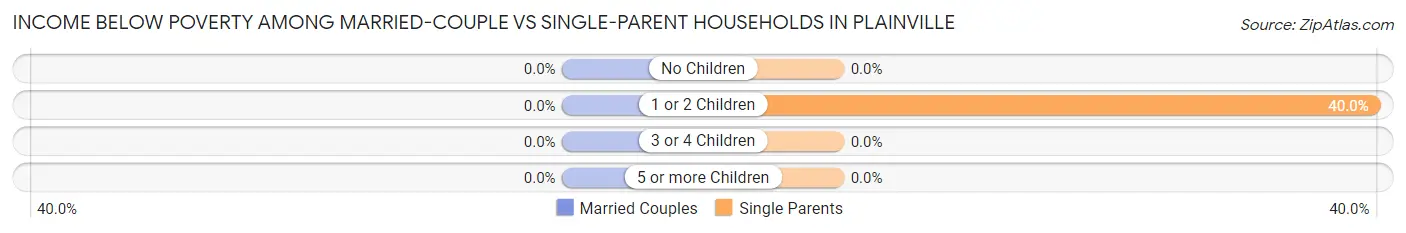
| Children | Married-Couple Families | Single-Parent Households |
| No Children | 0 (0.0%) | 0 (0.0%) |
| 1 or 2 Children | 0 (0.0%) | 2 (40.0%) |
| 3 or 4 Children | 0 (0.0%) | 0 (0.0%) |
| 5 or more Children | 0 (0.0%) | 0 (0.0%) |
| Total | 0 (0.0%) | 2 (12.5%) |
Race in Plainville
The most populous races in Plainville are White / Caucasian (248 | 92.2%), and Two or more Races (21 | 7.8%).
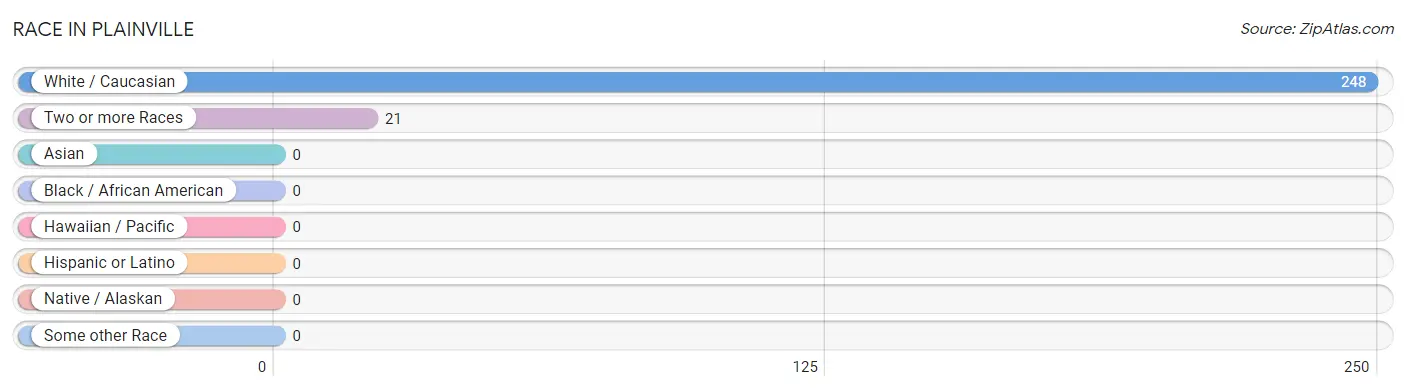
| Race | # Population | % Population |
| Asian | 0 | 0.0% |
| Black / African American | 0 | 0.0% |
| Hawaiian / Pacific | 0 | 0.0% |
| Hispanic or Latino | 0 | 0.0% |
| Native / Alaskan | 0 | 0.0% |
| White / Caucasian | 248 | 92.2% |
| Two or more Races | 21 | 7.8% |
| Some other Race | 0 | 0.0% |
| Total | 269 | 100.0% |
Ancestry in Plainville
The most populous ancestries reported in Plainville are German (69 | 25.7%), American (20 | 7.4%), Irish (19 | 7.1%), English (16 | 5.9%), and French (11 | 4.1%), together accounting for 50.2% of all Plainville residents.
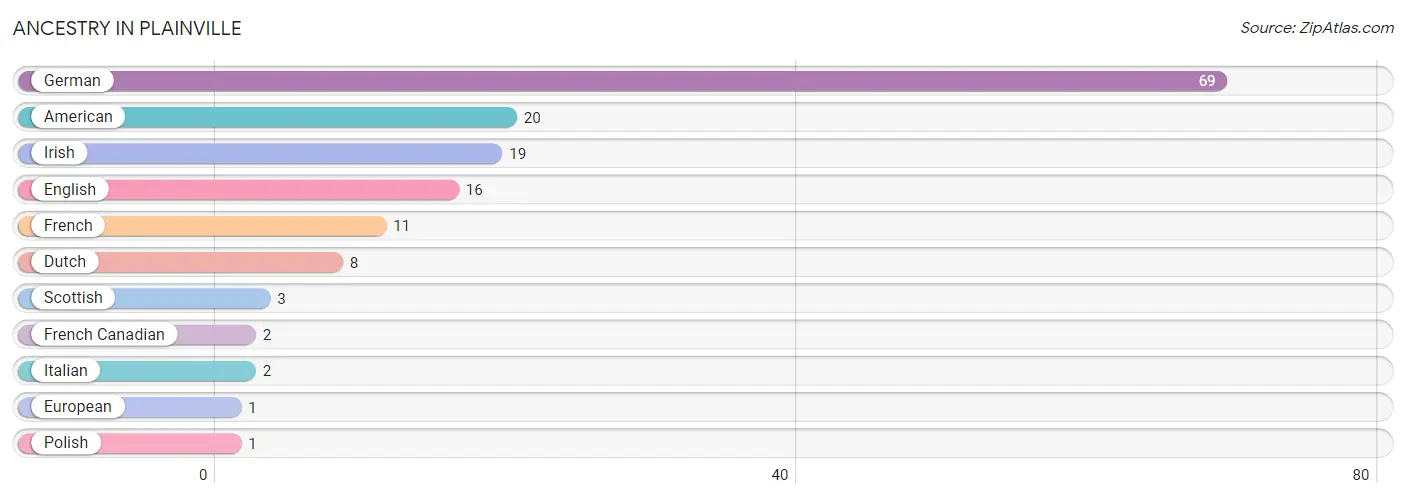
| Ancestry | # Population | % Population |
| American | 20 | 7.4% |
| Dutch | 8 | 3.0% |
| English | 16 | 5.9% |
| European | 1 | 0.4% |
| French | 11 | 4.1% |
| French Canadian | 2 | 0.7% |
| German | 69 | 25.7% |
| Irish | 19 | 7.1% |
| Italian | 2 | 0.7% |
| Polish | 1 | 0.4% |
| Scottish | 3 | 1.1% | View All 11 Rows |
Immigrants in Plainville

| Immigration Origin | # Population | % Population | View All 0 Rows |
Sex and Age in Plainville
Sex and Age in Plainville
The most populous age groups in Plainville are Under 5 Years (23 | 15.5%) for men and 10 to 14 Years (17 | 14.1%) for women.
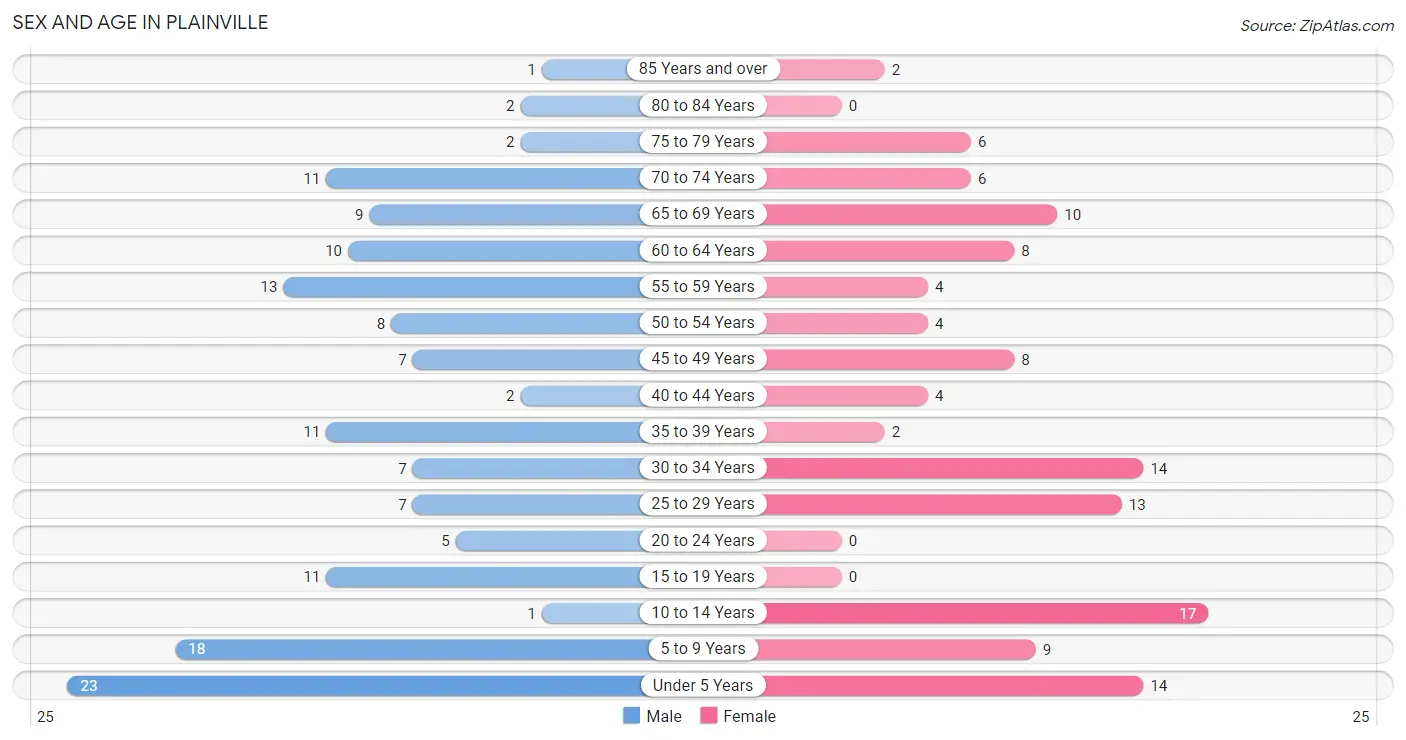
| Age Bracket | Male | Female |
| Under 5 Years | 23 (15.5%) | 14 (11.6%) |
| 5 to 9 Years | 18 (12.2%) | 9 (7.4%) |
| 10 to 14 Years | 1 (0.7%) | 17 (14.1%) |
| 15 to 19 Years | 11 (7.4%) | 0 (0.0%) |
| 20 to 24 Years | 5 (3.4%) | 0 (0.0%) |
| 25 to 29 Years | 7 (4.7%) | 13 (10.7%) |
| 30 to 34 Years | 7 (4.7%) | 14 (11.6%) |
| 35 to 39 Years | 11 (7.4%) | 2 (1.7%) |
| 40 to 44 Years | 2 (1.3%) | 4 (3.3%) |
| 45 to 49 Years | 7 (4.7%) | 8 (6.6%) |
| 50 to 54 Years | 8 (5.4%) | 4 (3.3%) |
| 55 to 59 Years | 13 (8.8%) | 4 (3.3%) |
| 60 to 64 Years | 10 (6.8%) | 8 (6.6%) |
| 65 to 69 Years | 9 (6.1%) | 10 (8.3%) |
| 70 to 74 Years | 11 (7.4%) | 6 (5.0%) |
| 75 to 79 Years | 2 (1.3%) | 6 (5.0%) |
| 80 to 84 Years | 2 (1.3%) | 0 (0.0%) |
| 85 Years and over | 1 (0.7%) | 2 (1.7%) |
| Total | 148 (100.0%) | 121 (100.0%) |
Families and Households in Plainville
Median Family Size in Plainville
The median family size in Plainville is 3.36 persons per family, with single female/mother families (7 | 10.4%) accounting for the largest median family size of 3.86 persons per family. On the other hand, single male/father families (9 | 13.4%) represent the smallest median family size with 3.11 persons per family.
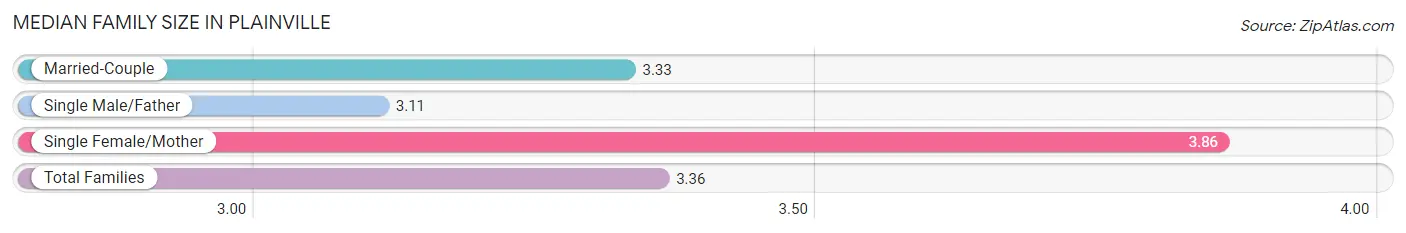
| Family Type | # Families | Family Size |
| Married-Couple | 51 (76.1%) | 3.33 |
| Single Male/Father | 9 (13.4%) | 3.11 |
| Single Female/Mother | 7 (10.4%) | 3.86 |
| Total Families | 67 (100.0%) | 3.36 |
Median Household Size in Plainville
The median household size in Plainville is 2.83 persons per household, with single female/mother households (7 | 7.4%) accounting for the largest median household size of 4 persons per household. non-family households (28 | 29.5%) represent the smallest median household size with 1.14 persons per household.
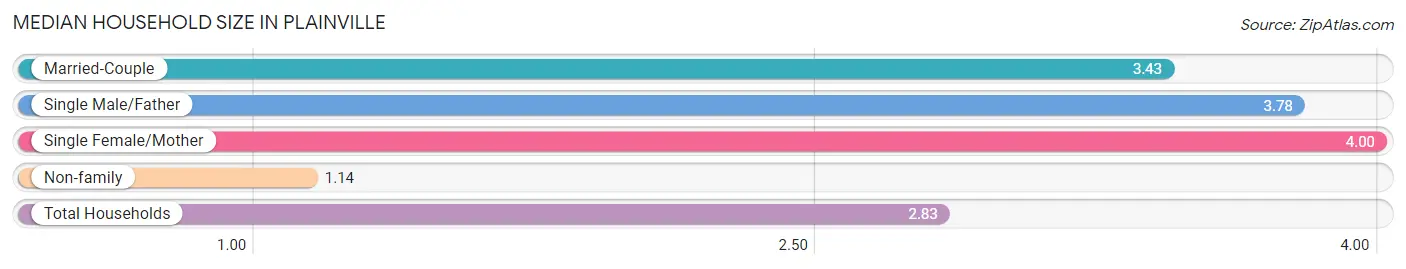
| Household Type | # Households | Household Size |
| Married-Couple | 51 (53.7%) | 3.43 |
| Single Male/Father | 9 (9.5%) | 3.78 |
| Single Female/Mother | 7 (7.4%) | 4.00 |
| Non-family | 28 (29.5%) | 1.14 |
| Total Households | 95 (100.0%) | 2.83 |
Household Size by Marriage Status in Plainville
Out of a total of 95 households in Plainville, 67 (70.5%) are family households, while 28 (29.5%) are nonfamily households. The most numerous type of family households are 2-person households, comprising 36, and the most common type of nonfamily households are 1-person households, comprising 25.
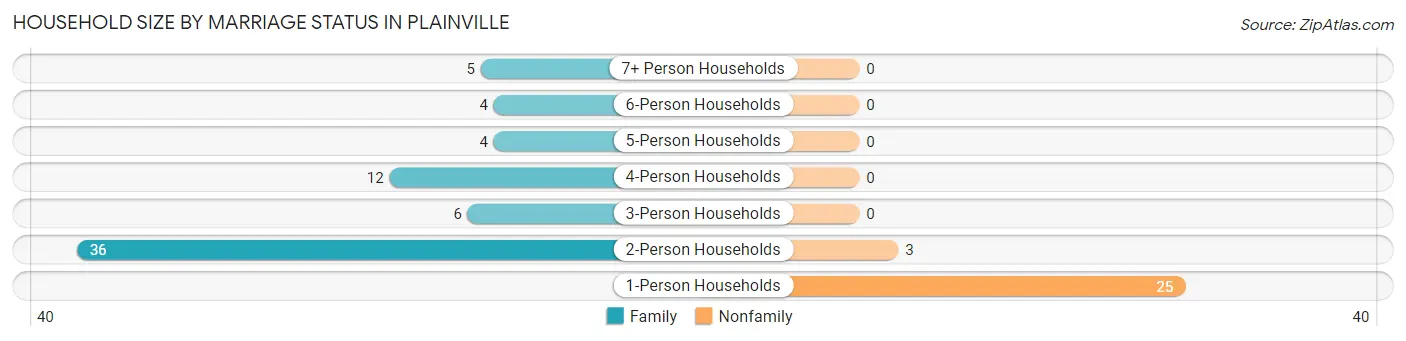
| Household Size | Family Households | Nonfamily Households |
| 1-Person Households | - | 25 (26.3%) |
| 2-Person Households | 36 (37.9%) | 3 (3.2%) |
| 3-Person Households | 6 (6.3%) | 0 (0.0%) |
| 4-Person Households | 12 (12.6%) | 0 (0.0%) |
| 5-Person Households | 4 (4.2%) | 0 (0.0%) |
| 6-Person Households | 4 (4.2%) | 0 (0.0%) |
| 7+ Person Households | 5 (5.3%) | 0 (0.0%) |
| Total | 67 (70.5%) | 28 (29.5%) |
Female Fertility in Plainville
Fertility by Age in Plainville
Average fertility rate in Plainville is 68.0 births per 1,000 women. Women in the age bracket of 20 to 34 years have the highest fertility rate with 111.0 births per 1,000 women. Women in the age bracket of 20 to 34 years acount for 100.0% of all women with births.
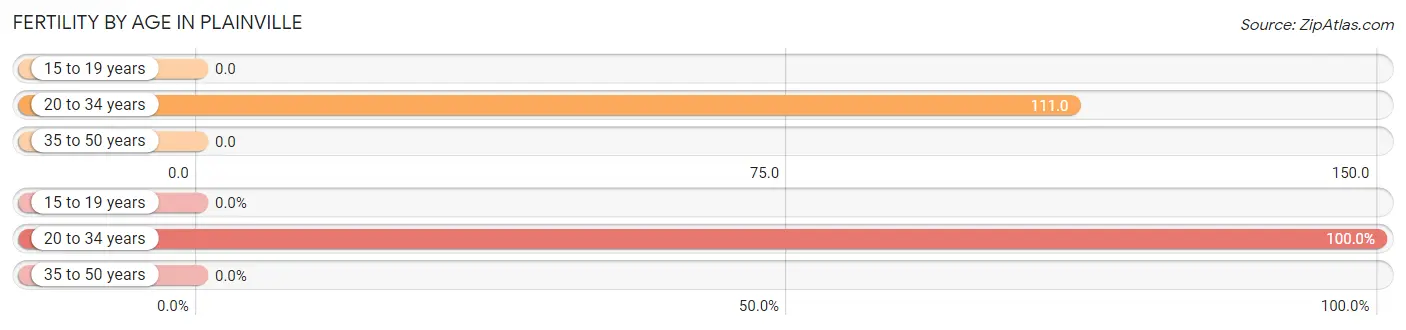
| Age Bracket | Women with Births | Births / 1,000 Women |
| 15 to 19 years | 0 (0.0%) | 0.0 |
| 20 to 34 years | 3 (100.0%) | 111.0 |
| 35 to 50 years | 0 (0.0%) | 0.0 |
| Total | 3 (100.0%) | 68.0 |
Fertility by Age by Marriage Status in Plainville
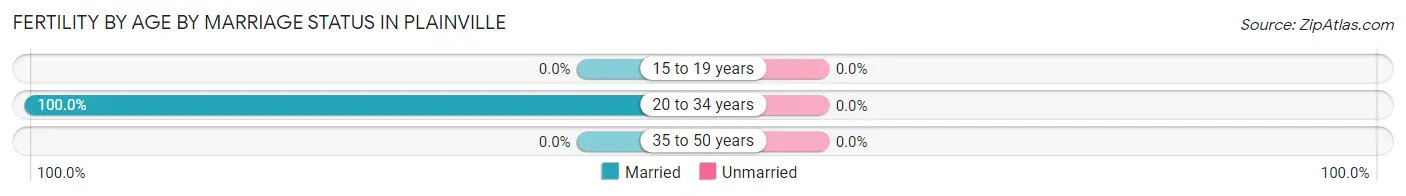
| Age Bracket | Married | Unmarried |
| 15 to 19 years | 0 (0.0%) | 0 (0.0%) |
| 20 to 34 years | 3 (100.0%) | 0 (0.0%) |
| 35 to 50 years | 0 (0.0%) | 0 (0.0%) |
| Total | 3 (100.0%) | 0 (0.0%) |
Fertility by Education in Plainville
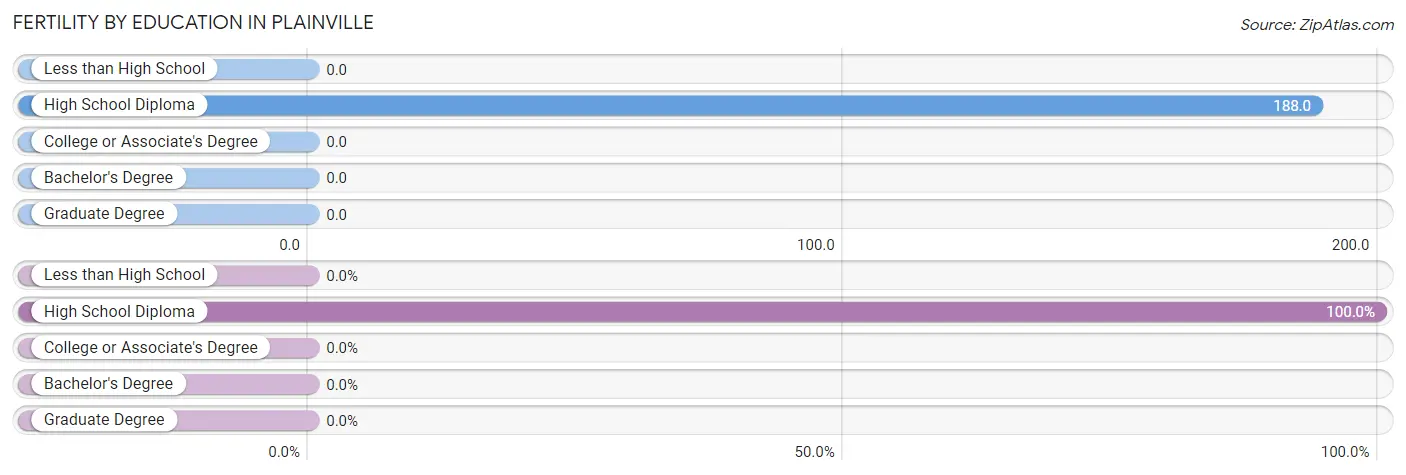
| Educational Attainment | Women with Births | Births / 1,000 Women |
| Less than High School | 0 (0.0%) | 0.0 |
| High School Diploma | 3 (100.0%) | 188.0 |
| College or Associate's Degree | 0 (0.0%) | 0.0 |
| Bachelor's Degree | 0 (0.0%) | 0.0 |
| Graduate Degree | 0 (0.0%) | 0.0 |
| Total | 3 (100.0%) | 68.0 |
Fertility by Education by Marriage Status in Plainville
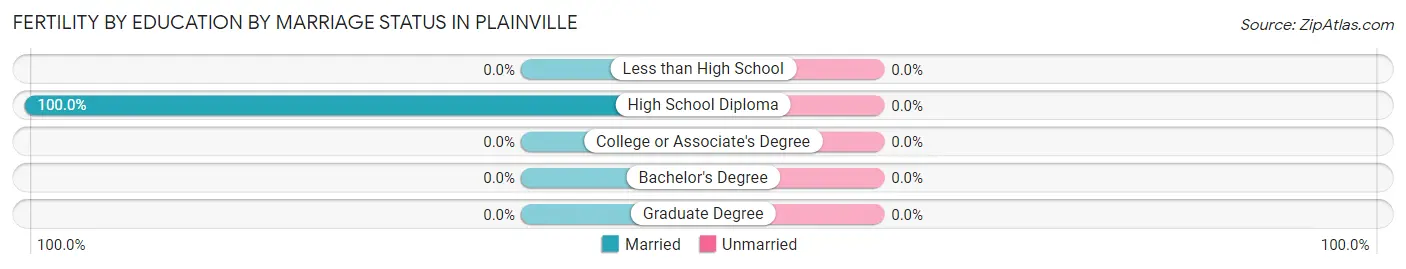
| Educational Attainment | Married | Unmarried |
| Less than High School | 0 (0.0%) | 0 (0.0%) |
| High School Diploma | 3 (100.0%) | 0 (0.0%) |
| College or Associate's Degree | 0 (0.0%) | 0 (0.0%) |
| Bachelor's Degree | 0 (0.0%) | 0 (0.0%) |
| Graduate Degree | 0 (0.0%) | 0 (0.0%) |
| Total | 3 (100.0%) | 0 (0.0%) |
Employment Characteristics in Plainville
Employment by Class of Employer in Plainville
Among the 91 employed individuals in Plainville, private company employees (66 | 72.5%), local government employees (7 | 7.7%), and not-for-profit organizations (6 | 6.6%) make up the most common classes of employment.
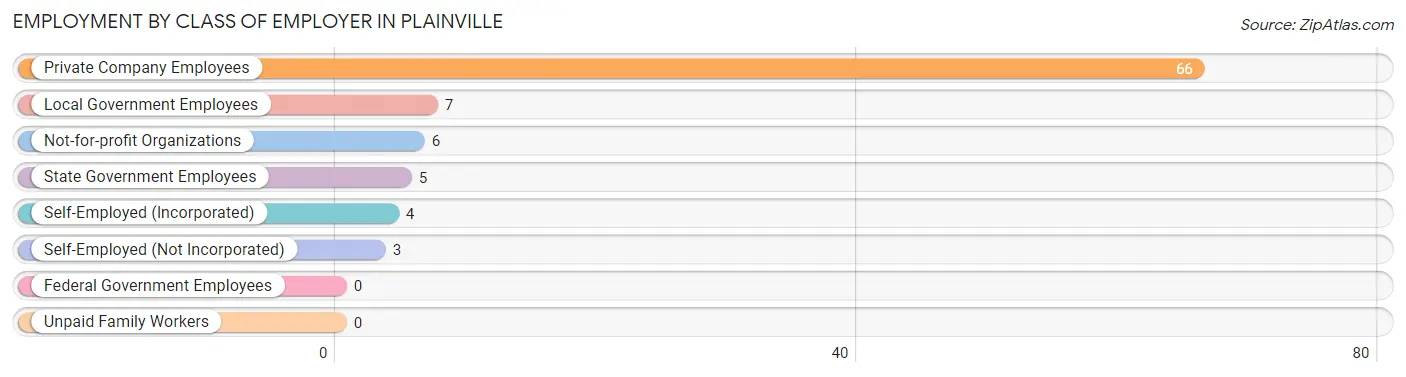
| Employer Class | # Employees | % Employees |
| Private Company Employees | 66 | 72.5% |
| Self-Employed (Incorporated) | 4 | 4.4% |
| Self-Employed (Not Incorporated) | 3 | 3.3% |
| Not-for-profit Organizations | 6 | 6.6% |
| Local Government Employees | 7 | 7.7% |
| State Government Employees | 5 | 5.5% |
| Federal Government Employees | 0 | 0.0% |
| Unpaid Family Workers | 0 | 0.0% |
| Total | 91 | 100.0% |
Employment Status by Age in Plainville
According to the labor force statistics for Plainville, out of the total population over 16 years of age (187), 57.8% or 108 individuals are in the labor force, with 9.3% or 10 of them unemployed. The age group with the highest labor force participation rate is 35 to 44 years, with 100.0% or 19 individuals in the labor force. Within the labor force, the 20 to 24 years age range has the highest percentage of unemployed individuals, with 100.0% or 4 of them being unemployed.
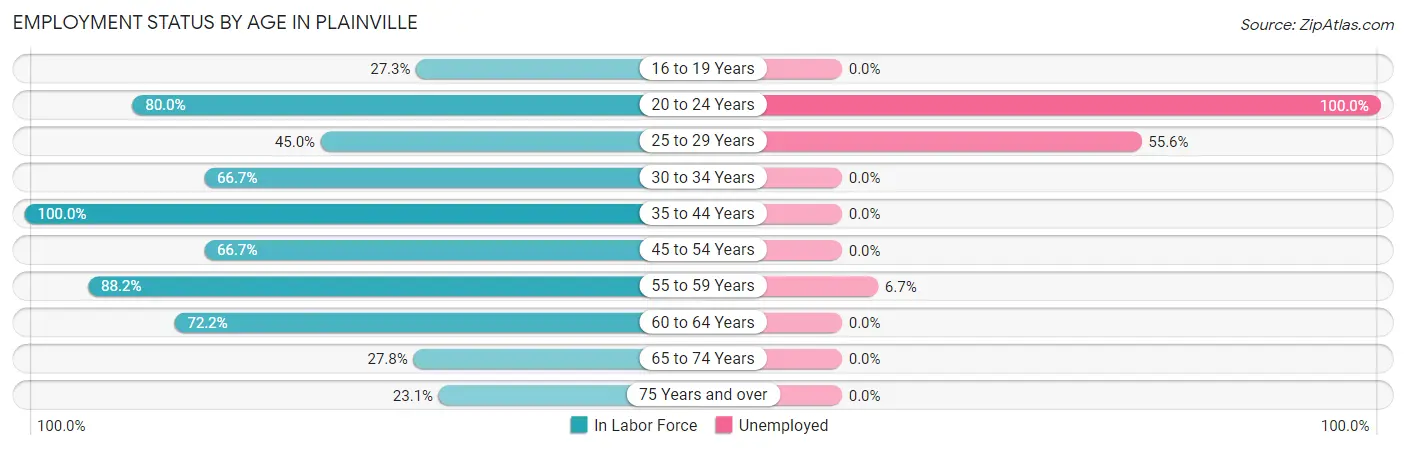
| Age Bracket | In Labor Force | Unemployed |
| 16 to 19 Years | 3 (27.3%) | 0 (0.0%) |
| 20 to 24 Years | 4 (80.0%) | 4 (100.0%) |
| 25 to 29 Years | 9 (45.0%) | 5 (55.6%) |
| 30 to 34 Years | 14 (66.7%) | 0 (0.0%) |
| 35 to 44 Years | 19 (100.0%) | 0 (0.0%) |
| 45 to 54 Years | 18 (66.7%) | 0 (0.0%) |
| 55 to 59 Years | 15 (88.2%) | 1 (6.7%) |
| 60 to 64 Years | 13 (72.2%) | 0 (0.0%) |
| 65 to 74 Years | 10 (27.8%) | 0 (0.0%) |
| 75 Years and over | 3 (23.1%) | 0 (0.0%) |
| Total | 108 (57.8%) | 10 (9.3%) |
Employment Status by Educational Attainment in Plainville
According to labor force statistics for Plainville, 72.1% of individuals (88) out of the total population between 25 and 64 years of age (122) are in the labor force, with 6.8% or 6 of them being unemployed. The group with the highest labor force participation rate are those with the educational attainment of bachelor's degree or higher, with 100.0% or 6 individuals in the labor force. Within the labor force, individuals with high school diploma education have the highest percentage of unemployment, with 11.8% or 6 of them being unemployed.
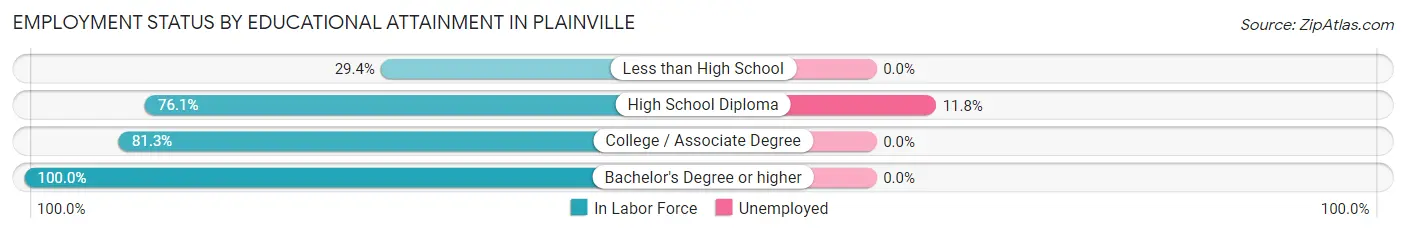
| Educational Attainment | In Labor Force | Unemployed |
| Less than High School | 5 (29.4%) | 0 (0.0%) |
| High School Diploma | 51 (76.1%) | 8 (11.8%) |
| College / Associate Degree | 26 (81.3%) | 0 (0.0%) |
| Bachelor's Degree or higher | 6 (100.0%) | 0 (0.0%) |
| Total | 88 (72.1%) | 8 (6.8%) |
Employment Occupations by Sex in Plainville
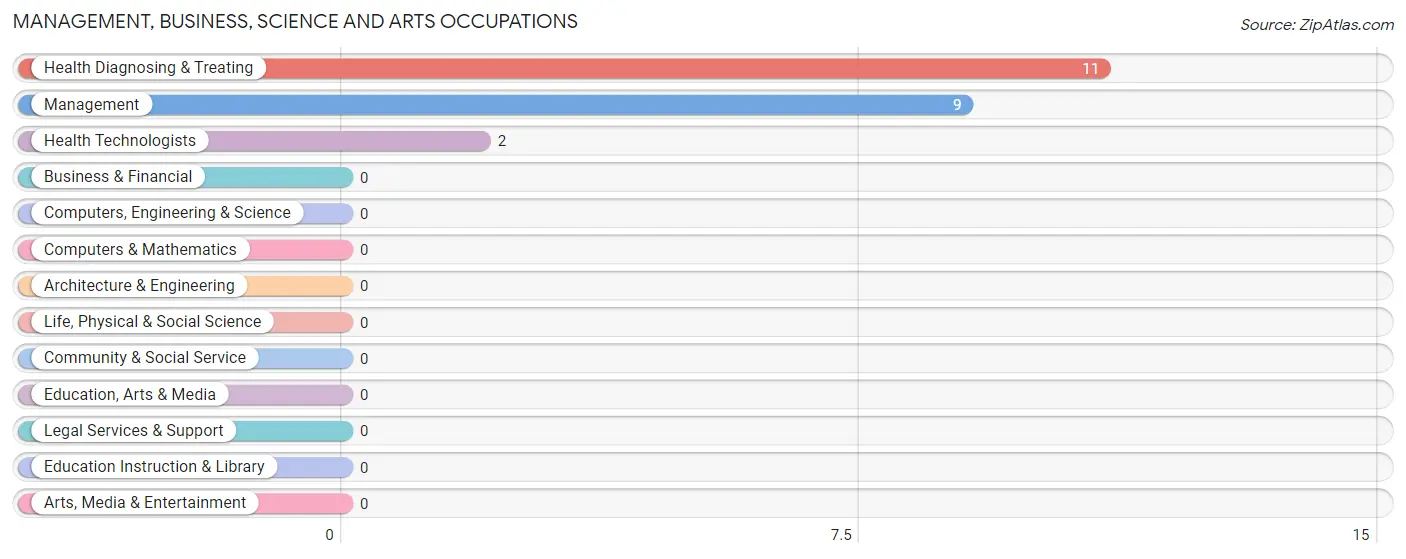
Management, Business, Science and Arts Occupations
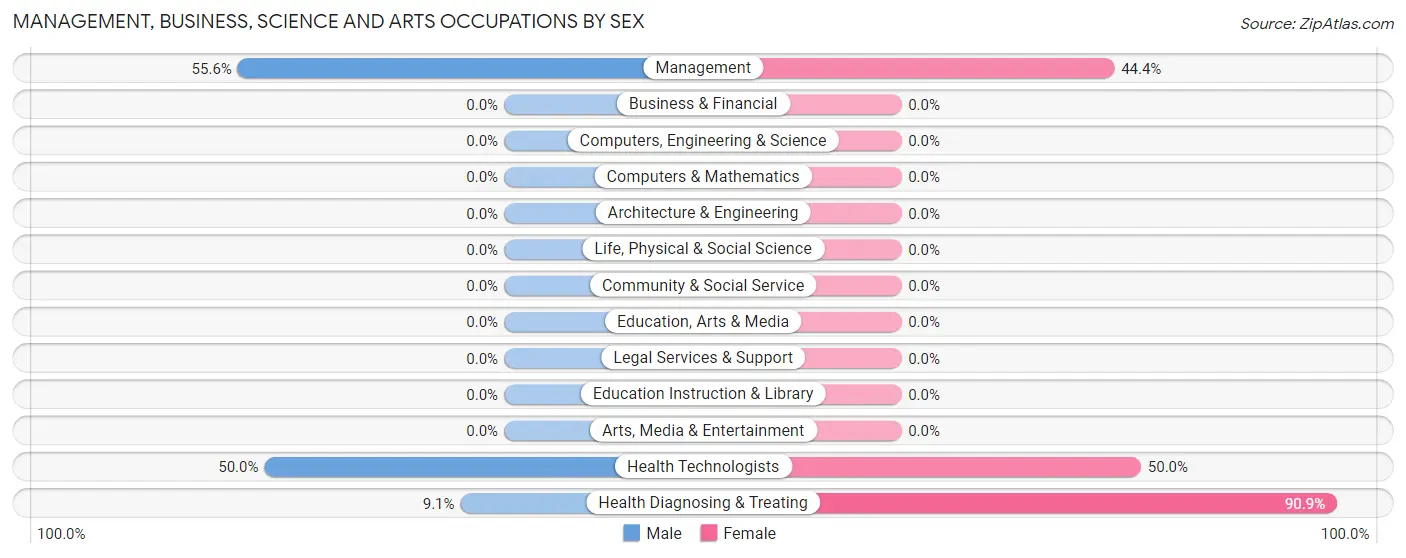
The most common Management, Business, Science and Arts occupations in Plainville are Health Diagnosing & Treating (11 | 11.2%), Management (9 | 9.2%), and Health Technologists (2 | 2.0%).
Management, Business, Science and Arts Occupations by Sex
Within the Management, Business, Science and Arts occupations in Plainville, the most male-oriented occupations are Management (55.6%), Health Technologists (50.0%), and Health Diagnosing & Treating (9.1%), while the most female-oriented occupations are Health Diagnosing & Treating (90.9%), Health Technologists (50.0%), and Management (44.4%).
| Occupation | Male | Female |
| Management | 5 (55.6%) | 4 (44.4%) |
| Business & Financial | 0 (0.0%) | 0 (0.0%) |
| Computers, Engineering & Science | 0 (0.0%) | 0 (0.0%) |
| Computers & Mathematics | 0 (0.0%) | 0 (0.0%) |
| Architecture & Engineering | 0 (0.0%) | 0 (0.0%) |
| Life, Physical & Social Science | 0 (0.0%) | 0 (0.0%) |
| Community & Social Service | 0 (0.0%) | 0 (0.0%) |
| Education, Arts & Media | 0 (0.0%) | 0 (0.0%) |
| Legal Services & Support | 0 (0.0%) | 0 (0.0%) |
| Education Instruction & Library | 0 (0.0%) | 0 (0.0%) |
| Arts, Media & Entertainment | 0 (0.0%) | 0 (0.0%) |
| Health Diagnosing & Treating | 1 (9.1%) | 10 (90.9%) |
| Health Technologists | 1 (50.0%) | 1 (50.0%) |
| Total (Category) | 6 (30.0%) | 14 (70.0%) |
| Total (Overall) | 61 (62.2%) | 37 (37.8%) |
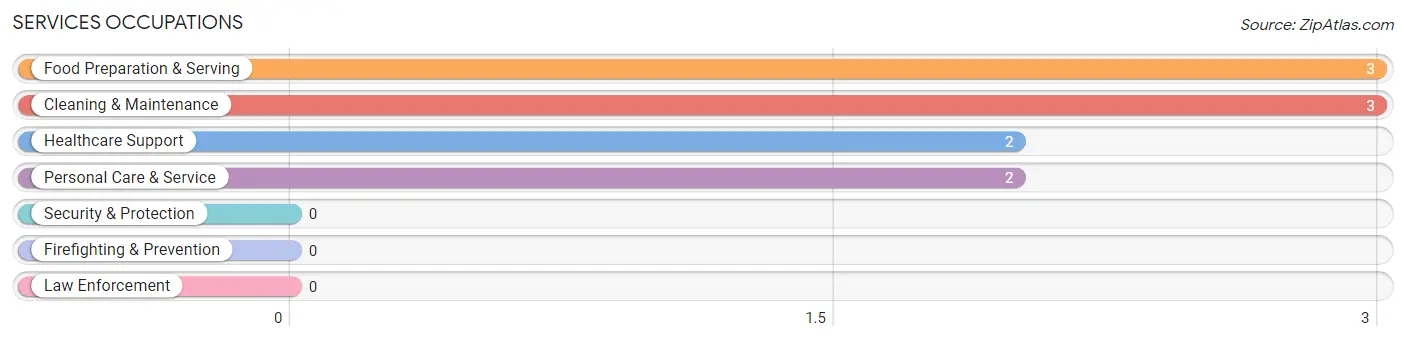
Services Occupations
The most common Services occupations in Plainville are Food Preparation & Serving (3 | 3.1%), Cleaning & Maintenance (3 | 3.1%), Healthcare Support (2 | 2.0%), and Personal Care & Service (2 | 2.0%).
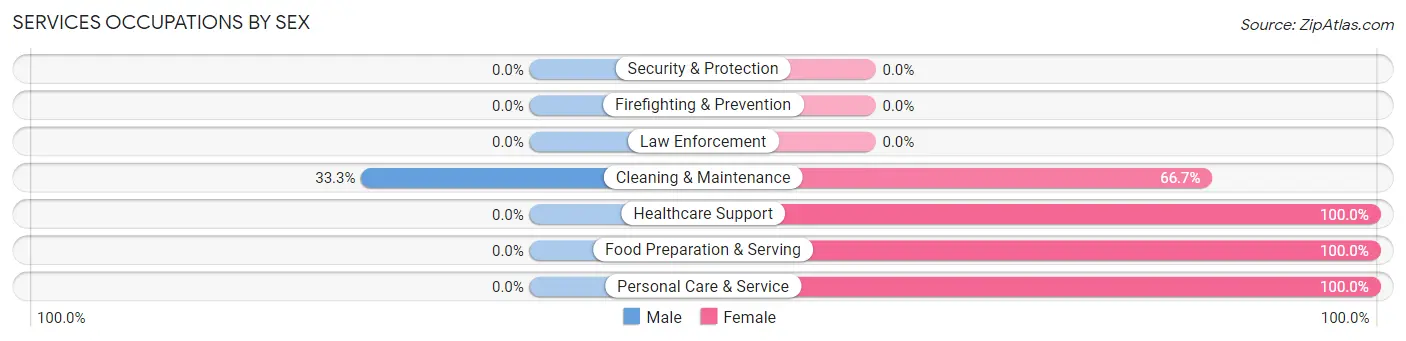
Services Occupations by Sex
| Occupation | Male | Female |
| Healthcare Support | 0 (0.0%) | 2 (100.0%) |
| Security & Protection | 0 (0.0%) | 0 (0.0%) |
| Firefighting & Prevention | 0 (0.0%) | 0 (0.0%) |
| Law Enforcement | 0 (0.0%) | 0 (0.0%) |
| Food Preparation & Serving | 0 (0.0%) | 3 (100.0%) |
| Cleaning & Maintenance | 1 (33.3%) | 2 (66.7%) |
| Personal Care & Service | 0 (0.0%) | 2 (100.0%) |
| Total (Category) | 1 (10.0%) | 9 (90.0%) |
| Total (Overall) | 61 (62.2%) | 37 (37.8%) |
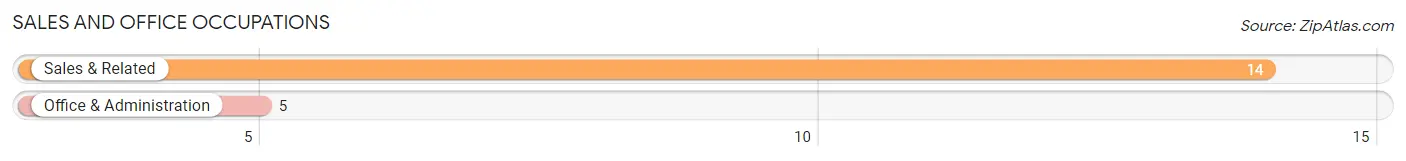
Sales and Office Occupations
The most common Sales and Office occupations in Plainville are Sales & Related (14 | 14.3%), and Office & Administration (5 | 5.1%).
Sales and Office Occupations by Sex

| Occupation | Male | Female |
| Sales & Related | 7 (50.0%) | 7 (50.0%) |
| Office & Administration | 0 (0.0%) | 5 (100.0%) |
| Total (Category) | 7 (36.8%) | 12 (63.2%) |
| Total (Overall) | 61 (62.2%) | 37 (37.8%) |
Natural Resources, Construction and Maintenance Occupations
The most common Natural Resources, Construction and Maintenance occupations in Plainville are Installation, Maintenance & Repair (11 | 11.2%), Construction & Extraction (6 | 6.1%), and Farming, Fishing & Forestry (2 | 2.0%).

Natural Resources, Construction and Maintenance Occupations by Sex
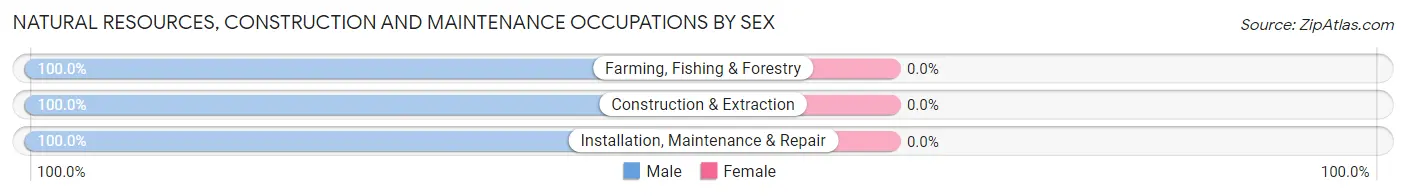
| Occupation | Male | Female |
| Farming, Fishing & Forestry | 2 (100.0%) | 0 (0.0%) |
| Construction & Extraction | 6 (100.0%) | 0 (0.0%) |
| Installation, Maintenance & Repair | 11 (100.0%) | 0 (0.0%) |
| Total (Category) | 19 (100.0%) | 0 (0.0%) |
| Total (Overall) | 61 (62.2%) | 37 (37.8%) |
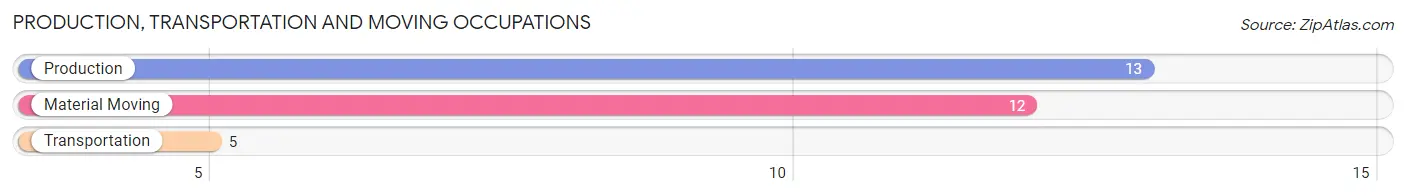
Production, Transportation and Moving Occupations
The most common Production, Transportation and Moving occupations in Plainville are Production (13 | 13.3%), Material Moving (12 | 12.2%), and Transportation (5 | 5.1%).
Production, Transportation and Moving Occupations by Sex
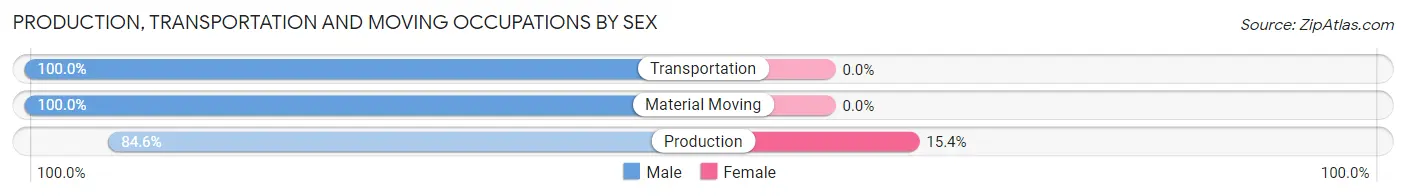
| Occupation | Male | Female |
| Production | 11 (84.6%) | 2 (15.4%) |
| Transportation | 5 (100.0%) | 0 (0.0%) |
| Material Moving | 12 (100.0%) | 0 (0.0%) |
| Total (Category) | 28 (93.3%) | 2 (6.7%) |
| Total (Overall) | 61 (62.2%) | 37 (37.8%) |
Employment Industries by Sex in Plainville
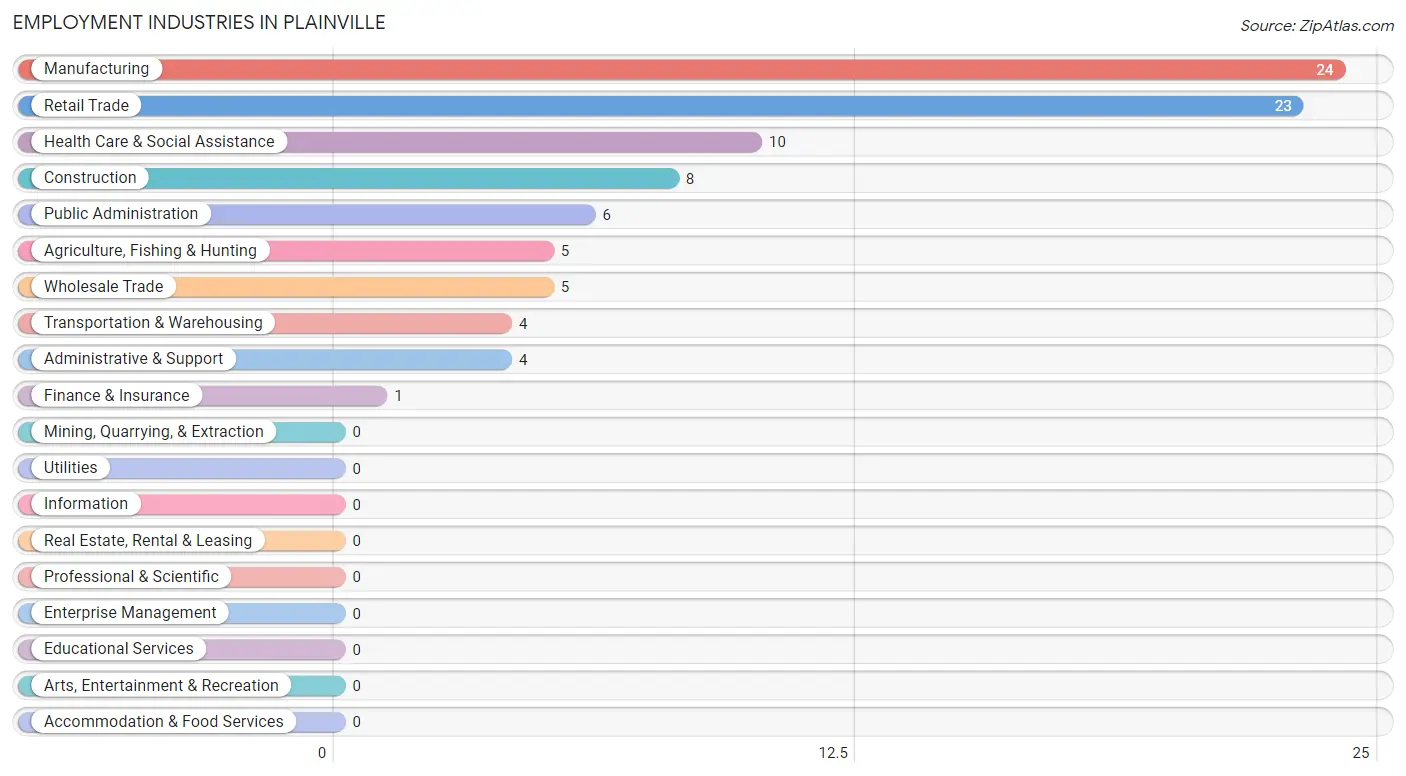
Employment Industries in Plainville
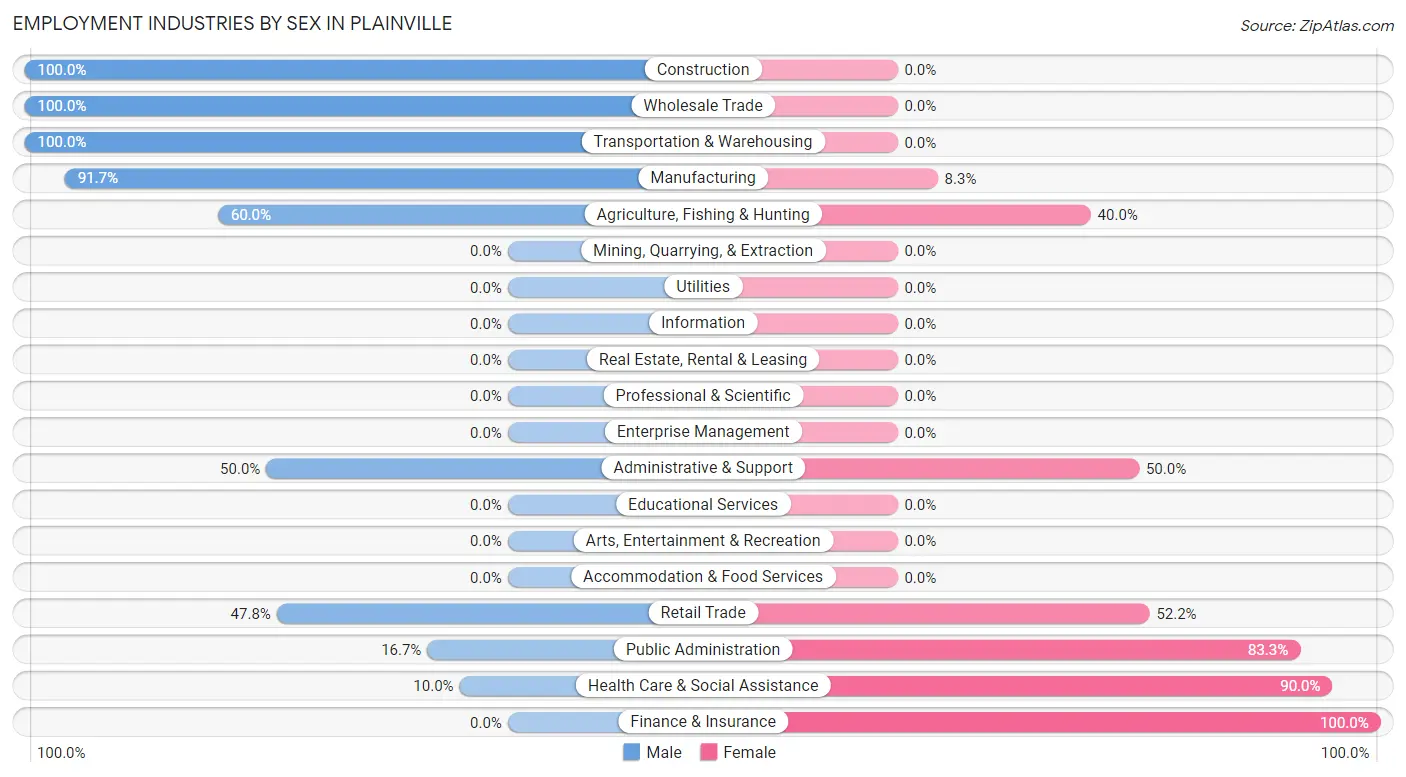
The major employment industries in Plainville include Manufacturing (24 | 24.5%), Retail Trade (23 | 23.5%), Health Care & Social Assistance (10 | 10.2%), Construction (8 | 8.2%), and Public Administration (6 | 6.1%).
Employment Industries by Sex in Plainville
The Plainville industries that see more men than women are Construction (100.0%), Wholesale Trade (100.0%), and Transportation & Warehousing (100.0%), whereas the industries that tend to have a higher number of women are Finance & Insurance (100.0%), Health Care & Social Assistance (90.0%), and Public Administration (83.3%).
| Industry | Male | Female |
| Agriculture, Fishing & Hunting | 3 (60.0%) | 2 (40.0%) |
| Mining, Quarrying, & Extraction | 0 (0.0%) | 0 (0.0%) |
| Construction | 8 (100.0%) | 0 (0.0%) |
| Manufacturing | 22 (91.7%) | 2 (8.3%) |
| Wholesale Trade | 5 (100.0%) | 0 (0.0%) |
| Retail Trade | 11 (47.8%) | 12 (52.2%) |
| Transportation & Warehousing | 4 (100.0%) | 0 (0.0%) |
| Utilities | 0 (0.0%) | 0 (0.0%) |
| Information | 0 (0.0%) | 0 (0.0%) |
| Finance & Insurance | 0 (0.0%) | 1 (100.0%) |
| Real Estate, Rental & Leasing | 0 (0.0%) | 0 (0.0%) |
| Professional & Scientific | 0 (0.0%) | 0 (0.0%) |
| Enterprise Management | 0 (0.0%) | 0 (0.0%) |
| Administrative & Support | 2 (50.0%) | 2 (50.0%) |
| Educational Services | 0 (0.0%) | 0 (0.0%) |
| Health Care & Social Assistance | 1 (10.0%) | 9 (90.0%) |
| Arts, Entertainment & Recreation | 0 (0.0%) | 0 (0.0%) |
| Accommodation & Food Services | 0 (0.0%) | 0 (0.0%) |
| Public Administration | 1 (16.7%) | 5 (83.3%) |
| Total | 61 (62.2%) | 37 (37.8%) |
Education in Plainville
School Enrollment in Plainville
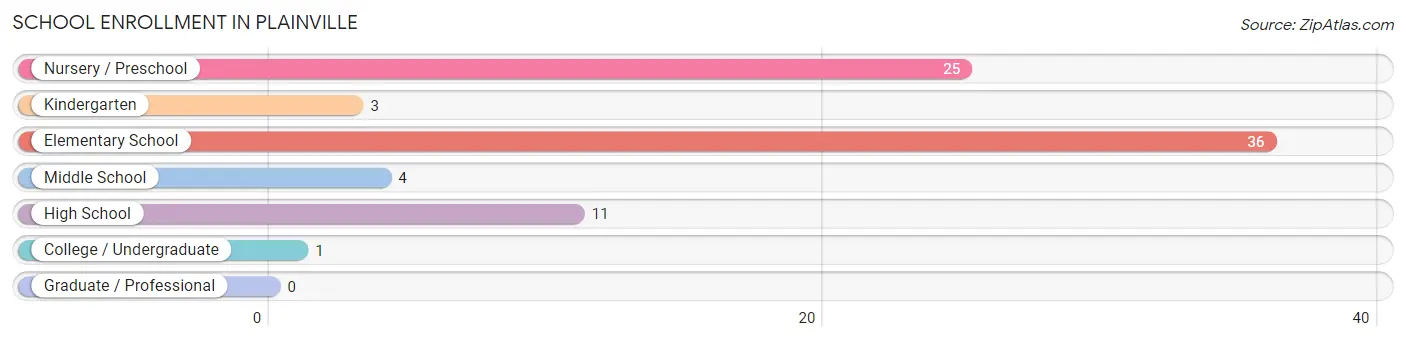
The most common levels of schooling among the 80 students in Plainville are elementary school (36 | 45.0%), nursery / preschool (25 | 31.2%), and high school (11 | 13.8%).
| School Level | # Students | % Students |
| Nursery / Preschool | 25 | 31.2% |
| Kindergarten | 3 | 3.7% |
| Elementary School | 36 | 45.0% |
| Middle School | 4 | 5.0% |
| High School | 11 | 13.8% |
| College / Undergraduate | 1 | 1.3% |
| Graduate / Professional | 0 | 0.0% |
| Total | 80 | 100.0% |
School Enrollment by Age by Funding Source in Plainville
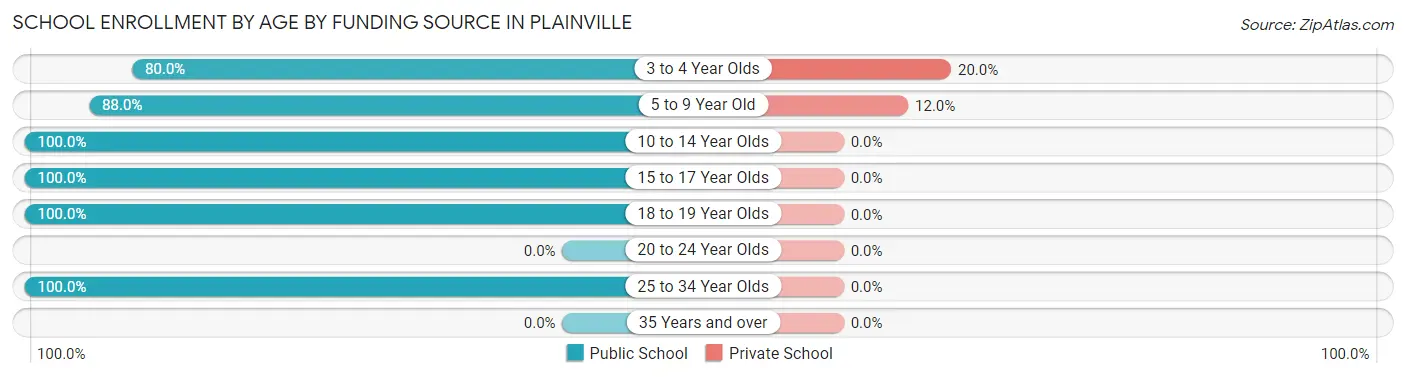
Out of a total of 80 students who are enrolled in schools in Plainville, 8 (10.0%) attend a private institution, while the remaining 72 (90.0%) are enrolled in public schools. The age group of 3 to 4 year olds has the highest likelihood of being enrolled in private schools, with 5 (20.0% in the age bracket) enrolled. Conversely, the age group of 10 to 14 year olds has the lowest likelihood of being enrolled in a private school, with 18 (100.0% in the age bracket) attending a public institution.
| Age Bracket | Public School | Private School |
| 3 to 4 Year Olds | 20 (80.0%) | 5 (20.0%) |
| 5 to 9 Year Old | 22 (88.0%) | 3 (12.0%) |
| 10 to 14 Year Olds | 18 (100.0%) | 0 (0.0%) |
| 15 to 17 Year Olds | 8 (100.0%) | 0 (0.0%) |
| 18 to 19 Year Olds | 3 (100.0%) | 0 (0.0%) |
| 20 to 24 Year Olds | 0 (0.0%) | 0 (0.0%) |
| 25 to 34 Year Olds | 1 (100.0%) | 0 (0.0%) |
| 35 Years and over | 0 (0.0%) | 0 (0.0%) |
| Total | 72 (90.0%) | 8 (10.0%) |
Educational Attainment by Field of Study in Plainville
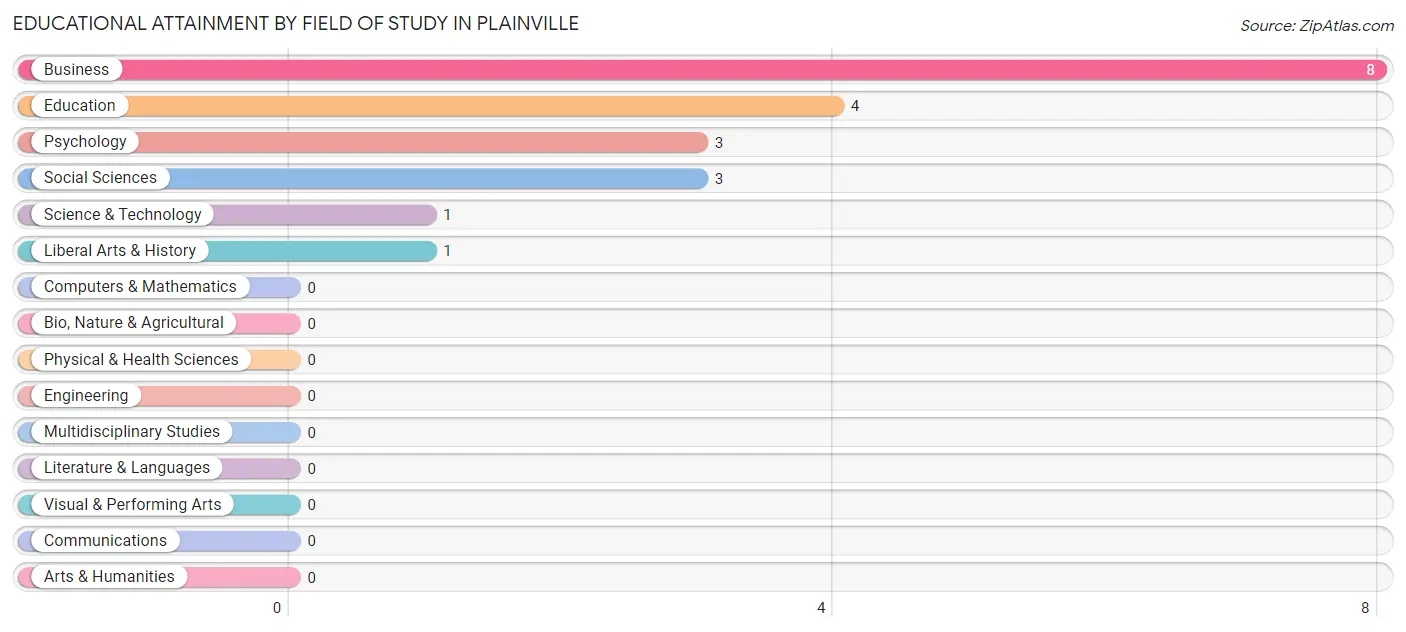
Business (8 | 40.0%), education (4 | 20.0%), psychology (3 | 15.0%), social sciences (3 | 15.0%), and science & technology (1 | 5.0%) are the most common fields of study among 20 individuals in Plainville who have obtained a bachelor's degree or higher.
| Field of Study | # Graduates | % Graduates |
| Computers & Mathematics | 0 | 0.0% |
| Bio, Nature & Agricultural | 0 | 0.0% |
| Physical & Health Sciences | 0 | 0.0% |
| Psychology | 3 | 15.0% |
| Social Sciences | 3 | 15.0% |
| Engineering | 0 | 0.0% |
| Multidisciplinary Studies | 0 | 0.0% |
| Science & Technology | 1 | 5.0% |
| Business | 8 | 40.0% |
| Education | 4 | 20.0% |
| Literature & Languages | 0 | 0.0% |
| Liberal Arts & History | 1 | 5.0% |
| Visual & Performing Arts | 0 | 0.0% |
| Communications | 0 | 0.0% |
| Arts & Humanities | 0 | 0.0% |
| Total | 20 | 100.0% |
Transportation & Commute in Plainville
Vehicle Availability by Sex in Plainville
The most prevalent vehicle ownership categories in Plainville are males with 2 vehicles (23, accounting for 39.0%) and females with 2 vehicles (10, making up 71.9%).
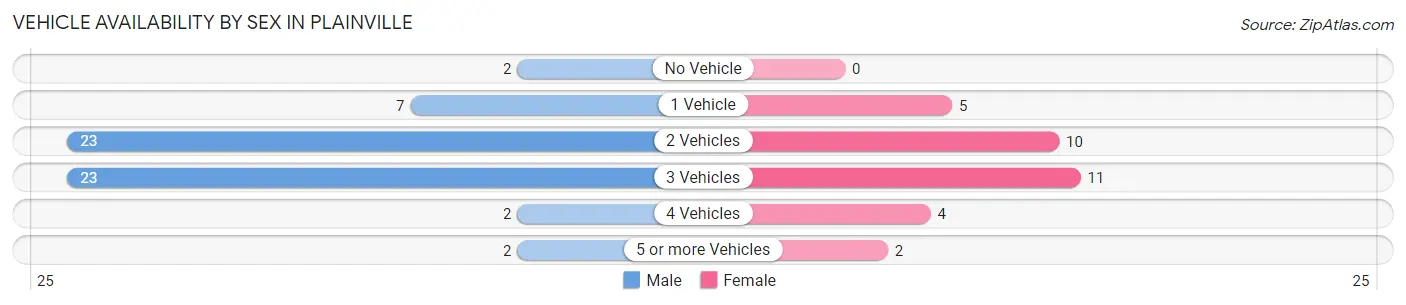
| Vehicles Available | Male | Female |
| No Vehicle | 2 (3.4%) | 0 (0.0%) |
| 1 Vehicle | 7 (11.9%) | 5 (15.6%) |
| 2 Vehicles | 23 (39.0%) | 10 (31.2%) |
| 3 Vehicles | 23 (39.0%) | 11 (34.4%) |
| 4 Vehicles | 2 (3.4%) | 4 (12.5%) |
| 5 or more Vehicles | 2 (3.4%) | 2 (6.2%) |
| Total | 59 (100.0%) | 32 (100.0%) |
Commute Time in Plainville
The most frequently occuring commute durations in Plainville are 25 to 29 minutes (29 commuters, 31.9%), 30 to 34 minutes (23 commuters, 25.3%), and 20 to 24 minutes (12 commuters, 13.2%).
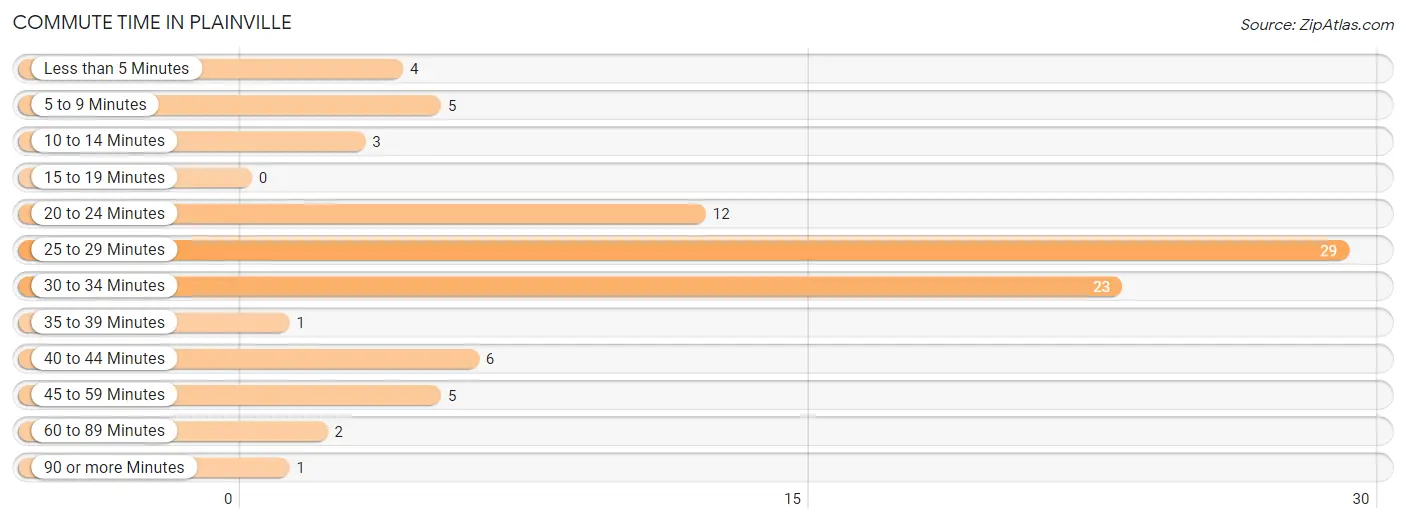
| Commute Time | # Commuters | % Commuters |
| Less than 5 Minutes | 4 | 4.4% |
| 5 to 9 Minutes | 5 | 5.5% |
| 10 to 14 Minutes | 3 | 3.3% |
| 15 to 19 Minutes | 0 | 0.0% |
| 20 to 24 Minutes | 12 | 13.2% |
| 25 to 29 Minutes | 29 | 31.9% |
| 30 to 34 Minutes | 23 | 25.3% |
| 35 to 39 Minutes | 1 | 1.1% |
| 40 to 44 Minutes | 6 | 6.6% |
| 45 to 59 Minutes | 5 | 5.5% |
| 60 to 89 Minutes | 2 | 2.2% |
| 90 or more Minutes | 1 | 1.1% |
Commute Time by Sex in Plainville
The most common commute times in Plainville are 25 to 29 minutes (23 commuters, 39.0%) for males and 30 to 34 minutes (9 commuters, 28.1%) for females.
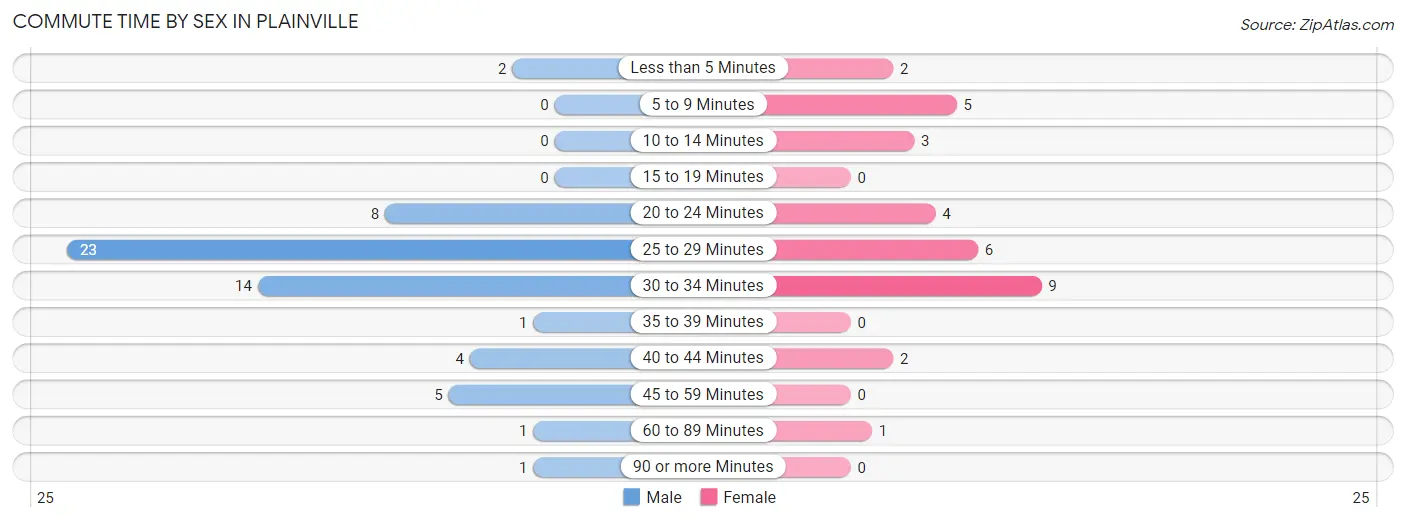
| Commute Time | Male | Female |
| Less than 5 Minutes | 2 (3.4%) | 2 (6.2%) |
| 5 to 9 Minutes | 0 (0.0%) | 5 (15.6%) |
| 10 to 14 Minutes | 0 (0.0%) | 3 (9.4%) |
| 15 to 19 Minutes | 0 (0.0%) | 0 (0.0%) |
| 20 to 24 Minutes | 8 (13.6%) | 4 (12.5%) |
| 25 to 29 Minutes | 23 (39.0%) | 6 (18.8%) |
| 30 to 34 Minutes | 14 (23.7%) | 9 (28.1%) |
| 35 to 39 Minutes | 1 (1.7%) | 0 (0.0%) |
| 40 to 44 Minutes | 4 (6.8%) | 2 (6.2%) |
| 45 to 59 Minutes | 5 (8.5%) | 0 (0.0%) |
| 60 to 89 Minutes | 1 (1.7%) | 1 (3.1%) |
| 90 or more Minutes | 1 (1.7%) | 0 (0.0%) |
Time of Departure to Work by Sex in Plainville
The most frequent times of departure to work in Plainville are 6:00 AM to 6:29 AM (12, 20.3%) for males and 4:00 PM to 11:59 PM (6, 18.8%) for females.
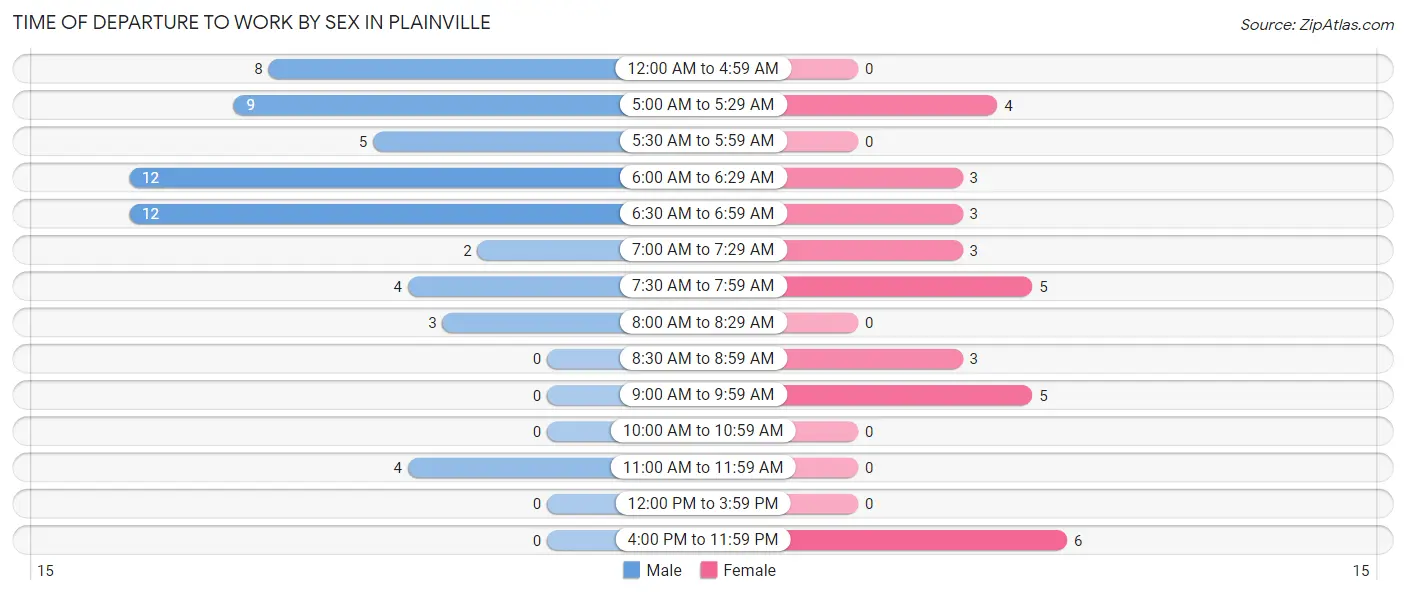
| Time of Departure | Male | Female |
| 12:00 AM to 4:59 AM | 8 (13.6%) | 0 (0.0%) |
| 5:00 AM to 5:29 AM | 9 (15.2%) | 4 (12.5%) |
| 5:30 AM to 5:59 AM | 5 (8.5%) | 0 (0.0%) |
| 6:00 AM to 6:29 AM | 12 (20.3%) | 3 (9.4%) |
| 6:30 AM to 6:59 AM | 12 (20.3%) | 3 (9.4%) |
| 7:00 AM to 7:29 AM | 2 (3.4%) | 3 (9.4%) |
| 7:30 AM to 7:59 AM | 4 (6.8%) | 5 (15.6%) |
| 8:00 AM to 8:29 AM | 3 (5.1%) | 0 (0.0%) |
| 8:30 AM to 8:59 AM | 0 (0.0%) | 3 (9.4%) |
| 9:00 AM to 9:59 AM | 0 (0.0%) | 5 (15.6%) |
| 10:00 AM to 10:59 AM | 0 (0.0%) | 0 (0.0%) |
| 11:00 AM to 11:59 AM | 4 (6.8%) | 0 (0.0%) |
| 12:00 PM to 3:59 PM | 0 (0.0%) | 0 (0.0%) |
| 4:00 PM to 11:59 PM | 0 (0.0%) | 6 (18.8%) |
| Total | 59 (100.0%) | 32 (100.0%) |
Housing Occupancy in Plainville
Occupancy by Ownership in Plainville
Of the total 95 dwellings in Plainville, owner-occupied units account for 86 (90.5%), while renter-occupied units make up 9 (9.5%).
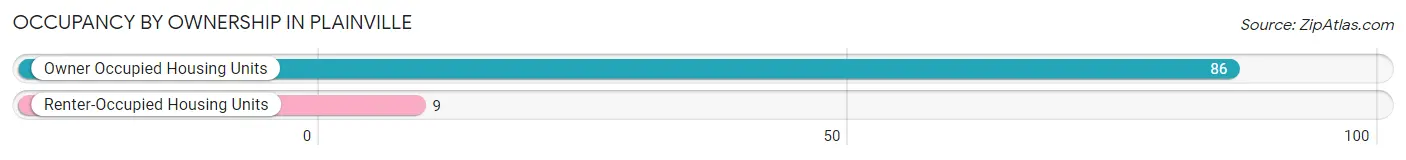
| Occupancy | # Housing Units | % Housing Units |
| Owner Occupied Housing Units | 86 | 90.5% |
| Renter-Occupied Housing Units | 9 | 9.5% |
| Total Occupied Housing Units | 95 | 100.0% |
Occupancy by Household Size in Plainville
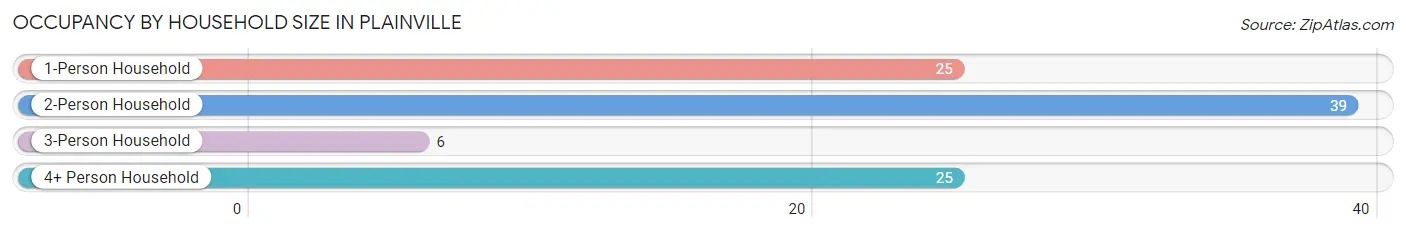
| Household Size | # Housing Units | % Housing Units |
| 1-Person Household | 25 | 26.3% |
| 2-Person Household | 39 | 41.0% |
| 3-Person Household | 6 | 6.3% |
| 4+ Person Household | 25 | 26.3% |
| Total Housing Units | 95 | 100.0% |
Occupancy by Ownership by Household Size in Plainville
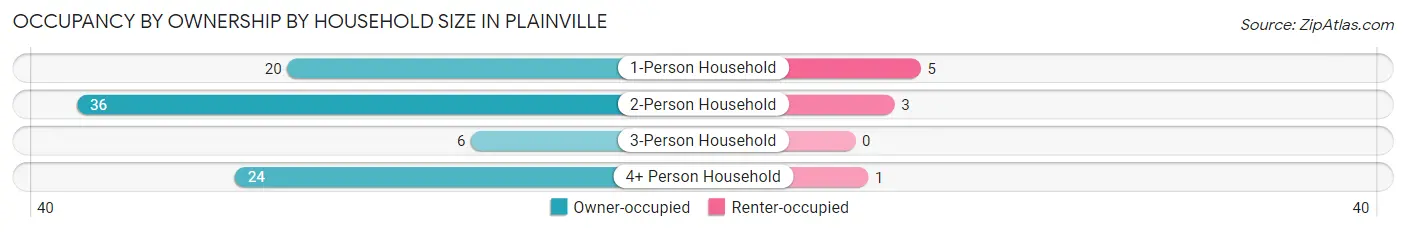
| Household Size | Owner-occupied | Renter-occupied |
| 1-Person Household | 20 (80.0%) | 5 (20.0%) |
| 2-Person Household | 36 (92.3%) | 3 (7.7%) |
| 3-Person Household | 6 (100.0%) | 0 (0.0%) |
| 4+ Person Household | 24 (96.0%) | 1 (4.0%) |
| Total Housing Units | 86 (90.5%) | 9 (9.5%) |
Occupancy by Educational Attainment in Plainville
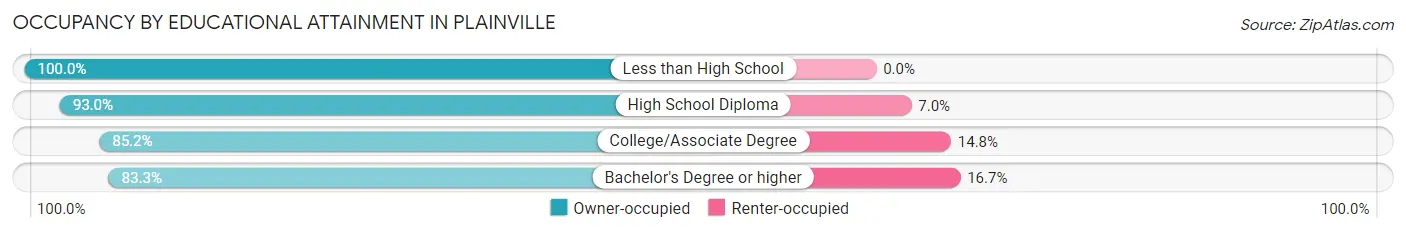
| Household Size | Owner-occupied | Renter-occupied |
| Less than High School | 13 (100.0%) | 0 (0.0%) |
| High School Diploma | 40 (93.0%) | 3 (7.0%) |
| College/Associate Degree | 23 (85.2%) | 4 (14.8%) |
| Bachelor's Degree or higher | 10 (83.3%) | 2 (16.7%) |
Occupancy by Age of Householder in Plainville
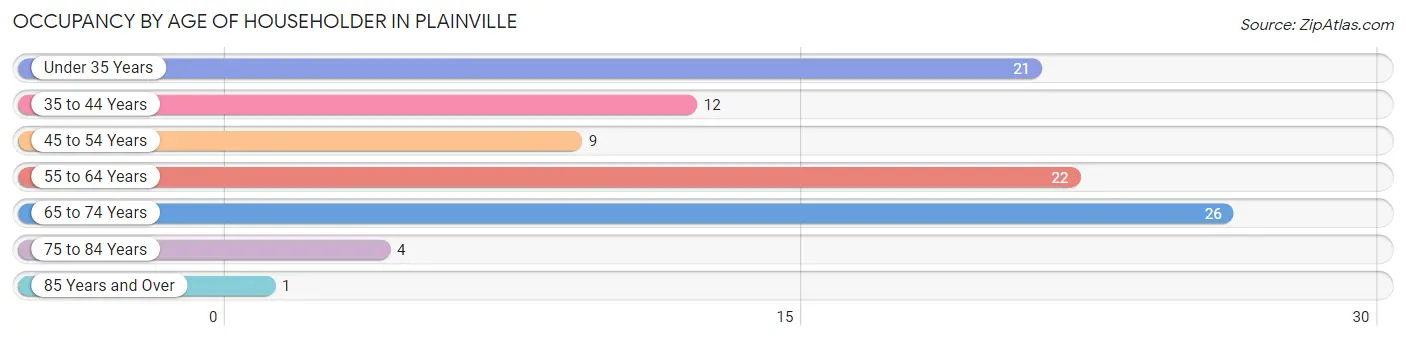
| Age Bracket | # Households | % Households |
| Under 35 Years | 21 | 22.1% |
| 35 to 44 Years | 12 | 12.6% |
| 45 to 54 Years | 9 | 9.5% |
| 55 to 64 Years | 22 | 23.2% |
| 65 to 74 Years | 26 | 27.4% |
| 75 to 84 Years | 4 | 4.2% |
| 85 Years and Over | 1 | 1.1% |
| Total | 95 | 100.0% |
Housing Finances in Plainville
Median Income by Occupancy in Plainville
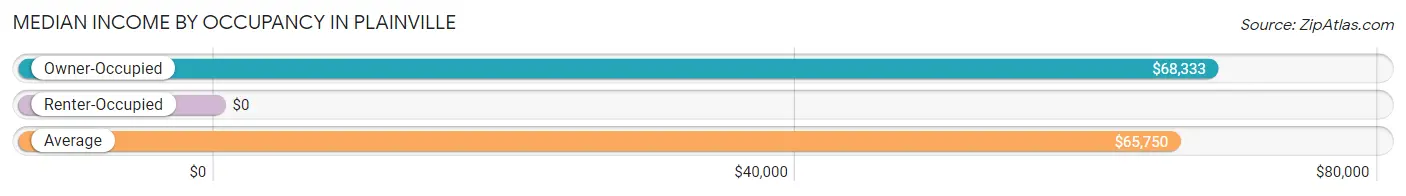
| Occupancy Type | # Households | Median Income |
| Owner-Occupied | 86 (90.5%) | $68,333 |
| Renter-Occupied | 9 (9.5%) | $0 |
| Average | 95 (100.0%) | $65,750 |
Occupancy by Householder Income Bracket in Plainville
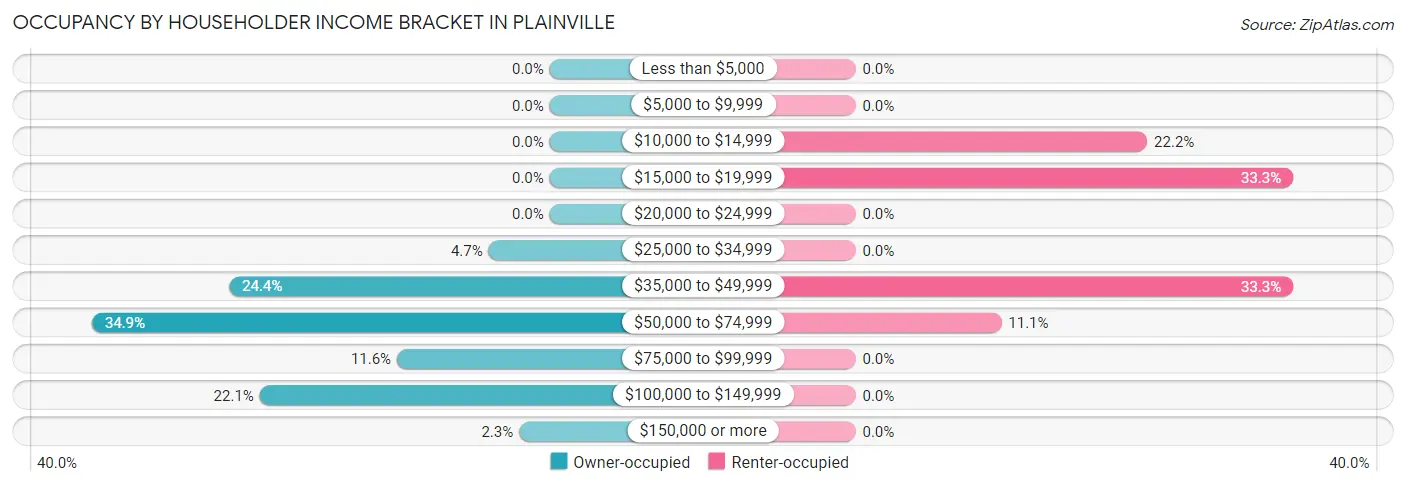
| Income Bracket | Owner-occupied | Renter-occupied |
| Less than $5,000 | 0 (0.0%) | 0 (0.0%) |
| $5,000 to $9,999 | 0 (0.0%) | 0 (0.0%) |
| $10,000 to $14,999 | 0 (0.0%) | 2 (22.2%) |
| $15,000 to $19,999 | 0 (0.0%) | 3 (33.3%) |
| $20,000 to $24,999 | 0 (0.0%) | 0 (0.0%) |
| $25,000 to $34,999 | 4 (4.6%) | 0 (0.0%) |
| $35,000 to $49,999 | 21 (24.4%) | 3 (33.3%) |
| $50,000 to $74,999 | 30 (34.9%) | 1 (11.1%) |
| $75,000 to $99,999 | 10 (11.6%) | 0 (0.0%) |
| $100,000 to $149,999 | 19 (22.1%) | 0 (0.0%) |
| $150,000 or more | 2 (2.3%) | 0 (0.0%) |
| Total | 86 (100.0%) | 9 (100.0%) |
Monthly Housing Cost Tiers in Plainville

| Monthly Cost | Owner-occupied | Renter-occupied |
| Less than $300 | 11 (12.8%) | 0 (0.0%) |
| $300 to $499 | 27 (31.4%) | 0 (0.0%) |
| $500 to $799 | 15 (17.4%) | 5 (55.6%) |
| $800 to $999 | 13 (15.1%) | 3 (33.3%) |
| $1,000 to $1,499 | 16 (18.6%) | 0 (0.0%) |
| $1,500 to $1,999 | 3 (3.5%) | 0 (0.0%) |
| $2,000 to $2,499 | 1 (1.2%) | 0 (0.0%) |
| $2,500 to $2,999 | 0 (0.0%) | 0 (0.0%) |
| $3,000 or more | 0 (0.0%) | 0 (0.0%) |
| Total | 86 (100.0%) | 9 (100.0%) |
Physical Housing Characteristics in Plainville
Housing Structures in Plainville
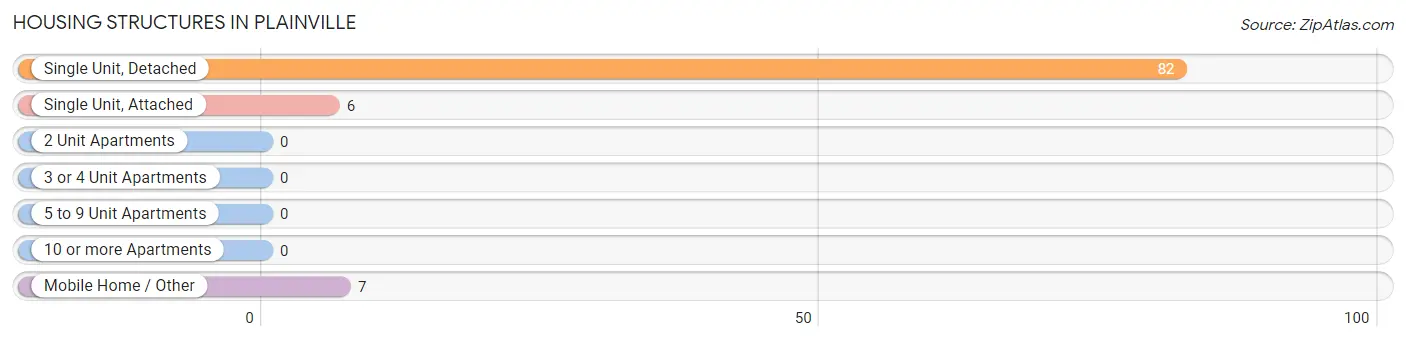
| Structure Type | # Housing Units | % Housing Units |
| Single Unit, Detached | 82 | 86.3% |
| Single Unit, Attached | 6 | 6.3% |
| 2 Unit Apartments | 0 | 0.0% |
| 3 or 4 Unit Apartments | 0 | 0.0% |
| 5 to 9 Unit Apartments | 0 | 0.0% |
| 10 or more Apartments | 0 | 0.0% |
| Mobile Home / Other | 7 | 7.4% |
| Total | 95 | 100.0% |
Housing Structures by Occupancy in Plainville
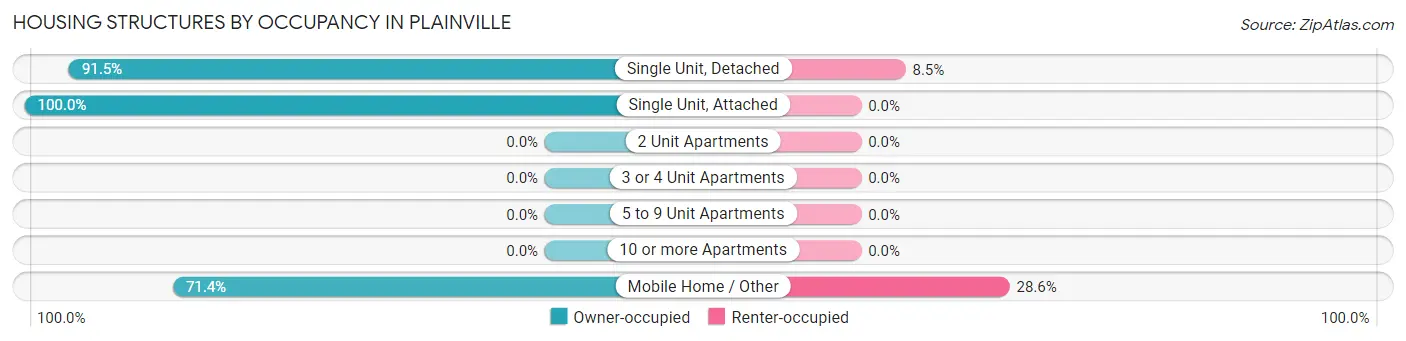
| Structure Type | Owner-occupied | Renter-occupied |
| Single Unit, Detached | 75 (91.5%) | 7 (8.5%) |
| Single Unit, Attached | 6 (100.0%) | 0 (0.0%) |
| 2 Unit Apartments | 0 (0.0%) | 0 (0.0%) |
| 3 or 4 Unit Apartments | 0 (0.0%) | 0 (0.0%) |
| 5 to 9 Unit Apartments | 0 (0.0%) | 0 (0.0%) |
| 10 or more Apartments | 0 (0.0%) | 0 (0.0%) |
| Mobile Home / Other | 5 (71.4%) | 2 (28.6%) |
| Total | 86 (90.5%) | 9 (9.5%) |
Housing Structures by Number of Rooms in Plainville
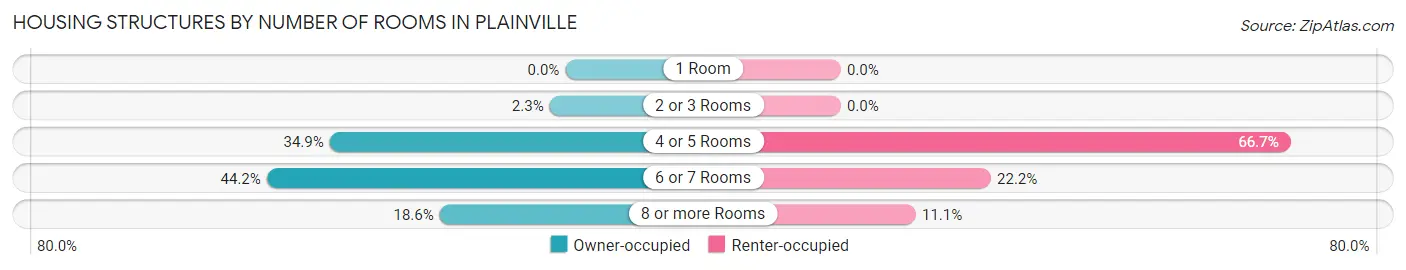
| Number of Rooms | Owner-occupied | Renter-occupied |
| 1 Room | 0 (0.0%) | 0 (0.0%) |
| 2 or 3 Rooms | 2 (2.3%) | 0 (0.0%) |
| 4 or 5 Rooms | 30 (34.9%) | 6 (66.7%) |
| 6 or 7 Rooms | 38 (44.2%) | 2 (22.2%) |
| 8 or more Rooms | 16 (18.6%) | 1 (11.1%) |
| Total | 86 (100.0%) | 9 (100.0%) |
Housing Structure by Heating Type in Plainville
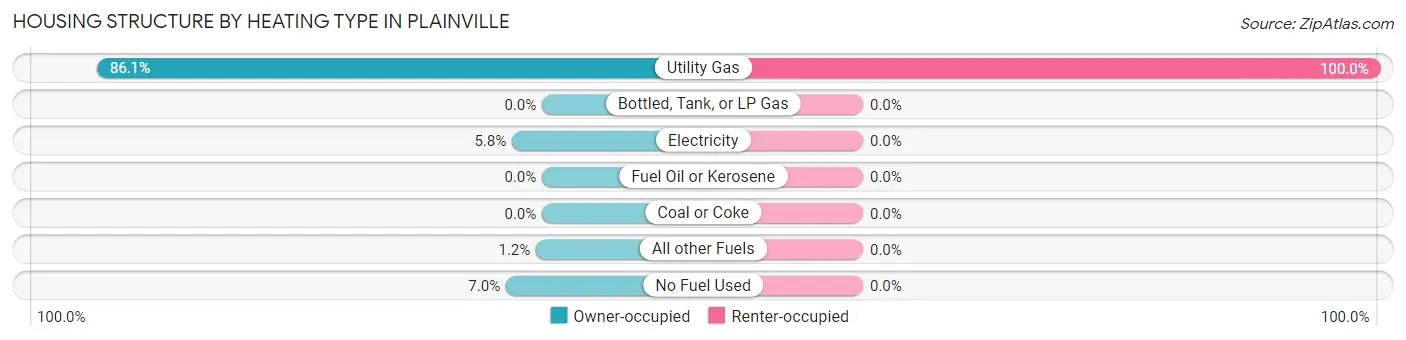
| Heating Type | Owner-occupied | Renter-occupied |
| Utility Gas | 74 (86.1%) | 9 (100.0%) |
| Bottled, Tank, or LP Gas | 0 (0.0%) | 0 (0.0%) |
| Electricity | 5 (5.8%) | 0 (0.0%) |
| Fuel Oil or Kerosene | 0 (0.0%) | 0 (0.0%) |
| Coal or Coke | 0 (0.0%) | 0 (0.0%) |
| All other Fuels | 1 (1.2%) | 0 (0.0%) |
| No Fuel Used | 6 (7.0%) | 0 (0.0%) |
| Total | 86 (100.0%) | 9 (100.0%) |
Household Vehicle Usage in Plainville
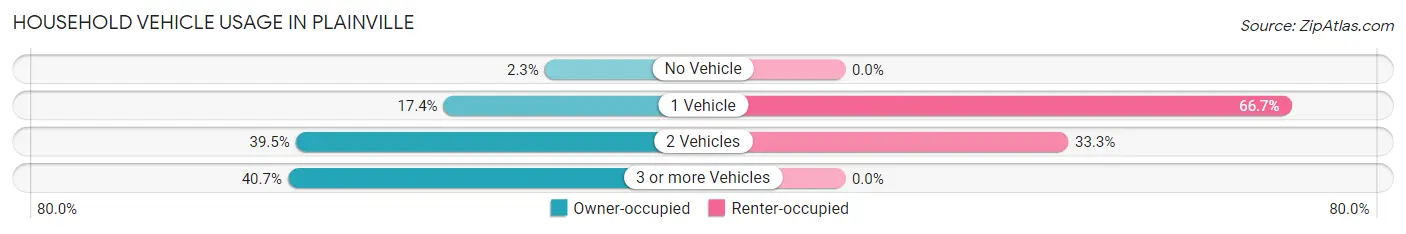
| Vehicles per Household | Owner-occupied | Renter-occupied |
| No Vehicle | 2 (2.3%) | 0 (0.0%) |
| 1 Vehicle | 15 (17.4%) | 6 (66.7%) |
| 2 Vehicles | 34 (39.5%) | 3 (33.3%) |
| 3 or more Vehicles | 35 (40.7%) | 0 (0.0%) |
| Total | 86 (100.0%) | 9 (100.0%) |
Real Estate & Mortgages in Plainville
Real Estate and Mortgage Overview in Plainville
| Characteristic | Without Mortgage | With Mortgage |
| Housing Units | 44 | 42 |
| Median Property Value | $71,300 | $94,500 |
| Median Household Income | $60,833 | $0 |
| Monthly Housing Costs | $378 | $0 |
| Real Estate Taxes | $986 | $0 |
Property Value by Mortgage Status in Plainville
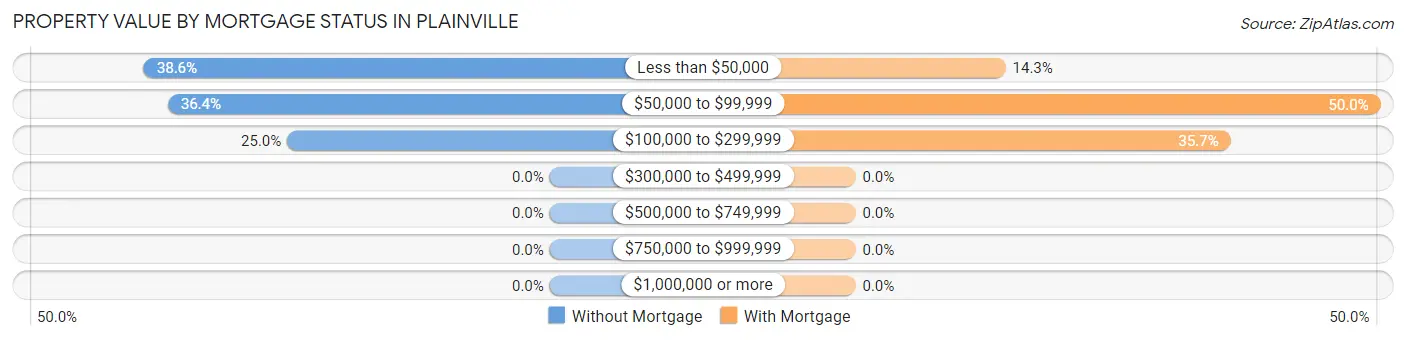
| Property Value | Without Mortgage | With Mortgage |
| Less than $50,000 | 17 (38.6%) | 6 (14.3%) |
| $50,000 to $99,999 | 16 (36.4%) | 21 (50.0%) |
| $100,000 to $299,999 | 11 (25.0%) | 15 (35.7%) |
| $300,000 to $499,999 | 0 (0.0%) | 0 (0.0%) |
| $500,000 to $749,999 | 0 (0.0%) | 0 (0.0%) |
| $750,000 to $999,999 | 0 (0.0%) | 0 (0.0%) |
| $1,000,000 or more | 0 (0.0%) | 0 (0.0%) |
| Total | 44 (100.0%) | 42 (100.0%) |
Household Income by Mortgage Status in Plainville
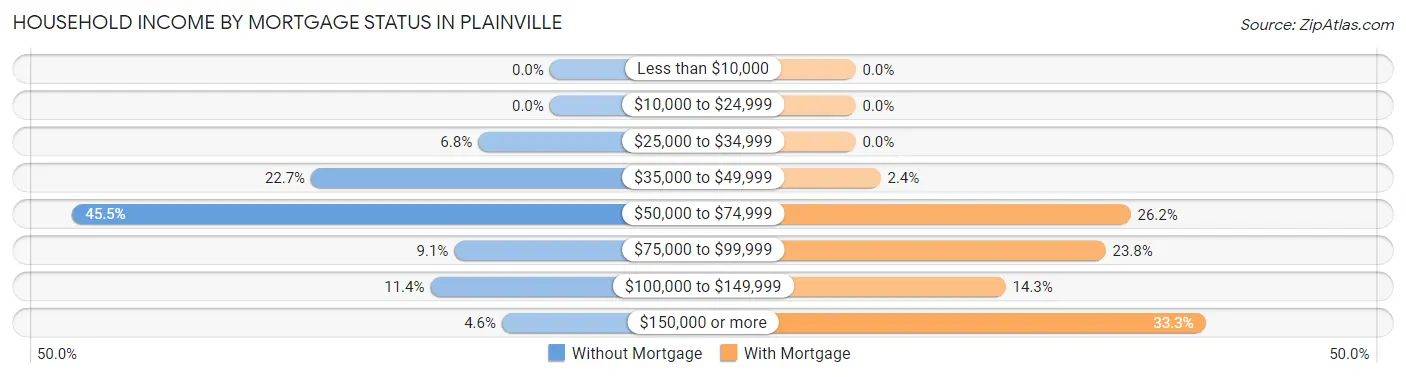
| Household Income | Without Mortgage | With Mortgage |
| Less than $10,000 | 0 (0.0%) | 0 (0.0%) |
| $10,000 to $24,999 | 0 (0.0%) | 0 (0.0%) |
| $25,000 to $34,999 | 3 (6.8%) | 0 (0.0%) |
| $35,000 to $49,999 | 10 (22.7%) | 1 (2.4%) |
| $50,000 to $74,999 | 20 (45.5%) | 11 (26.2%) |
| $75,000 to $99,999 | 4 (9.1%) | 10 (23.8%) |
| $100,000 to $149,999 | 5 (11.4%) | 6 (14.3%) |
| $150,000 or more | 2 (4.5%) | 14 (33.3%) |
| Total | 44 (100.0%) | 42 (100.0%) |
Property Value to Household Income Ratio in Plainville
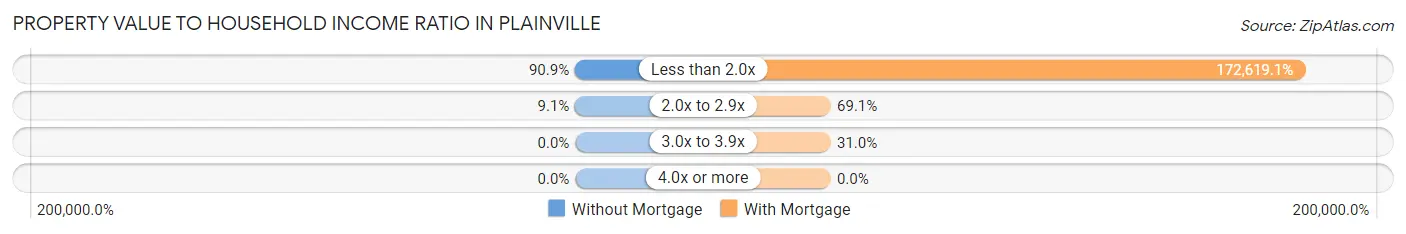
| Value-to-Income Ratio | Without Mortgage | With Mortgage |
| Less than 2.0x | 40 (90.9%) | 72,500 (172,619.0%) |
| 2.0x to 2.9x | 4 (9.1%) | 29 (69.1%) |
| 3.0x to 3.9x | 0 (0.0%) | 13 (30.9%) |
| 4.0x or more | 0 (0.0%) | 0 (0.0%) |
| Total | 44 (100.0%) | 42 (100.0%) |
Real Estate Taxes by Mortgage Status in Plainville
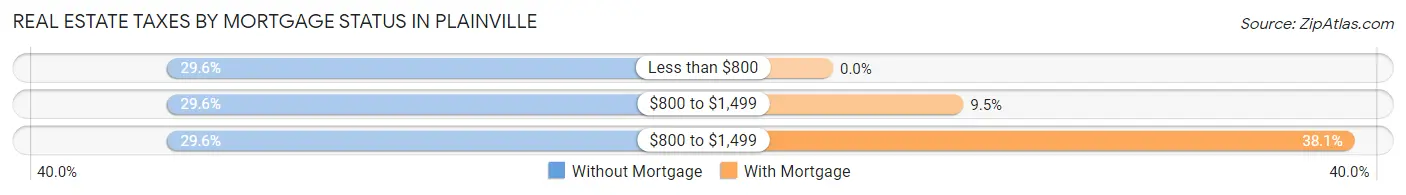
| Property Taxes | Without Mortgage | With Mortgage |
| Less than $800 | 13 (29.5%) | 0 (0.0%) |
| $800 to $1,499 | 13 (29.5%) | 4 (9.5%) |
| $800 to $1,499 | 13 (29.5%) | 16 (38.1%) |
| Total | 44 (100.0%) | 42 (100.0%) |
Health & Disability in Plainville
Health Insurance Coverage by Age in Plainville
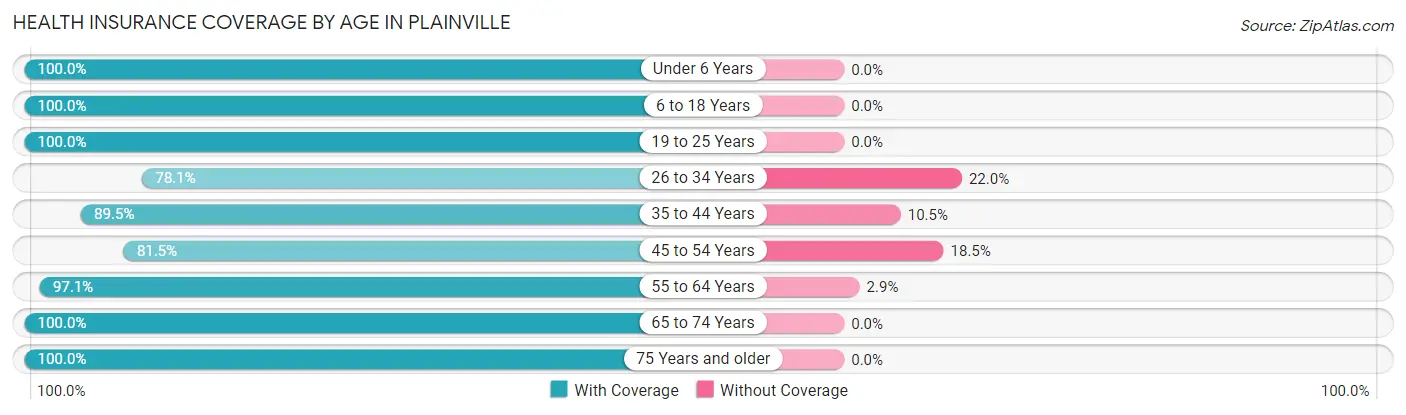
| Age Bracket | With Coverage | Without Coverage |
| Under 6 Years | 39 (100.0%) | 0 (0.0%) |
| 6 to 18 Years | 54 (100.0%) | 0 (0.0%) |
| 19 to 25 Years | 5 (100.0%) | 0 (0.0%) |
| 26 to 34 Years | 32 (78.0%) | 9 (22.0%) |
| 35 to 44 Years | 17 (89.5%) | 2 (10.5%) |
| 45 to 54 Years | 22 (81.5%) | 5 (18.5%) |
| 55 to 64 Years | 34 (97.1%) | 1 (2.9%) |
| 65 to 74 Years | 36 (100.0%) | 0 (0.0%) |
| 75 Years and older | 13 (100.0%) | 0 (0.0%) |
| Total | 252 (93.7%) | 17 (6.3%) |
Health Insurance Coverage by Citizenship Status in Plainville
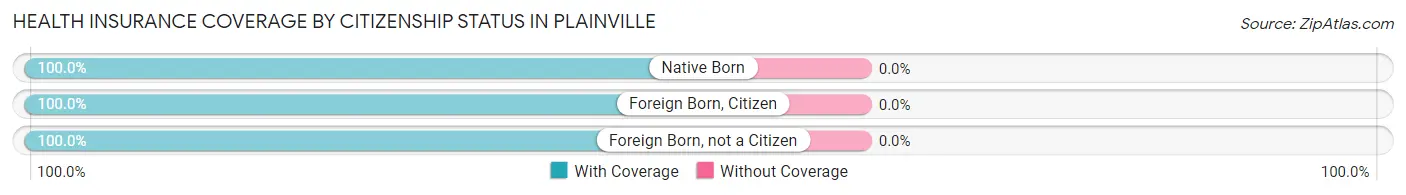
| Citizenship Status | With Coverage | Without Coverage |
| Native Born | 39 (100.0%) | 0 (0.0%) |
| Foreign Born, Citizen | 54 (100.0%) | 0 (0.0%) |
| Foreign Born, not a Citizen | 5 (100.0%) | 0 (0.0%) |
Health Insurance Coverage by Household Income in Plainville
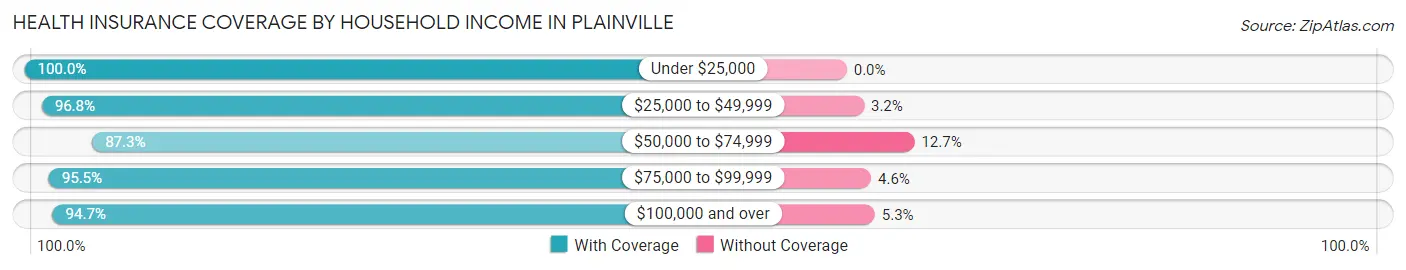
| Household Income | With Coverage | Without Coverage |
| Under $25,000 | 19 (100.0%) | 0 (0.0%) |
| $25,000 to $49,999 | 60 (96.8%) | 2 (3.2%) |
| $50,000 to $74,999 | 62 (87.3%) | 9 (12.7%) |
| $75,000 to $99,999 | 21 (95.5%) | 1 (4.5%) |
| $100,000 and over | 90 (94.7%) | 5 (5.3%) |
Public vs Private Health Insurance Coverage by Age in Plainville
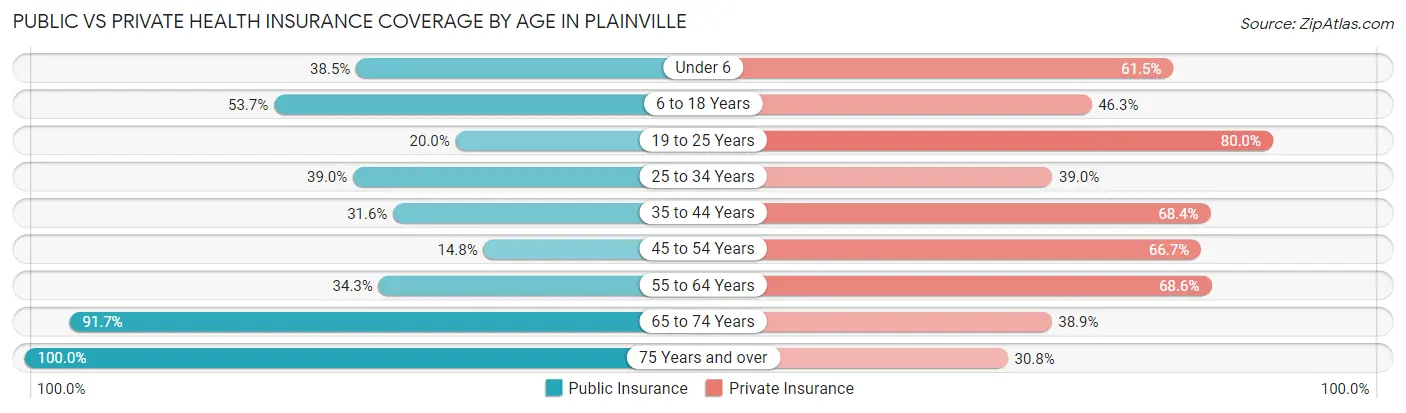
| Age Bracket | Public Insurance | Private Insurance |
| Under 6 | 15 (38.5%) | 24 (61.5%) |
| 6 to 18 Years | 29 (53.7%) | 25 (46.3%) |
| 19 to 25 Years | 1 (20.0%) | 4 (80.0%) |
| 25 to 34 Years | 16 (39.0%) | 16 (39.0%) |
| 35 to 44 Years | 6 (31.6%) | 13 (68.4%) |
| 45 to 54 Years | 4 (14.8%) | 18 (66.7%) |
| 55 to 64 Years | 12 (34.3%) | 24 (68.6%) |
| 65 to 74 Years | 33 (91.7%) | 14 (38.9%) |
| 75 Years and over | 13 (100.0%) | 4 (30.8%) |
| Total | 129 (48.0%) | 142 (52.8%) |
Disability Status by Sex by Age in Plainville
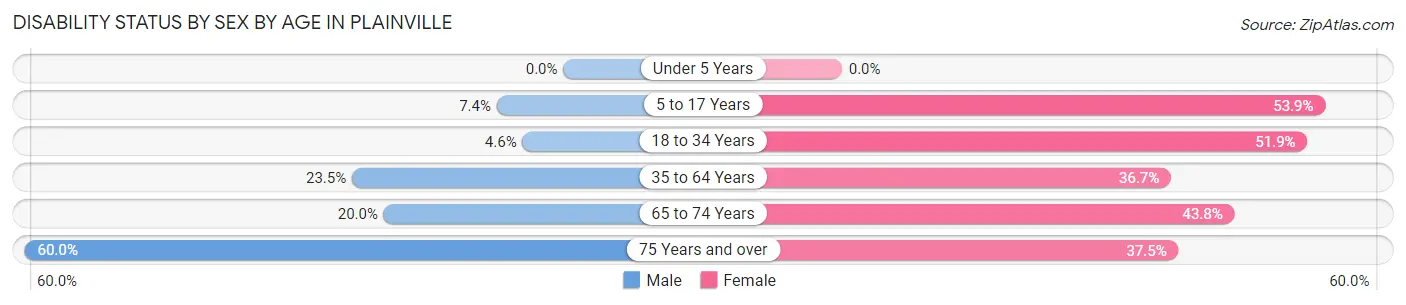
| Age Bracket | Male | Female |
| Under 5 Years | 0 (0.0%) | 0 (0.0%) |
| 5 to 17 Years | 2 (7.4%) | 14 (53.8%) |
| 18 to 34 Years | 1 (4.5%) | 14 (51.8%) |
| 35 to 64 Years | 12 (23.5%) | 11 (36.7%) |
| 65 to 74 Years | 4 (20.0%) | 7 (43.8%) |
| 75 Years and over | 3 (60.0%) | 3 (37.5%) |
Disability Class by Sex by Age in Plainville
Disability Class: Hearing Difficulty
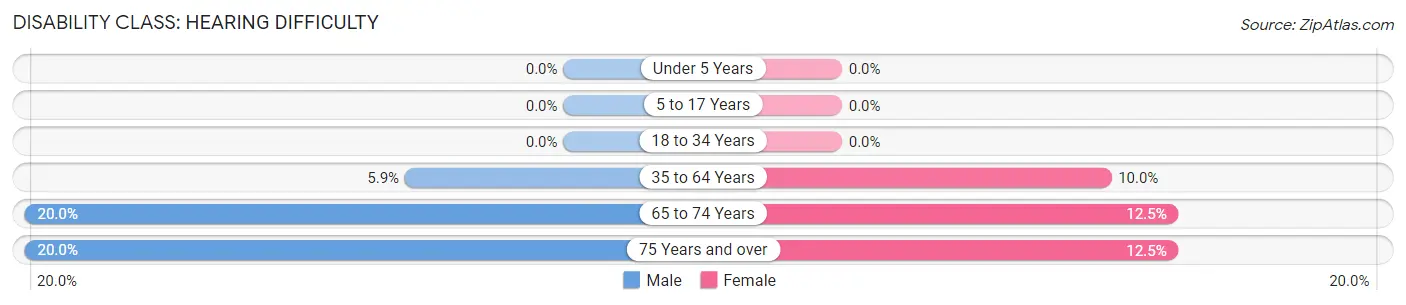
| Age Bracket | Male | Female |
| Under 5 Years | 0 (0.0%) | 0 (0.0%) |
| 5 to 17 Years | 0 (0.0%) | 0 (0.0%) |
| 18 to 34 Years | 0 (0.0%) | 0 (0.0%) |
| 35 to 64 Years | 3 (5.9%) | 3 (10.0%) |
| 65 to 74 Years | 4 (20.0%) | 2 (12.5%) |
| 75 Years and over | 1 (20.0%) | 1 (12.5%) |
Disability Class: Vision Difficulty
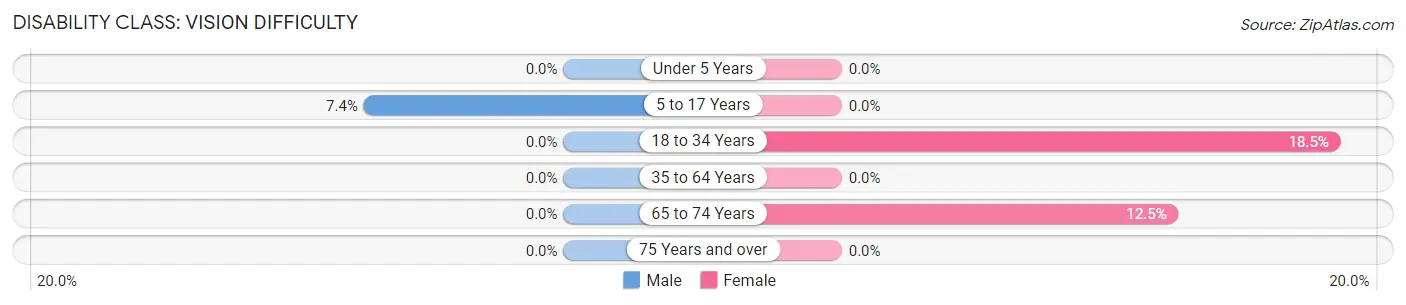
| Age Bracket | Male | Female |
| Under 5 Years | 0 (0.0%) | 0 (0.0%) |
| 5 to 17 Years | 2 (7.4%) | 0 (0.0%) |
| 18 to 34 Years | 0 (0.0%) | 5 (18.5%) |
| 35 to 64 Years | 0 (0.0%) | 0 (0.0%) |
| 65 to 74 Years | 0 (0.0%) | 2 (12.5%) |
| 75 Years and over | 0 (0.0%) | 0 (0.0%) |
Disability Class: Cognitive Difficulty
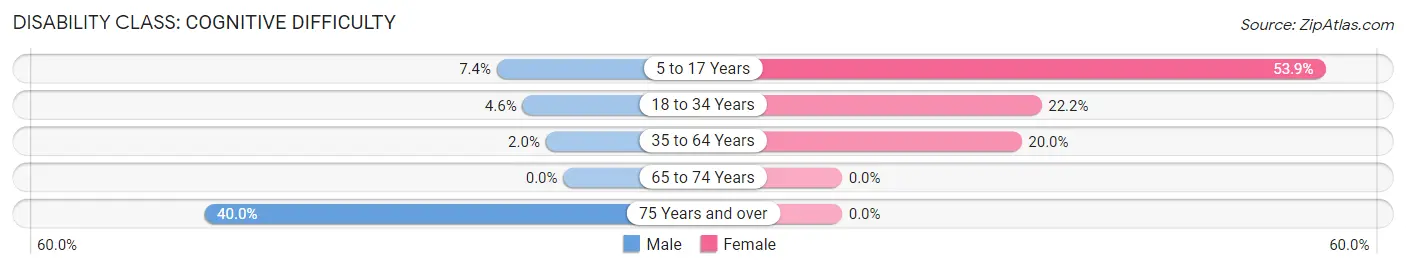
| Age Bracket | Male | Female |
| 5 to 17 Years | 2 (7.4%) | 14 (53.8%) |
| 18 to 34 Years | 1 (4.5%) | 6 (22.2%) |
| 35 to 64 Years | 1 (2.0%) | 6 (20.0%) |
| 65 to 74 Years | 0 (0.0%) | 0 (0.0%) |
| 75 Years and over | 2 (40.0%) | 0 (0.0%) |
Disability Class: Ambulatory Difficulty
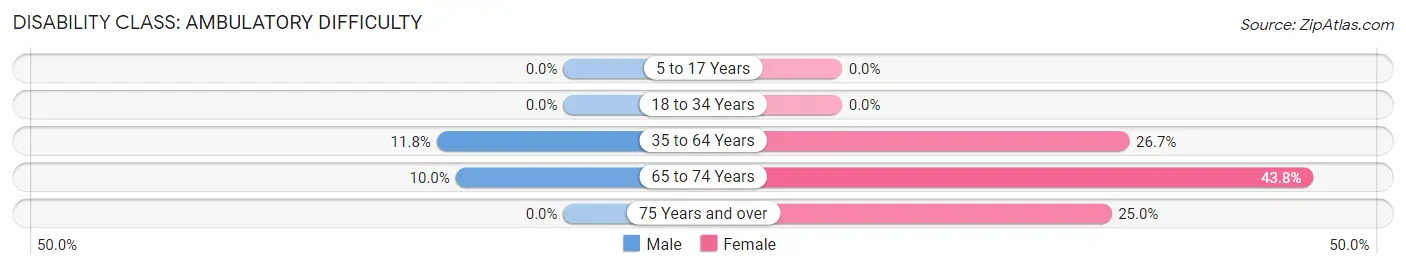
| Age Bracket | Male | Female |
| 5 to 17 Years | 0 (0.0%) | 0 (0.0%) |
| 18 to 34 Years | 0 (0.0%) | 0 (0.0%) |
| 35 to 64 Years | 6 (11.8%) | 8 (26.7%) |
| 65 to 74 Years | 2 (10.0%) | 7 (43.8%) |
| 75 Years and over | 0 (0.0%) | 2 (25.0%) |
Disability Class: Self-Care Difficulty
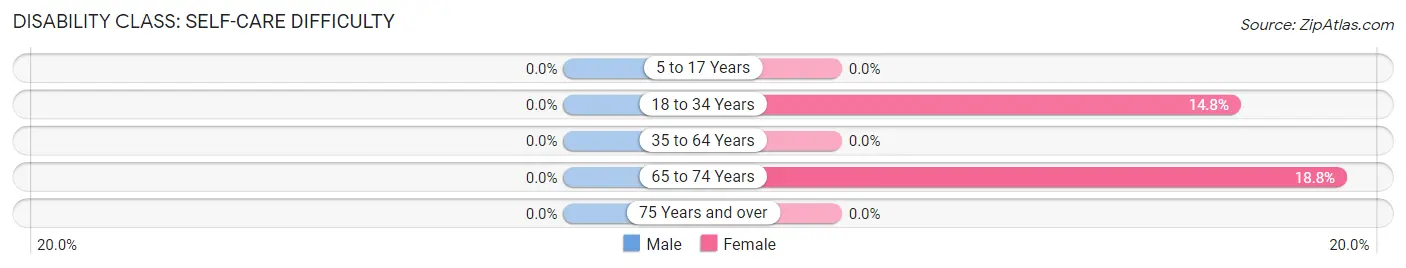
| Age Bracket | Male | Female |
| 5 to 17 Years | 0 (0.0%) | 0 (0.0%) |
| 18 to 34 Years | 0 (0.0%) | 4 (14.8%) |
| 35 to 64 Years | 0 (0.0%) | 0 (0.0%) |
| 65 to 74 Years | 0 (0.0%) | 3 (18.8%) |
| 75 Years and over | 0 (0.0%) | 0 (0.0%) |
Technology Access in Plainville
Computing Device Access in Plainville
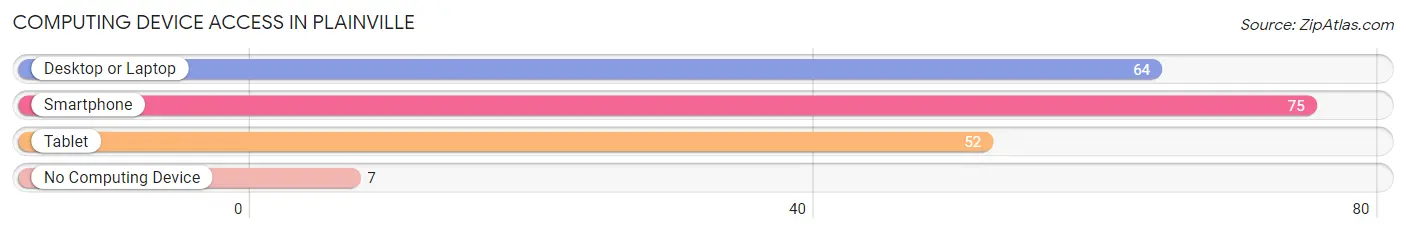
| Device Type | # Households | % Households |
| Desktop or Laptop | 64 | 67.4% |
| Smartphone | 75 | 78.9% |
| Tablet | 52 | 54.7% |
| No Computing Device | 7 | 7.4% |
| Total | 95 | 100.0% |
Internet Access in Plainville
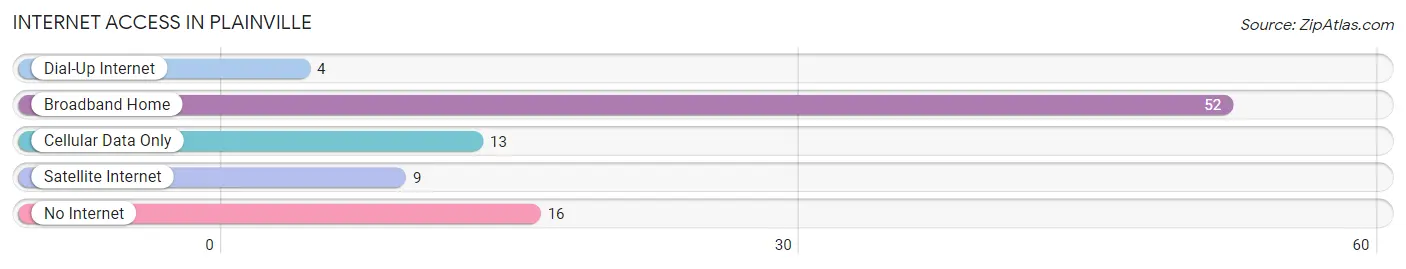
| Internet Type | # Households | % Households |
| Dial-Up Internet | 4 | 4.2% |
| Broadband Home | 52 | 54.7% |
| Cellular Data Only | 13 | 13.7% |
| Satellite Internet | 9 | 9.5% |
| No Internet | 16 | 16.8% |
| Total | 95 | 100.0% |
Plainville Summary
Plainville is a small village located in the state of Illinois, in the United States. It is situated in the northern part of the state, in the county of Will. The village has a population of around 1,000 people, and is located about 40 miles southwest of Chicago.
History
The area that is now Plainville was first settled in the early 1800s by a group of German immigrants. The village was originally known as “Plainfield”, and was officially incorporated in 1867. The village was named after the nearby Plainfield Township, which was named after the nearby Plainfield Creek.
The village grew slowly over the years, and by the early 1900s, it had become a small farming community. The village was home to several small businesses, including a general store, a blacksmith, and a post office.
In the 1950s, the village began to experience a period of growth, as more people moved to the area. This growth was largely due to the construction of the nearby Interstate 55, which made the village more accessible to the rest of the state.
Geography
Plainville is located in the northern part of the state of Illinois, in the county of Will. The village is situated about 40 miles southwest of Chicago, and is bordered by the towns of Plainfield, Bolingbrook, and Romeoville.
The village is located in a flat, open area, with no major hills or mountains. The nearby Plainfield Creek runs through the village, and is a popular spot for fishing and other recreational activities.
The climate in Plainville is typical of the Midwest, with hot summers and cold winters. The average temperature in the summer is around 80 degrees Fahrenheit, while the average temperature in the winter is around 20 degrees Fahrenheit.
Economy
The economy of Plainville is largely based on agriculture and small businesses. The village is home to several small businesses, including a general store, a blacksmith, and a post office.
The village also has a few larger employers, such as a manufacturing plant and a trucking company. The village is also home to a few small farms, which produce a variety of crops, including corn, soybeans, and wheat.
Demographics
As of the 2010 census, the population of Plainville was 1,000 people. The racial makeup of the village was 97.2% White, 0.7% African American, 0.3% Native American, 0.3% Asian, and 1.5% from other races.
The median household income in Plainville was $50,000, and the median family income was $55,000. The per capita income in the village was $20,000.
Conclusion
Plainville is a small village located in the northern part of the state of Illinois. The village has a population of around 1,000 people, and is located about 40 miles southwest of Chicago. The economy of Plainville is largely based on agriculture and small businesses, and the village is home to several small farms. The racial makeup of the village is mostly White, with a small percentage of African American, Native American, and Asian residents. The median household income in Plainville is $50,000, and the per capita income is $20,000.
Common Questions
What is Per Capita Income in Plainville?
Per Capita income in Plainville is $25,681.
What is the Median Family Income in Plainville?
Median Family Income in Plainville is $66,563.
What is the Median Household income in Plainville?
Median Household Income in Plainville is $65,750.
What is Income or Wage Gap in Plainville?
Income or Wage Gap in Plainville is 49.5%.
Women in Plainville earn 50.5 cents for every dollar earned by a man.
What is Inequality or Gini Index in Plainville?
Inequality or Gini Index in Plainville is 0.29.
What is the Total Population of Plainville?
Total Population of Plainville is 269.
What is the Total Male Population of Plainville?
Total Male Population of Plainville is 148.
What is the Total Female Population of Plainville?
Total Female Population of Plainville is 121.
What is the Ratio of Males per 100 Females in Plainville?
There are 122.31 Males per 100 Females in Plainville.
What is the Ratio of Females per 100 Males in Plainville?
There are 81.76 Females per 100 Males in Plainville.
What is the Median Population Age in Plainville?
Median Population Age in Plainville is 33.2 Years.
What is the Average Family Size in Plainville
Average Family Size in Plainville is 3.4 People.
What is the Average Household Size in Plainville
Average Household Size in Plainville is 2.8 People.
How Large is the Labor Force in Plainville?
There are 108 People in the Labor Forcein in Plainville.
What is the Percentage of People in the Labor Force in Plainville?
57.8% of People are in the Labor Force in Plainville.
What is the Unemployment Rate in Plainville?
Unemployment Rate in Plainville is 9.3%.