Beecher City, IL Map & Demographics
Beecher City Map
Beecher City Overview
$22,183
PER CAPITA INCOME
$57,813
AVG FAMILY INCOME
$39,297
AVG HOUSEHOLD INCOME
46.8%
WAGE / INCOME GAP [ % ]
53.2¢/ $1
WAGE / INCOME GAP [ $ ]
0.39
INEQUALITY / GINI INDEX
431
TOTAL POPULATION
212
MALE POPULATION
219
FEMALE POPULATION
96.80
MALES / 100 FEMALES
103.30
FEMALES / 100 MALES
36.9
MEDIAN AGE
2.9
AVG FAMILY SIZE
2.3
AVG HOUSEHOLD SIZE
199
LABOR FORCE [ PEOPLE ]
61.8%
PERCENT IN LABOR FORCE
2.5%
UNEMPLOYMENT RATE
Beecher City Zip Codes
Beecher City Area Codes
Income in Beecher City
Income Overview in Beecher City
Per Capita Income in Beecher City is $22,183, while median incomes of families and households are $57,813 and $39,297 respectively.
| Characteristic | Number | Measure |
| Per Capita Income | 431 | $22,183 |
| Median Family Income | 101 | $57,813 |
| Mean Family Income | 101 | $61,242 |
| Median Household Income | 191 | $39,297 |
| Mean Household Income | 191 | $50,431 |
| Income Deficit | 101 | $0 |
| Wage / Income Gap (%) | 431 | 46.78% |
| Wage / Income Gap ($) | 431 | 53.22¢ per $1 |
| Gini / Inequality Index | 431 | 0.39 |
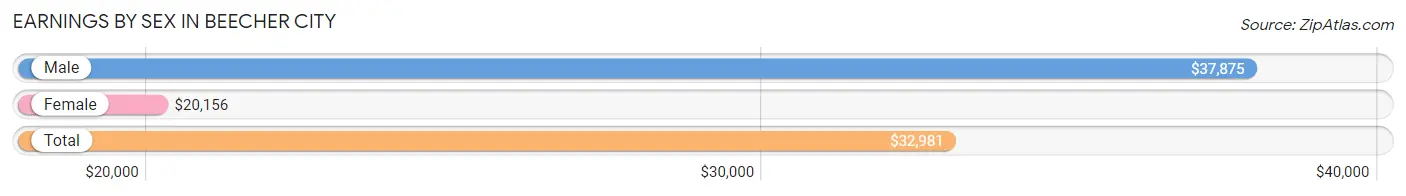
Earnings by Sex in Beecher City
Average Earnings in Beecher City are $32,981, $37,875 for men and $20,156 for women, a difference of 46.8%.
| Sex | Number | Average Earnings |
| Male | 113 (52.3%) | $37,875 |
| Female | 103 (47.7%) | $20,156 |
| Total | 216 (100.0%) | $32,981 |
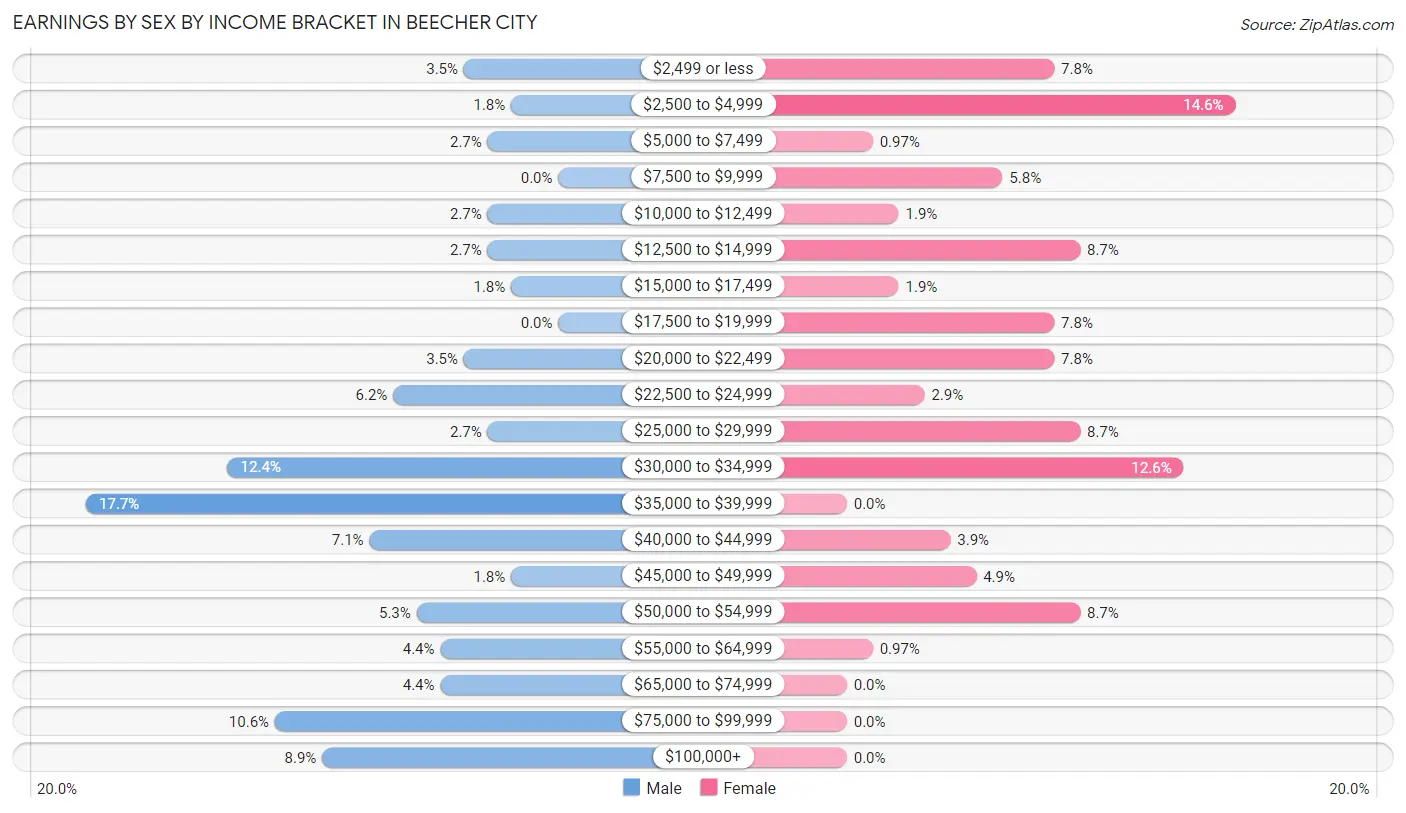
Earnings by Sex by Income Bracket in Beecher City
The most common earnings brackets in Beecher City are $35,000 to $39,999 for men (20 | 17.7%) and $2,500 to $4,999 for women (15 | 14.6%).
| Income | Male | Female |
| $2,499 or less | 4 (3.5%) | 8 (7.8%) |
| $2,500 to $4,999 | 2 (1.8%) | 15 (14.6%) |
| $5,000 to $7,499 | 3 (2.6%) | 1 (1.0%) |
| $7,500 to $9,999 | 0 (0.0%) | 6 (5.8%) |
| $10,000 to $12,499 | 3 (2.6%) | 2 (1.9%) |
| $12,500 to $14,999 | 3 (2.6%) | 9 (8.7%) |
| $15,000 to $17,499 | 2 (1.8%) | 2 (1.9%) |
| $17,500 to $19,999 | 0 (0.0%) | 8 (7.8%) |
| $20,000 to $22,499 | 4 (3.5%) | 8 (7.8%) |
| $22,500 to $24,999 | 7 (6.2%) | 3 (2.9%) |
| $25,000 to $29,999 | 3 (2.6%) | 9 (8.7%) |
| $30,000 to $34,999 | 14 (12.4%) | 13 (12.6%) |
| $35,000 to $39,999 | 20 (17.7%) | 0 (0.0%) |
| $40,000 to $44,999 | 8 (7.1%) | 4 (3.9%) |
| $45,000 to $49,999 | 2 (1.8%) | 5 (4.9%) |
| $50,000 to $54,999 | 6 (5.3%) | 9 (8.7%) |
| $55,000 to $64,999 | 5 (4.4%) | 1 (1.0%) |
| $65,000 to $74,999 | 5 (4.4%) | 0 (0.0%) |
| $75,000 to $99,999 | 12 (10.6%) | 0 (0.0%) |
| $100,000+ | 10 (8.8%) | 0 (0.0%) |
| Total | 113 (100.0%) | 103 (100.0%) |
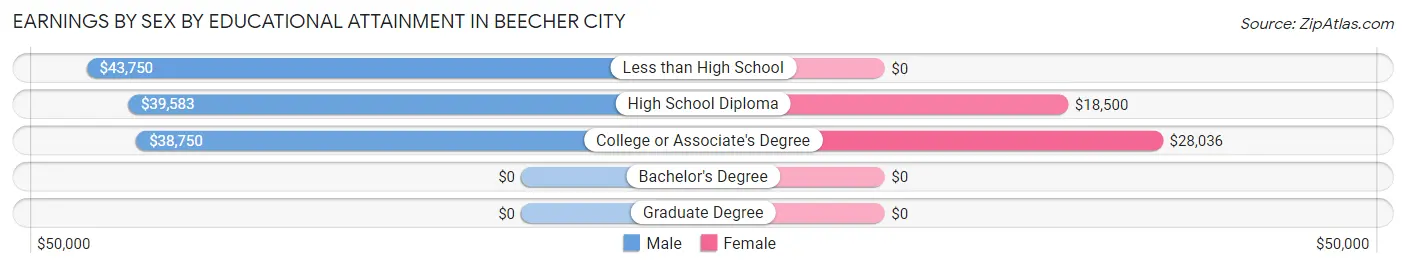
Earnings by Sex by Educational Attainment in Beecher City
Average earnings in Beecher City are $40,313 for men and $24,167 for women, a difference of 40.1%. Men with an educational attainment of less than high school enjoy the highest average annual earnings of $43,750, while those with college or associate's degree education earn the least with $38,750. Women with an educational attainment of college or associate's degree earn the most with the average annual earnings of $28,036, while those with high school diploma education have the smallest earnings of $18,500.
| Educational Attainment | Male Income | Female Income |
| Less than High School | $43,750 | $0 |
| High School Diploma | $39,583 | $18,500 |
| College or Associate's Degree | $38,750 | $28,036 |
| Bachelor's Degree | - | - |
| Graduate Degree | - | - |
| Total | $40,313 | $24,167 |
Family Income in Beecher City
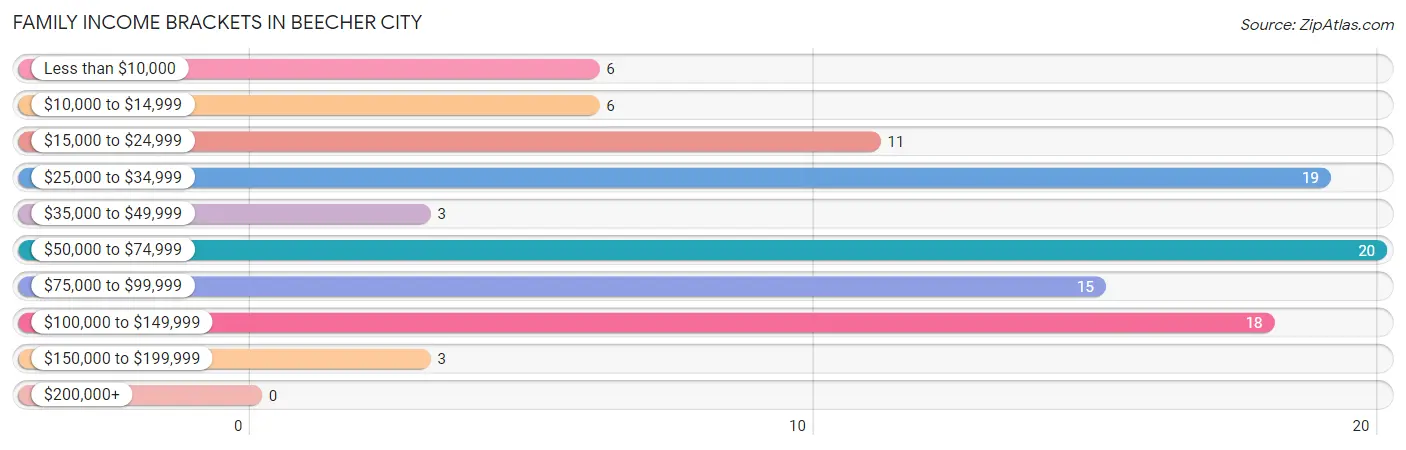
Family Income Brackets in Beecher City
According to the Beecher City family income data, there are 20 families falling into the $50,000 to $74,999 income range, which is the most common income bracket and makes up 19.8% of all families.
| Income Bracket | # Families | % Families |
| Less than $10,000 | 6 | 5.9% |
| $10,000 to $14,999 | 6 | 5.9% |
| $15,000 to $24,999 | 11 | 10.9% |
| $25,000 to $34,999 | 19 | 18.8% |
| $35,000 to $49,999 | 3 | 3.0% |
| $50,000 to $74,999 | 20 | 19.8% |
| $75,000 to $99,999 | 15 | 14.9% |
| $100,000 to $149,999 | 18 | 17.8% |
| $150,000 to $199,999 | 3 | 3.0% |
| $200,000+ | 0 | 0.0% |
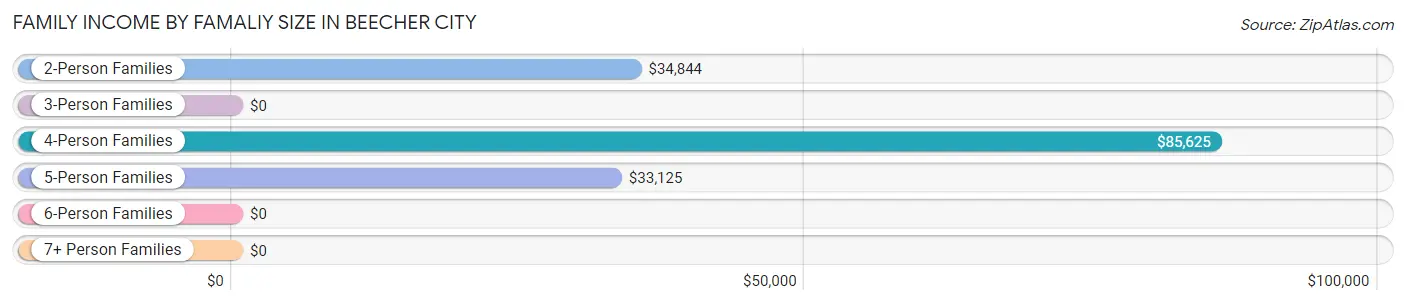
Family Income by Famaliy Size in Beecher City
4-person families (21 | 20.8%) account for the highest median family income in Beecher City with $85,625 per family, while 4-person families (21 | 20.8%) have the highest median income of $21,406 per family member.
| Income Bracket | # Families | Median Income |
| 2-Person Families | 43 (42.6%) | $34,844 |
| 3-Person Families | 28 (27.7%) | $0 |
| 4-Person Families | 21 (20.8%) | $85,625 |
| 5-Person Families | 5 (5.0%) | $33,125 |
| 6-Person Families | 4 (4.0%) | $0 |
| 7+ Person Families | 0 (0.0%) | $0 |
| Total | 101 (100.0%) | $57,813 |
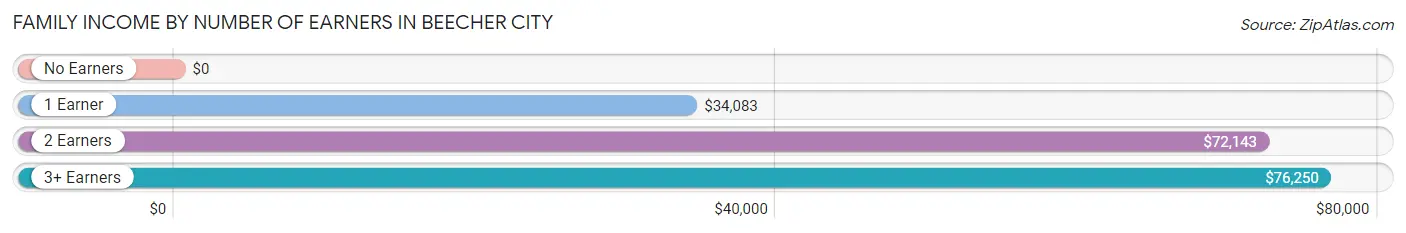
Family Income by Number of Earners in Beecher City
| Number of Earners | # Families | Median Income |
| No Earners | 13 (12.9%) | $0 |
| 1 Earner | 41 (40.6%) | $34,083 |
| 2 Earners | 38 (37.6%) | $72,143 |
| 3+ Earners | 9 (8.9%) | $76,250 |
| Total | 101 (100.0%) | $57,813 |
Household Income in Beecher City
Household Income Brackets in Beecher City
With 38 households falling in the category, the $15,000 to $24,999 income range is the most frequent in Beecher City, accounting for 19.9% of all households.
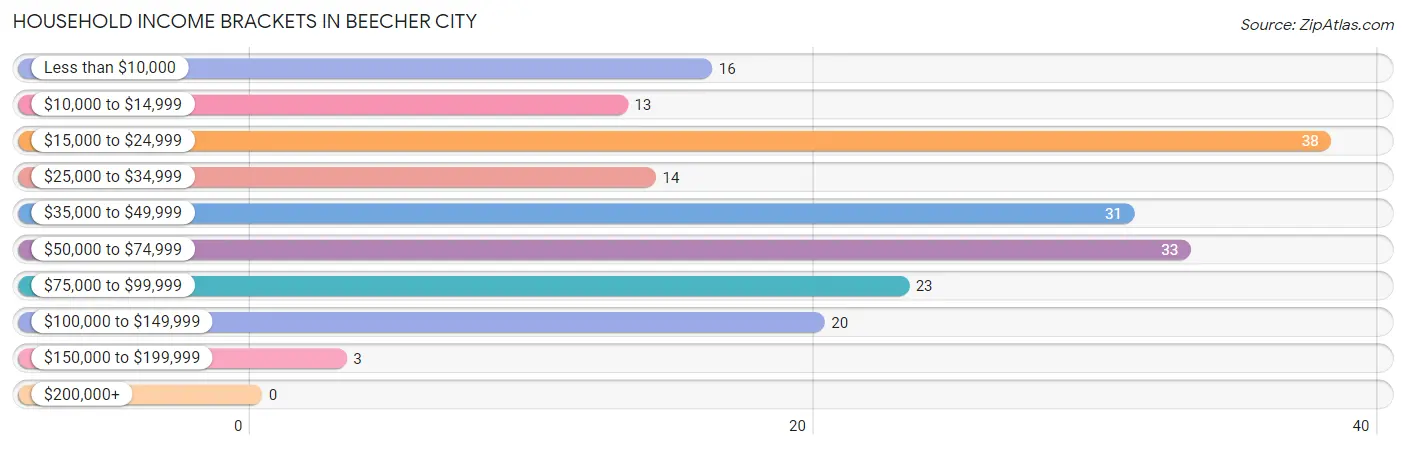
| Income Bracket | # Households | % Households |
| Less than $10,000 | 16 | 8.4% |
| $10,000 to $14,999 | 13 | 6.8% |
| $15,000 to $24,999 | 38 | 19.9% |
| $25,000 to $34,999 | 14 | 7.3% |
| $35,000 to $49,999 | 31 | 16.2% |
| $50,000 to $74,999 | 33 | 17.3% |
| $75,000 to $99,999 | 23 | 12.0% |
| $100,000 to $149,999 | 20 | 10.5% |
| $150,000 to $199,999 | 3 | 1.6% |
| $200,000+ | 0 | 0.0% |
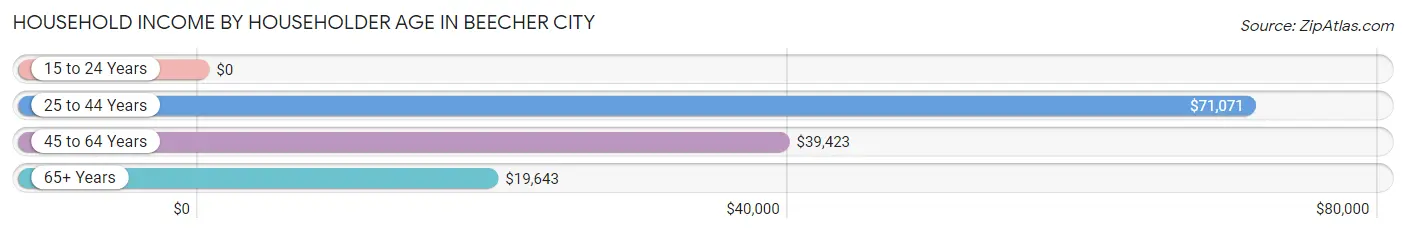
Household Income by Householder Age in Beecher City
The median household income in Beecher City is $39,297, with the highest median household income of $71,071 found in the 25 to 44 years age bracket for the primary householder. A total of 68 households (35.6%) fall into this category. Meanwhile, the 15 to 24 years age bracket for the primary householder has the lowest median household income of $0, with 5 households (2.6%) in this group.
| Income Bracket | # Households | Median Income |
| 15 to 24 Years | 5 (2.6%) | $0 |
| 25 to 44 Years | 68 (35.6%) | $71,071 |
| 45 to 64 Years | 68 (35.6%) | $39,423 |
| 65+ Years | 50 (26.2%) | $19,643 |
| Total | 191 (100.0%) | $39,297 |
Poverty in Beecher City
Income Below Poverty by Sex and Age in Beecher City
With 19.5% poverty level for males and 31.6% for females among the residents of Beecher City, 15 year old males and 5 year old females are the most vulnerable to poverty, with 4 males (80.0%) and 2 females (100.0%) in their respective age groups living below the poverty level.
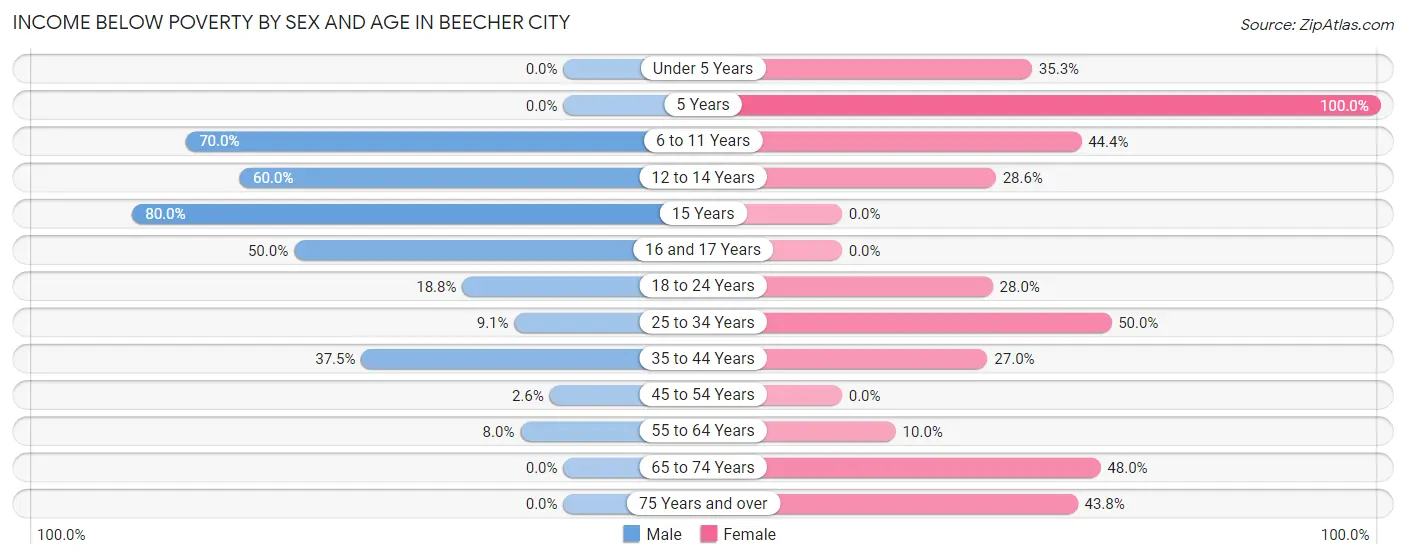
| Age Bracket | Male | Female |
| Under 5 Years | 0 (0.0%) | 6 (35.3%) |
| 5 Years | 0 (0.0%) | 2 (100.0%) |
| 6 to 11 Years | 7 (70.0%) | 4 (44.4%) |
| 12 to 14 Years | 9 (60.0%) | 2 (28.6%) |
| 15 Years | 4 (80.0%) | 0 (0.0%) |
| 16 and 17 Years | 3 (50.0%) | 0 (0.0%) |
| 18 to 24 Years | 3 (18.8%) | 7 (28.0%) |
| 25 to 34 Years | 2 (9.1%) | 14 (50.0%) |
| 35 to 44 Years | 9 (37.5%) | 10 (27.0%) |
| 45 to 54 Years | 1 (2.6%) | 0 (0.0%) |
| 55 to 64 Years | 2 (8.0%) | 2 (10.0%) |
| 65 to 74 Years | 0 (0.0%) | 12 (48.0%) |
| 75 Years and over | 0 (0.0%) | 7 (43.8%) |
| Total | 40 (19.5%) | 66 (31.6%) |
Income Above Poverty by Sex and Age in Beecher City
According to the poverty statistics in Beecher City, males aged under 5 years and females aged 16 and 17 years are the age groups that are most secure financially, with 100.0% of males and 100.0% of females in these age groups living above the poverty line.
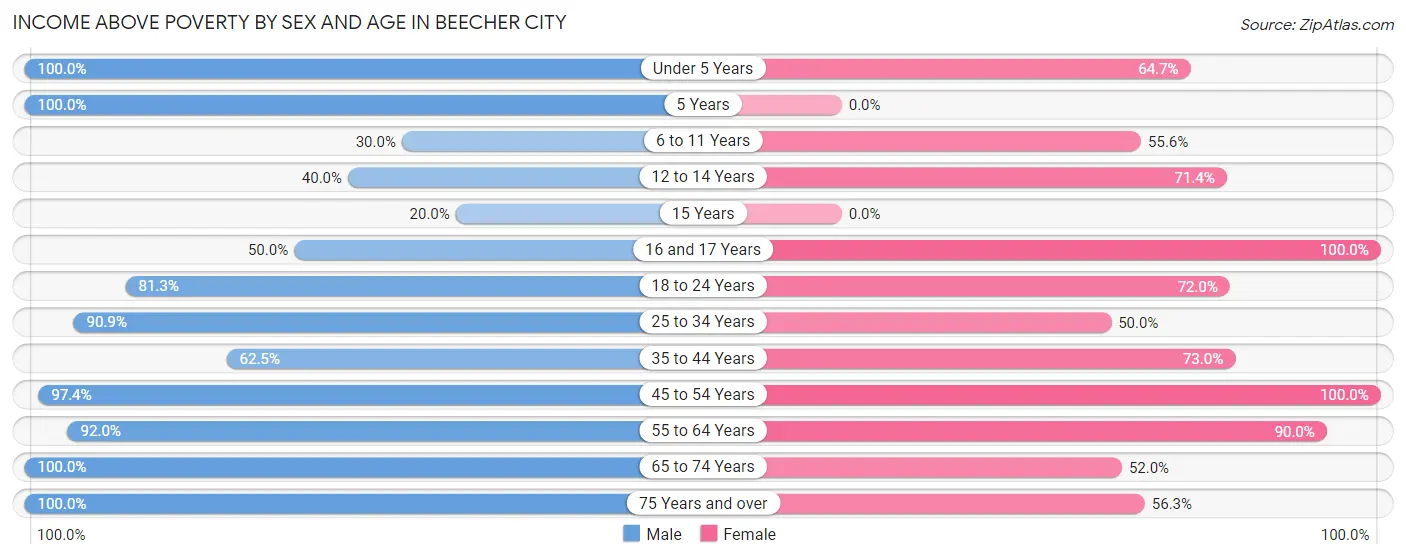
| Age Bracket | Male | Female |
| Under 5 Years | 25 (100.0%) | 11 (64.7%) |
| 5 Years | 2 (100.0%) | 0 (0.0%) |
| 6 to 11 Years | 3 (30.0%) | 5 (55.6%) |
| 12 to 14 Years | 6 (40.0%) | 5 (71.4%) |
| 15 Years | 1 (20.0%) | 0 (0.0%) |
| 16 and 17 Years | 3 (50.0%) | 6 (100.0%) |
| 18 to 24 Years | 13 (81.2%) | 18 (72.0%) |
| 25 to 34 Years | 20 (90.9%) | 14 (50.0%) |
| 35 to 44 Years | 15 (62.5%) | 27 (73.0%) |
| 45 to 54 Years | 38 (97.4%) | 17 (100.0%) |
| 55 to 64 Years | 23 (92.0%) | 18 (90.0%) |
| 65 to 74 Years | 9 (100.0%) | 13 (52.0%) |
| 75 Years and over | 7 (100.0%) | 9 (56.2%) |
| Total | 165 (80.5%) | 143 (68.4%) |
Income Below Poverty Among Married-Couple Families in Beecher City
The poverty statistics for married-couple families in Beecher City show that 7.3% or 4 of the total 55 families live below the poverty line. Families with 3 or 4 children have the highest poverty rate of 40.0%, comprising of 2 families. On the other hand, families with 1 or 2 children have the lowest poverty rate of 0.0%, which includes 0 families.
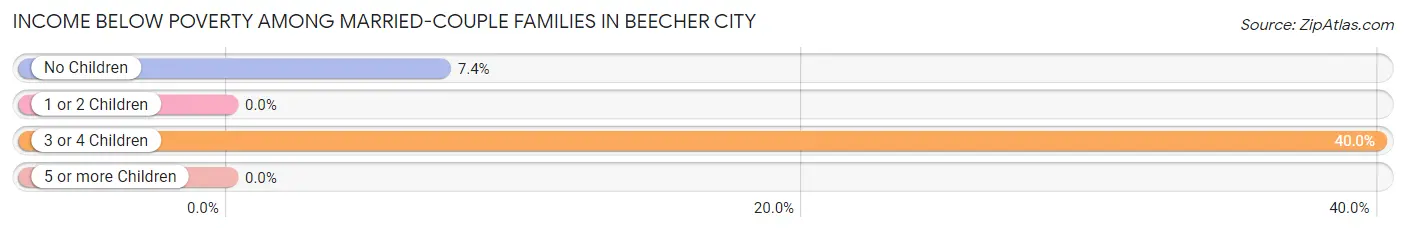
| Children | Above Poverty | Below Poverty |
| No Children | 25 (92.6%) | 2 (7.4%) |
| 1 or 2 Children | 23 (100.0%) | 0 (0.0%) |
| 3 or 4 Children | 3 (60.0%) | 2 (40.0%) |
| 5 or more Children | 0 (0.0%) | 0 (0.0%) |
| Total | 51 (92.7%) | 4 (7.3%) |
Income Below Poverty Among Single-Parent Households in Beecher City
According to the poverty data in Beecher City, 16.7% or 4 single-father households and 63.6% or 14 single-mother households are living below the poverty line. Among single-father households, those with 1 or 2 children have the highest poverty rate, with 3 households (18.8%) experiencing poverty. Likewise, among single-mother households, those with 3 or 4 children have the highest poverty rate, with 5 households (100.0%) falling below the poverty line.
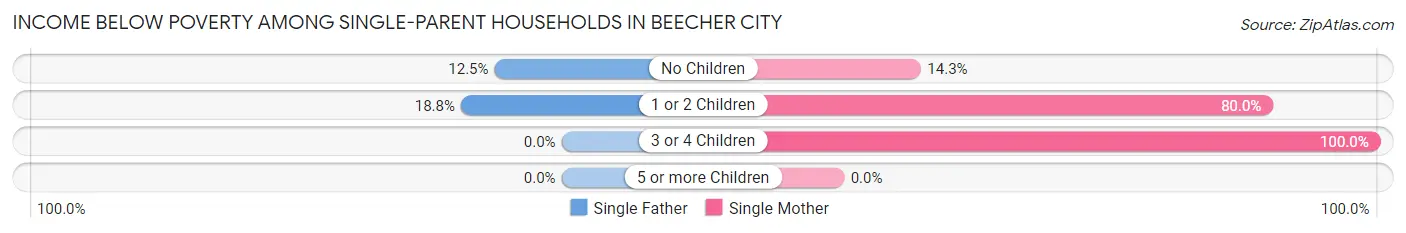
| Children | Single Father | Single Mother |
| No Children | 1 (12.5%) | 1 (14.3%) |
| 1 or 2 Children | 3 (18.8%) | 8 (80.0%) |
| 3 or 4 Children | 0 (0.0%) | 5 (100.0%) |
| 5 or more Children | 0 (0.0%) | 0 (0.0%) |
| Total | 4 (16.7%) | 14 (63.6%) |
Income Below Poverty Among Married-Couple vs Single-Parent Households in Beecher City
The poverty data for Beecher City shows that 4 of the married-couple family households (7.3%) and 18 of the single-parent households (39.1%) are living below the poverty level. Within the married-couple family households, those with 3 or 4 children have the highest poverty rate, with 2 households (40.0%) falling below the poverty line. Among the single-parent households, those with 3 or 4 children have the highest poverty rate, with 5 household (100.0%) living below poverty.
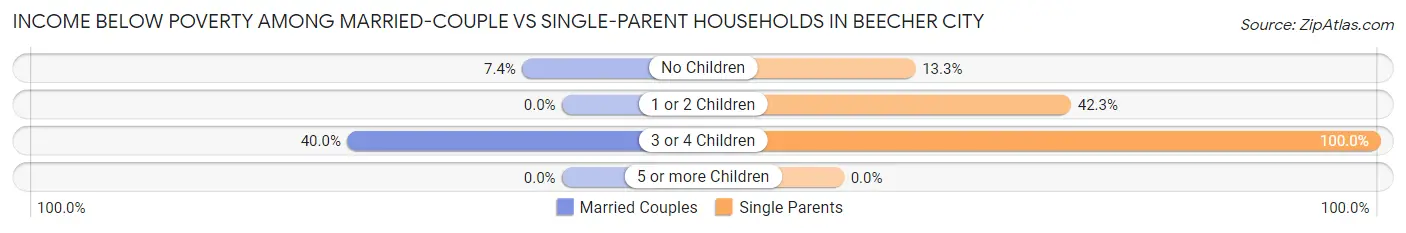
| Children | Married-Couple Families | Single-Parent Households |
| No Children | 2 (7.4%) | 2 (13.3%) |
| 1 or 2 Children | 0 (0.0%) | 11 (42.3%) |
| 3 or 4 Children | 2 (40.0%) | 5 (100.0%) |
| 5 or more Children | 0 (0.0%) | 0 (0.0%) |
| Total | 4 (7.3%) | 18 (39.1%) |
Race in Beecher City
The most populous races in Beecher City are White / Caucasian (427 | 99.1%), Two or more Races (4 | 0.9%), and Hispanic or Latino (2 | 0.5%).
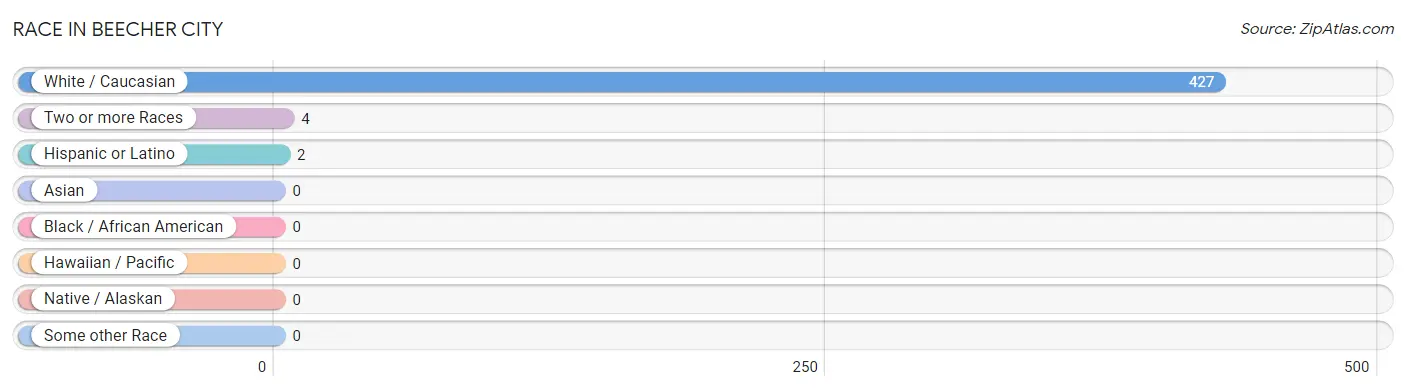
| Race | # Population | % Population |
| Asian | 0 | 0.0% |
| Black / African American | 0 | 0.0% |
| Hawaiian / Pacific | 0 | 0.0% |
| Hispanic or Latino | 2 | 0.5% |
| Native / Alaskan | 0 | 0.0% |
| White / Caucasian | 427 | 99.1% |
| Two or more Races | 4 | 0.9% |
| Some other Race | 0 | 0.0% |
| Total | 431 | 100.0% |
Ancestry in Beecher City
The most populous ancestries reported in Beecher City are German (168 | 39.0%), Irish (55 | 12.8%), American (52 | 12.1%), English (37 | 8.6%), and Scottish (12 | 2.8%), together accounting for 75.2% of all Beecher City residents.
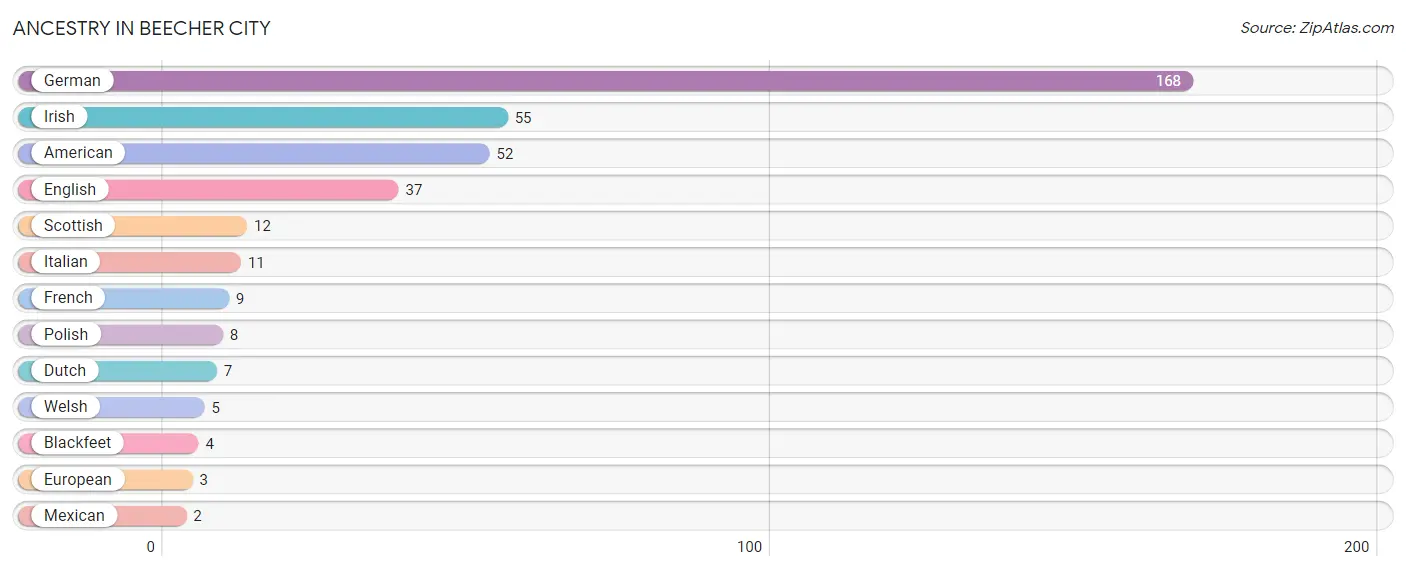
| Ancestry | # Population | % Population |
| American | 52 | 12.1% |
| Blackfeet | 4 | 0.9% |
| Dutch | 7 | 1.6% |
| English | 37 | 8.6% |
| European | 3 | 0.7% |
| French | 9 | 2.1% |
| German | 168 | 39.0% |
| Irish | 55 | 12.8% |
| Italian | 11 | 2.5% |
| Mexican | 2 | 0.5% |
| Polish | 8 | 1.9% |
| Scottish | 12 | 2.8% |
| Welsh | 5 | 1.2% | View All 13 Rows |
Immigrants in Beecher City

| Immigration Origin | # Population | % Population | View All 0 Rows |
Sex and Age in Beecher City
Sex and Age in Beecher City
The most populous age groups in Beecher City are 45 to 49 Years (27 | 12.7%) for men and 40 to 44 Years (27 | 12.3%) for women.
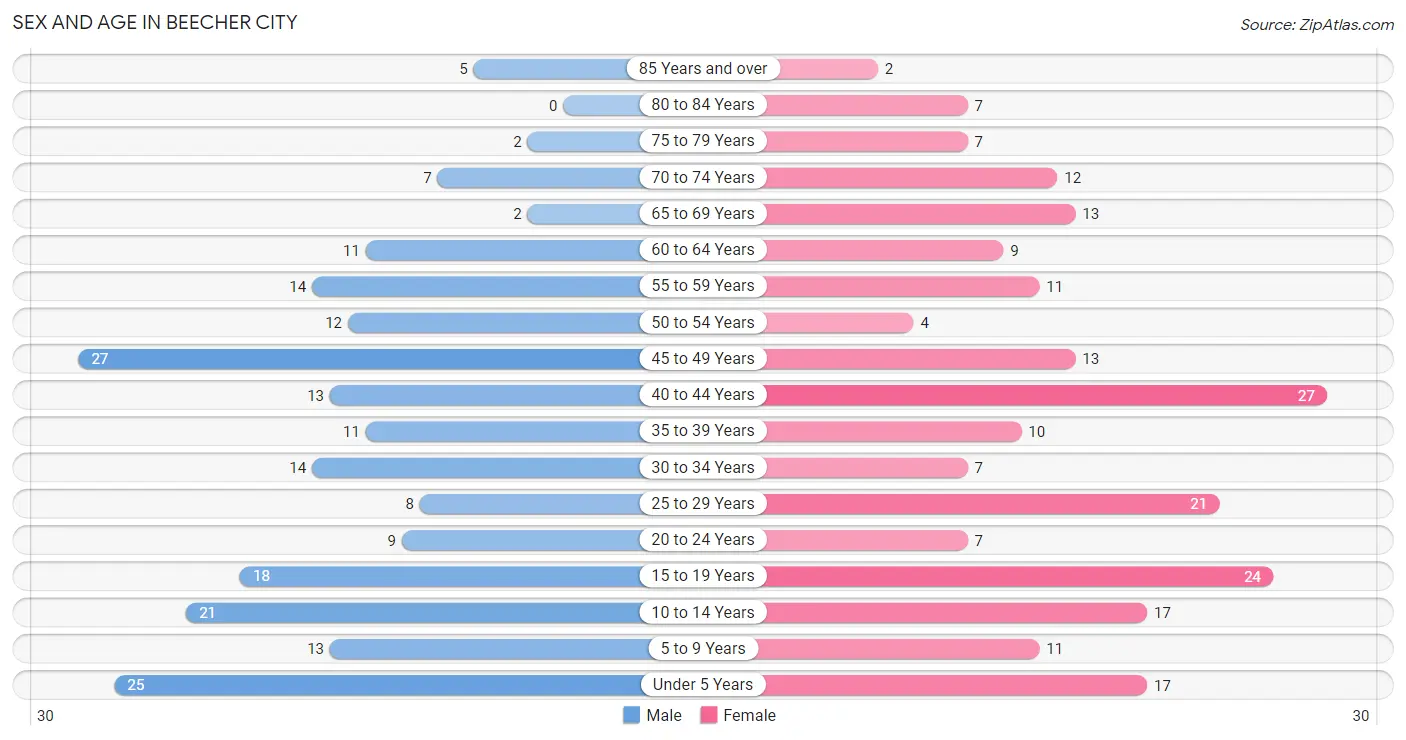
| Age Bracket | Male | Female |
| Under 5 Years | 25 (11.8%) | 17 (7.8%) |
| 5 to 9 Years | 13 (6.1%) | 11 (5.0%) |
| 10 to 14 Years | 21 (9.9%) | 17 (7.8%) |
| 15 to 19 Years | 18 (8.5%) | 24 (11.0%) |
| 20 to 24 Years | 9 (4.3%) | 7 (3.2%) |
| 25 to 29 Years | 8 (3.8%) | 21 (9.6%) |
| 30 to 34 Years | 14 (6.6%) | 7 (3.2%) |
| 35 to 39 Years | 11 (5.2%) | 10 (4.6%) |
| 40 to 44 Years | 13 (6.1%) | 27 (12.3%) |
| 45 to 49 Years | 27 (12.7%) | 13 (5.9%) |
| 50 to 54 Years | 12 (5.7%) | 4 (1.8%) |
| 55 to 59 Years | 14 (6.6%) | 11 (5.0%) |
| 60 to 64 Years | 11 (5.2%) | 9 (4.1%) |
| 65 to 69 Years | 2 (0.9%) | 13 (5.9%) |
| 70 to 74 Years | 7 (3.3%) | 12 (5.5%) |
| 75 to 79 Years | 2 (0.9%) | 7 (3.2%) |
| 80 to 84 Years | 0 (0.0%) | 7 (3.2%) |
| 85 Years and over | 5 (2.4%) | 2 (0.9%) |
| Total | 212 (100.0%) | 219 (100.0%) |
Families and Households in Beecher City
Median Family Size in Beecher City
The median family size in Beecher City is 2.87 persons per family, with married-couple families (55 | 54.5%) accounting for the largest median family size of 3.11 persons per family. On the other hand, single male/father families (24 | 23.8%) represent the smallest median family size with 2.46 persons per family.
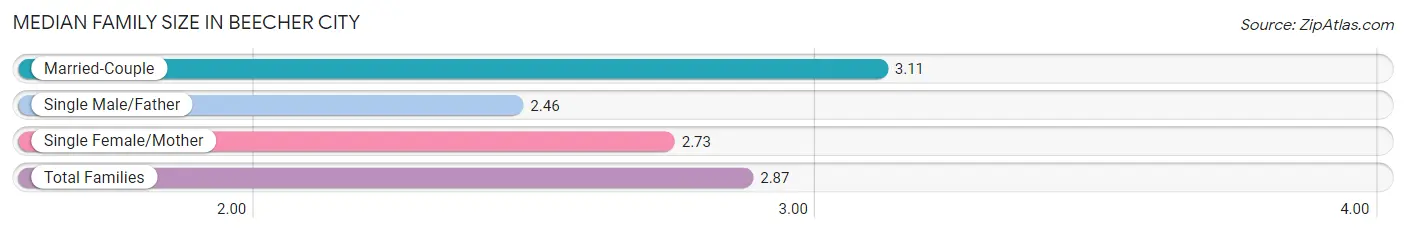
| Family Type | # Families | Family Size |
| Married-Couple | 55 (54.5%) | 3.11 |
| Single Male/Father | 24 (23.8%) | 2.46 |
| Single Female/Mother | 22 (21.8%) | 2.73 |
| Total Families | 101 (100.0%) | 2.87 |
Median Household Size in Beecher City
The median household size in Beecher City is 2.26 persons per household, with single male/father households (24 | 12.6%) accounting for the largest median household size of 3.54 persons per household. non-family households (90 | 47.1%) represent the smallest median household size with 1.09 persons per household.
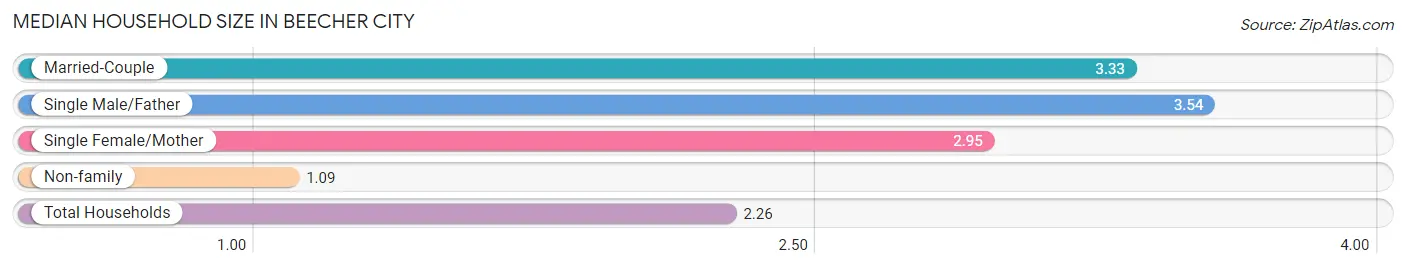
| Household Type | # Households | Household Size |
| Married-Couple | 55 (28.8%) | 3.33 |
| Single Male/Father | 24 (12.6%) | 3.54 |
| Single Female/Mother | 22 (11.5%) | 2.95 |
| Non-family | 90 (47.1%) | 1.09 |
| Total Households | 191 (100.0%) | 2.26 |
Household Size by Marriage Status in Beecher City
Out of a total of 191 households in Beecher City, 101 (52.9%) are family households, while 90 (47.1%) are nonfamily households. The most numerous type of family households are 2-person households, comprising 30, and the most common type of nonfamily households are 1-person households, comprising 83.
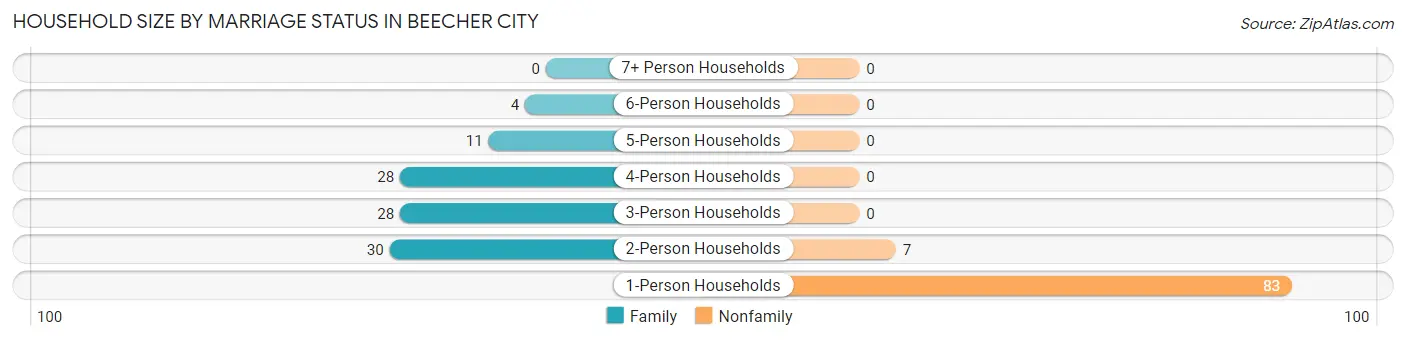
| Household Size | Family Households | Nonfamily Households |
| 1-Person Households | - | 83 (43.5%) |
| 2-Person Households | 30 (15.7%) | 7 (3.7%) |
| 3-Person Households | 28 (14.7%) | 0 (0.0%) |
| 4-Person Households | 28 (14.7%) | 0 (0.0%) |
| 5-Person Households | 11 (5.8%) | 0 (0.0%) |
| 6-Person Households | 4 (2.1%) | 0 (0.0%) |
| 7+ Person Households | 0 (0.0%) | 0 (0.0%) |
| Total | 101 (52.9%) | 90 (47.1%) |
Female Fertility in Beecher City
Fertility by Age in Beecher City
Average fertility rate in Beecher City is 55.0 births per 1,000 women. Women in the age bracket of 20 to 34 years have the highest fertility rate with 171.0 births per 1,000 women. Women in the age bracket of 20 to 34 years acount for 100.0% of all women with births.
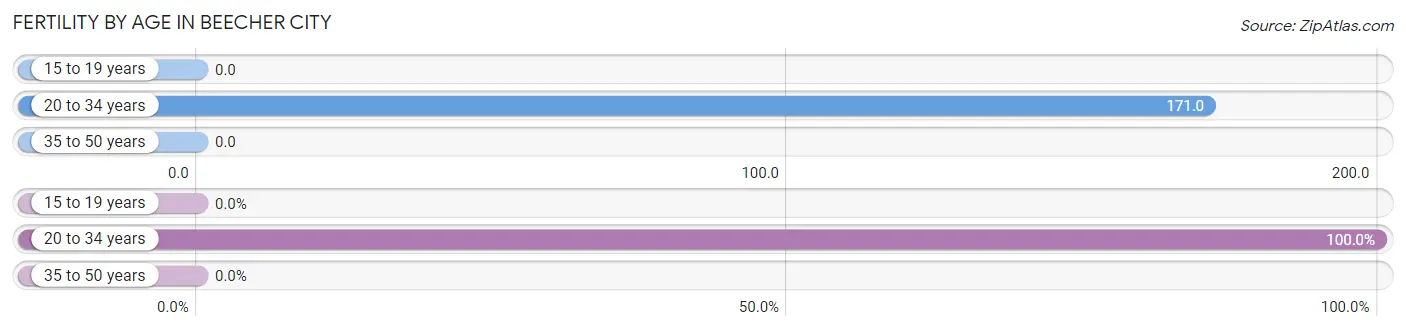
| Age Bracket | Women with Births | Births / 1,000 Women |
| 15 to 19 years | 0 (0.0%) | 0.0 |
| 20 to 34 years | 6 (100.0%) | 171.0 |
| 35 to 50 years | 0 (0.0%) | 0.0 |
| Total | 6 (100.0%) | 55.0 |
Fertility by Age by Marriage Status in Beecher City
50.0% of women with births (6) in Beecher City are married. The highest percentage of unmarried women with births falls into 20 to 34 years age bracket with 50.0% of them unmarried at the time of birth, while the lowest percentage of unmarried women with births belong to 20 to 34 years age bracket with 50.0% of them unmarried.
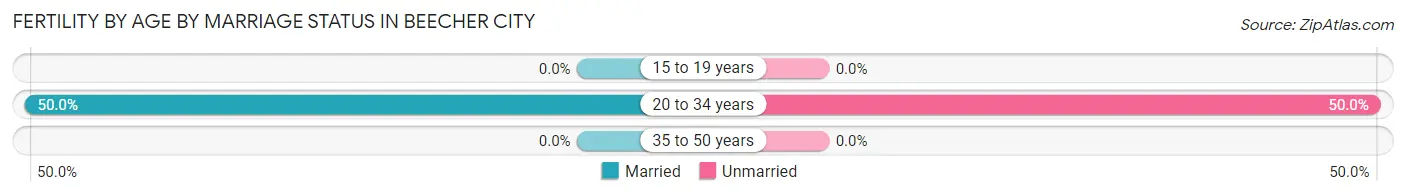
| Age Bracket | Married | Unmarried |
| 15 to 19 years | 0 (0.0%) | 0 (0.0%) |
| 20 to 34 years | 3 (50.0%) | 3 (50.0%) |
| 35 to 50 years | 0 (0.0%) | 0 (0.0%) |
| Total | 3 (50.0%) | 3 (50.0%) |
Fertility by Education in Beecher City
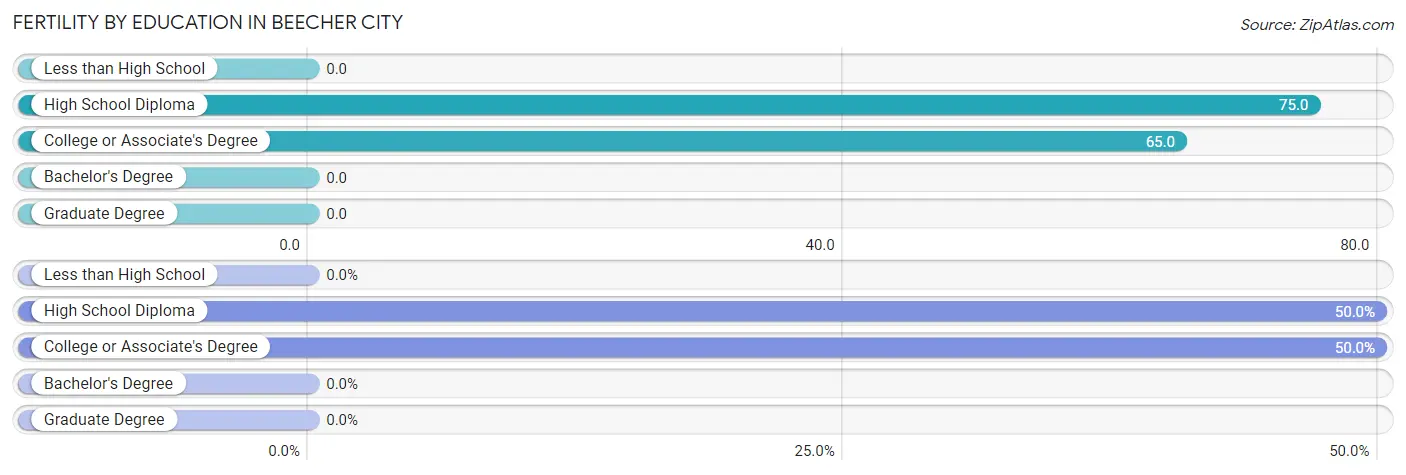
| Educational Attainment | Women with Births | Births / 1,000 Women |
| Less than High School | 0 (0.0%) | 0.0 |
| High School Diploma | 3 (50.0%) | 75.0 |
| College or Associate's Degree | 3 (50.0%) | 65.0 |
| Bachelor's Degree | 0 (0.0%) | 0.0 |
| Graduate Degree | 0 (0.0%) | 0.0 |
| Total | 6 (100.0%) | 55.0 |
Fertility by Education by Marriage Status in Beecher City
50.0% of women with births in Beecher City are unmarried. Women with the educational attainment of college or associate's degree are most likely to be married with 100.0% of them married at childbirth, while women with the educational attainment of high school diploma are least likely to be married with 100.0% of them unmarried at childbirth.
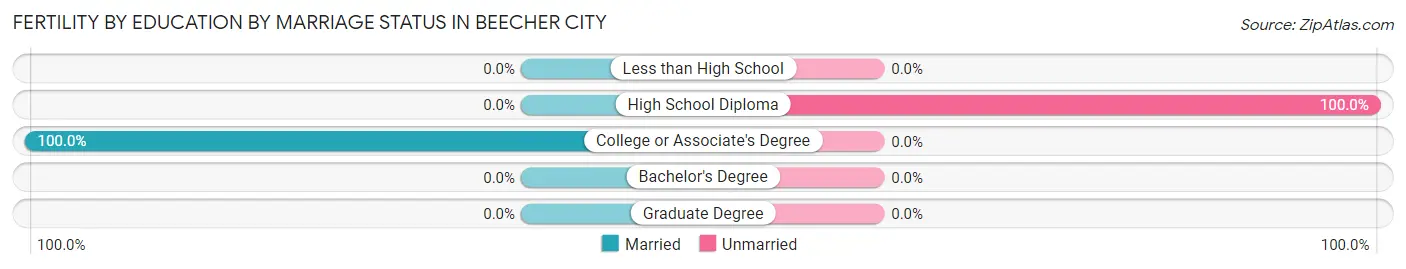
| Educational Attainment | Married | Unmarried |
| Less than High School | 0 (0.0%) | 0 (0.0%) |
| High School Diploma | 0 (0.0%) | 3 (100.0%) |
| College or Associate's Degree | 3 (100.0%) | 0 (0.0%) |
| Bachelor's Degree | 0 (0.0%) | 0 (0.0%) |
| Graduate Degree | 0 (0.0%) | 0 (0.0%) |
| Total | 3 (50.0%) | 3 (50.0%) |
Employment Characteristics in Beecher City
Employment by Class of Employer in Beecher City
Among the 191 employed individuals in Beecher City, private company employees (167 | 87.4%), self-employed (not incorporated) (7 | 3.7%), and not-for-profit organizations (7 | 3.7%) make up the most common classes of employment.
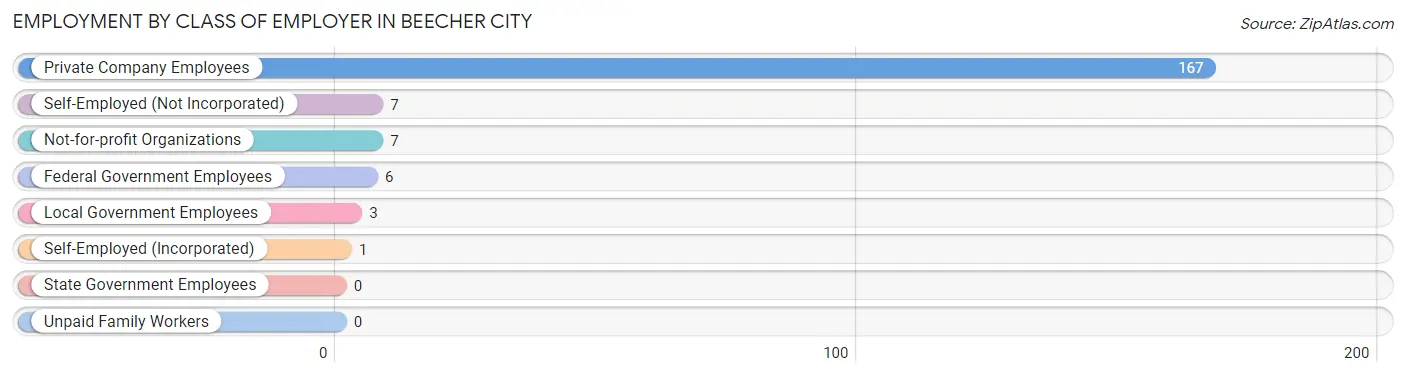
| Employer Class | # Employees | % Employees |
| Private Company Employees | 167 | 87.4% |
| Self-Employed (Incorporated) | 1 | 0.5% |
| Self-Employed (Not Incorporated) | 7 | 3.7% |
| Not-for-profit Organizations | 7 | 3.7% |
| Local Government Employees | 3 | 1.6% |
| State Government Employees | 0 | 0.0% |
| Federal Government Employees | 6 | 3.1% |
| Unpaid Family Workers | 0 | 0.0% |
| Total | 191 | 100.0% |
Employment Status by Age in Beecher City
According to the labor force statistics for Beecher City, out of the total population over 16 years of age (322), 61.8% or 199 individuals are in the labor force, with 2.5% or 5 of them unemployed. The age group with the highest labor force participation rate is 25 to 29 years, with 89.7% or 26 individuals in the labor force. Within the labor force, the 35 to 44 years age range has the highest percentage of unemployed individuals, with 10.3% or 4 of them being unemployed.
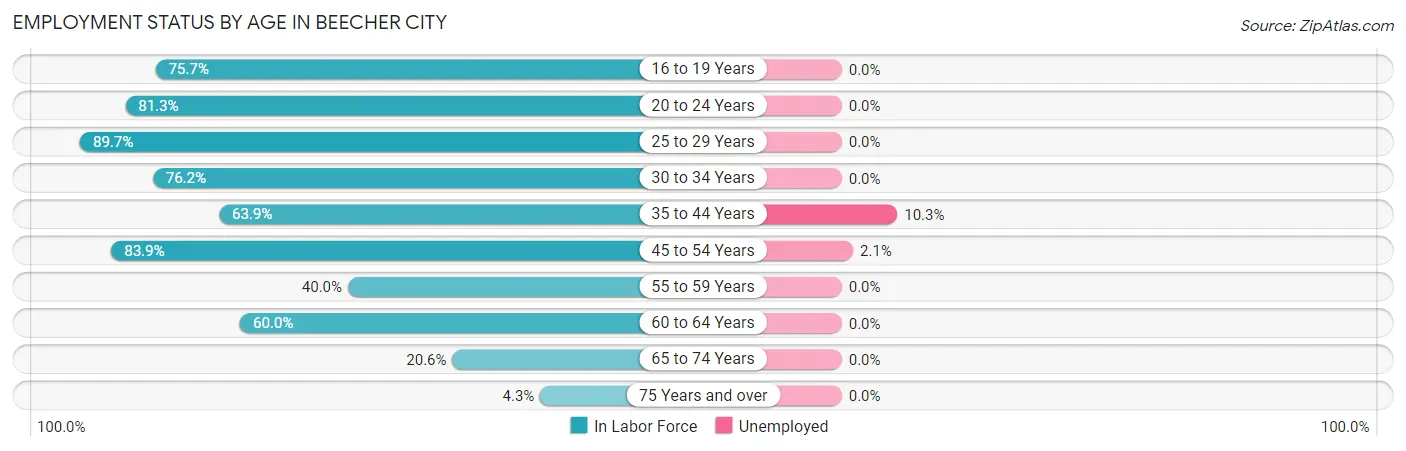
| Age Bracket | In Labor Force | Unemployed |
| 16 to 19 Years | 28 (75.7%) | 0 (0.0%) |
| 20 to 24 Years | 13 (81.3%) | 0 (0.0%) |
| 25 to 29 Years | 26 (89.7%) | 0 (0.0%) |
| 30 to 34 Years | 16 (76.2%) | 0 (0.0%) |
| 35 to 44 Years | 39 (63.9%) | 4 (10.3%) |
| 45 to 54 Years | 47 (83.9%) | 1 (2.1%) |
| 55 to 59 Years | 10 (40.0%) | 0 (0.0%) |
| 60 to 64 Years | 12 (60.0%) | 0 (0.0%) |
| 65 to 74 Years | 7 (20.6%) | 0 (0.0%) |
| 75 Years and over | 1 (4.3%) | 0 (0.0%) |
| Total | 199 (61.8%) | 5 (2.5%) |
Employment Status by Educational Attainment in Beecher City
According to labor force statistics for Beecher City, 70.8% of individuals (150) out of the total population between 25 and 64 years of age (212) are in the labor force, with 3.3% or 5 of them being unemployed. The group with the highest labor force participation rate are those with the educational attainment of high school diploma, with 75.3% or 70 individuals in the labor force. Within the labor force, individuals with college / associate degree education have the highest percentage of unemployment, with 5.0% or 3 of them being unemployed.
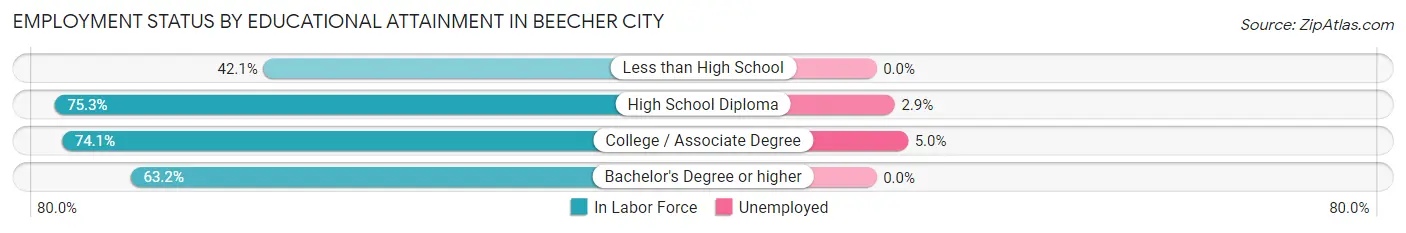
| Educational Attainment | In Labor Force | Unemployed |
| Less than High School | 8 (42.1%) | 0 (0.0%) |
| High School Diploma | 70 (75.3%) | 3 (2.9%) |
| College / Associate Degree | 60 (74.1%) | 4 (5.0%) |
| Bachelor's Degree or higher | 12 (63.2%) | 0 (0.0%) |
| Total | 150 (70.8%) | 7 (3.3%) |
Employment Occupations by Sex in Beecher City
Management, Business, Science and Arts Occupations
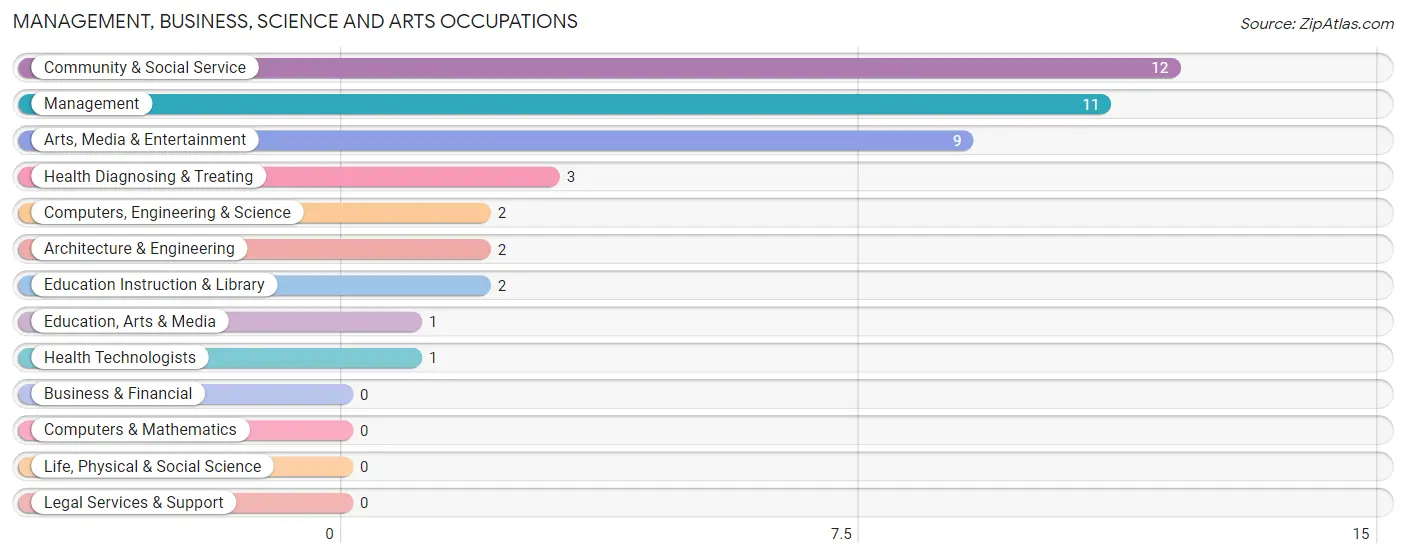
The most common Management, Business, Science and Arts occupations in Beecher City are Community & Social Service (12 | 6.2%), Management (11 | 5.7%), Arts, Media & Entertainment (9 | 4.6%), Health Diagnosing & Treating (3 | 1.5%), and Computers, Engineering & Science (2 | 1.0%).
Management, Business, Science and Arts Occupations by Sex
Within the Management, Business, Science and Arts occupations in Beecher City, the most male-oriented occupations are Computers, Engineering & Science (100.0%), Architecture & Engineering (100.0%), and Education, Arts & Media (100.0%), while the most female-oriented occupations are Education Instruction & Library (100.0%), Arts, Media & Entertainment (100.0%), and Health Technologists (100.0%).
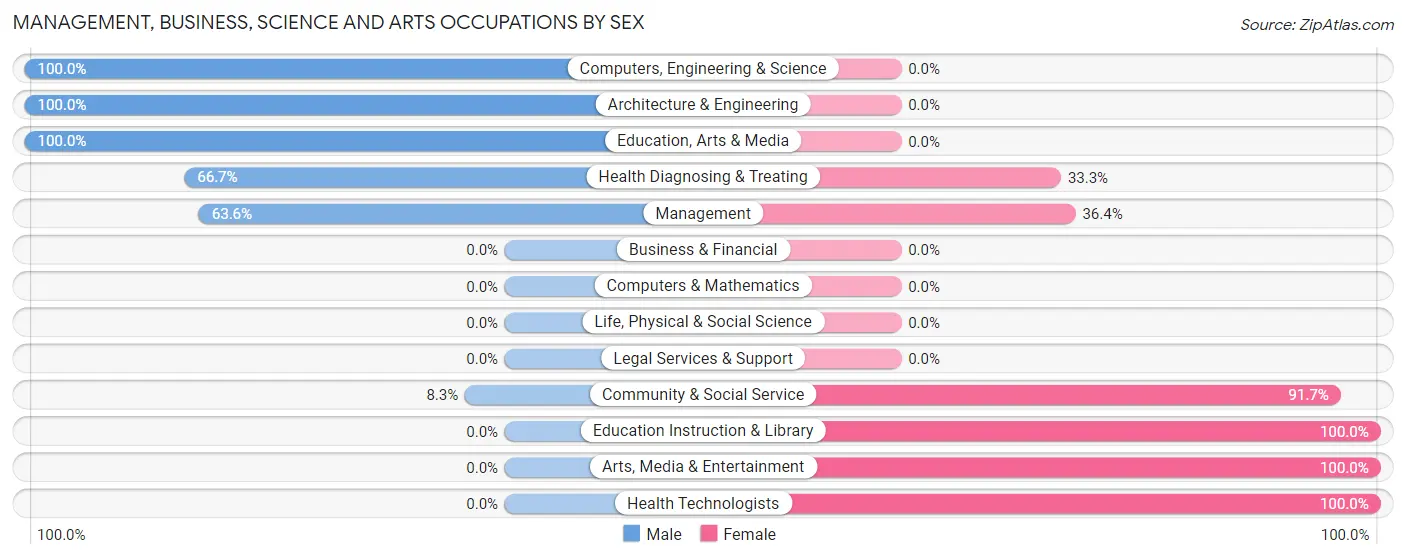
| Occupation | Male | Female |
| Management | 7 (63.6%) | 4 (36.4%) |
| Business & Financial | 0 (0.0%) | 0 (0.0%) |
| Computers, Engineering & Science | 2 (100.0%) | 0 (0.0%) |
| Computers & Mathematics | 0 (0.0%) | 0 (0.0%) |
| Architecture & Engineering | 2 (100.0%) | 0 (0.0%) |
| Life, Physical & Social Science | 0 (0.0%) | 0 (0.0%) |
| Community & Social Service | 1 (8.3%) | 11 (91.7%) |
| Education, Arts & Media | 1 (100.0%) | 0 (0.0%) |
| Legal Services & Support | 0 (0.0%) | 0 (0.0%) |
| Education Instruction & Library | 0 (0.0%) | 2 (100.0%) |
| Arts, Media & Entertainment | 0 (0.0%) | 9 (100.0%) |
| Health Diagnosing & Treating | 2 (66.7%) | 1 (33.3%) |
| Health Technologists | 0 (0.0%) | 1 (100.0%) |
| Total (Category) | 12 (42.9%) | 16 (57.1%) |
| Total (Overall) | 101 (52.1%) | 93 (47.9%) |
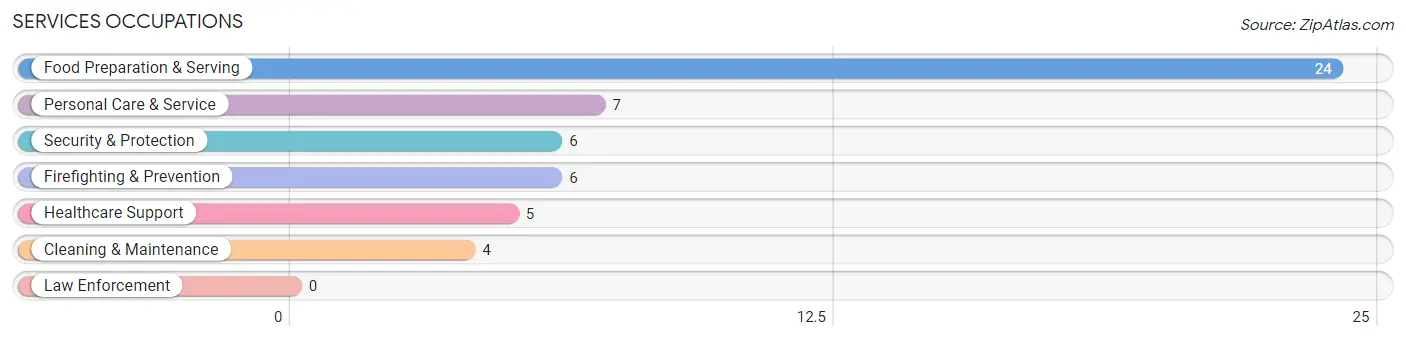
Services Occupations
The most common Services occupations in Beecher City are Food Preparation & Serving (24 | 12.4%), Personal Care & Service (7 | 3.6%), Security & Protection (6 | 3.1%), Firefighting & Prevention (6 | 3.1%), and Healthcare Support (5 | 2.6%).
Services Occupations by Sex
Within the Services occupations in Beecher City, the most male-oriented occupations are Security & Protection (66.7%), Firefighting & Prevention (66.7%), and Food Preparation & Serving (29.2%), while the most female-oriented occupations are Healthcare Support (100.0%), Cleaning & Maintenance (100.0%), and Personal Care & Service (100.0%).
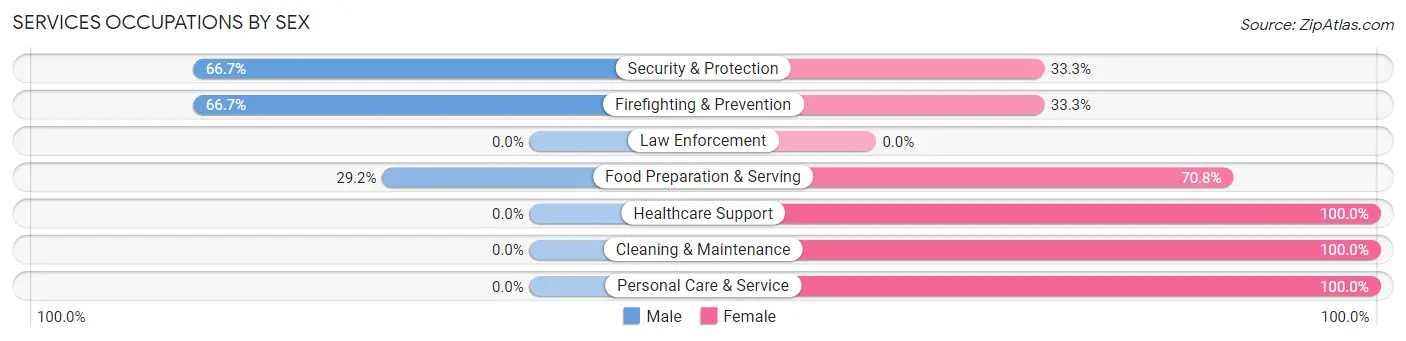
| Occupation | Male | Female |
| Healthcare Support | 0 (0.0%) | 5 (100.0%) |
| Security & Protection | 4 (66.7%) | 2 (33.3%) |
| Firefighting & Prevention | 4 (66.7%) | 2 (33.3%) |
| Law Enforcement | 0 (0.0%) | 0 (0.0%) |
| Food Preparation & Serving | 7 (29.2%) | 17 (70.8%) |
| Cleaning & Maintenance | 0 (0.0%) | 4 (100.0%) |
| Personal Care & Service | 0 (0.0%) | 7 (100.0%) |
| Total (Category) | 11 (23.9%) | 35 (76.1%) |
| Total (Overall) | 101 (52.1%) | 93 (47.9%) |
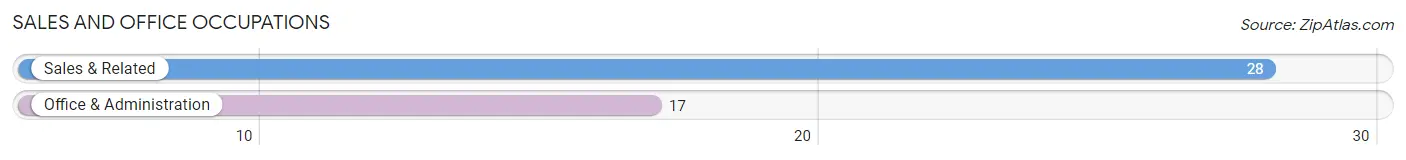
Sales and Office Occupations
The most common Sales and Office occupations in Beecher City are Sales & Related (28 | 14.4%), and Office & Administration (17 | 8.8%).
Sales and Office Occupations by Sex
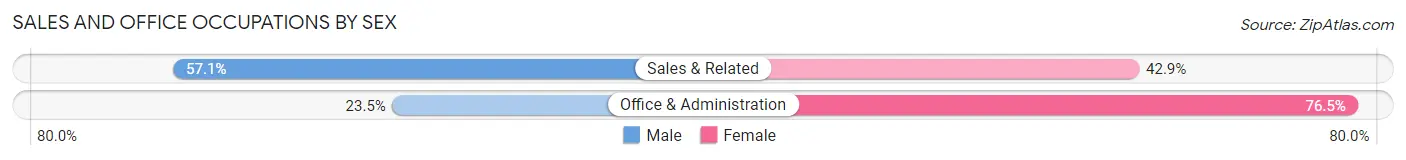
| Occupation | Male | Female |
| Sales & Related | 16 (57.1%) | 12 (42.9%) |
| Office & Administration | 4 (23.5%) | 13 (76.5%) |
| Total (Category) | 20 (44.4%) | 25 (55.6%) |
| Total (Overall) | 101 (52.1%) | 93 (47.9%) |
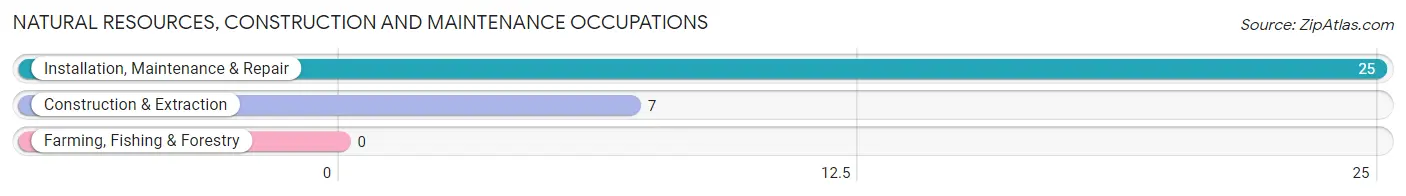
Natural Resources, Construction and Maintenance Occupations
The most common Natural Resources, Construction and Maintenance occupations in Beecher City are Installation, Maintenance & Repair (25 | 12.9%), and Construction & Extraction (7 | 3.6%).
Natural Resources, Construction and Maintenance Occupations by Sex
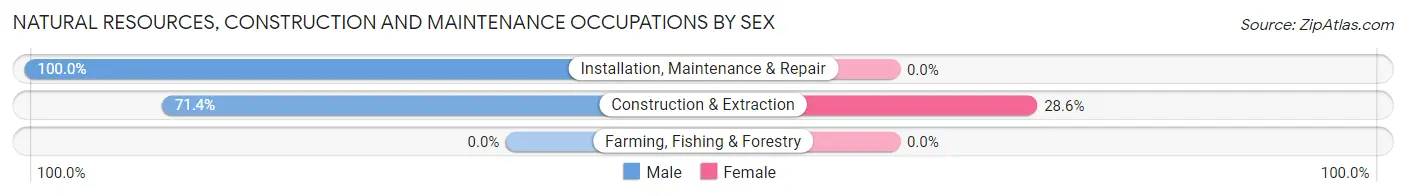
| Occupation | Male | Female |
| Farming, Fishing & Forestry | 0 (0.0%) | 0 (0.0%) |
| Construction & Extraction | 5 (71.4%) | 2 (28.6%) |
| Installation, Maintenance & Repair | 25 (100.0%) | 0 (0.0%) |
| Total (Category) | 30 (93.8%) | 2 (6.2%) |
| Total (Overall) | 101 (52.1%) | 93 (47.9%) |
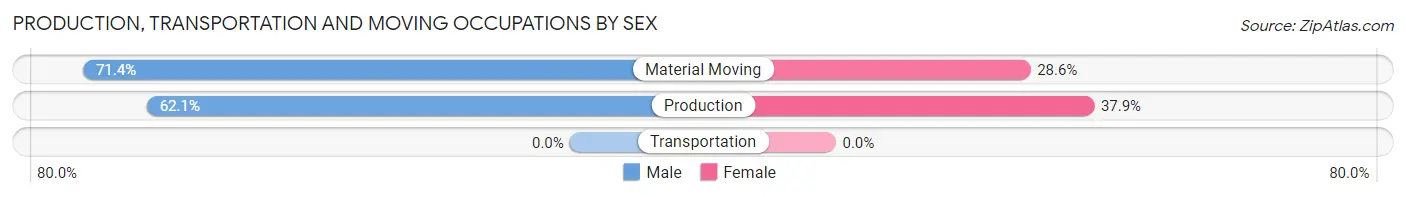
Production, Transportation and Moving Occupations
The most common Production, Transportation and Moving occupations in Beecher City are Production (29 | 14.9%), and Material Moving (14 | 7.2%).
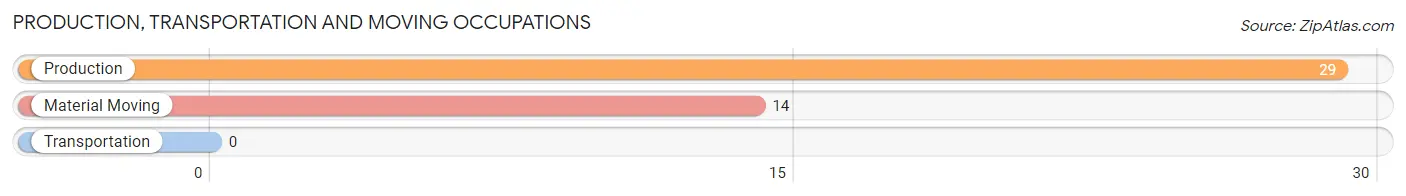
Production, Transportation and Moving Occupations by Sex
| Occupation | Male | Female |
| Production | 18 (62.1%) | 11 (37.9%) |
| Transportation | 0 (0.0%) | 0 (0.0%) |
| Material Moving | 10 (71.4%) | 4 (28.6%) |
| Total (Category) | 28 (65.1%) | 15 (34.9%) |
| Total (Overall) | 101 (52.1%) | 93 (47.9%) |
Employment Industries by Sex in Beecher City
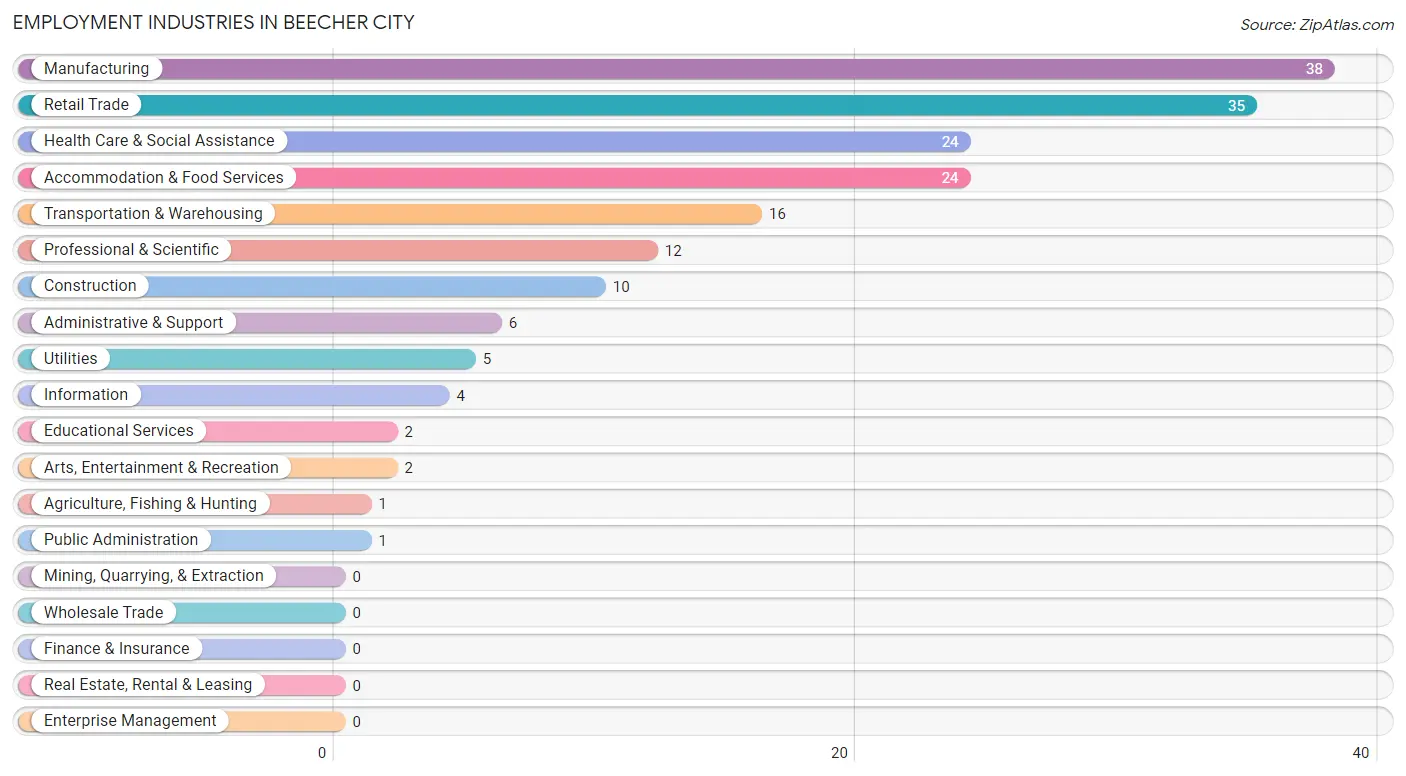
Employment Industries in Beecher City
The major employment industries in Beecher City include Manufacturing (38 | 19.6%), Retail Trade (35 | 18.0%), Health Care & Social Assistance (24 | 12.4%), Accommodation & Food Services (24 | 12.4%), and Transportation & Warehousing (16 | 8.3%).
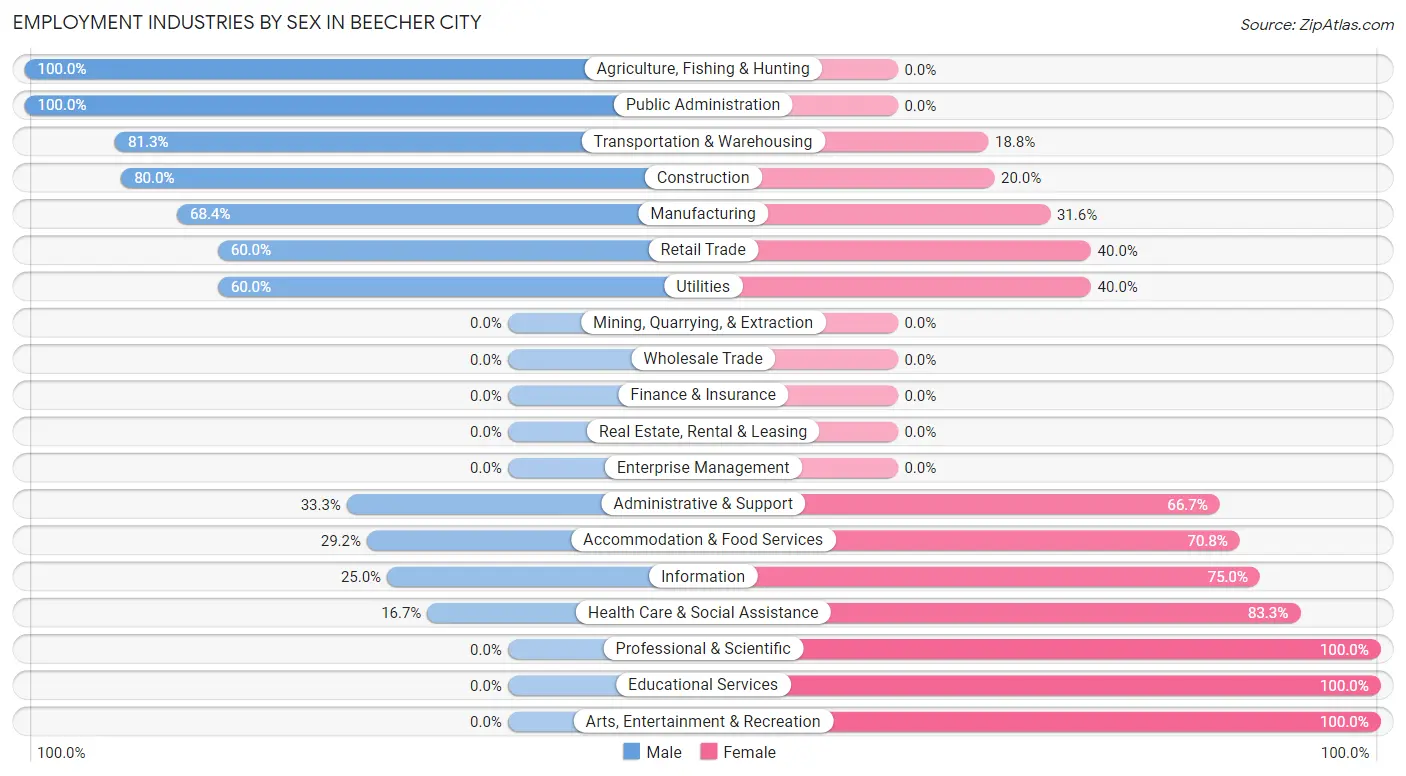
Employment Industries by Sex in Beecher City
The Beecher City industries that see more men than women are Agriculture, Fishing & Hunting (100.0%), Public Administration (100.0%), and Transportation & Warehousing (81.2%), whereas the industries that tend to have a higher number of women are Professional & Scientific (100.0%), Educational Services (100.0%), and Arts, Entertainment & Recreation (100.0%).
| Industry | Male | Female |
| Agriculture, Fishing & Hunting | 1 (100.0%) | 0 (0.0%) |
| Mining, Quarrying, & Extraction | 0 (0.0%) | 0 (0.0%) |
| Construction | 8 (80.0%) | 2 (20.0%) |
| Manufacturing | 26 (68.4%) | 12 (31.6%) |
| Wholesale Trade | 0 (0.0%) | 0 (0.0%) |
| Retail Trade | 21 (60.0%) | 14 (40.0%) |
| Transportation & Warehousing | 13 (81.2%) | 3 (18.8%) |
| Utilities | 3 (60.0%) | 2 (40.0%) |
| Information | 1 (25.0%) | 3 (75.0%) |
| Finance & Insurance | 0 (0.0%) | 0 (0.0%) |
| Real Estate, Rental & Leasing | 0 (0.0%) | 0 (0.0%) |
| Professional & Scientific | 0 (0.0%) | 12 (100.0%) |
| Enterprise Management | 0 (0.0%) | 0 (0.0%) |
| Administrative & Support | 2 (33.3%) | 4 (66.7%) |
| Educational Services | 0 (0.0%) | 2 (100.0%) |
| Health Care & Social Assistance | 4 (16.7%) | 20 (83.3%) |
| Arts, Entertainment & Recreation | 0 (0.0%) | 2 (100.0%) |
| Accommodation & Food Services | 7 (29.2%) | 17 (70.8%) |
| Public Administration | 1 (100.0%) | 0 (0.0%) |
| Total | 101 (52.1%) | 93 (47.9%) |
Education in Beecher City
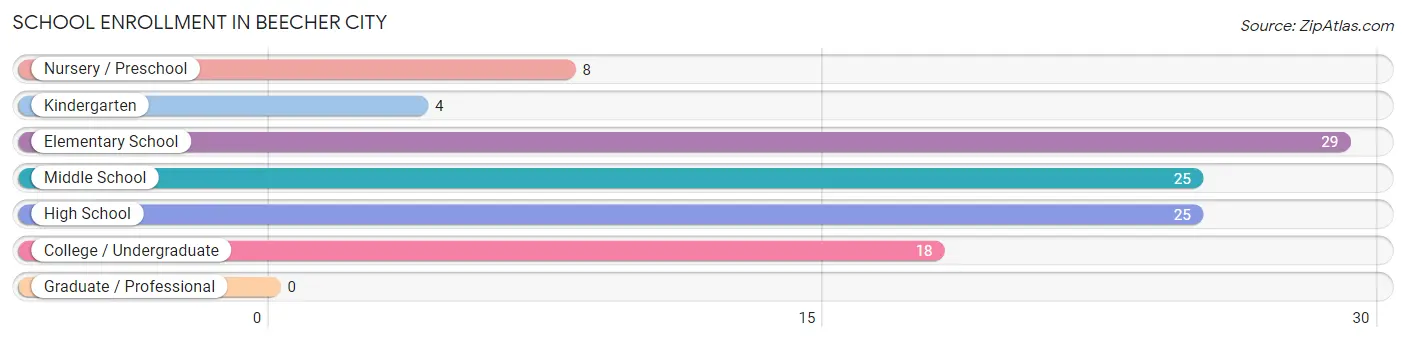
School Enrollment in Beecher City
The most common levels of schooling among the 109 students in Beecher City are elementary school (29 | 26.6%), middle school (25 | 22.9%), and high school (25 | 22.9%).
| School Level | # Students | % Students |
| Nursery / Preschool | 8 | 7.3% |
| Kindergarten | 4 | 3.7% |
| Elementary School | 29 | 26.6% |
| Middle School | 25 | 22.9% |
| High School | 25 | 22.9% |
| College / Undergraduate | 18 | 16.5% |
| Graduate / Professional | 0 | 0.0% |
| Total | 109 | 100.0% |
School Enrollment by Age by Funding Source in Beecher City
Out of a total of 109 students who are enrolled in schools in Beecher City, 1 (0.9%) attend a private institution, while the remaining 108 (99.1%) are enrolled in public schools. The age group of 20 to 24 year olds has the highest likelihood of being enrolled in private schools, with 1 (16.7% in the age bracket) enrolled. Conversely, the age group of 3 to 4 year olds has the lowest likelihood of being enrolled in a private school, with 8 (100.0% in the age bracket) attending a public institution.
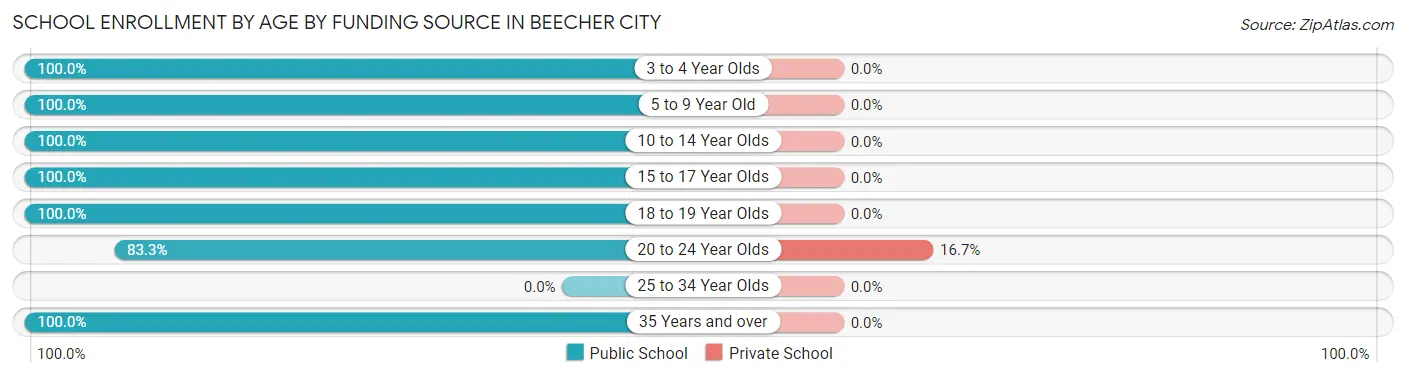
| Age Bracket | Public School | Private School |
| 3 to 4 Year Olds | 8 (100.0%) | 0 (0.0%) |
| 5 to 9 Year Old | 24 (100.0%) | 0 (0.0%) |
| 10 to 14 Year Olds | 38 (100.0%) | 0 (0.0%) |
| 15 to 17 Year Olds | 17 (100.0%) | 0 (0.0%) |
| 18 to 19 Year Olds | 13 (100.0%) | 0 (0.0%) |
| 20 to 24 Year Olds | 5 (83.3%) | 1 (16.7%) |
| 25 to 34 Year Olds | 0 (0.0%) | 0 (0.0%) |
| 35 Years and over | 3 (100.0%) | 0 (0.0%) |
| Total | 108 (99.1%) | 1 (0.9%) |
Educational Attainment by Field of Study in Beecher City
Education (9 | 29.0%), business (7 | 22.6%), arts & humanities (5 | 16.1%), liberal arts & history (3 | 9.7%), and science & technology (2 | 6.5%) are the most common fields of study among 31 individuals in Beecher City who have obtained a bachelor's degree or higher.
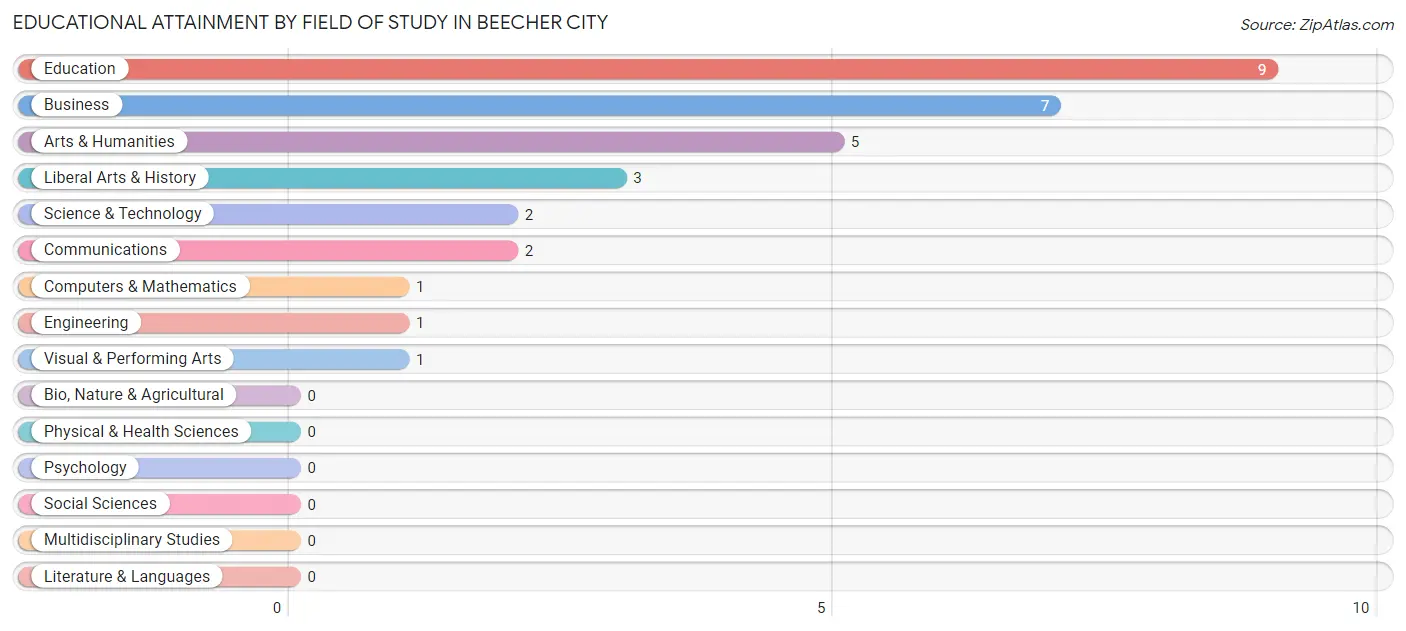
| Field of Study | # Graduates | % Graduates |
| Computers & Mathematics | 1 | 3.2% |
| Bio, Nature & Agricultural | 0 | 0.0% |
| Physical & Health Sciences | 0 | 0.0% |
| Psychology | 0 | 0.0% |
| Social Sciences | 0 | 0.0% |
| Engineering | 1 | 3.2% |
| Multidisciplinary Studies | 0 | 0.0% |
| Science & Technology | 2 | 6.5% |
| Business | 7 | 22.6% |
| Education | 9 | 29.0% |
| Literature & Languages | 0 | 0.0% |
| Liberal Arts & History | 3 | 9.7% |
| Visual & Performing Arts | 1 | 3.2% |
| Communications | 2 | 6.5% |
| Arts & Humanities | 5 | 16.1% |
| Total | 31 | 100.0% |
Transportation & Commute in Beecher City
Vehicle Availability by Sex in Beecher City
The most prevalent vehicle ownership categories in Beecher City are males with 2 vehicles (43, accounting for 42.6%) and females with 2 vehicles (36, making up 47.8%).
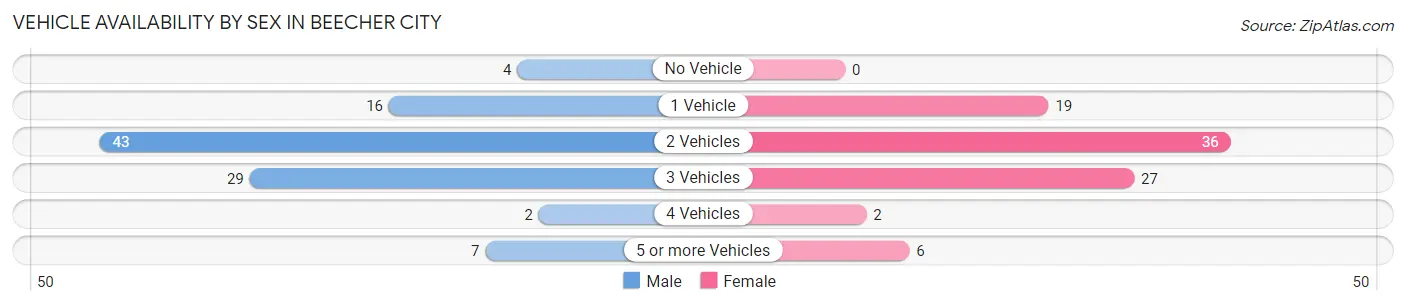
| Vehicles Available | Male | Female |
| No Vehicle | 4 (4.0%) | 0 (0.0%) |
| 1 Vehicle | 16 (15.8%) | 19 (21.1%) |
| 2 Vehicles | 43 (42.6%) | 36 (40.0%) |
| 3 Vehicles | 29 (28.7%) | 27 (30.0%) |
| 4 Vehicles | 2 (2.0%) | 2 (2.2%) |
| 5 or more Vehicles | 7 (6.9%) | 6 (6.7%) |
| Total | 101 (100.0%) | 90 (100.0%) |
Commute Time in Beecher City
The most frequently occuring commute durations in Beecher City are 20 to 24 minutes (61 commuters, 32.6%), 30 to 34 minutes (33 commuters, 17.6%), and 15 to 19 minutes (27 commuters, 14.4%).
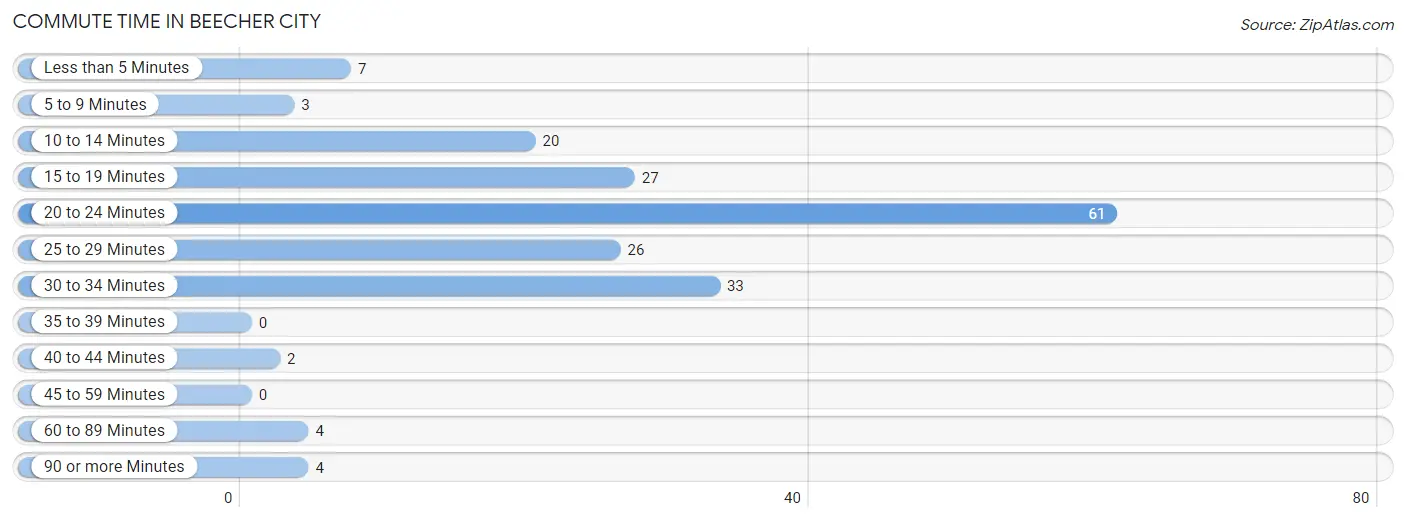
| Commute Time | # Commuters | % Commuters |
| Less than 5 Minutes | 7 | 3.7% |
| 5 to 9 Minutes | 3 | 1.6% |
| 10 to 14 Minutes | 20 | 10.7% |
| 15 to 19 Minutes | 27 | 14.4% |
| 20 to 24 Minutes | 61 | 32.6% |
| 25 to 29 Minutes | 26 | 13.9% |
| 30 to 34 Minutes | 33 | 17.6% |
| 35 to 39 Minutes | 0 | 0.0% |
| 40 to 44 Minutes | 2 | 1.1% |
| 45 to 59 Minutes | 0 | 0.0% |
| 60 to 89 Minutes | 4 | 2.1% |
| 90 or more Minutes | 4 | 2.1% |
Commute Time by Sex in Beecher City
The most common commute times in Beecher City are 20 to 24 minutes (27 commuters, 27.0%) for males and 20 to 24 minutes (34 commuters, 39.1%) for females.
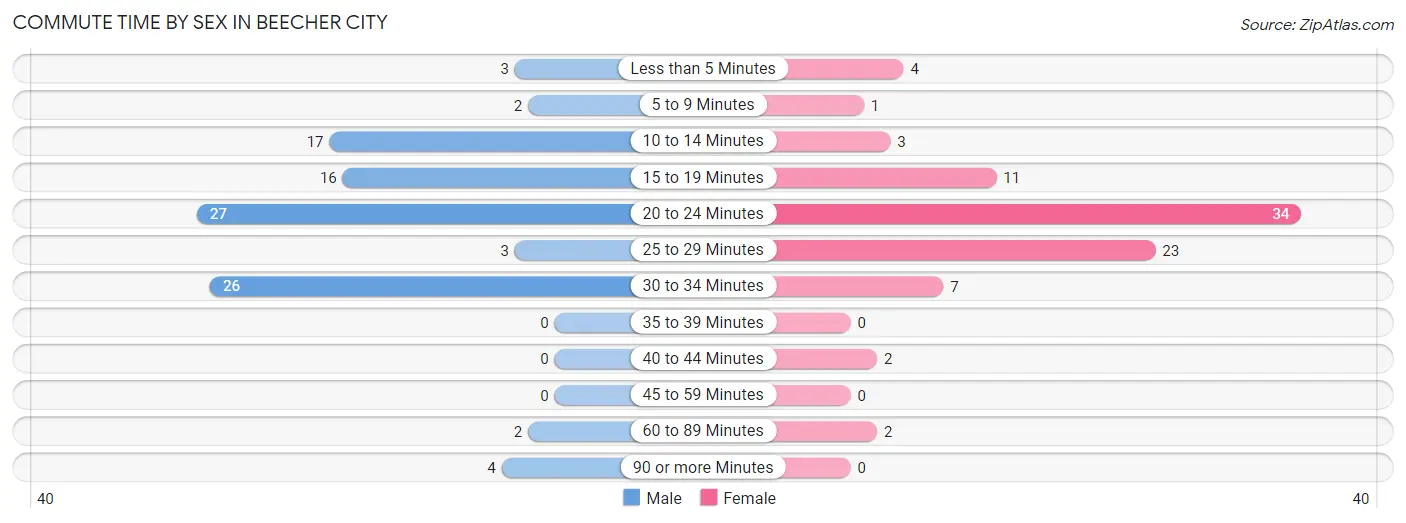
| Commute Time | Male | Female |
| Less than 5 Minutes | 3 (3.0%) | 4 (4.6%) |
| 5 to 9 Minutes | 2 (2.0%) | 1 (1.1%) |
| 10 to 14 Minutes | 17 (17.0%) | 3 (3.5%) |
| 15 to 19 Minutes | 16 (16.0%) | 11 (12.6%) |
| 20 to 24 Minutes | 27 (27.0%) | 34 (39.1%) |
| 25 to 29 Minutes | 3 (3.0%) | 23 (26.4%) |
| 30 to 34 Minutes | 26 (26.0%) | 7 (8.1%) |
| 35 to 39 Minutes | 0 (0.0%) | 0 (0.0%) |
| 40 to 44 Minutes | 0 (0.0%) | 2 (2.3%) |
| 45 to 59 Minutes | 0 (0.0%) | 0 (0.0%) |
| 60 to 89 Minutes | 2 (2.0%) | 2 (2.3%) |
| 90 or more Minutes | 4 (4.0%) | 0 (0.0%) |
Time of Departure to Work by Sex in Beecher City
The most frequent times of departure to work in Beecher City are 6:00 AM to 6:29 AM (21, 21.0%) for males and 8:00 AM to 8:29 AM (14, 16.1%) for females.
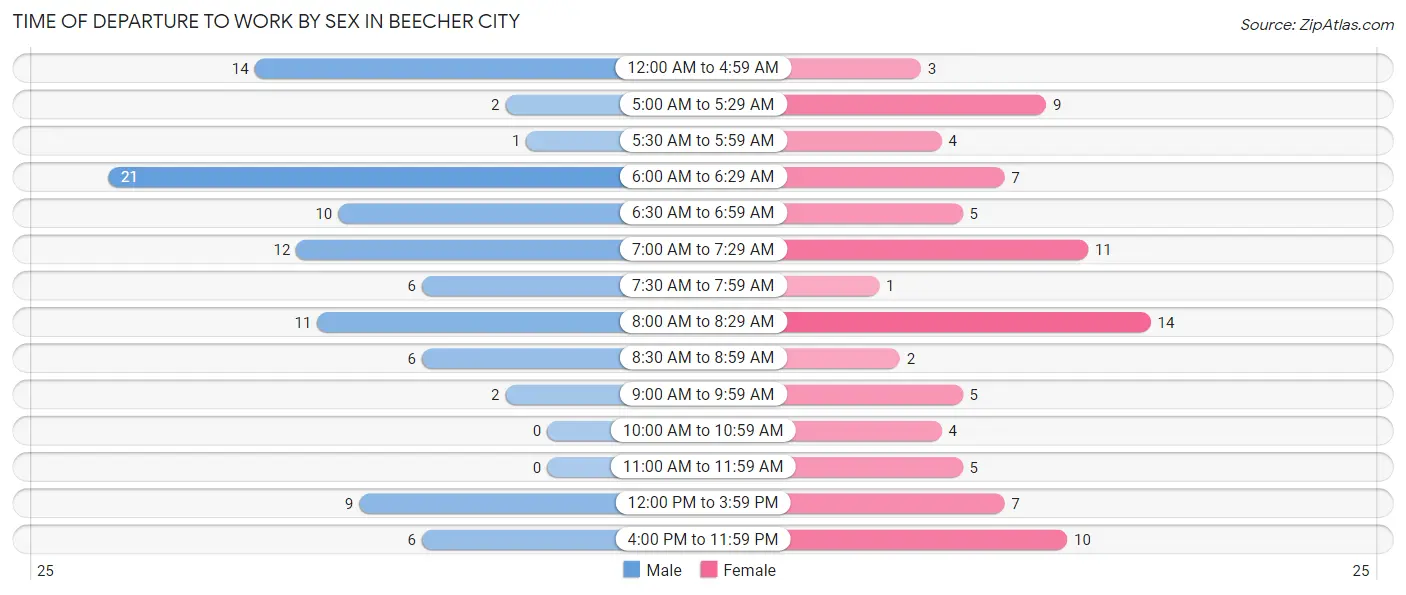
| Time of Departure | Male | Female |
| 12:00 AM to 4:59 AM | 14 (14.0%) | 3 (3.5%) |
| 5:00 AM to 5:29 AM | 2 (2.0%) | 9 (10.3%) |
| 5:30 AM to 5:59 AM | 1 (1.0%) | 4 (4.6%) |
| 6:00 AM to 6:29 AM | 21 (21.0%) | 7 (8.1%) |
| 6:30 AM to 6:59 AM | 10 (10.0%) | 5 (5.8%) |
| 7:00 AM to 7:29 AM | 12 (12.0%) | 11 (12.6%) |
| 7:30 AM to 7:59 AM | 6 (6.0%) | 1 (1.1%) |
| 8:00 AM to 8:29 AM | 11 (11.0%) | 14 (16.1%) |
| 8:30 AM to 8:59 AM | 6 (6.0%) | 2 (2.3%) |
| 9:00 AM to 9:59 AM | 2 (2.0%) | 5 (5.8%) |
| 10:00 AM to 10:59 AM | 0 (0.0%) | 4 (4.6%) |
| 11:00 AM to 11:59 AM | 0 (0.0%) | 5 (5.8%) |
| 12:00 PM to 3:59 PM | 9 (9.0%) | 7 (8.1%) |
| 4:00 PM to 11:59 PM | 6 (6.0%) | 10 (11.5%) |
| Total | 100 (100.0%) | 87 (100.0%) |
Housing Occupancy in Beecher City
Occupancy by Ownership in Beecher City
Of the total 191 dwellings in Beecher City, owner-occupied units account for 128 (67.0%), while renter-occupied units make up 63 (33.0%).
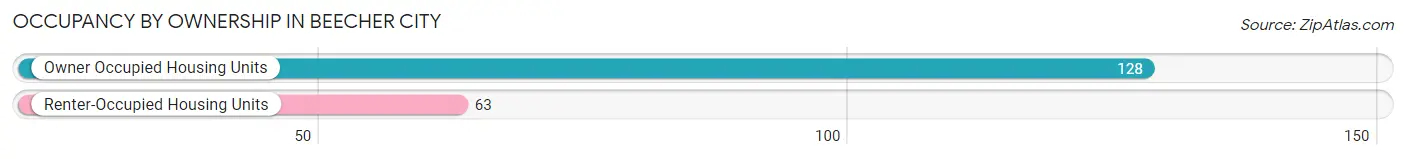
| Occupancy | # Housing Units | % Housing Units |
| Owner Occupied Housing Units | 128 | 67.0% |
| Renter-Occupied Housing Units | 63 | 33.0% |
| Total Occupied Housing Units | 191 | 100.0% |
Occupancy by Household Size in Beecher City
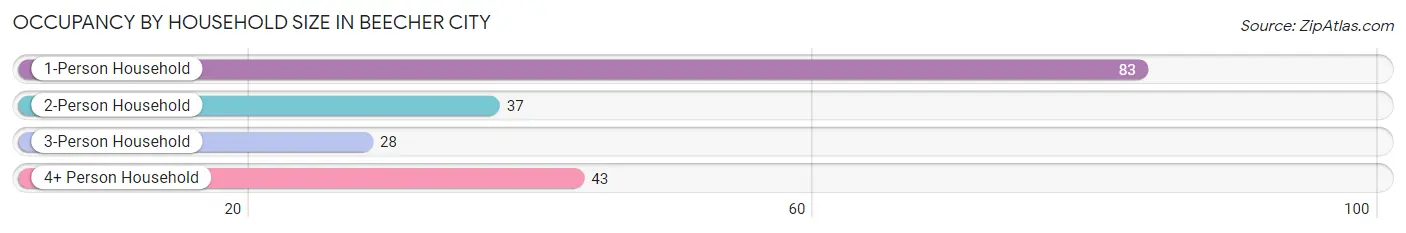
| Household Size | # Housing Units | % Housing Units |
| 1-Person Household | 83 | 43.5% |
| 2-Person Household | 37 | 19.4% |
| 3-Person Household | 28 | 14.7% |
| 4+ Person Household | 43 | 22.5% |
| Total Housing Units | 191 | 100.0% |
Occupancy by Ownership by Household Size in Beecher City
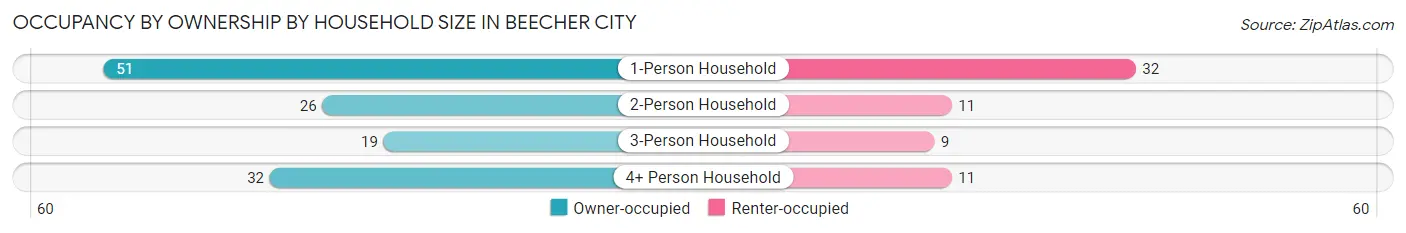
| Household Size | Owner-occupied | Renter-occupied |
| 1-Person Household | 51 (61.5%) | 32 (38.6%) |
| 2-Person Household | 26 (70.3%) | 11 (29.7%) |
| 3-Person Household | 19 (67.9%) | 9 (32.1%) |
| 4+ Person Household | 32 (74.4%) | 11 (25.6%) |
| Total Housing Units | 128 (67.0%) | 63 (33.0%) |
Occupancy by Educational Attainment in Beecher City
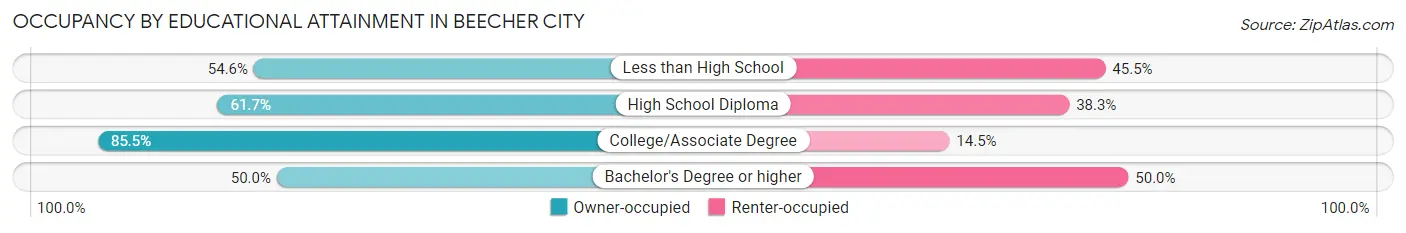
| Household Size | Owner-occupied | Renter-occupied |
| Less than High School | 12 (54.5%) | 10 (45.5%) |
| High School Diploma | 50 (61.7%) | 31 (38.3%) |
| College/Associate Degree | 53 (85.5%) | 9 (14.5%) |
| Bachelor's Degree or higher | 13 (50.0%) | 13 (50.0%) |
Occupancy by Age of Householder in Beecher City
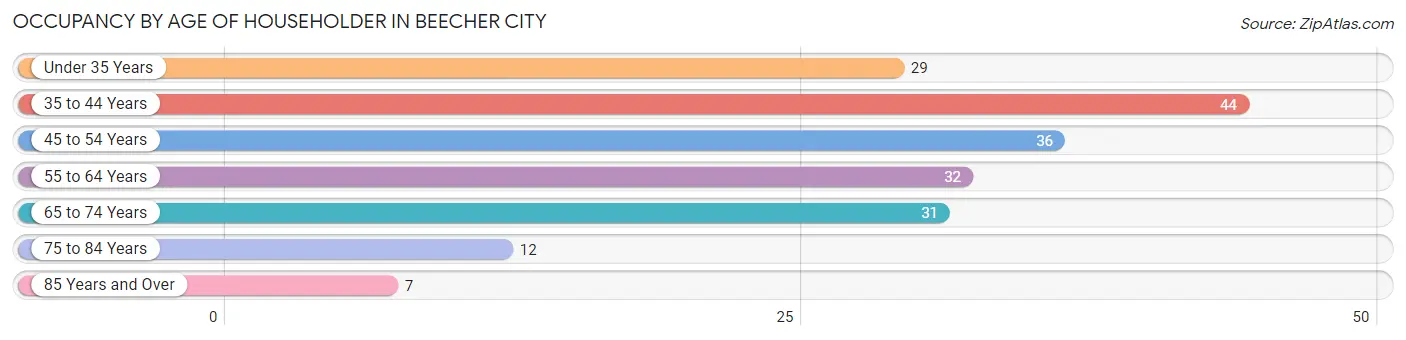
| Age Bracket | # Households | % Households |
| Under 35 Years | 29 | 15.2% |
| 35 to 44 Years | 44 | 23.0% |
| 45 to 54 Years | 36 | 18.9% |
| 55 to 64 Years | 32 | 16.8% |
| 65 to 74 Years | 31 | 16.2% |
| 75 to 84 Years | 12 | 6.3% |
| 85 Years and Over | 7 | 3.7% |
| Total | 191 | 100.0% |
Housing Finances in Beecher City
Median Income by Occupancy in Beecher City
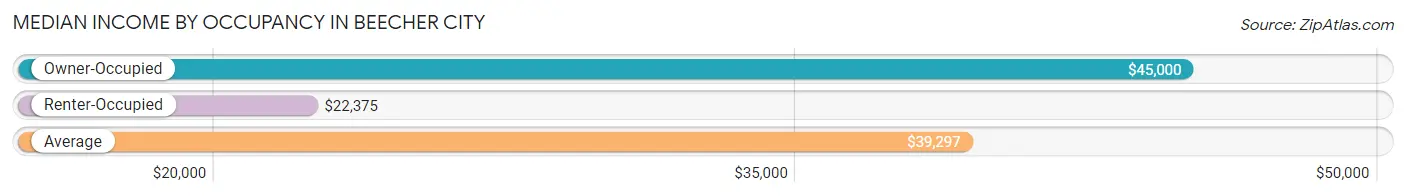
| Occupancy Type | # Households | Median Income |
| Owner-Occupied | 128 (67.0%) | $45,000 |
| Renter-Occupied | 63 (33.0%) | $22,375 |
| Average | 191 (100.0%) | $39,297 |
Occupancy by Householder Income Bracket in Beecher City
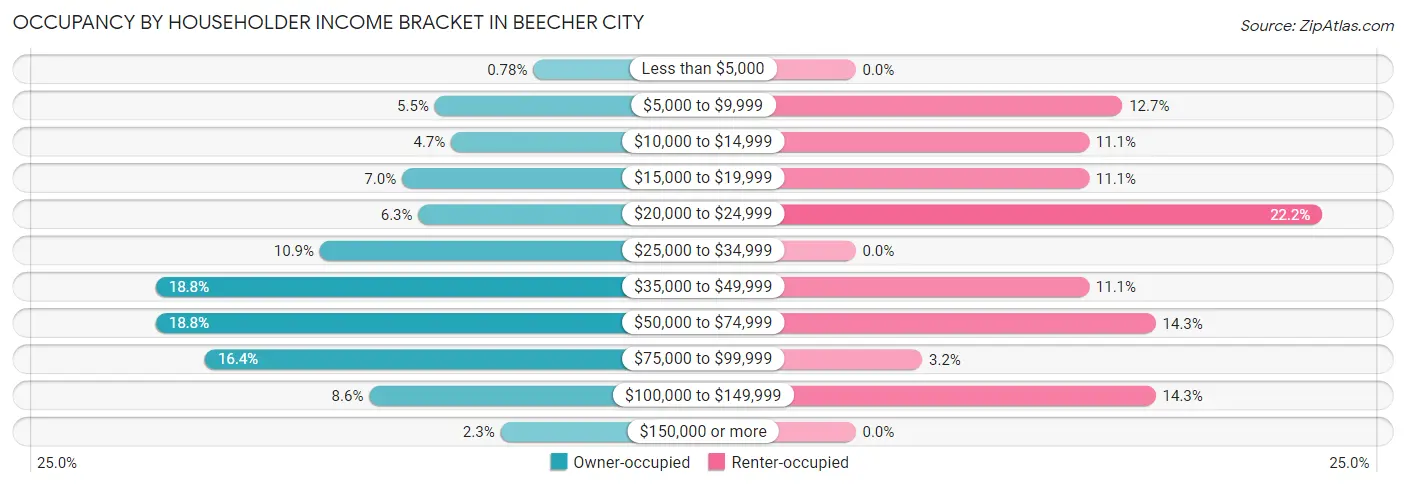
| Income Bracket | Owner-occupied | Renter-occupied |
| Less than $5,000 | 1 (0.8%) | 0 (0.0%) |
| $5,000 to $9,999 | 7 (5.5%) | 8 (12.7%) |
| $10,000 to $14,999 | 6 (4.7%) | 7 (11.1%) |
| $15,000 to $19,999 | 9 (7.0%) | 7 (11.1%) |
| $20,000 to $24,999 | 8 (6.2%) | 14 (22.2%) |
| $25,000 to $34,999 | 14 (10.9%) | 0 (0.0%) |
| $35,000 to $49,999 | 24 (18.8%) | 7 (11.1%) |
| $50,000 to $74,999 | 24 (18.8%) | 9 (14.3%) |
| $75,000 to $99,999 | 21 (16.4%) | 2 (3.2%) |
| $100,000 to $149,999 | 11 (8.6%) | 9 (14.3%) |
| $150,000 or more | 3 (2.3%) | 0 (0.0%) |
| Total | 128 (100.0%) | 63 (100.0%) |
Monthly Housing Cost Tiers in Beecher City
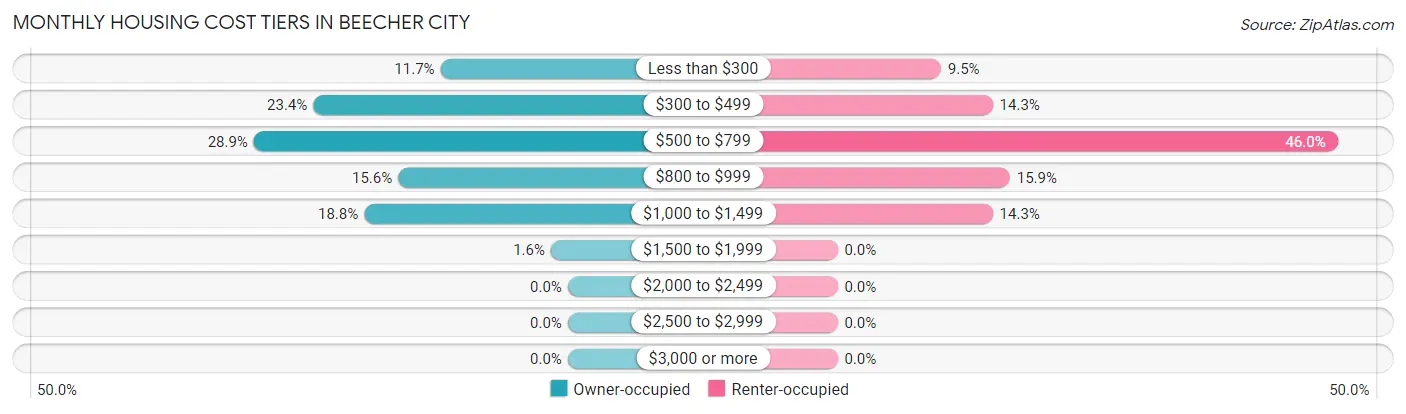
| Monthly Cost | Owner-occupied | Renter-occupied |
| Less than $300 | 15 (11.7%) | 6 (9.5%) |
| $300 to $499 | 30 (23.4%) | 9 (14.3%) |
| $500 to $799 | 37 (28.9%) | 29 (46.0%) |
| $800 to $999 | 20 (15.6%) | 10 (15.9%) |
| $1,000 to $1,499 | 24 (18.8%) | 9 (14.3%) |
| $1,500 to $1,999 | 2 (1.6%) | 0 (0.0%) |
| $2,000 to $2,499 | 0 (0.0%) | 0 (0.0%) |
| $2,500 to $2,999 | 0 (0.0%) | 0 (0.0%) |
| $3,000 or more | 0 (0.0%) | 0 (0.0%) |
| Total | 128 (100.0%) | 63 (100.0%) |
Physical Housing Characteristics in Beecher City
Housing Structures in Beecher City
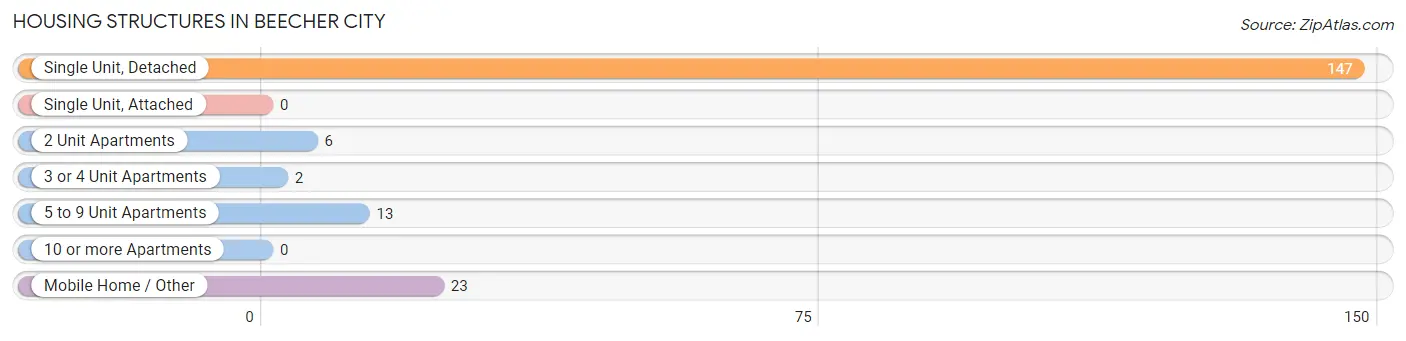
| Structure Type | # Housing Units | % Housing Units |
| Single Unit, Detached | 147 | 77.0% |
| Single Unit, Attached | 0 | 0.0% |
| 2 Unit Apartments | 6 | 3.1% |
| 3 or 4 Unit Apartments | 2 | 1.1% |
| 5 to 9 Unit Apartments | 13 | 6.8% |
| 10 or more Apartments | 0 | 0.0% |
| Mobile Home / Other | 23 | 12.0% |
| Total | 191 | 100.0% |
Housing Structures by Occupancy in Beecher City
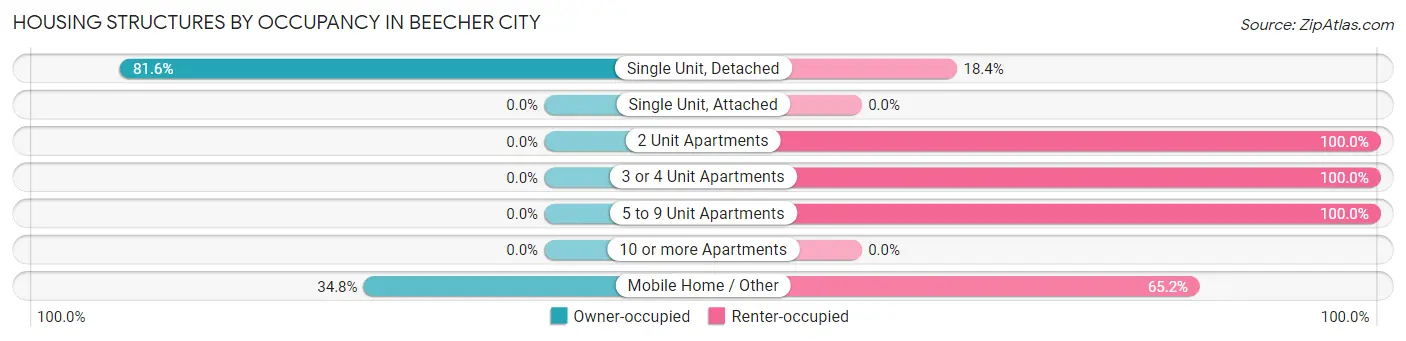
| Structure Type | Owner-occupied | Renter-occupied |
| Single Unit, Detached | 120 (81.6%) | 27 (18.4%) |
| Single Unit, Attached | 0 (0.0%) | 0 (0.0%) |
| 2 Unit Apartments | 0 (0.0%) | 6 (100.0%) |
| 3 or 4 Unit Apartments | 0 (0.0%) | 2 (100.0%) |
| 5 to 9 Unit Apartments | 0 (0.0%) | 13 (100.0%) |
| 10 or more Apartments | 0 (0.0%) | 0 (0.0%) |
| Mobile Home / Other | 8 (34.8%) | 15 (65.2%) |
| Total | 128 (67.0%) | 63 (33.0%) |
Housing Structures by Number of Rooms in Beecher City
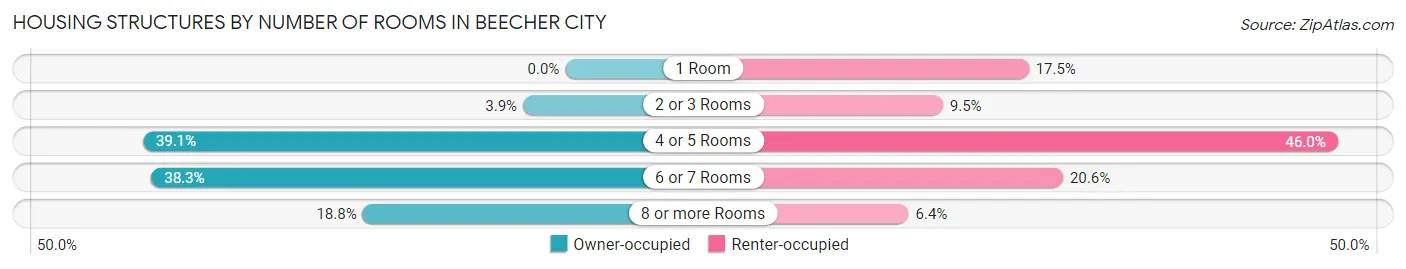
| Number of Rooms | Owner-occupied | Renter-occupied |
| 1 Room | 0 (0.0%) | 11 (17.5%) |
| 2 or 3 Rooms | 5 (3.9%) | 6 (9.5%) |
| 4 or 5 Rooms | 50 (39.1%) | 29 (46.0%) |
| 6 or 7 Rooms | 49 (38.3%) | 13 (20.6%) |
| 8 or more Rooms | 24 (18.8%) | 4 (6.4%) |
| Total | 128 (100.0%) | 63 (100.0%) |
Housing Structure by Heating Type in Beecher City
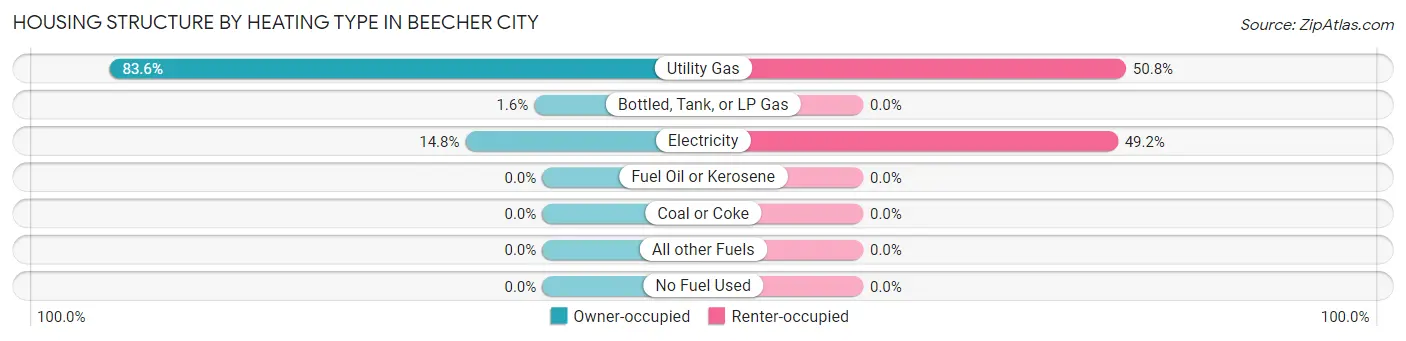
| Heating Type | Owner-occupied | Renter-occupied |
| Utility Gas | 107 (83.6%) | 32 (50.8%) |
| Bottled, Tank, or LP Gas | 2 (1.6%) | 0 (0.0%) |
| Electricity | 19 (14.8%) | 31 (49.2%) |
| Fuel Oil or Kerosene | 0 (0.0%) | 0 (0.0%) |
| Coal or Coke | 0 (0.0%) | 0 (0.0%) |
| All other Fuels | 0 (0.0%) | 0 (0.0%) |
| No Fuel Used | 0 (0.0%) | 0 (0.0%) |
| Total | 128 (100.0%) | 63 (100.0%) |
Household Vehicle Usage in Beecher City
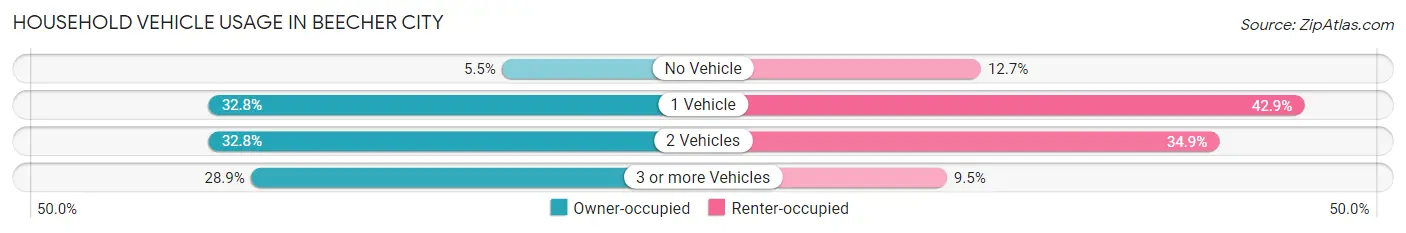
| Vehicles per Household | Owner-occupied | Renter-occupied |
| No Vehicle | 7 (5.5%) | 8 (12.7%) |
| 1 Vehicle | 42 (32.8%) | 27 (42.9%) |
| 2 Vehicles | 42 (32.8%) | 22 (34.9%) |
| 3 or more Vehicles | 37 (28.9%) | 6 (9.5%) |
| Total | 128 (100.0%) | 63 (100.0%) |
Real Estate & Mortgages in Beecher City
Real Estate and Mortgage Overview in Beecher City
| Characteristic | Without Mortgage | With Mortgage |
| Housing Units | 44 | 84 |
| Median Property Value | $73,300 | $87,900 |
| Median Household Income | $45,000 | $2 |
| Monthly Housing Costs | $339 | $0 |
| Real Estate Taxes | $780 | $3 |
Property Value by Mortgage Status in Beecher City
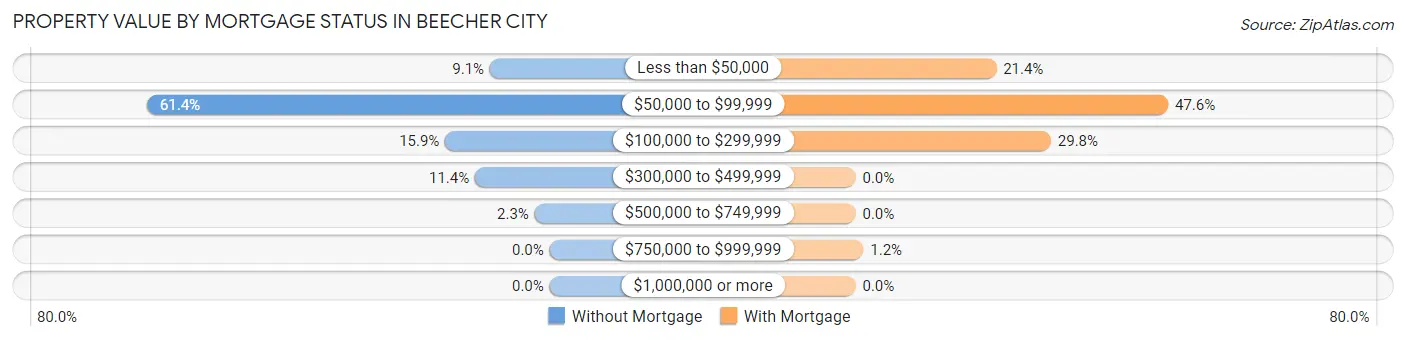
| Property Value | Without Mortgage | With Mortgage |
| Less than $50,000 | 4 (9.1%) | 18 (21.4%) |
| $50,000 to $99,999 | 27 (61.4%) | 40 (47.6%) |
| $100,000 to $299,999 | 7 (15.9%) | 25 (29.8%) |
| $300,000 to $499,999 | 5 (11.4%) | 0 (0.0%) |
| $500,000 to $749,999 | 1 (2.3%) | 0 (0.0%) |
| $750,000 to $999,999 | 0 (0.0%) | 1 (1.2%) |
| $1,000,000 or more | 0 (0.0%) | 0 (0.0%) |
| Total | 44 (100.0%) | 84 (100.0%) |
Household Income by Mortgage Status in Beecher City
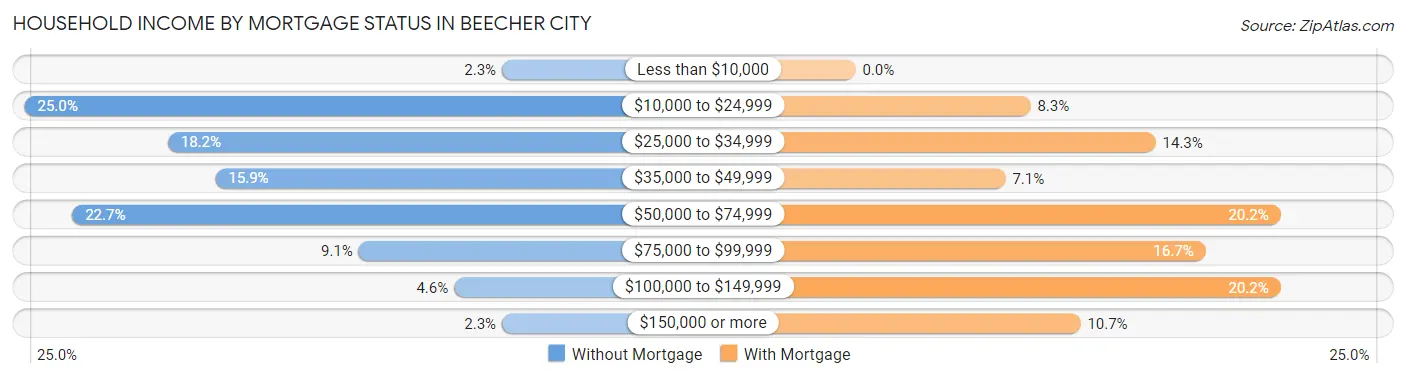
| Household Income | Without Mortgage | With Mortgage |
| Less than $10,000 | 1 (2.3%) | 0 (0.0%) |
| $10,000 to $24,999 | 11 (25.0%) | 7 (8.3%) |
| $25,000 to $34,999 | 8 (18.2%) | 12 (14.3%) |
| $35,000 to $49,999 | 7 (15.9%) | 6 (7.1%) |
| $50,000 to $74,999 | 10 (22.7%) | 17 (20.2%) |
| $75,000 to $99,999 | 4 (9.1%) | 14 (16.7%) |
| $100,000 to $149,999 | 2 (4.5%) | 17 (20.2%) |
| $150,000 or more | 1 (2.3%) | 9 (10.7%) |
| Total | 44 (100.0%) | 84 (100.0%) |
Property Value to Household Income Ratio in Beecher City
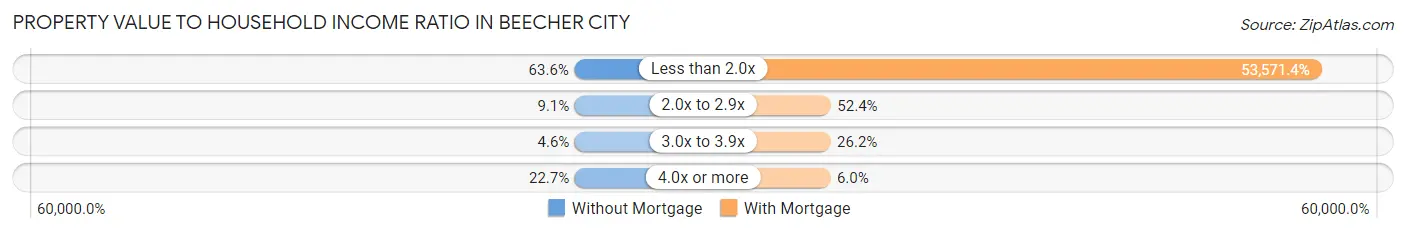
| Value-to-Income Ratio | Without Mortgage | With Mortgage |
| Less than 2.0x | 28 (63.6%) | 45,000 (53,571.4%) |
| 2.0x to 2.9x | 4 (9.1%) | 44 (52.4%) |
| 3.0x to 3.9x | 2 (4.5%) | 22 (26.2%) |
| 4.0x or more | 10 (22.7%) | 5 (5.9%) |
| Total | 44 (100.0%) | 84 (100.0%) |
Real Estate Taxes by Mortgage Status in Beecher City
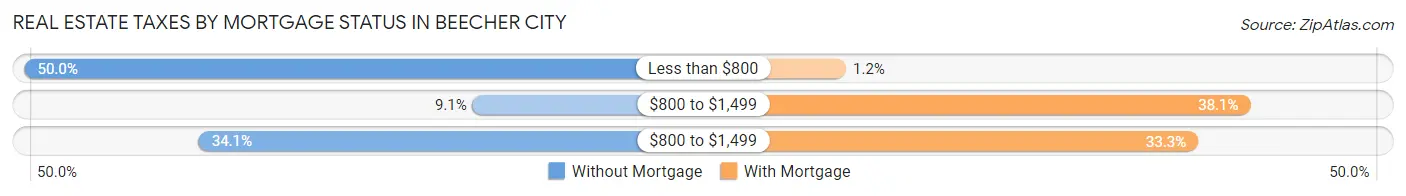
| Property Taxes | Without Mortgage | With Mortgage |
| Less than $800 | 22 (50.0%) | 1 (1.2%) |
| $800 to $1,499 | 4 (9.1%) | 32 (38.1%) |
| $800 to $1,499 | 15 (34.1%) | 28 (33.3%) |
| Total | 44 (100.0%) | 84 (100.0%) |
Health & Disability in Beecher City
Health Insurance Coverage by Age in Beecher City
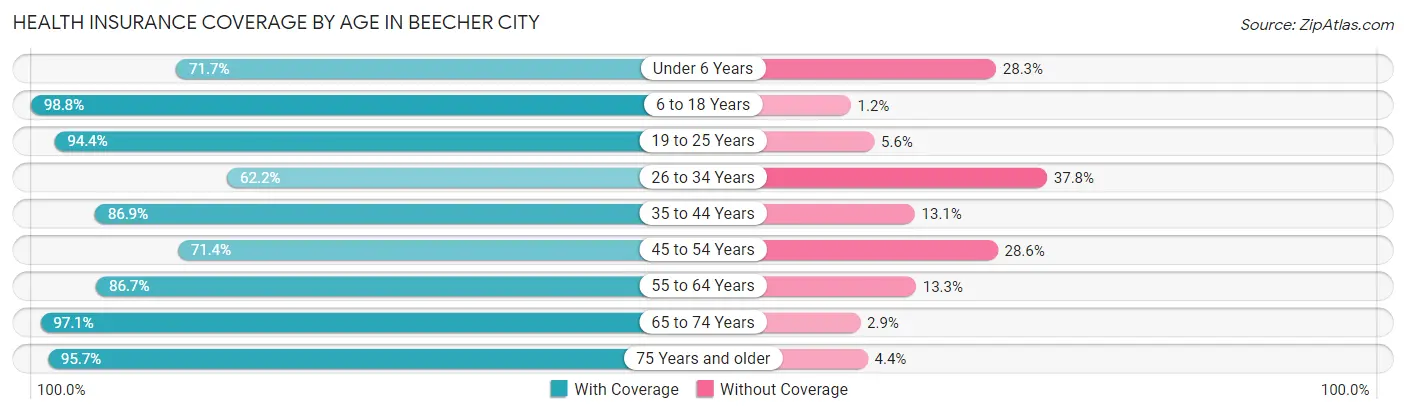
| Age Bracket | With Coverage | Without Coverage |
| Under 6 Years | 33 (71.7%) | 13 (28.3%) |
| 6 to 18 Years | 84 (98.8%) | 1 (1.2%) |
| 19 to 25 Years | 34 (94.4%) | 2 (5.6%) |
| 26 to 34 Years | 28 (62.2%) | 17 (37.8%) |
| 35 to 44 Years | 53 (86.9%) | 8 (13.1%) |
| 45 to 54 Years | 40 (71.4%) | 16 (28.6%) |
| 55 to 64 Years | 39 (86.7%) | 6 (13.3%) |
| 65 to 74 Years | 33 (97.1%) | 1 (2.9%) |
| 75 Years and older | 22 (95.7%) | 1 (4.3%) |
| Total | 366 (84.9%) | 65 (15.1%) |
Health Insurance Coverage by Citizenship Status in Beecher City
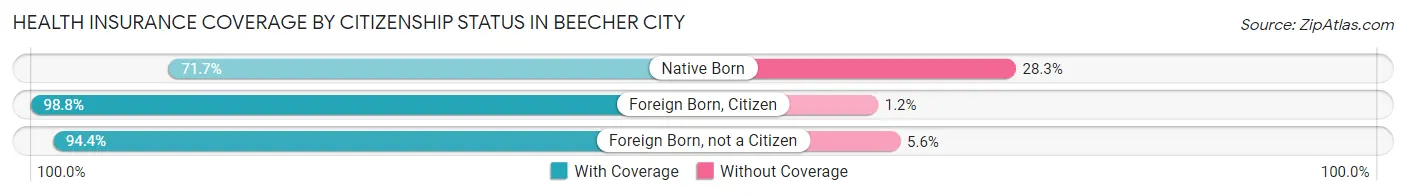
| Citizenship Status | With Coverage | Without Coverage |
| Native Born | 33 (71.7%) | 13 (28.3%) |
| Foreign Born, Citizen | 84 (98.8%) | 1 (1.2%) |
| Foreign Born, not a Citizen | 34 (94.4%) | 2 (5.6%) |
Health Insurance Coverage by Household Income in Beecher City
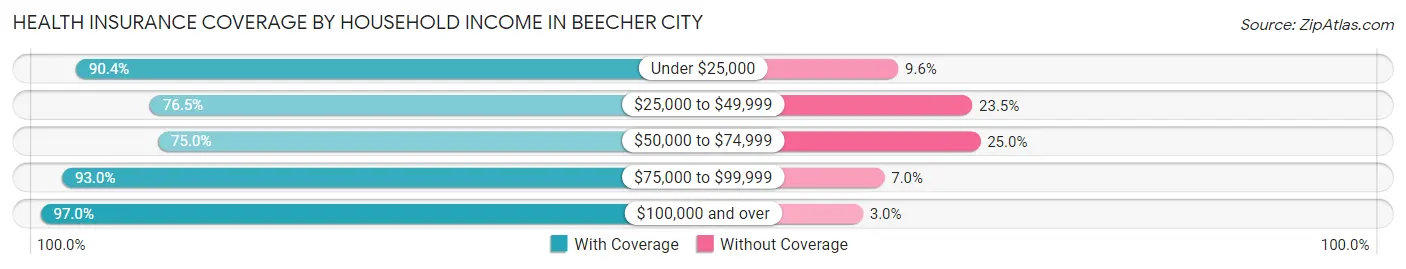
| Household Income | With Coverage | Without Coverage |
| Under $25,000 | 94 (90.4%) | 10 (9.6%) |
| $25,000 to $49,999 | 88 (76.5%) | 27 (23.5%) |
| $50,000 to $74,999 | 66 (75.0%) | 22 (25.0%) |
| $75,000 to $99,999 | 53 (93.0%) | 4 (7.0%) |
| $100,000 and over | 65 (97.0%) | 2 (3.0%) |
Public vs Private Health Insurance Coverage by Age in Beecher City
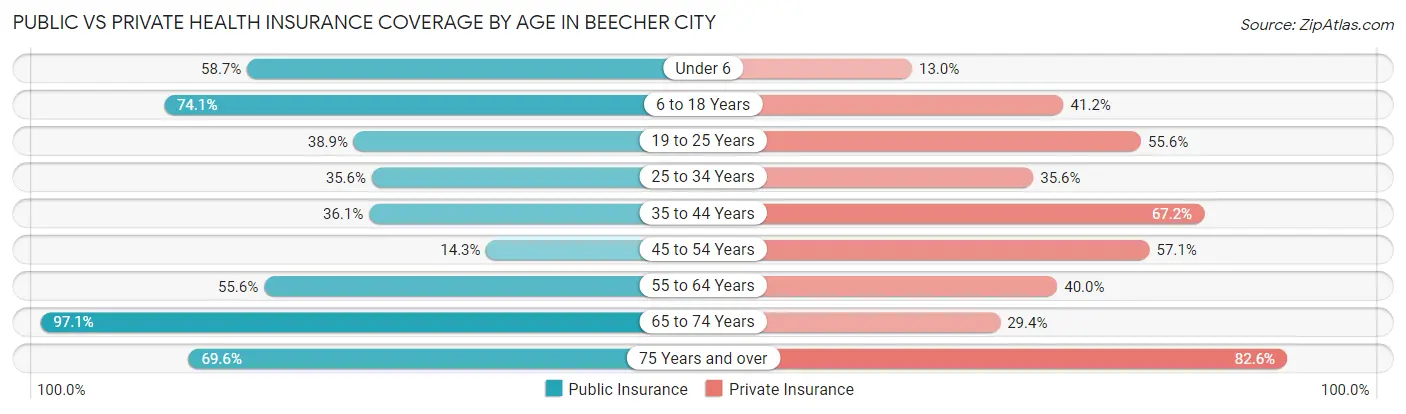
| Age Bracket | Public Insurance | Private Insurance |
| Under 6 | 27 (58.7%) | 6 (13.0%) |
| 6 to 18 Years | 63 (74.1%) | 35 (41.2%) |
| 19 to 25 Years | 14 (38.9%) | 20 (55.6%) |
| 25 to 34 Years | 16 (35.6%) | 16 (35.6%) |
| 35 to 44 Years | 22 (36.1%) | 41 (67.2%) |
| 45 to 54 Years | 8 (14.3%) | 32 (57.1%) |
| 55 to 64 Years | 25 (55.6%) | 18 (40.0%) |
| 65 to 74 Years | 33 (97.1%) | 10 (29.4%) |
| 75 Years and over | 16 (69.6%) | 19 (82.6%) |
| Total | 224 (52.0%) | 197 (45.7%) |
Disability Status by Sex by Age in Beecher City
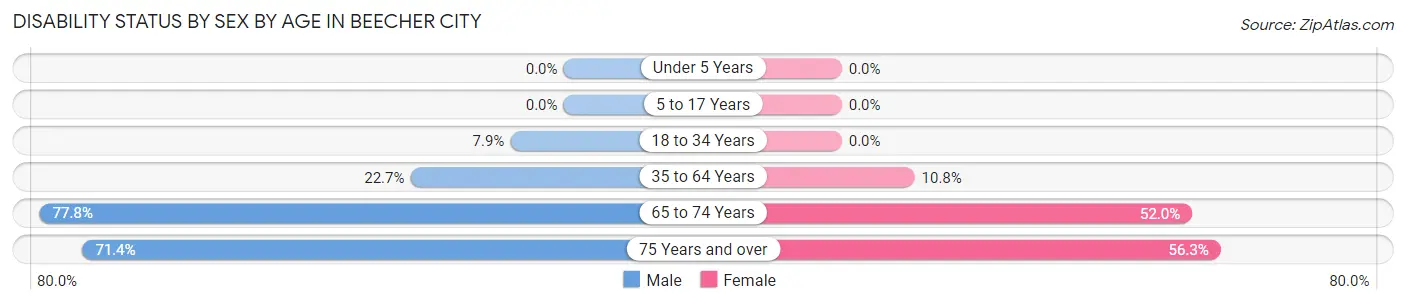
| Age Bracket | Male | Female |
| Under 5 Years | 0 (0.0%) | 0 (0.0%) |
| 5 to 17 Years | 0 (0.0%) | 0 (0.0%) |
| 18 to 34 Years | 3 (7.9%) | 0 (0.0%) |
| 35 to 64 Years | 20 (22.7%) | 8 (10.8%) |
| 65 to 74 Years | 7 (77.8%) | 13 (52.0%) |
| 75 Years and over | 5 (71.4%) | 9 (56.2%) |
Disability Class by Sex by Age in Beecher City
Disability Class: Hearing Difficulty
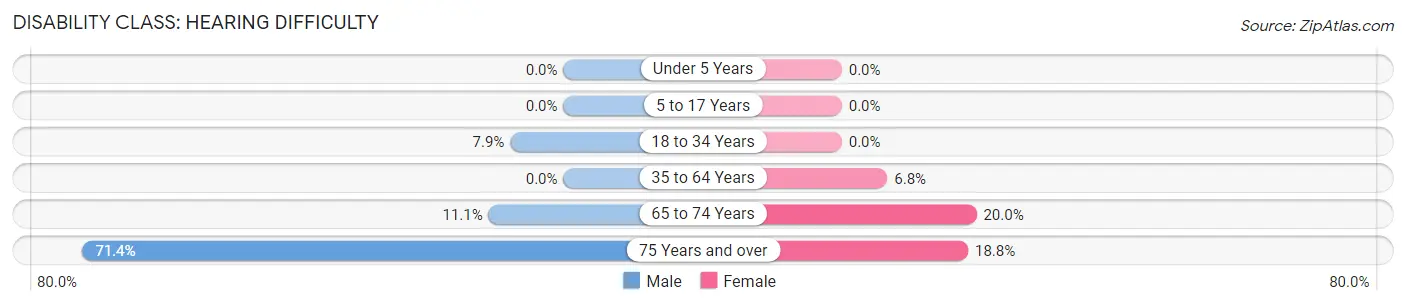
| Age Bracket | Male | Female |
| Under 5 Years | 0 (0.0%) | 0 (0.0%) |
| 5 to 17 Years | 0 (0.0%) | 0 (0.0%) |
| 18 to 34 Years | 3 (7.9%) | 0 (0.0%) |
| 35 to 64 Years | 0 (0.0%) | 5 (6.8%) |
| 65 to 74 Years | 1 (11.1%) | 5 (20.0%) |
| 75 Years and over | 5 (71.4%) | 3 (18.8%) |
Disability Class: Vision Difficulty
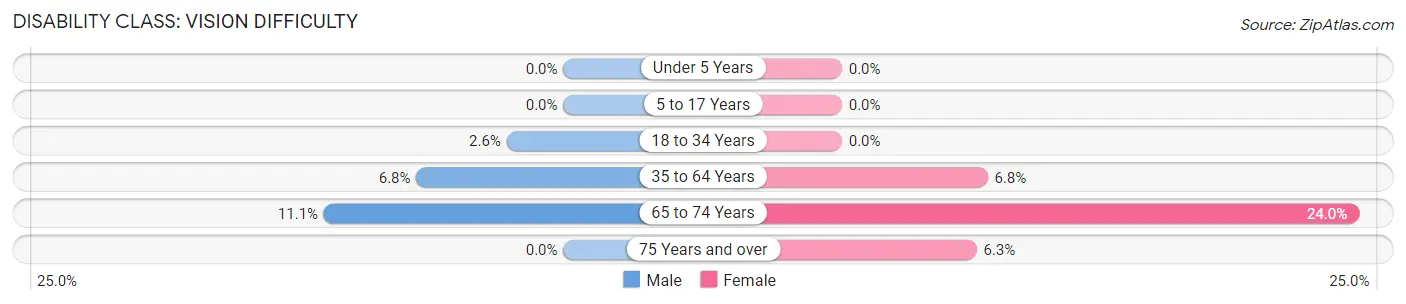
| Age Bracket | Male | Female |
| Under 5 Years | 0 (0.0%) | 0 (0.0%) |
| 5 to 17 Years | 0 (0.0%) | 0 (0.0%) |
| 18 to 34 Years | 1 (2.6%) | 0 (0.0%) |
| 35 to 64 Years | 6 (6.8%) | 5 (6.8%) |
| 65 to 74 Years | 1 (11.1%) | 6 (24.0%) |
| 75 Years and over | 0 (0.0%) | 1 (6.2%) |
Disability Class: Cognitive Difficulty
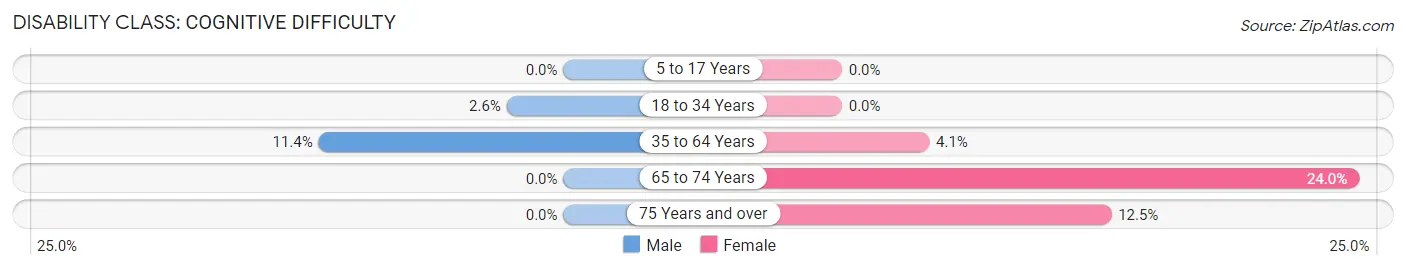
| Age Bracket | Male | Female |
| 5 to 17 Years | 0 (0.0%) | 0 (0.0%) |
| 18 to 34 Years | 1 (2.6%) | 0 (0.0%) |
| 35 to 64 Years | 10 (11.4%) | 3 (4.1%) |
| 65 to 74 Years | 0 (0.0%) | 6 (24.0%) |
| 75 Years and over | 0 (0.0%) | 2 (12.5%) |
Disability Class: Ambulatory Difficulty
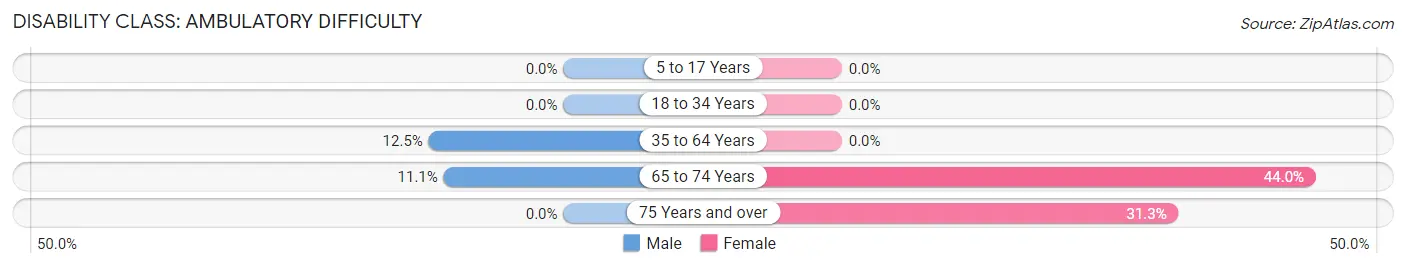
| Age Bracket | Male | Female |
| 5 to 17 Years | 0 (0.0%) | 0 (0.0%) |
| 18 to 34 Years | 0 (0.0%) | 0 (0.0%) |
| 35 to 64 Years | 11 (12.5%) | 0 (0.0%) |
| 65 to 74 Years | 1 (11.1%) | 11 (44.0%) |
| 75 Years and over | 0 (0.0%) | 5 (31.2%) |
Disability Class: Self-Care Difficulty
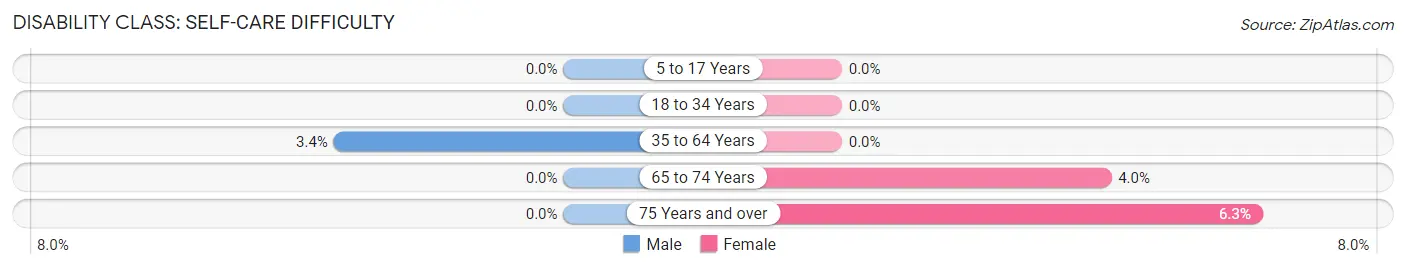
| Age Bracket | Male | Female |
| 5 to 17 Years | 0 (0.0%) | 0 (0.0%) |
| 18 to 34 Years | 0 (0.0%) | 0 (0.0%) |
| 35 to 64 Years | 3 (3.4%) | 0 (0.0%) |
| 65 to 74 Years | 0 (0.0%) | 1 (4.0%) |
| 75 Years and over | 0 (0.0%) | 1 (6.2%) |
Technology Access in Beecher City
Computing Device Access in Beecher City
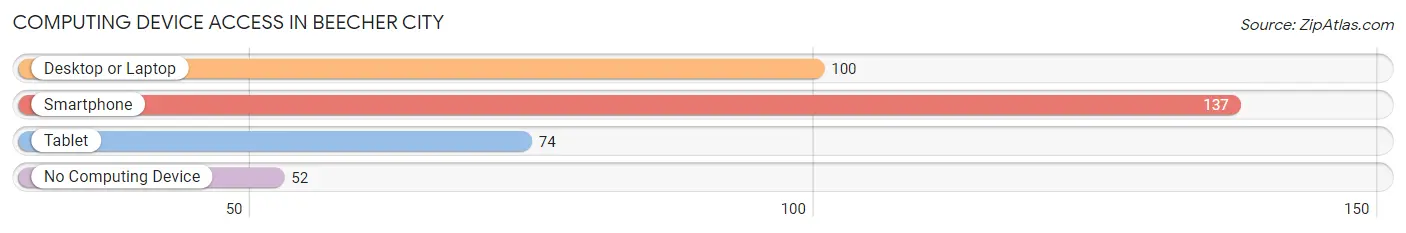
| Device Type | # Households | % Households |
| Desktop or Laptop | 100 | 52.4% |
| Smartphone | 137 | 71.7% |
| Tablet | 74 | 38.7% |
| No Computing Device | 52 | 27.2% |
| Total | 191 | 100.0% |
Internet Access in Beecher City
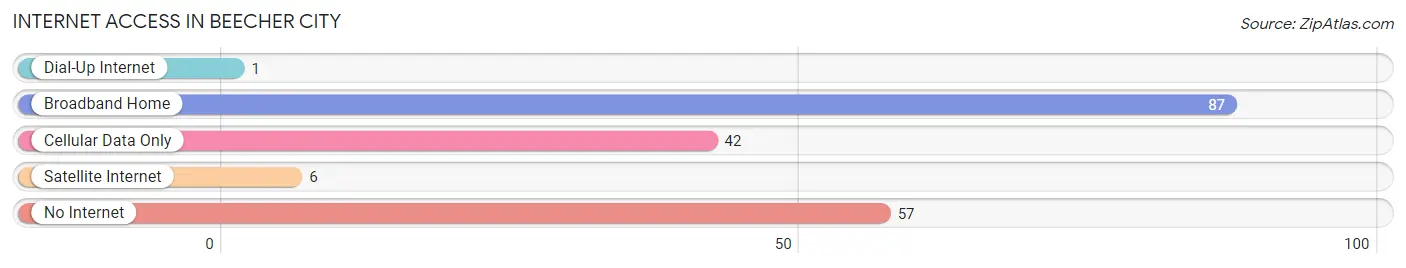
| Internet Type | # Households | % Households |
| Dial-Up Internet | 1 | 0.5% |
| Broadband Home | 87 | 45.6% |
| Cellular Data Only | 42 | 22.0% |
| Satellite Internet | 6 | 3.1% |
| No Internet | 57 | 29.8% |
| Total | 191 | 100.0% |
Beecher City Summary
Beecher City is a small village located in Effingham County, Illinois. It is situated in the southeastern part of the state, about 40 miles east of St. Louis, Missouri. The village has a population of approximately 1,000 people and covers an area of 0.6 square miles.
Geography
Beecher City is located in the southeastern part of Effingham County, Illinois. It is situated in the Central Till Plains region of the state, which is characterized by flat terrain and fertile soils. The village is located at the intersection of two major highways, US Route 40 and Illinois Route 33. The nearest major city is St. Louis, Missouri, which is located about 40 miles to the west.
The climate in Beecher City is classified as humid continental, with hot, humid summers and cold, dry winters. The average annual temperature is around 54°F, with average highs in the summer reaching around 86°F and average lows in the winter dropping to around 28°F. The average annual precipitation is around 40 inches, with most of it falling in the spring and summer months.
Demographics
As of the 2010 census, Beecher City had a population of 1,000 people. The racial makeup of the village was 97.2% White, 0.7% African American, 0.3% Native American, 0.2% Asian, 0.1% Pacific Islander, and 1.5% from other races. Hispanic or Latino of any race were 1.2% of the population.
The median household income in Beecher City was $41,250, and the median family income was $48,750. About 15.2% of families and 17.2% of the population were below the poverty line, including 25.2% of those under age 18 and 8.3% of those age 65 or over.
Economy
Beecher City’s economy is largely based on agriculture. The village is home to several farms, which produce a variety of crops, including corn, soybeans, wheat, and hay. The village also has a few small businesses, including a grocery store, a hardware store, and a few restaurants.
The village is also home to a few manufacturing companies, including a plastics manufacturer and a metal fabrication company. The village is also home to a few small service businesses, including a gas station, a car repair shop, and a few other small businesses.
History
Beecher City was founded in 1854 by a group of settlers from Ohio. The village was named after the Beecher family, who were among the first settlers. The village grew slowly over the years, and by the early 1900s, it had become a thriving agricultural community.
In the 1950s, the village began to experience a period of growth and development. Several new businesses opened in the village, and the population began to increase. In the late 1970s, the village was incorporated as a village, and it has continued to grow and develop since then.
Today, Beecher City is a small, rural village with a population of about 1,000 people. The village is home to several small businesses, and it is a popular destination for tourists who are looking to explore the rural beauty of the Central Till Plains region of Illinois.
Common Questions
What is Per Capita Income in Beecher City?
Per Capita income in Beecher City is $22,183.
What is the Median Family Income in Beecher City?
Median Family Income in Beecher City is $57,813.
What is the Median Household income in Beecher City?
Median Household Income in Beecher City is $39,297.
What is Income or Wage Gap in Beecher City?
Income or Wage Gap in Beecher City is 46.8%.
Women in Beecher City earn 53.2 cents for every dollar earned by a man.
What is Inequality or Gini Index in Beecher City?
Inequality or Gini Index in Beecher City is 0.39.
What is the Total Population of Beecher City?
Total Population of Beecher City is 431.
What is the Total Male Population of Beecher City?
Total Male Population of Beecher City is 212.
What is the Total Female Population of Beecher City?
Total Female Population of Beecher City is 219.
What is the Ratio of Males per 100 Females in Beecher City?
There are 96.80 Males per 100 Females in Beecher City.
What is the Ratio of Females per 100 Males in Beecher City?
There are 103.30 Females per 100 Males in Beecher City.
What is the Median Population Age in Beecher City?
Median Population Age in Beecher City is 36.9 Years.
What is the Average Family Size in Beecher City
Average Family Size in Beecher City is 2.9 People.
What is the Average Household Size in Beecher City
Average Household Size in Beecher City is 2.3 People.
How Large is the Labor Force in Beecher City?
There are 199 People in the Labor Forcein in Beecher City.
What is the Percentage of People in the Labor Force in Beecher City?
61.8% of People are in the Labor Force in Beecher City.
What is the Unemployment Rate in Beecher City?
Unemployment Rate in Beecher City is 2.5%.