Oregon, IL Map & Demographics
Oregon Map
Oregon Overview
$33,377
PER CAPITA INCOME
$84,432
AVG FAMILY INCOME
$72,443
AVG HOUSEHOLD INCOME
34.3%
WAGE / INCOME GAP [ % ]
65.7¢/ $1
WAGE / INCOME GAP [ $ ]
0.39
INEQUALITY / GINI INDEX
3,963
TOTAL POPULATION
2,063
MALE POPULATION
1,900
FEMALE POPULATION
108.58
MALES / 100 FEMALES
92.10
FEMALES / 100 MALES
46.0
MEDIAN AGE
2.9
AVG FAMILY SIZE
2.2
AVG HOUSEHOLD SIZE
1,652
LABOR FORCE [ PEOPLE ]
50.8%
PERCENT IN LABOR FORCE
5.0%
UNEMPLOYMENT RATE
Oregon Zip Codes
Oregon Area Codes
Income in Oregon
Income Overview in Oregon
Per Capita Income in Oregon is $33,377, while median incomes of families and households are $84,432 and $72,443 respectively.
| Characteristic | Number | Measure |
| Per Capita Income | 3,963 | $33,377 |
| Median Family Income | 1,010 | $84,432 |
| Mean Family Income | 1,010 | $93,485 |
| Median Household Income | 1,749 | $72,443 |
| Mean Household Income | 1,749 | $75,701 |
| Income Deficit | 1,010 | $0 |
| Wage / Income Gap (%) | 3,963 | 34.26% |
| Wage / Income Gap ($) | 3,963 | 65.74¢ per $1 |
| Gini / Inequality Index | 3,963 | 0.39 |
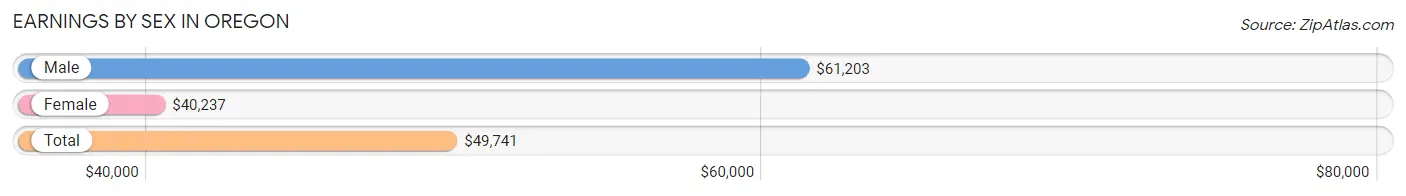
Earnings by Sex in Oregon
Average Earnings in Oregon are $49,741, $61,203 for men and $40,237 for women, a difference of 34.3%.
| Sex | Number | Average Earnings |
| Male | 947 (56.8%) | $61,203 |
| Female | 721 (43.2%) | $40,237 |
| Total | 1,668 (100.0%) | $49,741 |
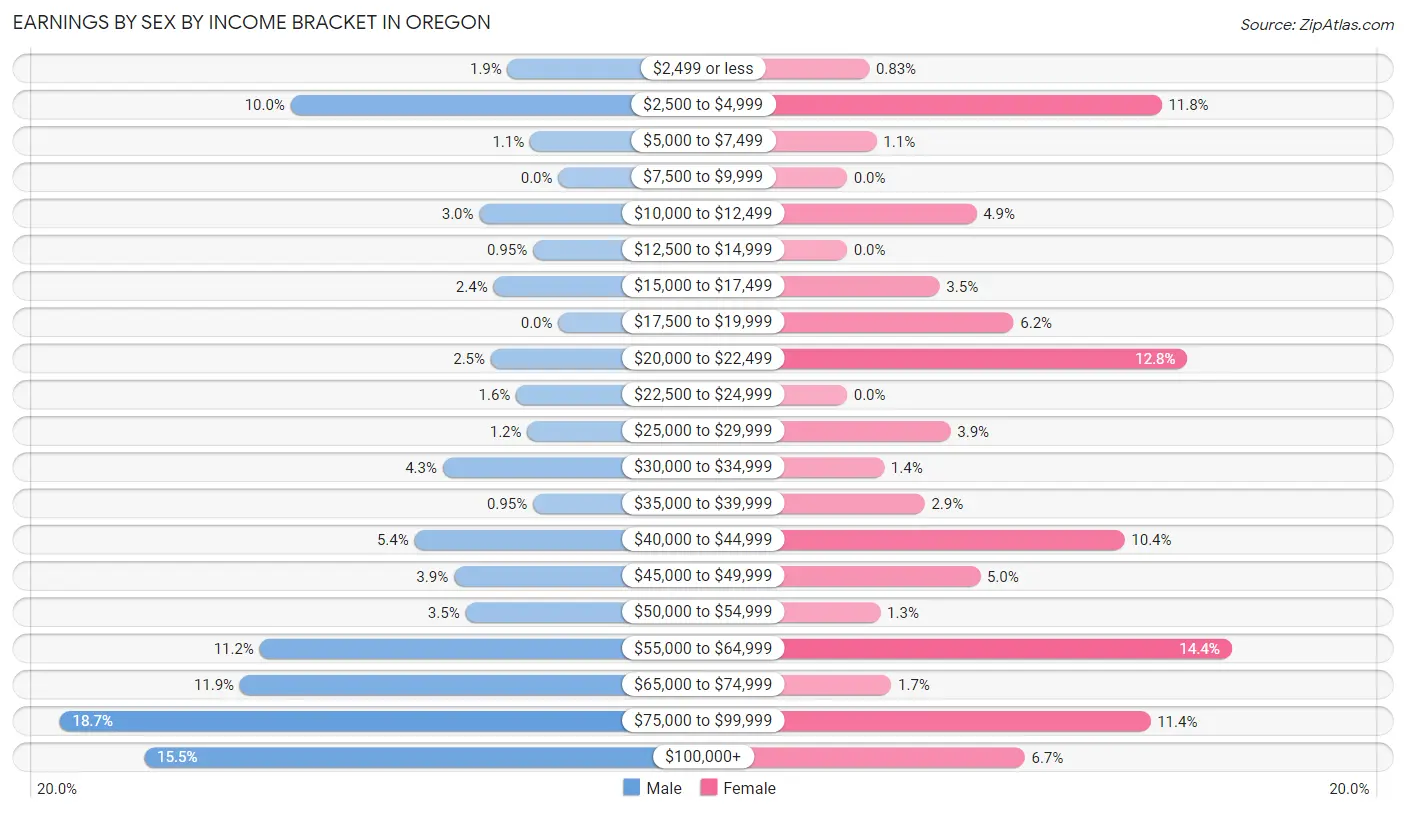
Earnings by Sex by Income Bracket in Oregon
The most common earnings brackets in Oregon are $75,000 to $99,999 for men (177 | 18.7%) and $55,000 to $64,999 for women (104 | 14.4%).
| Income | Male | Female |
| $2,499 or less | 18 (1.9%) | 6 (0.8%) |
| $2,500 to $4,999 | 95 (10.0%) | 85 (11.8%) |
| $5,000 to $7,499 | 10 (1.1%) | 8 (1.1%) |
| $7,500 to $9,999 | 0 (0.0%) | 0 (0.0%) |
| $10,000 to $12,499 | 28 (3.0%) | 35 (4.9%) |
| $12,500 to $14,999 | 9 (0.9%) | 0 (0.0%) |
| $15,000 to $17,499 | 23 (2.4%) | 25 (3.5%) |
| $17,500 to $19,999 | 0 (0.0%) | 45 (6.2%) |
| $20,000 to $22,499 | 24 (2.5%) | 92 (12.8%) |
| $22,500 to $24,999 | 15 (1.6%) | 0 (0.0%) |
| $25,000 to $29,999 | 11 (1.2%) | 28 (3.9%) |
| $30,000 to $34,999 | 41 (4.3%) | 10 (1.4%) |
| $35,000 to $39,999 | 9 (0.9%) | 21 (2.9%) |
| $40,000 to $44,999 | 51 (5.4%) | 75 (10.4%) |
| $45,000 to $49,999 | 37 (3.9%) | 36 (5.0%) |
| $50,000 to $54,999 | 33 (3.5%) | 9 (1.3%) |
| $55,000 to $64,999 | 106 (11.2%) | 104 (14.4%) |
| $65,000 to $74,999 | 113 (11.9%) | 12 (1.7%) |
| $75,000 to $99,999 | 177 (18.7%) | 82 (11.4%) |
| $100,000+ | 147 (15.5%) | 48 (6.7%) |
| Total | 947 (100.0%) | 721 (100.0%) |
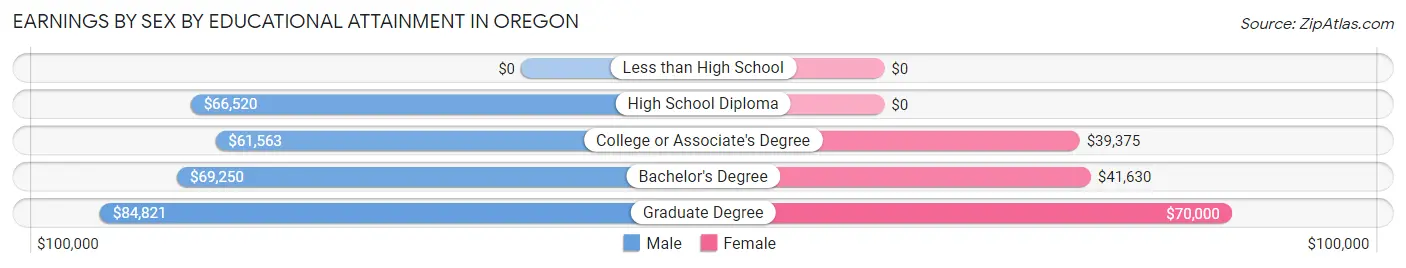
Earnings by Sex by Educational Attainment in Oregon
Average earnings in Oregon are $66,111 for men and $42,435 for women, a difference of 35.8%. Men with an educational attainment of graduate degree enjoy the highest average annual earnings of $84,821, while those with college or associate's degree education earn the least with $61,563. Women with an educational attainment of graduate degree earn the most with the average annual earnings of $70,000, while those with college or associate's degree education have the smallest earnings of $39,375.
| Educational Attainment | Male Income | Female Income |
| Less than High School | - | - |
| High School Diploma | $66,520 | $0 |
| College or Associate's Degree | $61,563 | $39,375 |
| Bachelor's Degree | $69,250 | $41,630 |
| Graduate Degree | $84,821 | $70,000 |
| Total | $66,111 | $42,435 |
Family Income in Oregon
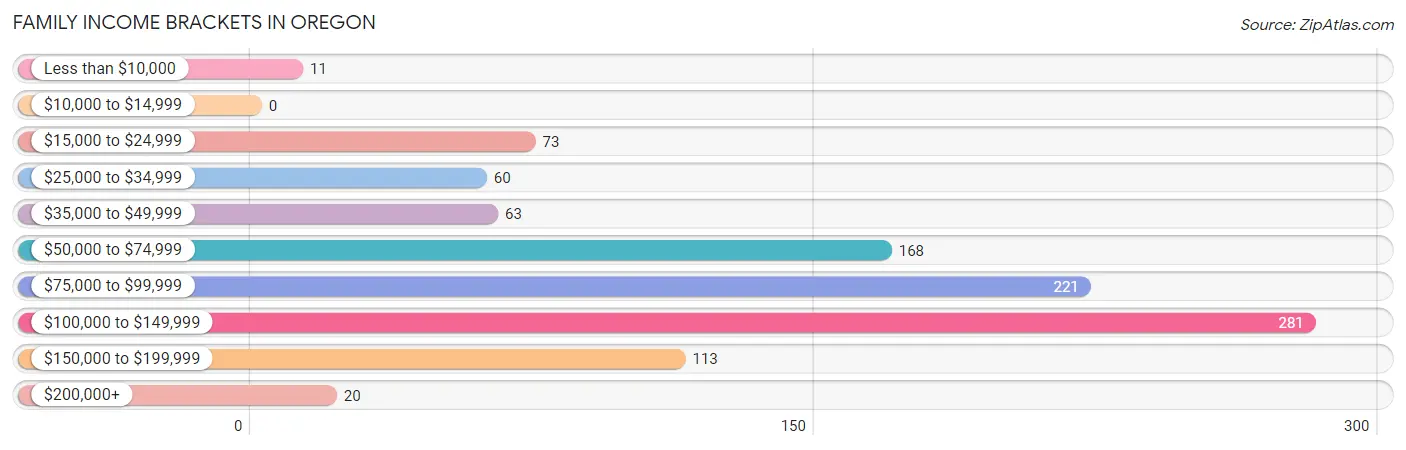
Family Income Brackets in Oregon
According to the Oregon family income data, there are 281 families falling into the $100,000 to $149,999 income range, which is the most common income bracket and makes up 27.8% of all families.
| Income Bracket | # Families | % Families |
| Less than $10,000 | 11 | 1.1% |
| $10,000 to $14,999 | 0 | 0.0% |
| $15,000 to $24,999 | 73 | 7.2% |
| $25,000 to $34,999 | 60 | 5.9% |
| $35,000 to $49,999 | 63 | 6.2% |
| $50,000 to $74,999 | 168 | 16.6% |
| $75,000 to $99,999 | 221 | 21.9% |
| $100,000 to $149,999 | 281 | 27.8% |
| $150,000 to $199,999 | 113 | 11.2% |
| $200,000+ | 20 | 2.0% |
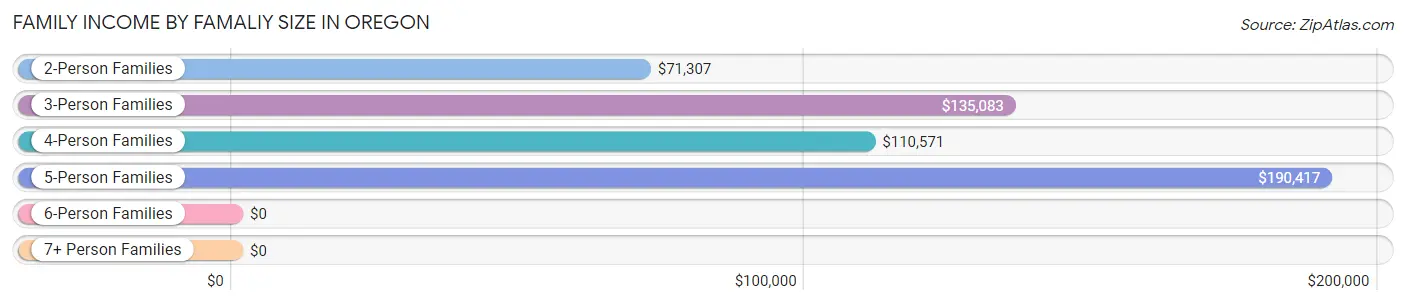
Family Income by Famaliy Size in Oregon
5-person families (30 | 3.0%) account for the highest median family income in Oregon with $190,417 per family, while 3-person families (256 | 25.4%) have the highest median income of $45,028 per family member.
| Income Bracket | # Families | Median Income |
| 2-Person Families | 533 (52.8%) | $71,307 |
| 3-Person Families | 256 (25.4%) | $135,083 |
| 4-Person Families | 135 (13.4%) | $110,571 |
| 5-Person Families | 30 (3.0%) | $190,417 |
| 6-Person Families | 51 (5.1%) | $0 |
| 7+ Person Families | 5 (0.5%) | $0 |
| Total | 1,010 (100.0%) | $84,432 |
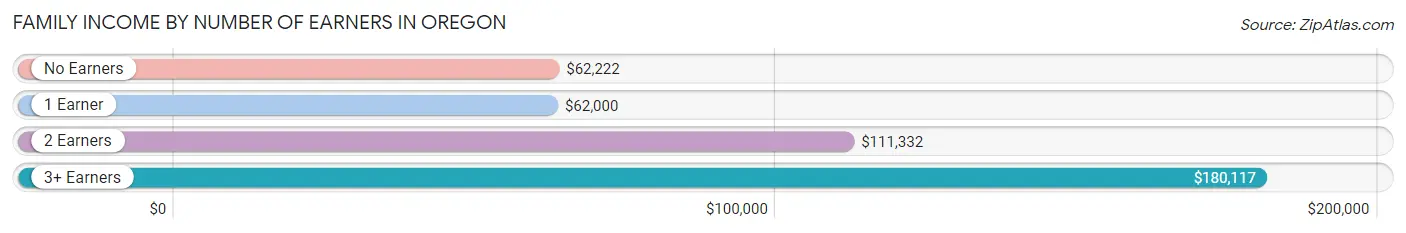
Family Income by Number of Earners in Oregon
The median family income in Oregon is $84,432, with families comprising 3+ earners (101) having the highest median family income of $180,117, while families with 1 earner (296) have the lowest median family income of $62,000, accounting for 10.0% and 29.3% of families, respectively.
| Number of Earners | # Families | Median Income |
| No Earners | 250 (24.7%) | $62,222 |
| 1 Earner | 296 (29.3%) | $62,000 |
| 2 Earners | 363 (35.9%) | $111,332 |
| 3+ Earners | 101 (10.0%) | $180,117 |
| Total | 1,010 (100.0%) | $84,432 |
Household Income in Oregon
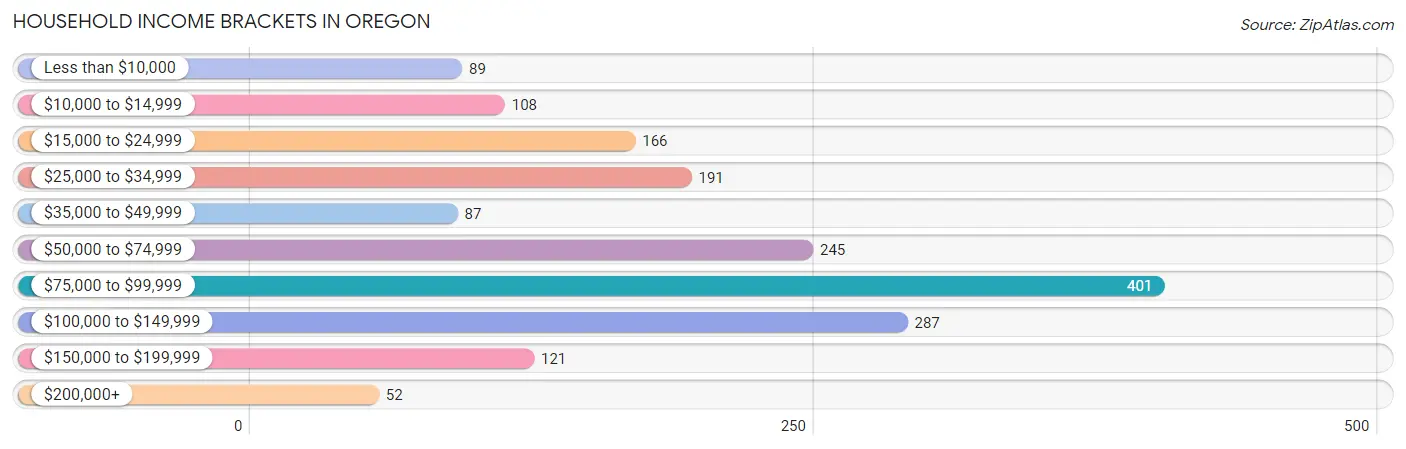
Household Income Brackets in Oregon
With 401 households falling in the category, the $75,000 to $99,999 income range is the most frequent in Oregon, accounting for 22.9% of all households. In contrast, only 52 households (3.0%) fall into the $200,000+ income bracket, making it the least populous group.
| Income Bracket | # Households | % Households |
| Less than $10,000 | 89 | 5.1% |
| $10,000 to $14,999 | 108 | 6.2% |
| $15,000 to $24,999 | 166 | 9.5% |
| $25,000 to $34,999 | 191 | 10.9% |
| $35,000 to $49,999 | 87 | 5.0% |
| $50,000 to $74,999 | 245 | 14.0% |
| $75,000 to $99,999 | 401 | 22.9% |
| $100,000 to $149,999 | 287 | 16.4% |
| $150,000 to $199,999 | 121 | 6.9% |
| $200,000+ | 52 | 3.0% |
Household Income by Householder Age in Oregon
The median household income in Oregon is $72,443, with the highest median household income of $95,446 found in the 25 to 44 years age bracket for the primary householder. A total of 433 households (24.8%) fall into this category. Meanwhile, the 15 to 24 years age bracket for the primary householder has the lowest median household income of $0, with 25 households (1.4%) in this group.
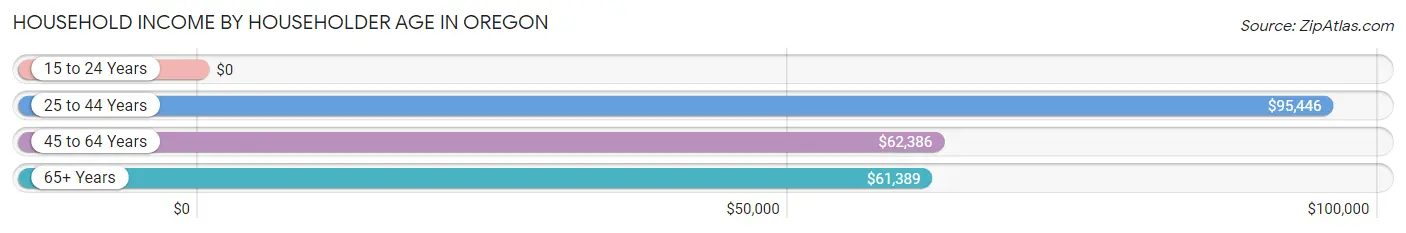
| Income Bracket | # Households | Median Income |
| 15 to 24 Years | 25 (1.4%) | $0 |
| 25 to 44 Years | 433 (24.8%) | $95,446 |
| 45 to 64 Years | 805 (46.0%) | $62,386 |
| 65+ Years | 486 (27.8%) | $61,389 |
| Total | 1,749 (100.0%) | $72,443 |
Poverty in Oregon
Income Below Poverty by Sex and Age in Oregon
With 7.5% poverty level for males and 10.5% for females among the residents of Oregon, 15 year old males and 55 to 64 year old females are the most vulnerable to poverty, with 9 males (52.9%) and 41 females (23.7%) in their respective age groups living below the poverty level.
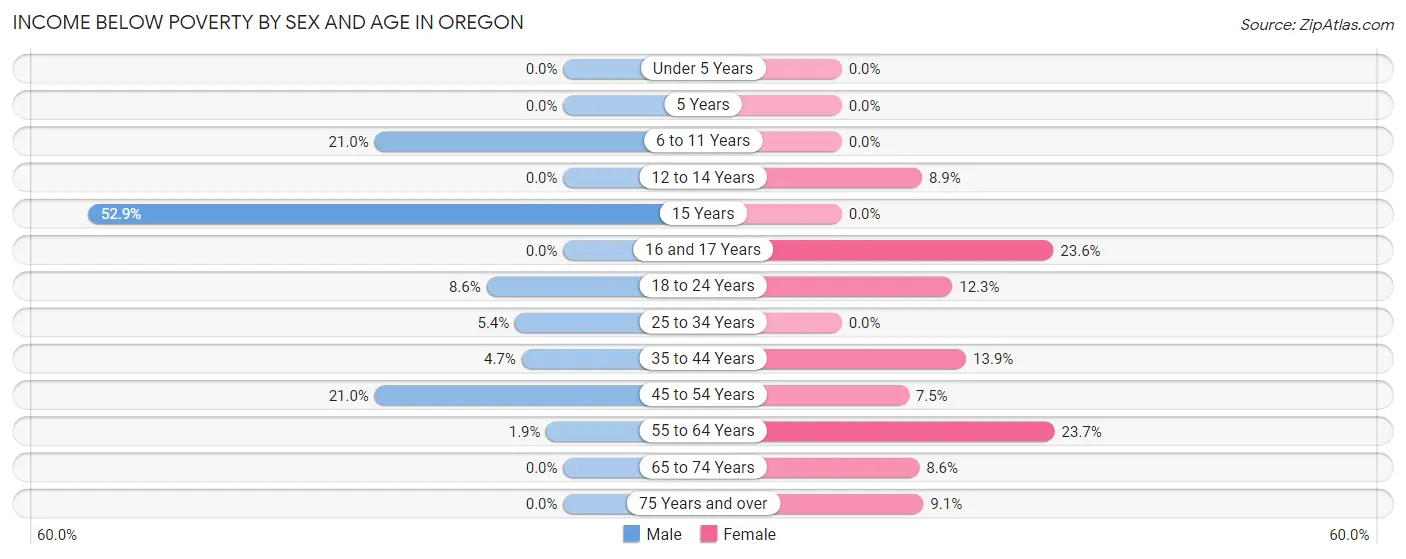
| Age Bracket | Male | Female |
| Under 5 Years | 0 (0.0%) | 0 (0.0%) |
| 5 Years | 0 (0.0%) | 0 (0.0%) |
| 6 to 11 Years | 33 (21.0%) | 0 (0.0%) |
| 12 to 14 Years | 0 (0.0%) | 10 (8.9%) |
| 15 Years | 9 (52.9%) | 0 (0.0%) |
| 16 and 17 Years | 0 (0.0%) | 33 (23.6%) |
| 18 to 24 Years | 10 (8.6%) | 16 (12.3%) |
| 25 to 34 Years | 8 (5.4%) | 0 (0.0%) |
| 35 to 44 Years | 12 (4.6%) | 41 (13.9%) |
| 45 to 54 Years | 71 (21.0%) | 23 (7.5%) |
| 55 to 64 Years | 6 (1.9%) | 41 (23.7%) |
| 65 to 74 Years | 0 (0.0%) | 12 (8.6%) |
| 75 Years and over | 0 (0.0%) | 18 (9.1%) |
| Total | 149 (7.5%) | 194 (10.5%) |
Income Above Poverty by Sex and Age in Oregon
According to the poverty statistics in Oregon, males aged under 5 years and females aged under 5 years are the age groups that are most secure financially, with 100.0% of males and 100.0% of females in these age groups living above the poverty line.
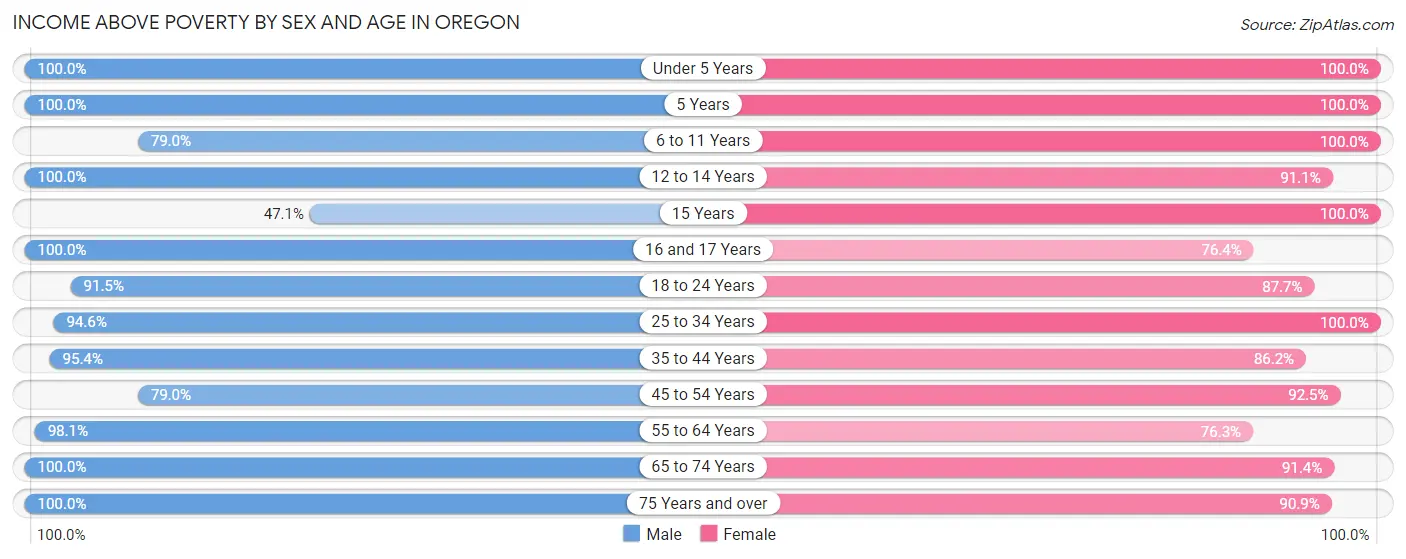
| Age Bracket | Male | Female |
| Under 5 Years | 85 (100.0%) | 51 (100.0%) |
| 5 Years | 18 (100.0%) | 19 (100.0%) |
| 6 to 11 Years | 124 (79.0%) | 167 (100.0%) |
| 12 to 14 Years | 28 (100.0%) | 102 (91.1%) |
| 15 Years | 8 (47.1%) | 44 (100.0%) |
| 16 and 17 Years | 5 (100.0%) | 107 (76.4%) |
| 18 to 24 Years | 107 (91.4%) | 114 (87.7%) |
| 25 to 34 Years | 141 (94.6%) | 61 (100.0%) |
| 35 to 44 Years | 246 (95.4%) | 255 (86.2%) |
| 45 to 54 Years | 267 (79.0%) | 285 (92.5%) |
| 55 to 64 Years | 311 (98.1%) | 132 (76.3%) |
| 65 to 74 Years | 247 (100.0%) | 127 (91.4%) |
| 75 Years and over | 262 (100.0%) | 180 (90.9%) |
| Total | 1,849 (92.5%) | 1,644 (89.4%) |
Income Below Poverty Among Married-Couple Families in Oregon
The poverty statistics for married-couple families in Oregon show that 0.1% or 1 of the total 782 families live below the poverty line. Families with 1 or 2 children have the highest poverty rate of 0.4%, comprising of 1 families. On the other hand, families with no children have the lowest poverty rate of 0.0%, which includes 0 families.
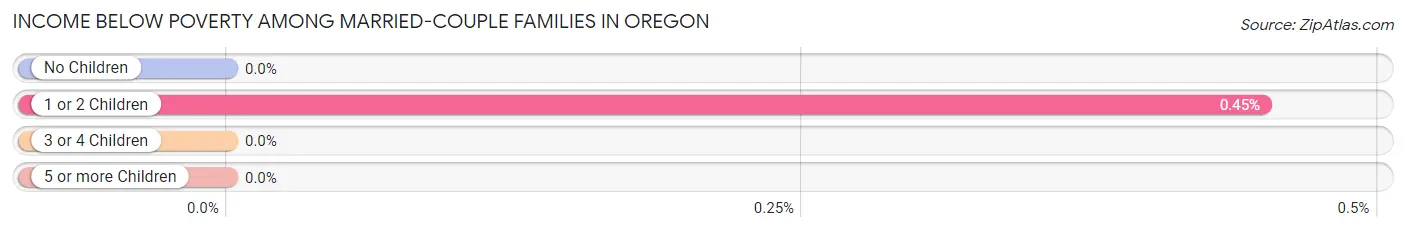
| Children | Above Poverty | Below Poverty |
| No Children | 485 (100.0%) | 0 (0.0%) |
| 1 or 2 Children | 220 (99.6%) | 1 (0.4%) |
| 3 or 4 Children | 76 (100.0%) | 0 (0.0%) |
| 5 or more Children | 0 (0.0%) | 0 (0.0%) |
| Total | 781 (99.9%) | 1 (0.1%) |
Income Below Poverty Among Single-Parent Households in Oregon
According to the poverty data in Oregon, 9.6% or 11 single-father households and 25.7% or 29 single-mother households are living below the poverty line. Among single-father households, those with 1 or 2 children have the highest poverty rate, with 11 households (13.9%) experiencing poverty. Likewise, among single-mother households, those with 1 or 2 children have the highest poverty rate, with 29 households (52.7%) falling below the poverty line.
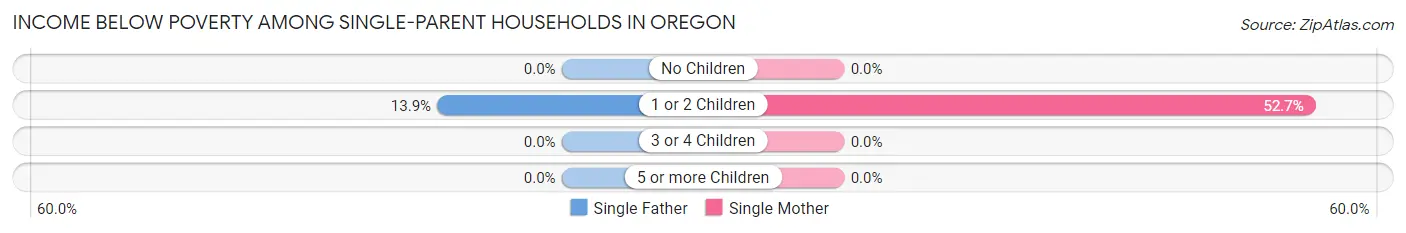
| Children | Single Father | Single Mother |
| No Children | 0 (0.0%) | 0 (0.0%) |
| 1 or 2 Children | 11 (13.9%) | 29 (52.7%) |
| 3 or 4 Children | 0 (0.0%) | 0 (0.0%) |
| 5 or more Children | 0 (0.0%) | 0 (0.0%) |
| Total | 11 (9.6%) | 29 (25.7%) |
Income Below Poverty Among Married-Couple vs Single-Parent Households in Oregon
The poverty data for Oregon shows that 1 of the married-couple family households (0.1%) and 40 of the single-parent households (17.5%) are living below the poverty level. Within the married-couple family households, those with 1 or 2 children have the highest poverty rate, with 1 households (0.4%) falling below the poverty line. Among the single-parent households, those with 1 or 2 children have the highest poverty rate, with 40 household (29.8%) living below poverty.
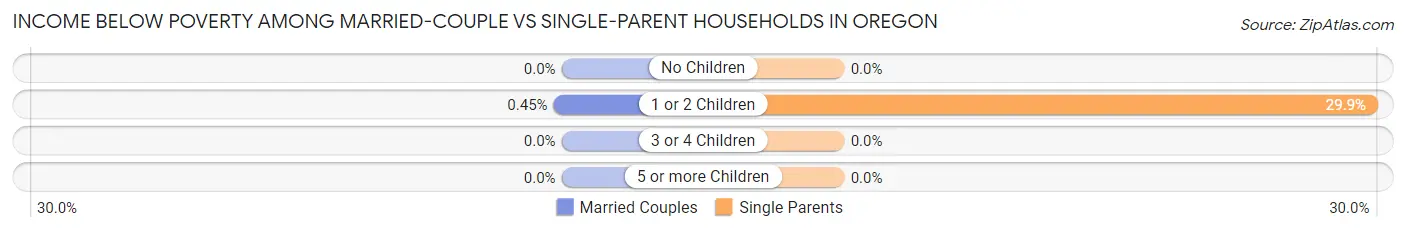
| Children | Married-Couple Families | Single-Parent Households |
| No Children | 0 (0.0%) | 0 (0.0%) |
| 1 or 2 Children | 1 (0.4%) | 40 (29.8%) |
| 3 or 4 Children | 0 (0.0%) | 0 (0.0%) |
| 5 or more Children | 0 (0.0%) | 0 (0.0%) |
| Total | 1 (0.1%) | 40 (17.5%) |
Race in Oregon
The most populous races in Oregon are White / Caucasian (3,825 | 96.5%), Hispanic or Latino (295 | 7.4%), and Two or more Races (97 | 2.5%).
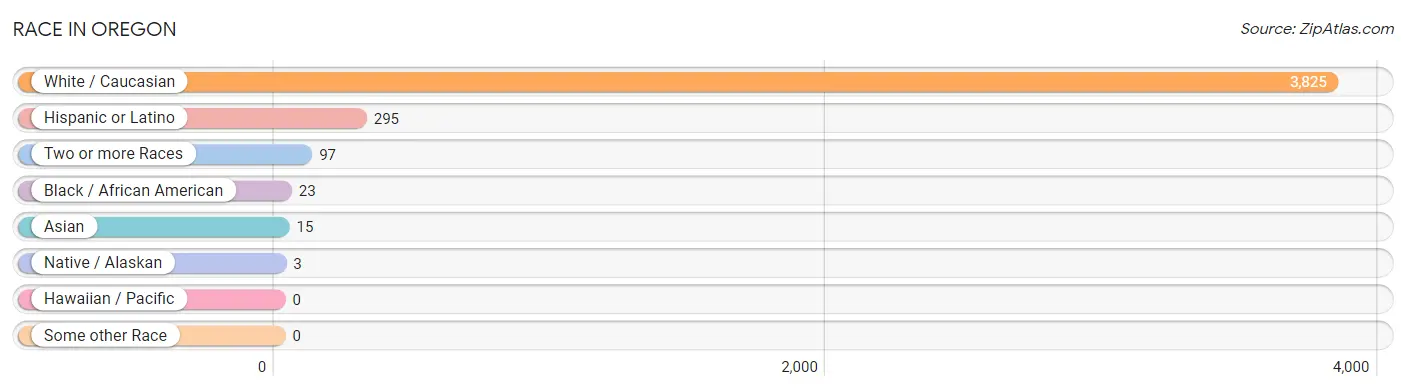
| Race | # Population | % Population |
| Asian | 15 | 0.4% |
| Black / African American | 23 | 0.6% |
| Hawaiian / Pacific | 0 | 0.0% |
| Hispanic or Latino | 295 | 7.4% |
| Native / Alaskan | 3 | 0.1% |
| White / Caucasian | 3,825 | 96.5% |
| Two or more Races | 97 | 2.5% |
| Some other Race | 0 | 0.0% |
| Total | 3,963 | 100.0% |
Ancestry in Oregon
The most populous ancestries reported in Oregon are German (1,061 | 26.8%), Swedish (411 | 10.4%), Irish (373 | 9.4%), Italian (295 | 7.4%), and Mexican (273 | 6.9%), together accounting for 60.9% of all Oregon residents.
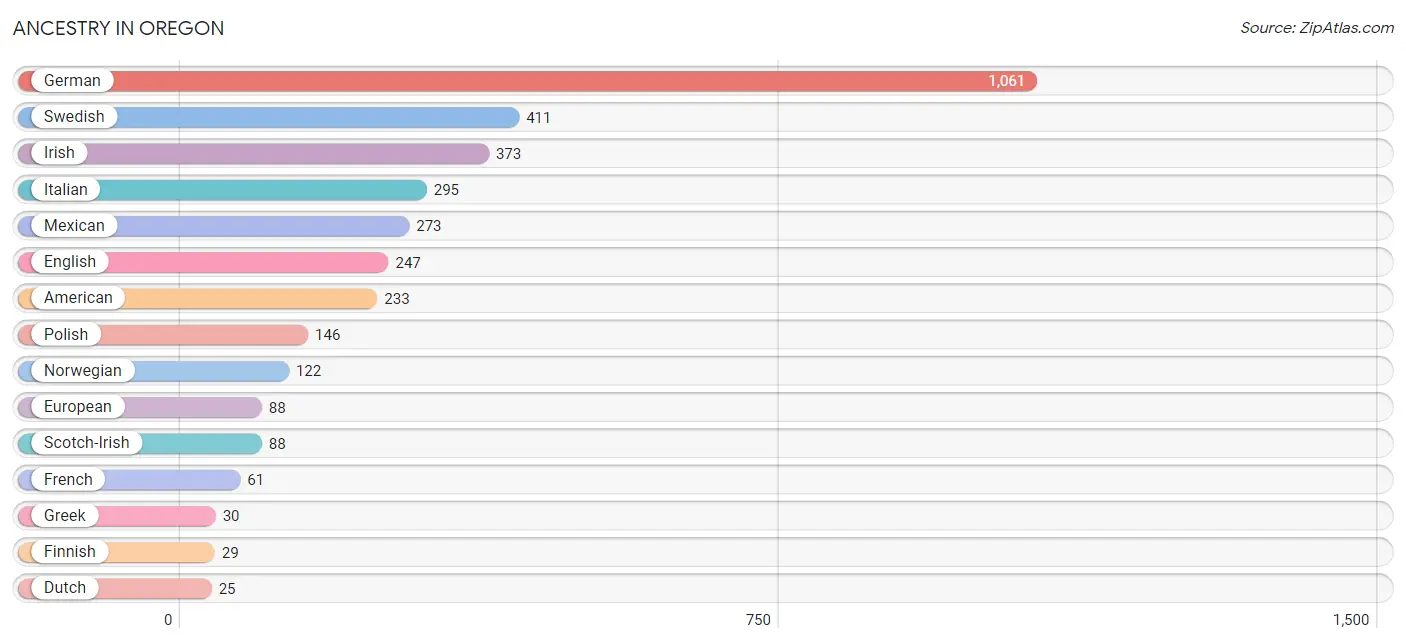
| Ancestry | # Population | % Population |
| American | 233 | 5.9% |
| Bhutanese | 15 | 0.4% |
| British | 6 | 0.2% |
| Chippewa | 3 | 0.1% |
| Dutch | 25 | 0.6% |
| English | 247 | 6.2% |
| European | 88 | 2.2% |
| Filipino | 4 | 0.1% |
| Finnish | 29 | 0.7% |
| French | 61 | 1.5% |
| French Canadian | 6 | 0.2% |
| German | 1,061 | 26.8% |
| Greek | 30 | 0.8% |
| Irish | 373 | 9.4% |
| Italian | 295 | 7.4% |
| Mexican | 273 | 6.9% |
| Norwegian | 122 | 3.1% |
| Polish | 146 | 3.7% |
| Portuguese | 13 | 0.3% |
| Scandinavian | 24 | 0.6% |
| Scotch-Irish | 88 | 2.2% |
| Scottish | 17 | 0.4% |
| Slovak | 13 | 0.3% |
| Spanish | 15 | 0.4% |
| Swedish | 411 | 10.4% |
| Welsh | 12 | 0.3% | View All 26 Rows |
Immigrants in Oregon
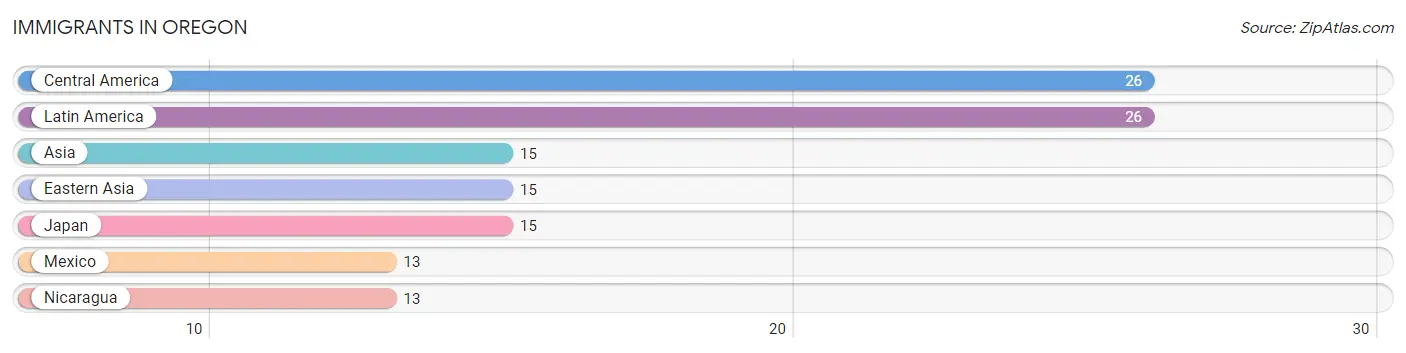
The most numerous immigrant groups reported in Oregon came from Central America (26 | 0.7%), Latin America (26 | 0.7%), Asia (15 | 0.4%), Eastern Asia (15 | 0.4%), and Japan (15 | 0.4%), together accounting for 2.5% of all Oregon residents.
| Immigration Origin | # Population | % Population |
| Asia | 15 | 0.4% |
| Central America | 26 | 0.7% |
| Eastern Asia | 15 | 0.4% |
| Japan | 15 | 0.4% |
| Latin America | 26 | 0.7% |
| Mexico | 13 | 0.3% |
| Nicaragua | 13 | 0.3% | View All 7 Rows |
Sex and Age in Oregon
Sex and Age in Oregon
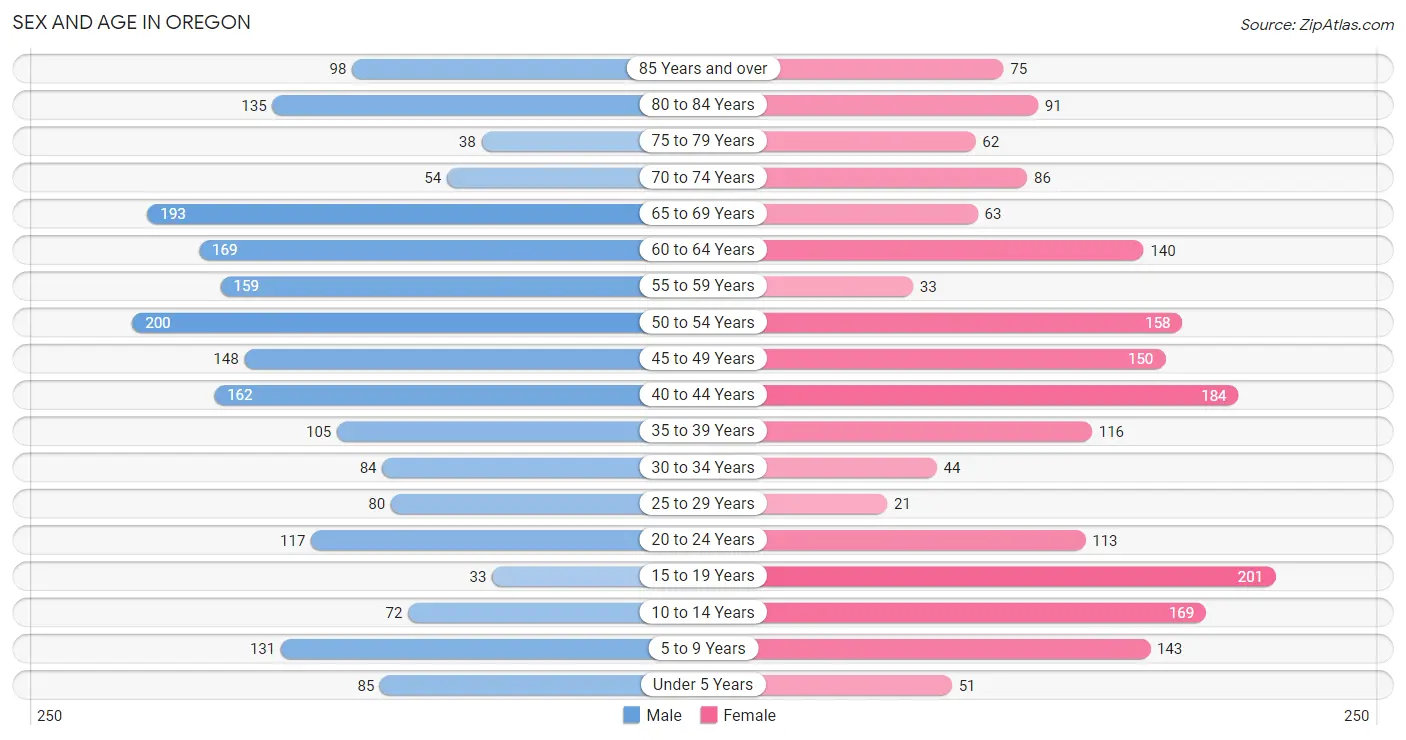
The most populous age groups in Oregon are 50 to 54 Years (200 | 9.7%) for men and 15 to 19 Years (201 | 10.6%) for women.
| Age Bracket | Male | Female |
| Under 5 Years | 85 (4.1%) | 51 (2.7%) |
| 5 to 9 Years | 131 (6.4%) | 143 (7.5%) |
| 10 to 14 Years | 72 (3.5%) | 169 (8.9%) |
| 15 to 19 Years | 33 (1.6%) | 201 (10.6%) |
| 20 to 24 Years | 117 (5.7%) | 113 (5.9%) |
| 25 to 29 Years | 80 (3.9%) | 21 (1.1%) |
| 30 to 34 Years | 84 (4.1%) | 44 (2.3%) |
| 35 to 39 Years | 105 (5.1%) | 116 (6.1%) |
| 40 to 44 Years | 162 (7.9%) | 184 (9.7%) |
| 45 to 49 Years | 148 (7.2%) | 150 (7.9%) |
| 50 to 54 Years | 200 (9.7%) | 158 (8.3%) |
| 55 to 59 Years | 159 (7.7%) | 33 (1.7%) |
| 60 to 64 Years | 169 (8.2%) | 140 (7.4%) |
| 65 to 69 Years | 193 (9.4%) | 63 (3.3%) |
| 70 to 74 Years | 54 (2.6%) | 86 (4.5%) |
| 75 to 79 Years | 38 (1.8%) | 62 (3.3%) |
| 80 to 84 Years | 135 (6.5%) | 91 (4.8%) |
| 85 Years and over | 98 (4.8%) | 75 (4.0%) |
| Total | 2,063 (100.0%) | 1,900 (100.0%) |
Families and Households in Oregon
Median Family Size in Oregon
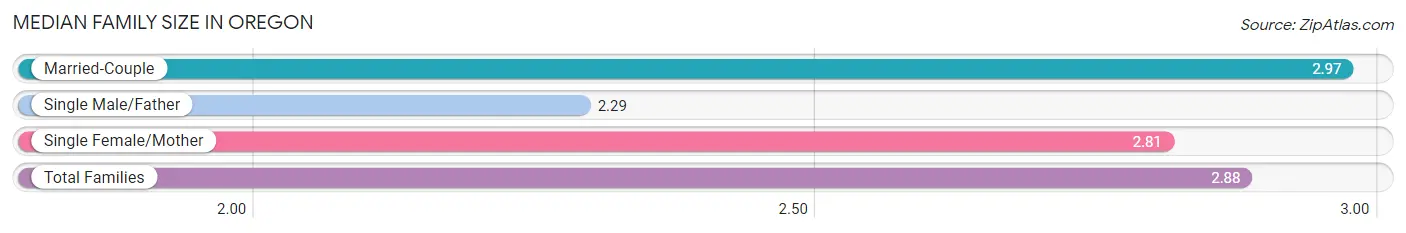
The median family size in Oregon is 2.88 persons per family, with married-couple families (782 | 77.4%) accounting for the largest median family size of 2.97 persons per family. On the other hand, single male/father families (115 | 11.4%) represent the smallest median family size with 2.29 persons per family.
| Family Type | # Families | Family Size |
| Married-Couple | 782 (77.4%) | 2.97 |
| Single Male/Father | 115 (11.4%) | 2.29 |
| Single Female/Mother | 113 (11.2%) | 2.81 |
| Total Families | 1,010 (100.0%) | 2.88 |
Median Household Size in Oregon
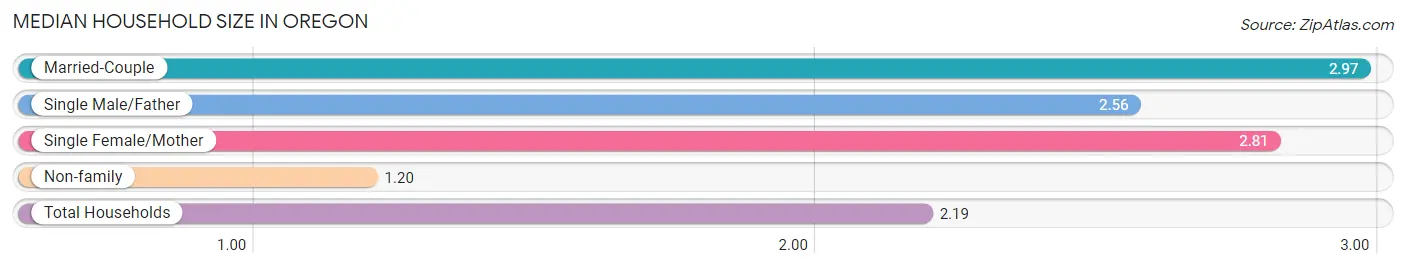
The median household size in Oregon is 2.19 persons per household, with married-couple households (782 | 44.7%) accounting for the largest median household size of 2.97 persons per household. non-family households (739 | 42.2%) represent the smallest median household size with 1.20 persons per household.
| Household Type | # Households | Household Size |
| Married-Couple | 782 (44.7%) | 2.97 |
| Single Male/Father | 115 (6.6%) | 2.56 |
| Single Female/Mother | 113 (6.5%) | 2.81 |
| Non-family | 739 (42.2%) | 1.20 |
| Total Households | 1,749 (100.0%) | 2.19 |
Household Size by Marriage Status in Oregon
Out of a total of 1,749 households in Oregon, 1,010 (57.8%) are family households, while 739 (42.2%) are nonfamily households. The most numerous type of family households are 2-person households, comprising 501, and the most common type of nonfamily households are 1-person households, comprising 646.
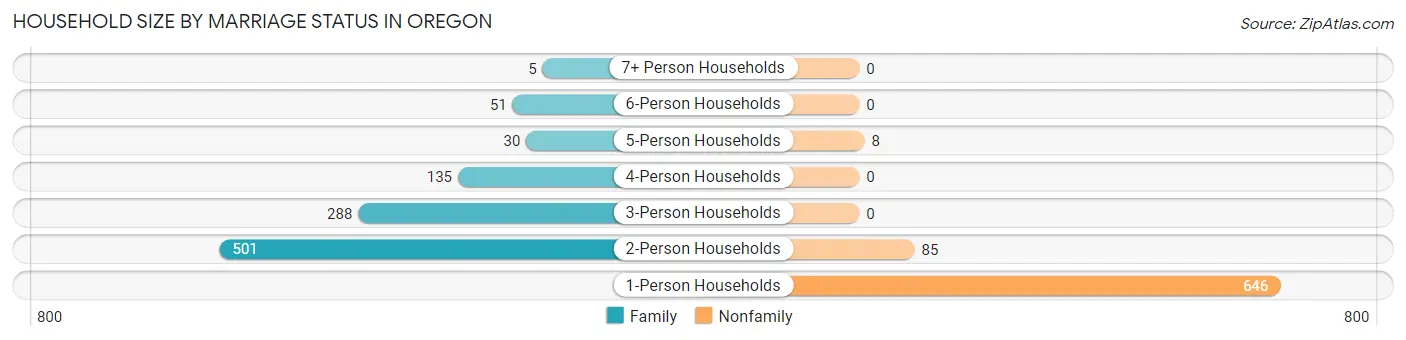
| Household Size | Family Households | Nonfamily Households |
| 1-Person Households | - | 646 (36.9%) |
| 2-Person Households | 501 (28.6%) | 85 (4.9%) |
| 3-Person Households | 288 (16.5%) | 0 (0.0%) |
| 4-Person Households | 135 (7.7%) | 0 (0.0%) |
| 5-Person Households | 30 (1.7%) | 8 (0.5%) |
| 6-Person Households | 51 (2.9%) | 0 (0.0%) |
| 7+ Person Households | 5 (0.3%) | 0 (0.0%) |
| Total | 1,010 (57.8%) | 739 (42.2%) |
Female Fertility in Oregon
Fertility by Age in Oregon
Average fertility rate in Oregon is 19.0 births per 1,000 women. Women in the age bracket of 20 to 34 years have the highest fertility rate with 62.0 births per 1,000 women. Women in the age bracket of 20 to 34 years acount for 68.8% of all women with births.
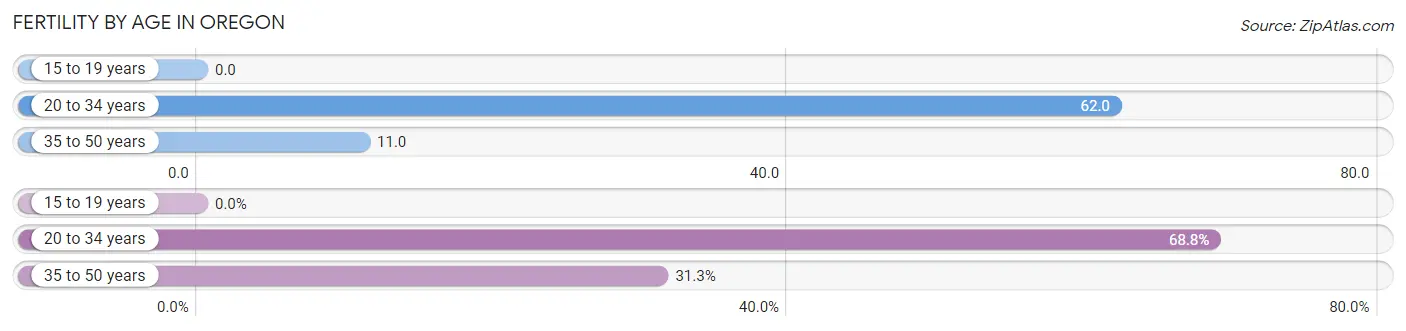
| Age Bracket | Women with Births | Births / 1,000 Women |
| 15 to 19 years | 0 (0.0%) | 0.0 |
| 20 to 34 years | 11 (68.8%) | 62.0 |
| 35 to 50 years | 5 (31.2%) | 11.0 |
| Total | 16 (100.0%) | 19.0 |
Fertility by Age by Marriage Status in Oregon
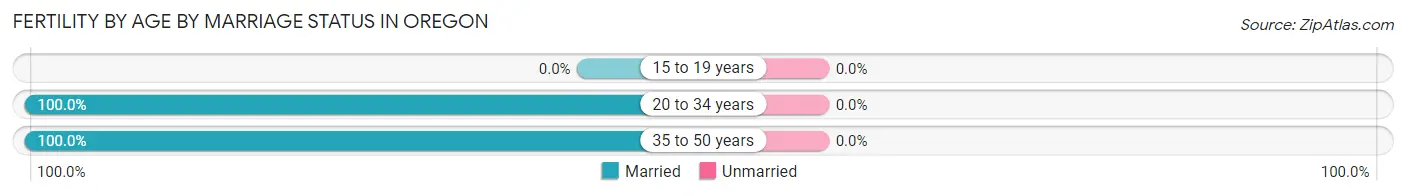
| Age Bracket | Married | Unmarried |
| 15 to 19 years | 0 (0.0%) | 0 (0.0%) |
| 20 to 34 years | 11 (100.0%) | 0 (0.0%) |
| 35 to 50 years | 5 (100.0%) | 0 (0.0%) |
| Total | 16 (100.0%) | 0 (0.0%) |
Fertility by Education in Oregon
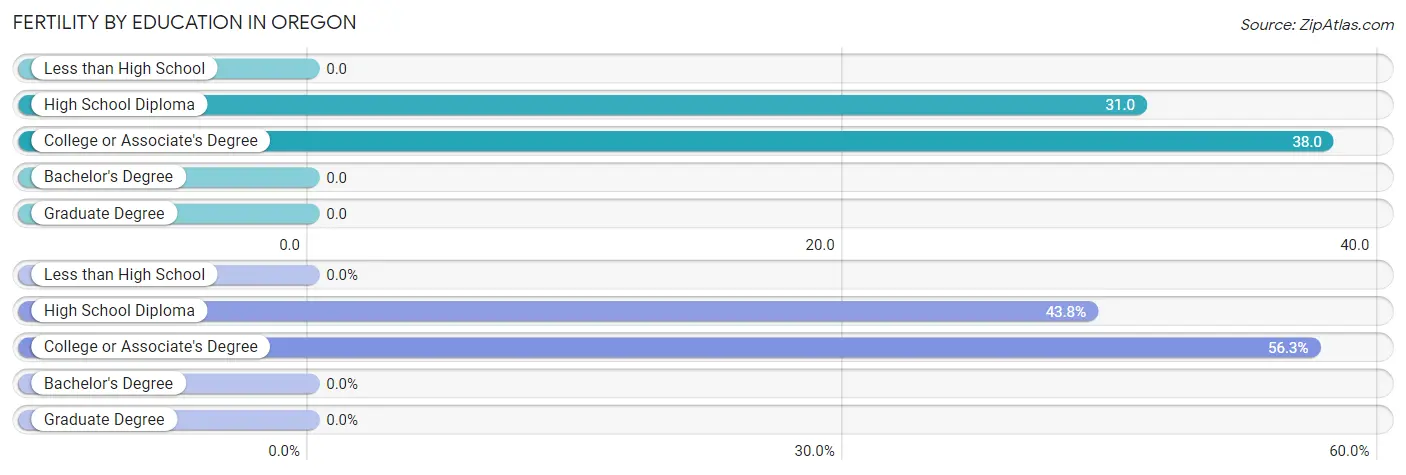
| Educational Attainment | Women with Births | Births / 1,000 Women |
| Less than High School | 0 (0.0%) | 0.0 |
| High School Diploma | 7 (43.8%) | 31.0 |
| College or Associate's Degree | 9 (56.2%) | 38.0 |
| Bachelor's Degree | 0 (0.0%) | 0.0 |
| Graduate Degree | 0 (0.0%) | 0.0 |
| Total | 16 (100.0%) | 19.0 |
Fertility by Education by Marriage Status in Oregon
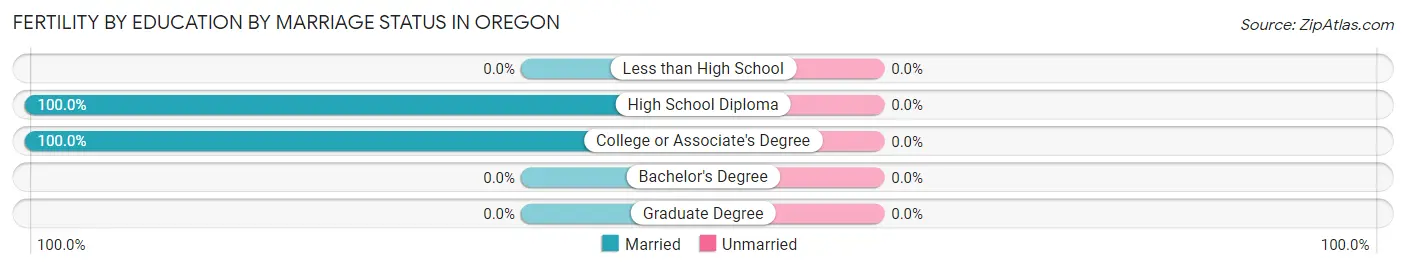
| Educational Attainment | Married | Unmarried |
| Less than High School | 0 (0.0%) | 0 (0.0%) |
| High School Diploma | 7 (100.0%) | 0 (0.0%) |
| College or Associate's Degree | 9 (100.0%) | 0 (0.0%) |
| Bachelor's Degree | 0 (0.0%) | 0 (0.0%) |
| Graduate Degree | 0 (0.0%) | 0 (0.0%) |
| Total | 16 (100.0%) | 0 (0.0%) |
Employment Characteristics in Oregon
Employment by Class of Employer in Oregon
Among the 1,529 employed individuals in Oregon, private company employees (1,076 | 70.4%), not-for-profit organizations (158 | 10.3%), and state government employees (137 | 9.0%) make up the most common classes of employment.
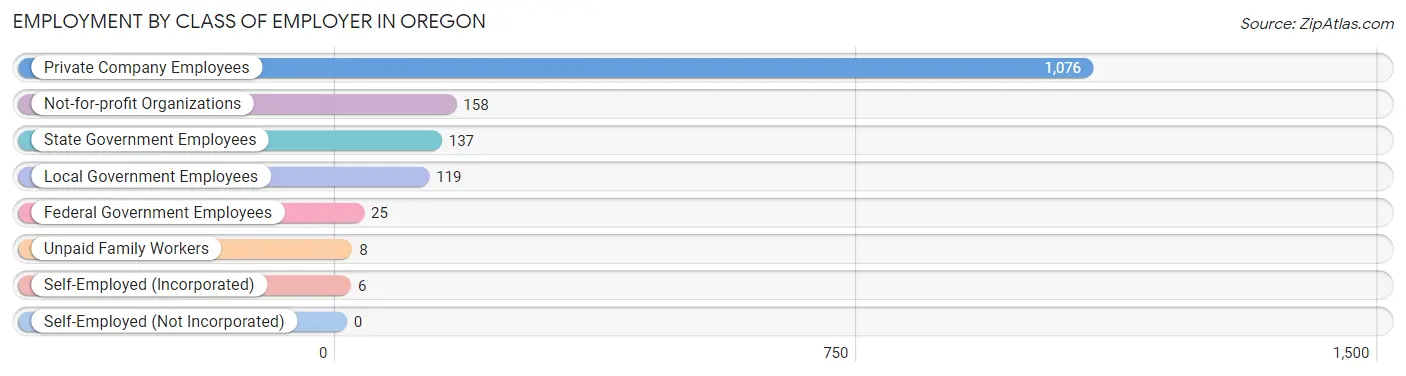
| Employer Class | # Employees | % Employees |
| Private Company Employees | 1,076 | 70.4% |
| Self-Employed (Incorporated) | 6 | 0.4% |
| Self-Employed (Not Incorporated) | 0 | 0.0% |
| Not-for-profit Organizations | 158 | 10.3% |
| Local Government Employees | 119 | 7.8% |
| State Government Employees | 137 | 9.0% |
| Federal Government Employees | 25 | 1.6% |
| Unpaid Family Workers | 8 | 0.5% |
| Total | 1,529 | 100.0% |
Employment Status by Age in Oregon
According to the labor force statistics for Oregon, out of the total population over 16 years of age (3,251), 50.8% or 1,652 individuals are in the labor force, with 5.0% or 83 of them unemployed. The age group with the highest labor force participation rate is 20 to 24 years, with 97.0% or 223 individuals in the labor force. Within the labor force, the 55 to 59 years age range has the highest percentage of unemployed individuals, with 33.1% or 42 of them being unemployed.
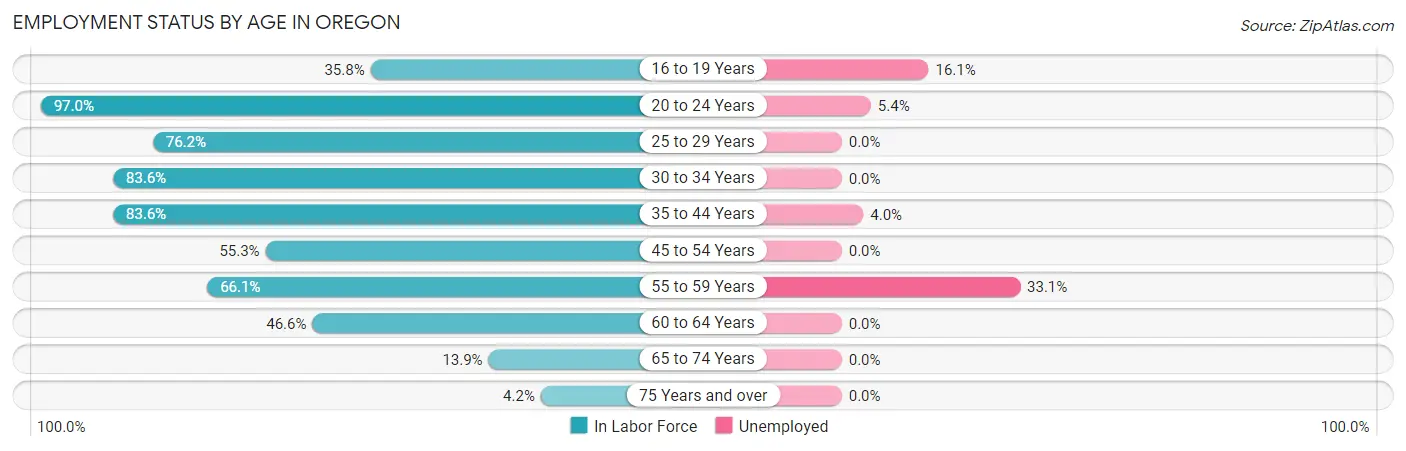
| Age Bracket | In Labor Force | Unemployed |
| 16 to 19 Years | 62 (35.8%) | 10 (16.1%) |
| 20 to 24 Years | 223 (97.0%) | 12 (5.4%) |
| 25 to 29 Years | 77 (76.2%) | 0 (0.0%) |
| 30 to 34 Years | 107 (83.6%) | 0 (0.0%) |
| 35 to 44 Years | 474 (83.6%) | 19 (4.0%) |
| 45 to 54 Years | 363 (55.3%) | 0 (0.0%) |
| 55 to 59 Years | 127 (66.1%) | 42 (33.1%) |
| 60 to 64 Years | 144 (46.6%) | 0 (0.0%) |
| 65 to 74 Years | 55 (13.9%) | 0 (0.0%) |
| 75 Years and over | 21 (4.2%) | 0 (0.0%) |
| Total | 1,652 (50.8%) | 83 (5.0%) |
Employment Status by Educational Attainment in Oregon
According to labor force statistics for Oregon, 66.2% of individuals (1,293) out of the total population between 25 and 64 years of age (1,953) are in the labor force, with 4.7% or 61 of them being unemployed. The group with the highest labor force participation rate are those with the educational attainment of bachelor's degree or higher, with 82.4% or 314 individuals in the labor force. Within the labor force, individuals with less than high school education have the highest percentage of unemployment, with 25.0% or 14 of them being unemployed.
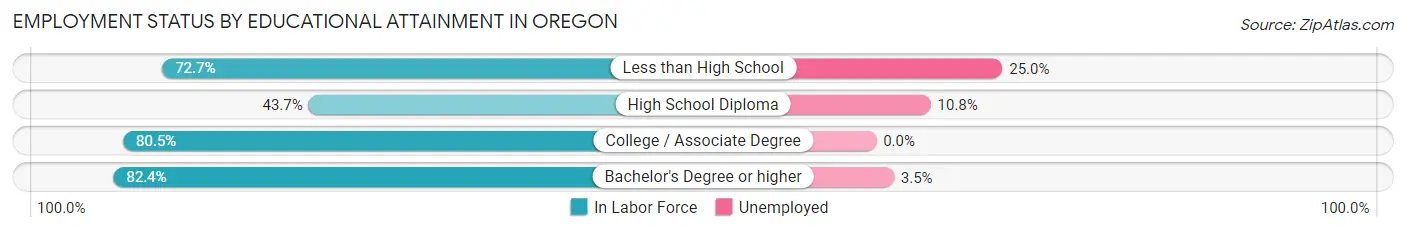
| Educational Attainment | In Labor Force | Unemployed |
| Less than High School | 56 (72.7%) | 19 (25.0%) |
| High School Diploma | 334 (43.7%) | 83 (10.8%) |
| College / Associate Degree | 588 (80.5%) | 0 (0.0%) |
| Bachelor's Degree or higher | 314 (82.4%) | 13 (3.5%) |
| Total | 1,293 (66.2%) | 92 (4.7%) |
Employment Occupations by Sex in Oregon
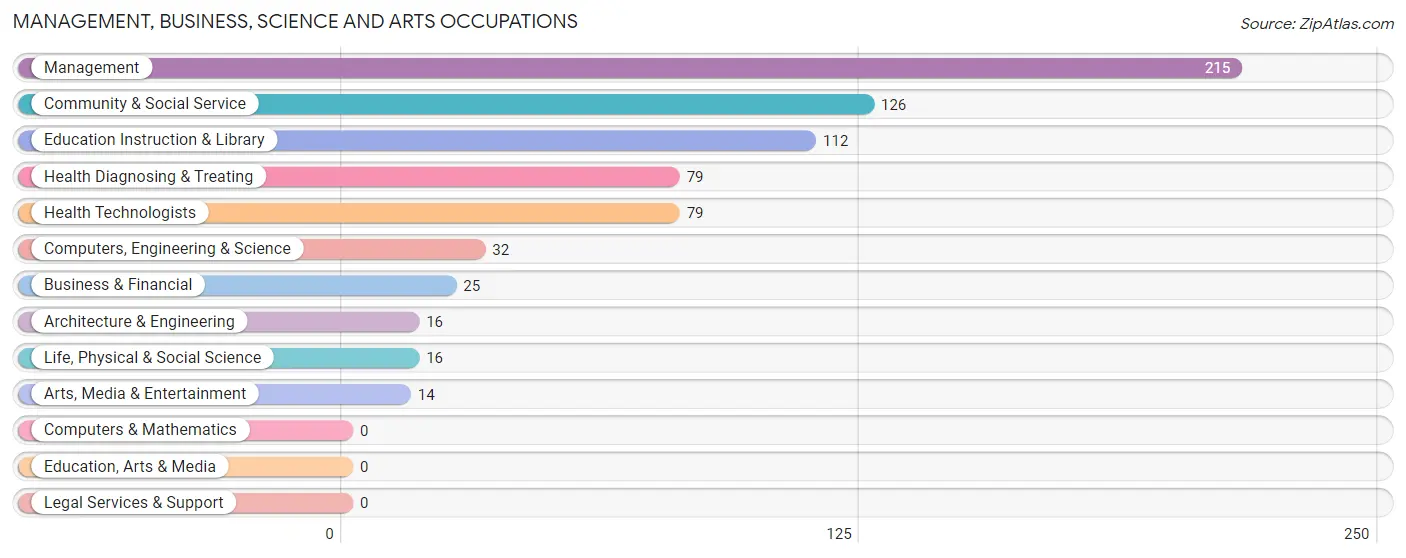
Management, Business, Science and Arts Occupations
The most common Management, Business, Science and Arts occupations in Oregon are Management (215 | 13.7%), Community & Social Service (126 | 8.0%), Education Instruction & Library (112 | 7.1%), Health Diagnosing & Treating (79 | 5.0%), and Health Technologists (79 | 5.0%).
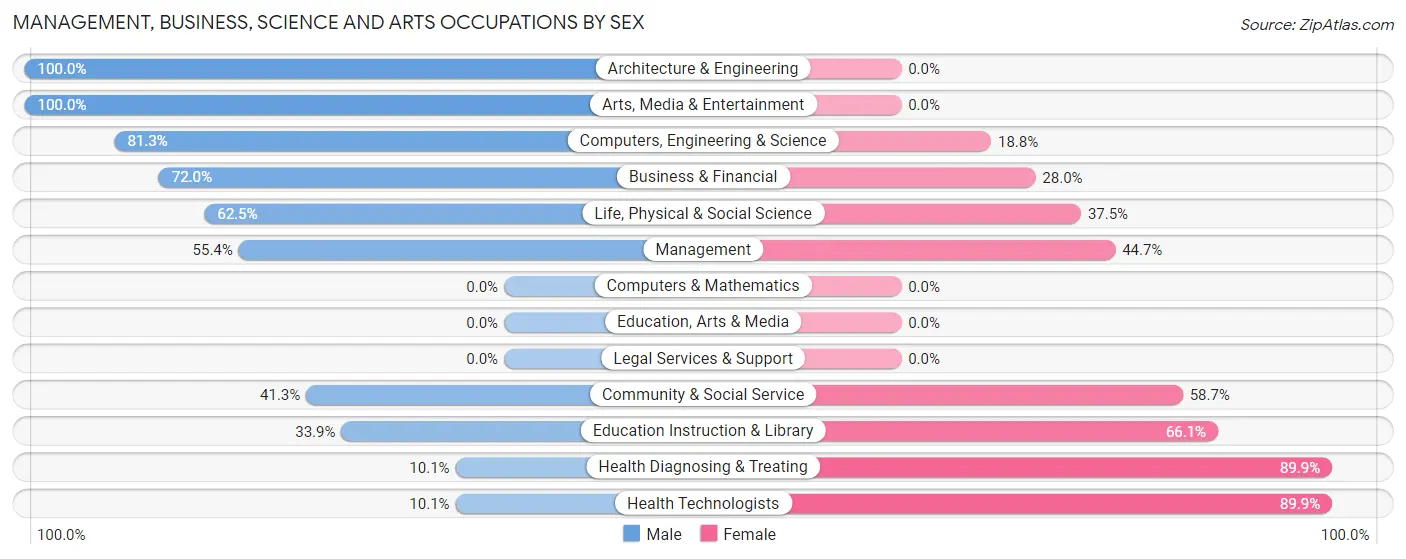
Management, Business, Science and Arts Occupations by Sex
Within the Management, Business, Science and Arts occupations in Oregon, the most male-oriented occupations are Architecture & Engineering (100.0%), Arts, Media & Entertainment (100.0%), and Computers, Engineering & Science (81.2%), while the most female-oriented occupations are Health Diagnosing & Treating (89.9%), Health Technologists (89.9%), and Education Instruction & Library (66.1%).
| Occupation | Male | Female |
| Management | 119 (55.3%) | 96 (44.7%) |
| Business & Financial | 18 (72.0%) | 7 (28.0%) |
| Computers, Engineering & Science | 26 (81.2%) | 6 (18.8%) |
| Computers & Mathematics | 0 (0.0%) | 0 (0.0%) |
| Architecture & Engineering | 16 (100.0%) | 0 (0.0%) |
| Life, Physical & Social Science | 10 (62.5%) | 6 (37.5%) |
| Community & Social Service | 52 (41.3%) | 74 (58.7%) |
| Education, Arts & Media | 0 (0.0%) | 0 (0.0%) |
| Legal Services & Support | 0 (0.0%) | 0 (0.0%) |
| Education Instruction & Library | 38 (33.9%) | 74 (66.1%) |
| Arts, Media & Entertainment | 14 (100.0%) | 0 (0.0%) |
| Health Diagnosing & Treating | 8 (10.1%) | 71 (89.9%) |
| Health Technologists | 8 (10.1%) | 71 (89.9%) |
| Total (Category) | 223 (46.8%) | 254 (53.2%) |
| Total (Overall) | 883 (56.2%) | 687 (43.8%) |
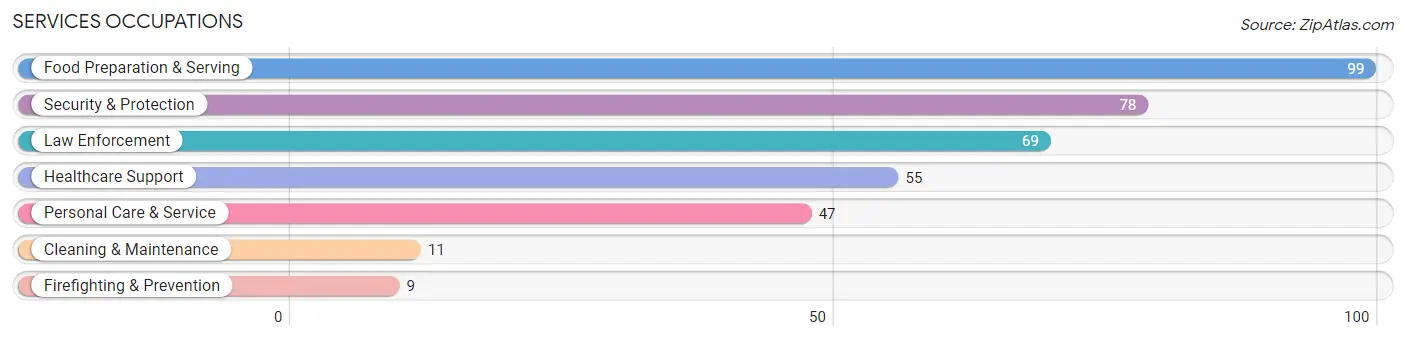
Services Occupations
The most common Services occupations in Oregon are Food Preparation & Serving (99 | 6.3%), Security & Protection (78 | 5.0%), Law Enforcement (69 | 4.4%), Healthcare Support (55 | 3.5%), and Personal Care & Service (47 | 3.0%).
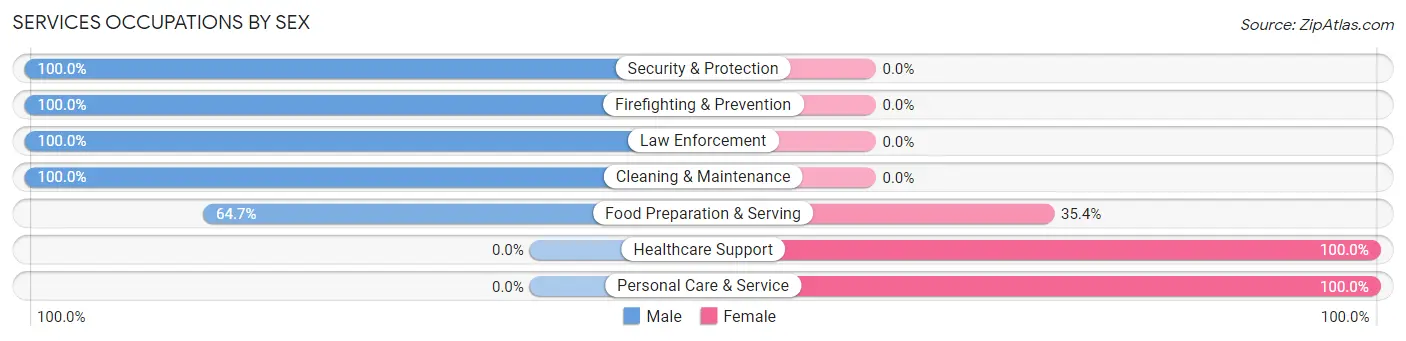
Services Occupations by Sex
Within the Services occupations in Oregon, the most male-oriented occupations are Security & Protection (100.0%), Firefighting & Prevention (100.0%), and Law Enforcement (100.0%), while the most female-oriented occupations are Healthcare Support (100.0%), Personal Care & Service (100.0%), and Food Preparation & Serving (35.3%).
| Occupation | Male | Female |
| Healthcare Support | 0 (0.0%) | 55 (100.0%) |
| Security & Protection | 78 (100.0%) | 0 (0.0%) |
| Firefighting & Prevention | 9 (100.0%) | 0 (0.0%) |
| Law Enforcement | 69 (100.0%) | 0 (0.0%) |
| Food Preparation & Serving | 64 (64.6%) | 35 (35.3%) |
| Cleaning & Maintenance | 11 (100.0%) | 0 (0.0%) |
| Personal Care & Service | 0 (0.0%) | 47 (100.0%) |
| Total (Category) | 153 (52.8%) | 137 (47.2%) |
| Total (Overall) | 883 (56.2%) | 687 (43.8%) |
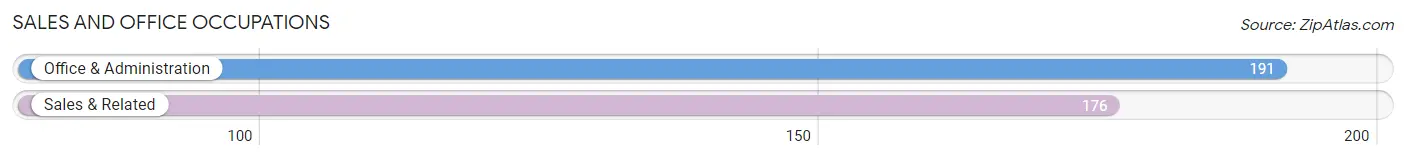
Sales and Office Occupations
The most common Sales and Office occupations in Oregon are Office & Administration (191 | 12.2%), and Sales & Related (176 | 11.2%).
Sales and Office Occupations by Sex
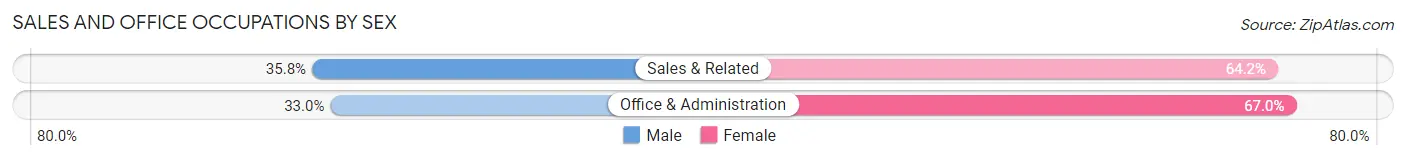
| Occupation | Male | Female |
| Sales & Related | 63 (35.8%) | 113 (64.2%) |
| Office & Administration | 63 (33.0%) | 128 (67.0%) |
| Total (Category) | 126 (34.3%) | 241 (65.7%) |
| Total (Overall) | 883 (56.2%) | 687 (43.8%) |
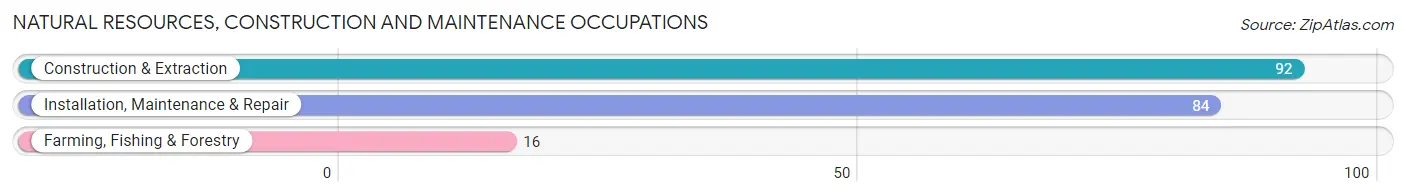
Natural Resources, Construction and Maintenance Occupations
The most common Natural Resources, Construction and Maintenance occupations in Oregon are Construction & Extraction (92 | 5.9%), Installation, Maintenance & Repair (84 | 5.3%), and Farming, Fishing & Forestry (16 | 1.0%).
Natural Resources, Construction and Maintenance Occupations by Sex
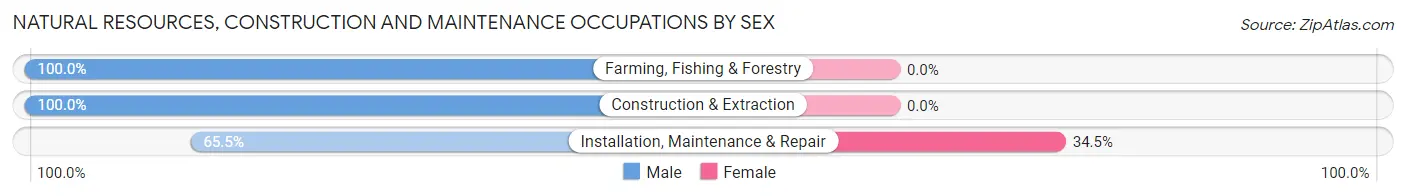
| Occupation | Male | Female |
| Farming, Fishing & Forestry | 16 (100.0%) | 0 (0.0%) |
| Construction & Extraction | 92 (100.0%) | 0 (0.0%) |
| Installation, Maintenance & Repair | 55 (65.5%) | 29 (34.5%) |
| Total (Category) | 163 (84.9%) | 29 (15.1%) |
| Total (Overall) | 883 (56.2%) | 687 (43.8%) |
Production, Transportation and Moving Occupations
The most common Production, Transportation and Moving occupations in Oregon are Production (110 | 7.0%), Transportation (104 | 6.6%), and Material Moving (30 | 1.9%).
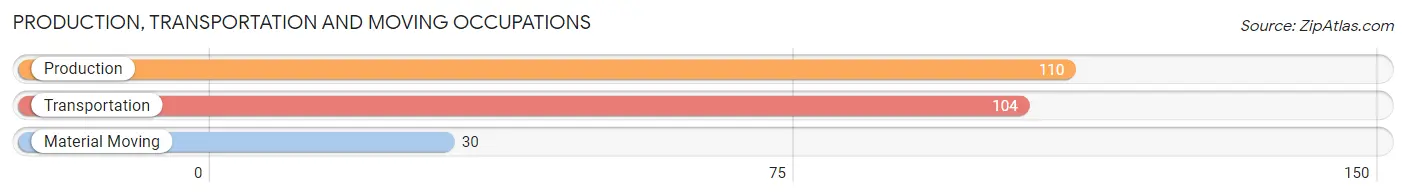
Production, Transportation and Moving Occupations by Sex
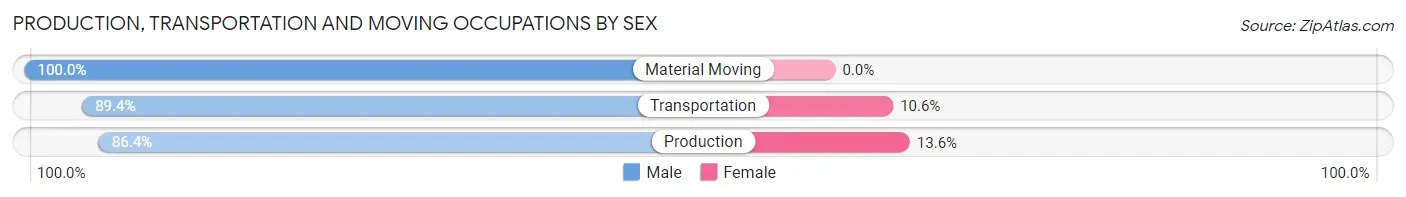
| Occupation | Male | Female |
| Production | 95 (86.4%) | 15 (13.6%) |
| Transportation | 93 (89.4%) | 11 (10.6%) |
| Material Moving | 30 (100.0%) | 0 (0.0%) |
| Total (Category) | 218 (89.3%) | 26 (10.7%) |
| Total (Overall) | 883 (56.2%) | 687 (43.8%) |
Employment Industries by Sex in Oregon
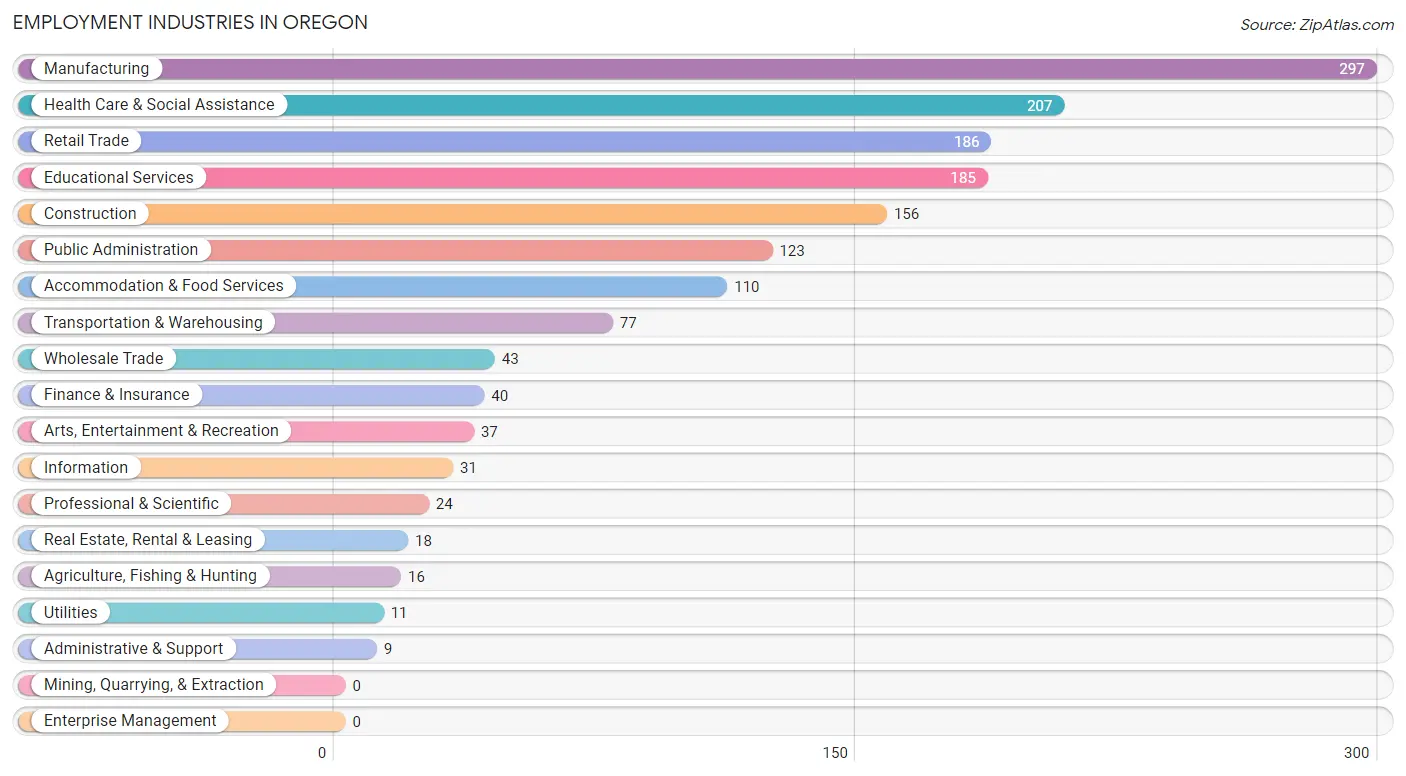
Employment Industries in Oregon
The major employment industries in Oregon include Manufacturing (297 | 18.9%), Health Care & Social Assistance (207 | 13.2%), Retail Trade (186 | 11.8%), Educational Services (185 | 11.8%), and Construction (156 | 9.9%).
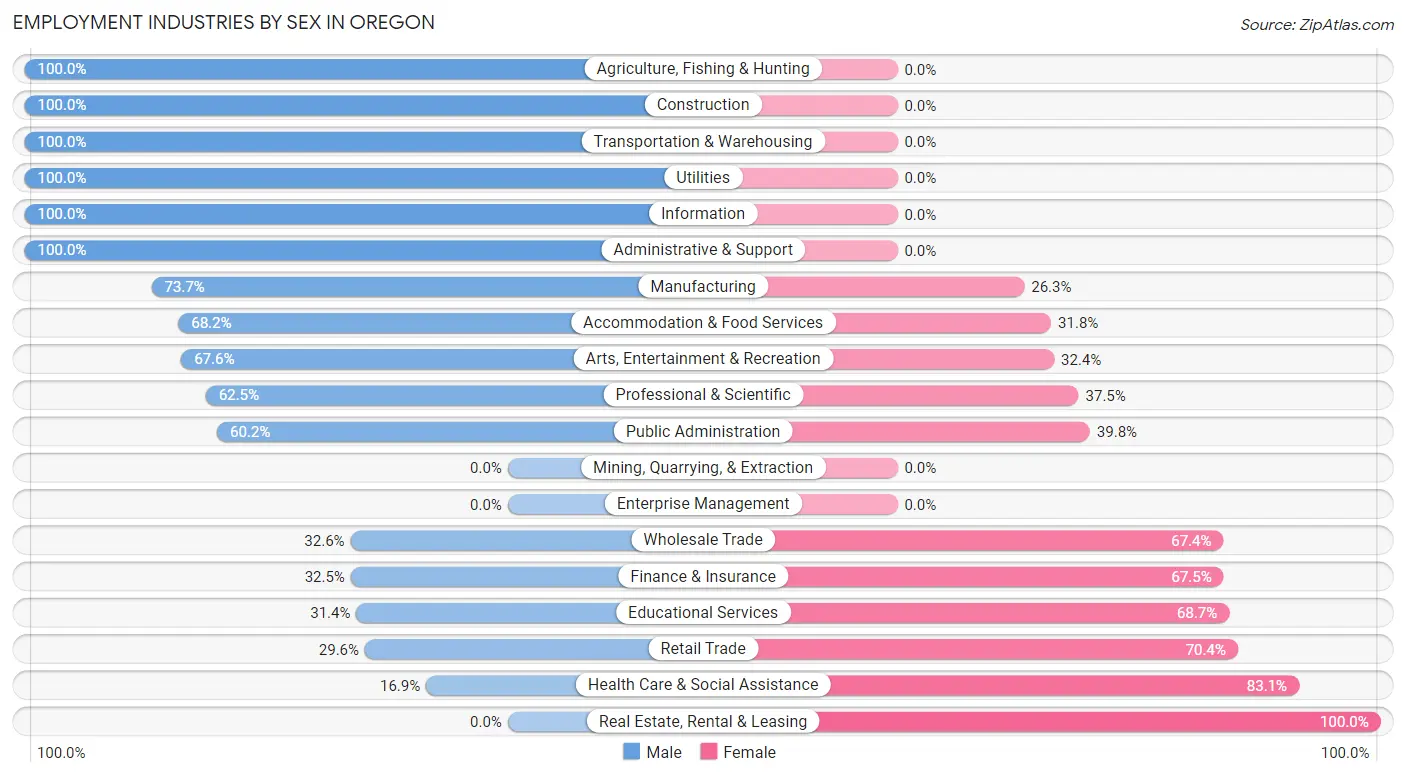
Employment Industries by Sex in Oregon
The Oregon industries that see more men than women are Agriculture, Fishing & Hunting (100.0%), Construction (100.0%), and Transportation & Warehousing (100.0%), whereas the industries that tend to have a higher number of women are Real Estate, Rental & Leasing (100.0%), Health Care & Social Assistance (83.1%), and Retail Trade (70.4%).
| Industry | Male | Female |
| Agriculture, Fishing & Hunting | 16 (100.0%) | 0 (0.0%) |
| Mining, Quarrying, & Extraction | 0 (0.0%) | 0 (0.0%) |
| Construction | 156 (100.0%) | 0 (0.0%) |
| Manufacturing | 219 (73.7%) | 78 (26.3%) |
| Wholesale Trade | 14 (32.6%) | 29 (67.4%) |
| Retail Trade | 55 (29.6%) | 131 (70.4%) |
| Transportation & Warehousing | 77 (100.0%) | 0 (0.0%) |
| Utilities | 11 (100.0%) | 0 (0.0%) |
| Information | 31 (100.0%) | 0 (0.0%) |
| Finance & Insurance | 13 (32.5%) | 27 (67.5%) |
| Real Estate, Rental & Leasing | 0 (0.0%) | 18 (100.0%) |
| Professional & Scientific | 15 (62.5%) | 9 (37.5%) |
| Enterprise Management | 0 (0.0%) | 0 (0.0%) |
| Administrative & Support | 9 (100.0%) | 0 (0.0%) |
| Educational Services | 58 (31.4%) | 127 (68.6%) |
| Health Care & Social Assistance | 35 (16.9%) | 172 (83.1%) |
| Arts, Entertainment & Recreation | 25 (67.6%) | 12 (32.4%) |
| Accommodation & Food Services | 75 (68.2%) | 35 (31.8%) |
| Public Administration | 74 (60.2%) | 49 (39.8%) |
| Total | 883 (56.2%) | 687 (43.8%) |
Education in Oregon
School Enrollment in Oregon
The most common levels of schooling among the 986 students in Oregon are high school (253 | 25.7%), middle school (205 | 20.8%), and elementary school (181 | 18.4%).
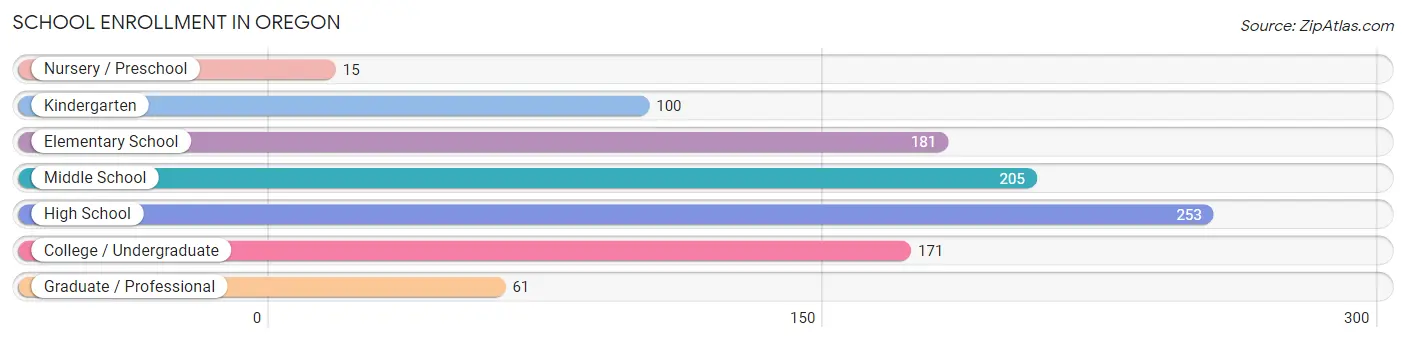
| School Level | # Students | % Students |
| Nursery / Preschool | 15 | 1.5% |
| Kindergarten | 100 | 10.1% |
| Elementary School | 181 | 18.4% |
| Middle School | 205 | 20.8% |
| High School | 253 | 25.7% |
| College / Undergraduate | 171 | 17.3% |
| Graduate / Professional | 61 | 6.2% |
| Total | 986 | 100.0% |
School Enrollment by Age by Funding Source in Oregon
Out of a total of 986 students who are enrolled in schools in Oregon, 66 (6.7%) attend a private institution, while the remaining 920 (93.3%) are enrolled in public schools. The age group of 35 years and over has the highest likelihood of being enrolled in private schools, with 22 (19.6% in the age bracket) enrolled. Conversely, the age group of 3 to 4 year olds has the lowest likelihood of being enrolled in a private school, with 15 (100.0% in the age bracket) attending a public institution.
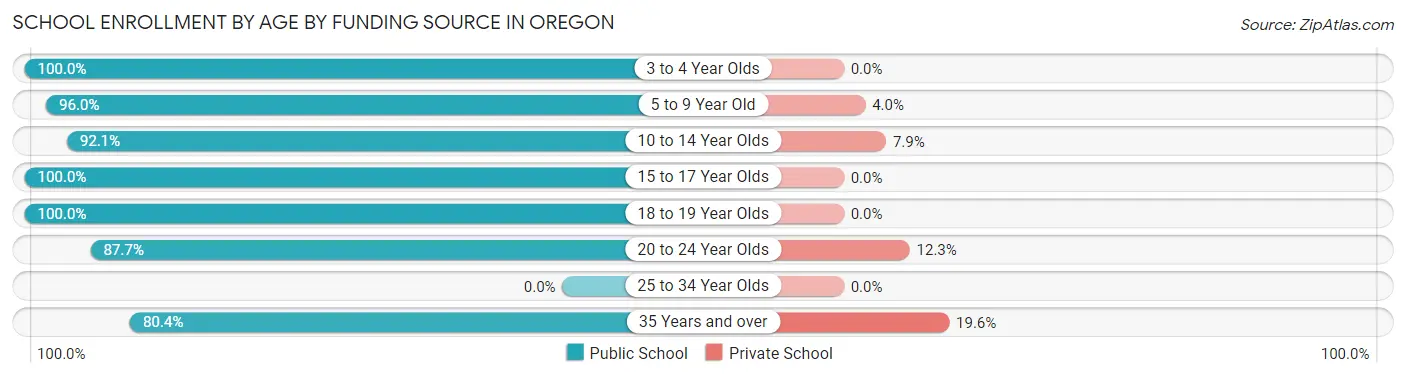
| Age Bracket | Public School | Private School |
| 3 to 4 Year Olds | 15 (100.0%) | 0 (0.0%) |
| 5 to 9 Year Old | 263 (96.0%) | 11 (4.0%) |
| 10 to 14 Year Olds | 222 (92.1%) | 19 (7.9%) |
| 15 to 17 Year Olds | 206 (100.0%) | 0 (0.0%) |
| 18 to 19 Year Olds | 24 (100.0%) | 0 (0.0%) |
| 20 to 24 Year Olds | 100 (87.7%) | 14 (12.3%) |
| 25 to 34 Year Olds | 0 (0.0%) | 0 (0.0%) |
| 35 Years and over | 90 (80.4%) | 22 (19.6%) |
| Total | 920 (93.3%) | 66 (6.7%) |
Educational Attainment by Field of Study in Oregon
Business (123 | 19.9%), science & technology (114 | 18.4%), education (74 | 12.0%), arts & humanities (57 | 9.2%), and bio, nature & agricultural (46 | 7.4%) are the most common fields of study among 618 individuals in Oregon who have obtained a bachelor's degree or higher.
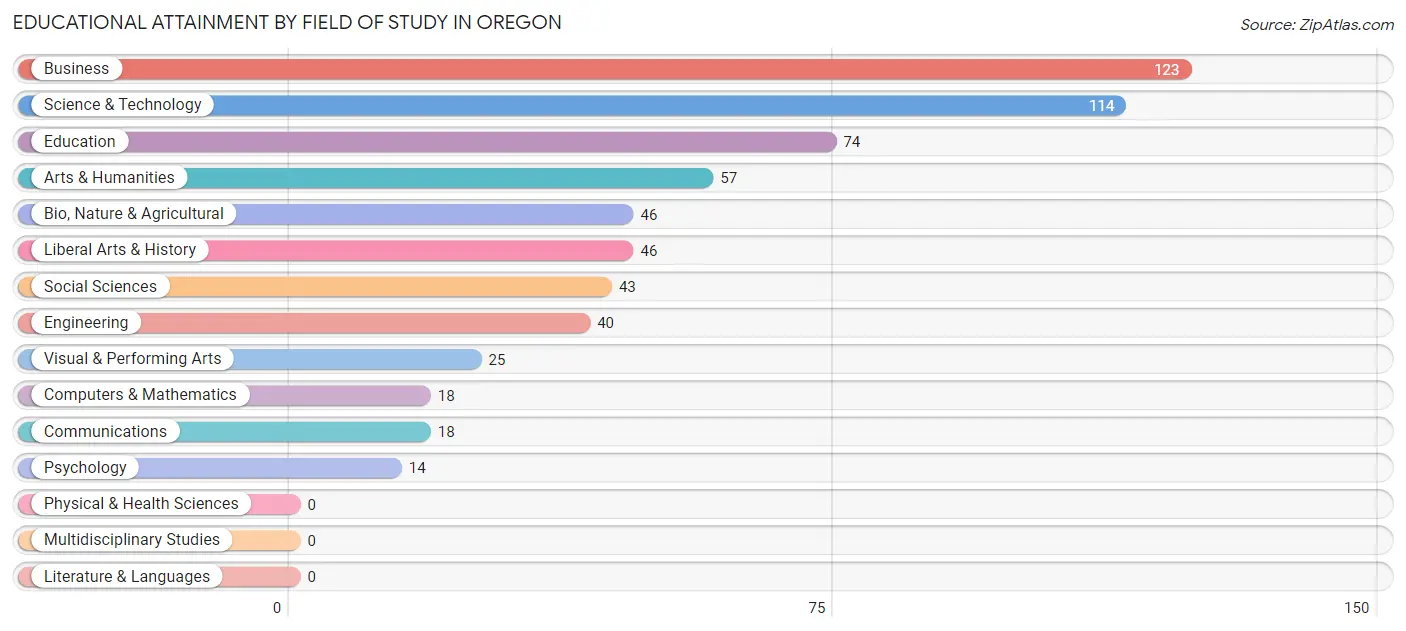
| Field of Study | # Graduates | % Graduates |
| Computers & Mathematics | 18 | 2.9% |
| Bio, Nature & Agricultural | 46 | 7.4% |
| Physical & Health Sciences | 0 | 0.0% |
| Psychology | 14 | 2.3% |
| Social Sciences | 43 | 7.0% |
| Engineering | 40 | 6.5% |
| Multidisciplinary Studies | 0 | 0.0% |
| Science & Technology | 114 | 18.4% |
| Business | 123 | 19.9% |
| Education | 74 | 12.0% |
| Literature & Languages | 0 | 0.0% |
| Liberal Arts & History | 46 | 7.4% |
| Visual & Performing Arts | 25 | 4.1% |
| Communications | 18 | 2.9% |
| Arts & Humanities | 57 | 9.2% |
| Total | 618 | 100.0% |
Transportation & Commute in Oregon
Vehicle Availability by Sex in Oregon
The most prevalent vehicle ownership categories in Oregon are males with 2 vehicles (396, accounting for 46.8%) and females with 2 vehicles (382, making up 58.5%).
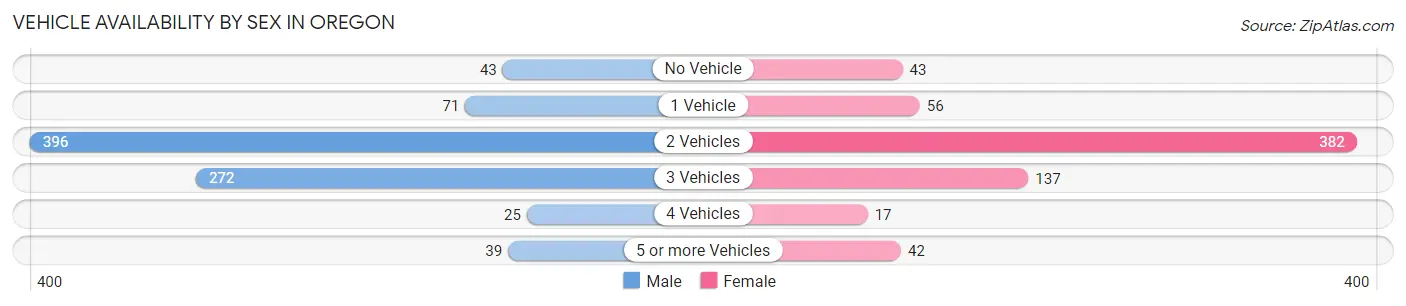
| Vehicles Available | Male | Female |
| No Vehicle | 43 (5.1%) | 43 (6.4%) |
| 1 Vehicle | 71 (8.4%) | 56 (8.3%) |
| 2 Vehicles | 396 (46.8%) | 382 (56.4%) |
| 3 Vehicles | 272 (32.2%) | 137 (20.2%) |
| 4 Vehicles | 25 (3.0%) | 17 (2.5%) |
| 5 or more Vehicles | 39 (4.6%) | 42 (6.2%) |
| Total | 846 (100.0%) | 677 (100.0%) |
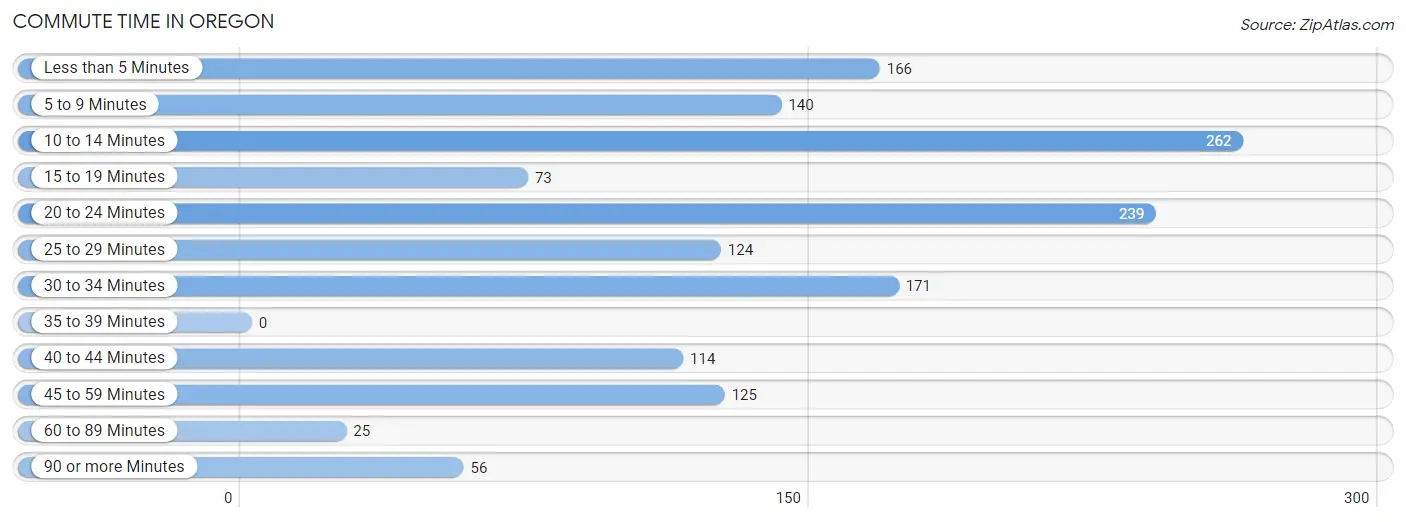
Commute Time in Oregon
The most frequently occuring commute durations in Oregon are 10 to 14 minutes (262 commuters, 17.5%), 20 to 24 minutes (239 commuters, 16.0%), and 30 to 34 minutes (171 commuters, 11.4%).
| Commute Time | # Commuters | % Commuters |
| Less than 5 Minutes | 166 | 11.1% |
| 5 to 9 Minutes | 140 | 9.4% |
| 10 to 14 Minutes | 262 | 17.5% |
| 15 to 19 Minutes | 73 | 4.9% |
| 20 to 24 Minutes | 239 | 16.0% |
| 25 to 29 Minutes | 124 | 8.3% |
| 30 to 34 Minutes | 171 | 11.4% |
| 35 to 39 Minutes | 0 | 0.0% |
| 40 to 44 Minutes | 114 | 7.6% |
| 45 to 59 Minutes | 125 | 8.4% |
| 60 to 89 Minutes | 25 | 1.7% |
| 90 or more Minutes | 56 | 3.7% |
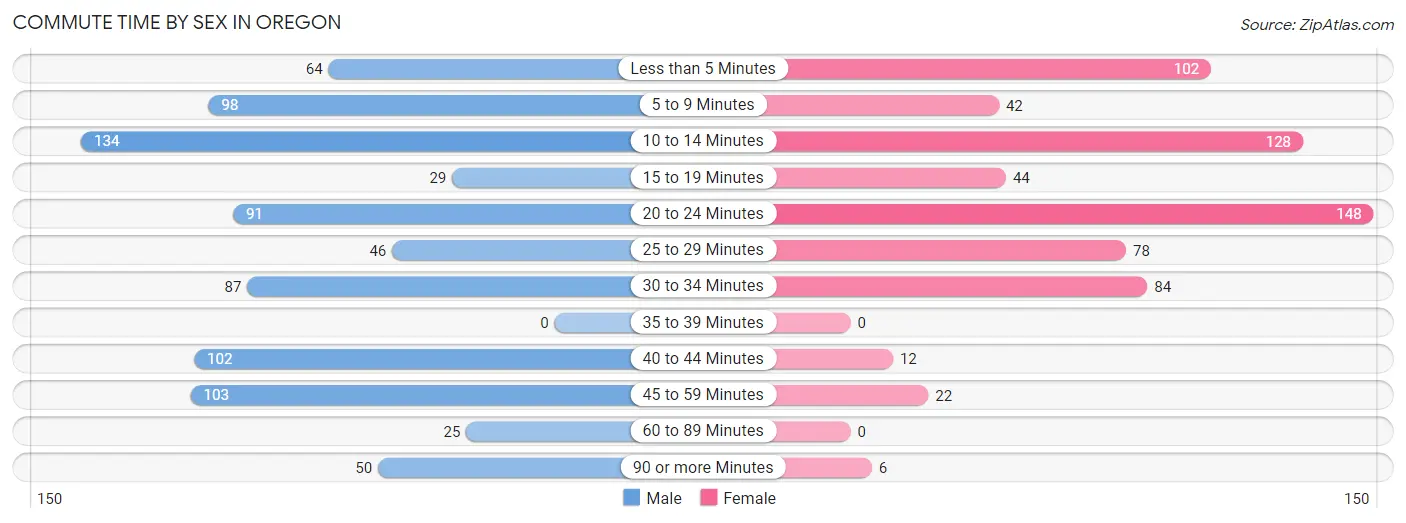
Commute Time by Sex in Oregon
The most common commute times in Oregon are 10 to 14 minutes (134 commuters, 16.2%) for males and 20 to 24 minutes (148 commuters, 22.2%) for females.
| Commute Time | Male | Female |
| Less than 5 Minutes | 64 (7.7%) | 102 (15.3%) |
| 5 to 9 Minutes | 98 (11.8%) | 42 (6.3%) |
| 10 to 14 Minutes | 134 (16.2%) | 128 (19.2%) |
| 15 to 19 Minutes | 29 (3.5%) | 44 (6.6%) |
| 20 to 24 Minutes | 91 (11.0%) | 148 (22.2%) |
| 25 to 29 Minutes | 46 (5.6%) | 78 (11.7%) |
| 30 to 34 Minutes | 87 (10.5%) | 84 (12.6%) |
| 35 to 39 Minutes | 0 (0.0%) | 0 (0.0%) |
| 40 to 44 Minutes | 102 (12.3%) | 12 (1.8%) |
| 45 to 59 Minutes | 103 (12.4%) | 22 (3.3%) |
| 60 to 89 Minutes | 25 (3.0%) | 0 (0.0%) |
| 90 or more Minutes | 50 (6.0%) | 6 (0.9%) |
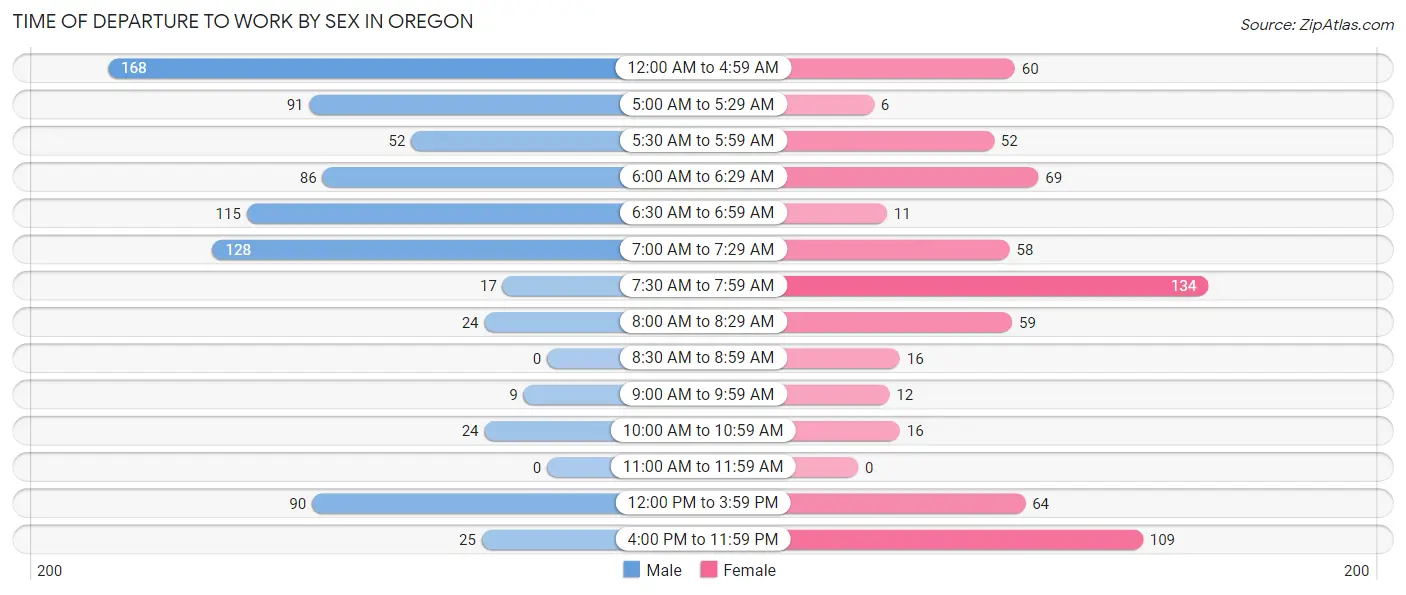
Time of Departure to Work by Sex in Oregon
The most frequent times of departure to work in Oregon are 12:00 AM to 4:59 AM (168, 20.3%) for males and 7:30 AM to 7:59 AM (134, 20.1%) for females.
| Time of Departure | Male | Female |
| 12:00 AM to 4:59 AM | 168 (20.3%) | 60 (9.0%) |
| 5:00 AM to 5:29 AM | 91 (11.0%) | 6 (0.9%) |
| 5:30 AM to 5:59 AM | 52 (6.3%) | 52 (7.8%) |
| 6:00 AM to 6:29 AM | 86 (10.4%) | 69 (10.4%) |
| 6:30 AM to 6:59 AM | 115 (13.9%) | 11 (1.7%) |
| 7:00 AM to 7:29 AM | 128 (15.4%) | 58 (8.7%) |
| 7:30 AM to 7:59 AM | 17 (2.1%) | 134 (20.1%) |
| 8:00 AM to 8:29 AM | 24 (2.9%) | 59 (8.9%) |
| 8:30 AM to 8:59 AM | 0 (0.0%) | 16 (2.4%) |
| 9:00 AM to 9:59 AM | 9 (1.1%) | 12 (1.8%) |
| 10:00 AM to 10:59 AM | 24 (2.9%) | 16 (2.4%) |
| 11:00 AM to 11:59 AM | 0 (0.0%) | 0 (0.0%) |
| 12:00 PM to 3:59 PM | 90 (10.9%) | 64 (9.6%) |
| 4:00 PM to 11:59 PM | 25 (3.0%) | 109 (16.4%) |
| Total | 829 (100.0%) | 666 (100.0%) |
Housing Occupancy in Oregon
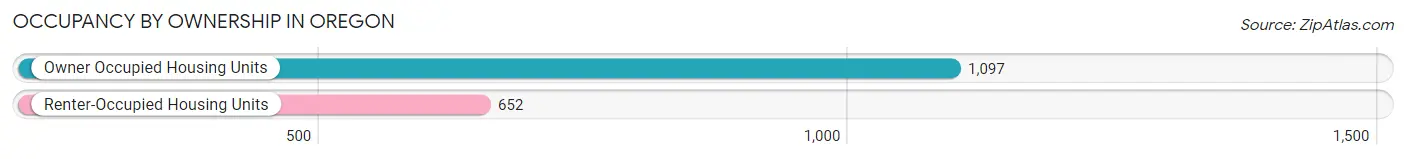
Occupancy by Ownership in Oregon
Of the total 1,749 dwellings in Oregon, owner-occupied units account for 1,097 (62.7%), while renter-occupied units make up 652 (37.3%).
| Occupancy | # Housing Units | % Housing Units |
| Owner Occupied Housing Units | 1,097 | 62.7% |
| Renter-Occupied Housing Units | 652 | 37.3% |
| Total Occupied Housing Units | 1,749 | 100.0% |
Occupancy by Household Size in Oregon
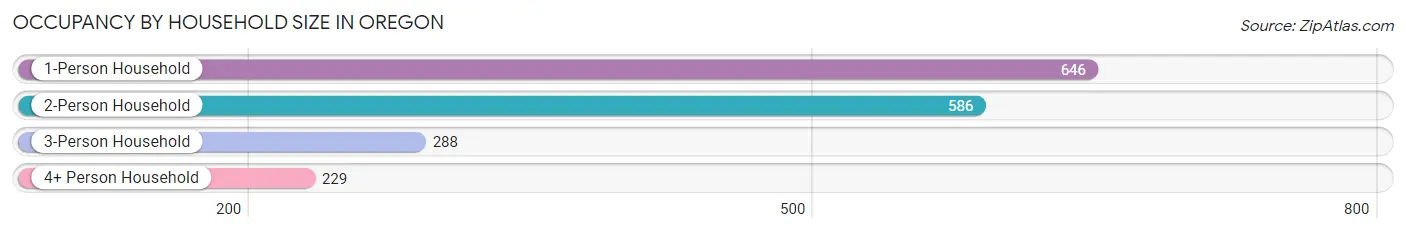
| Household Size | # Housing Units | % Housing Units |
| 1-Person Household | 646 | 36.9% |
| 2-Person Household | 586 | 33.5% |
| 3-Person Household | 288 | 16.5% |
| 4+ Person Household | 229 | 13.1% |
| Total Housing Units | 1,749 | 100.0% |
Occupancy by Ownership by Household Size in Oregon
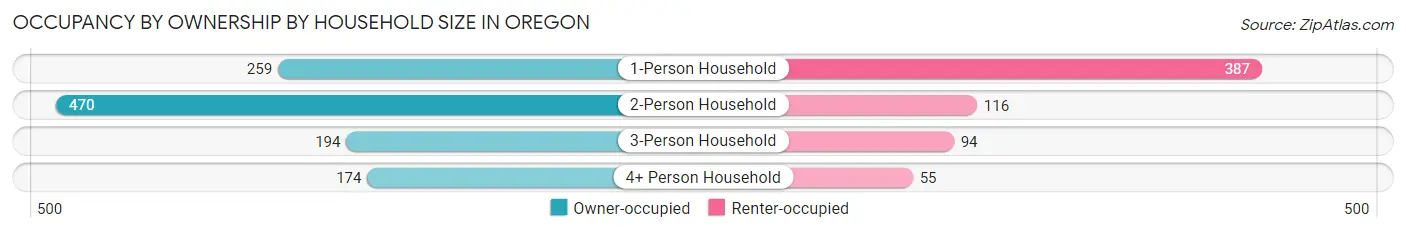
| Household Size | Owner-occupied | Renter-occupied |
| 1-Person Household | 259 (40.1%) | 387 (59.9%) |
| 2-Person Household | 470 (80.2%) | 116 (19.8%) |
| 3-Person Household | 194 (67.4%) | 94 (32.6%) |
| 4+ Person Household | 174 (76.0%) | 55 (24.0%) |
| Total Housing Units | 1,097 (62.7%) | 652 (37.3%) |
Occupancy by Educational Attainment in Oregon
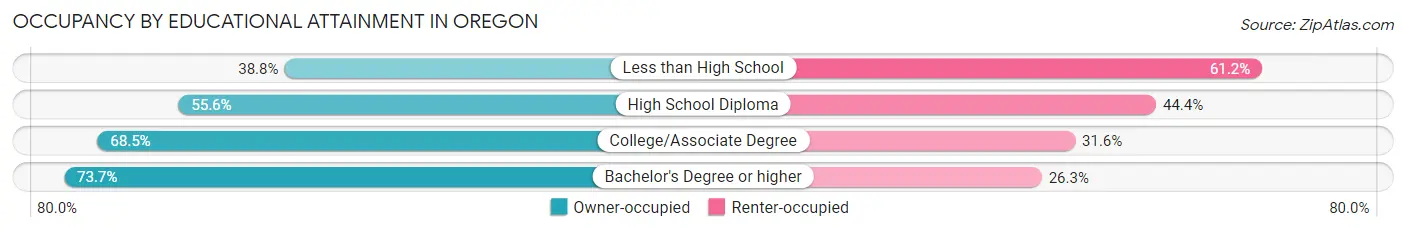
| Household Size | Owner-occupied | Renter-occupied |
| Less than High School | 26 (38.8%) | 41 (61.2%) |
| High School Diploma | 416 (55.6%) | 332 (44.4%) |
| College/Associate Degree | 436 (68.4%) | 201 (31.6%) |
| Bachelor's Degree or higher | 219 (73.7%) | 78 (26.3%) |
Occupancy by Age of Householder in Oregon
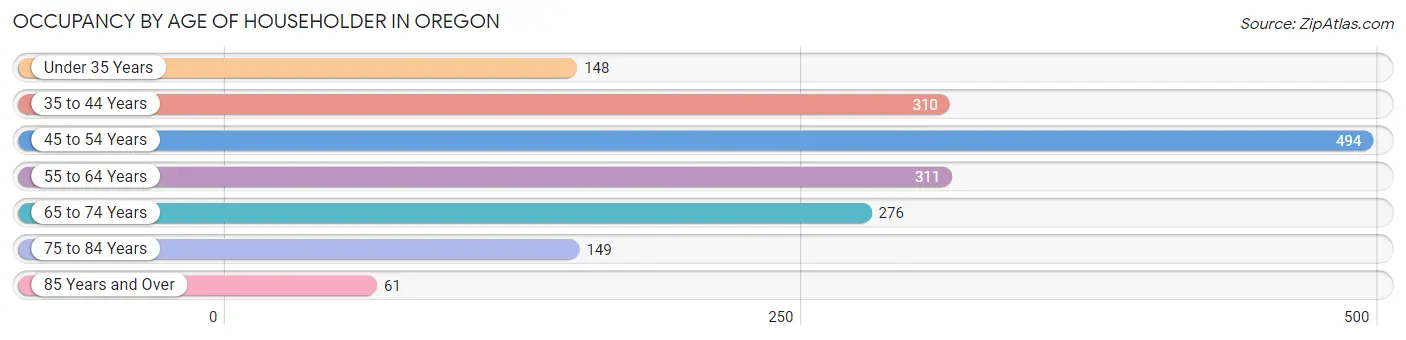
| Age Bracket | # Households | % Households |
| Under 35 Years | 148 | 8.5% |
| 35 to 44 Years | 310 | 17.7% |
| 45 to 54 Years | 494 | 28.2% |
| 55 to 64 Years | 311 | 17.8% |
| 65 to 74 Years | 276 | 15.8% |
| 75 to 84 Years | 149 | 8.5% |
| 85 Years and Over | 61 | 3.5% |
| Total | 1,749 | 100.0% |
Housing Finances in Oregon
Median Income by Occupancy in Oregon
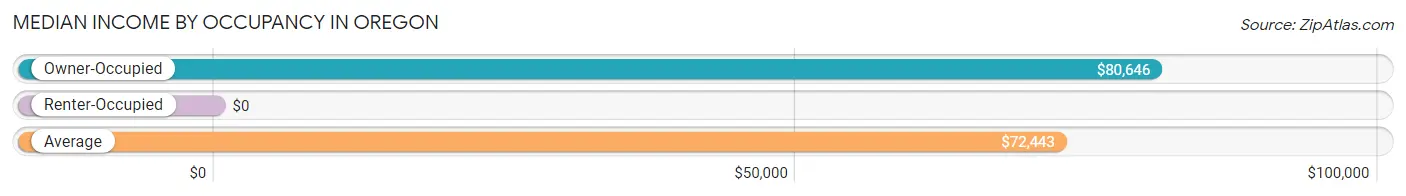
| Occupancy Type | # Households | Median Income |
| Owner-Occupied | 1,097 (62.7%) | $80,646 |
| Renter-Occupied | 652 (37.3%) | $0 |
| Average | 1,749 (100.0%) | $72,443 |
Occupancy by Householder Income Bracket in Oregon
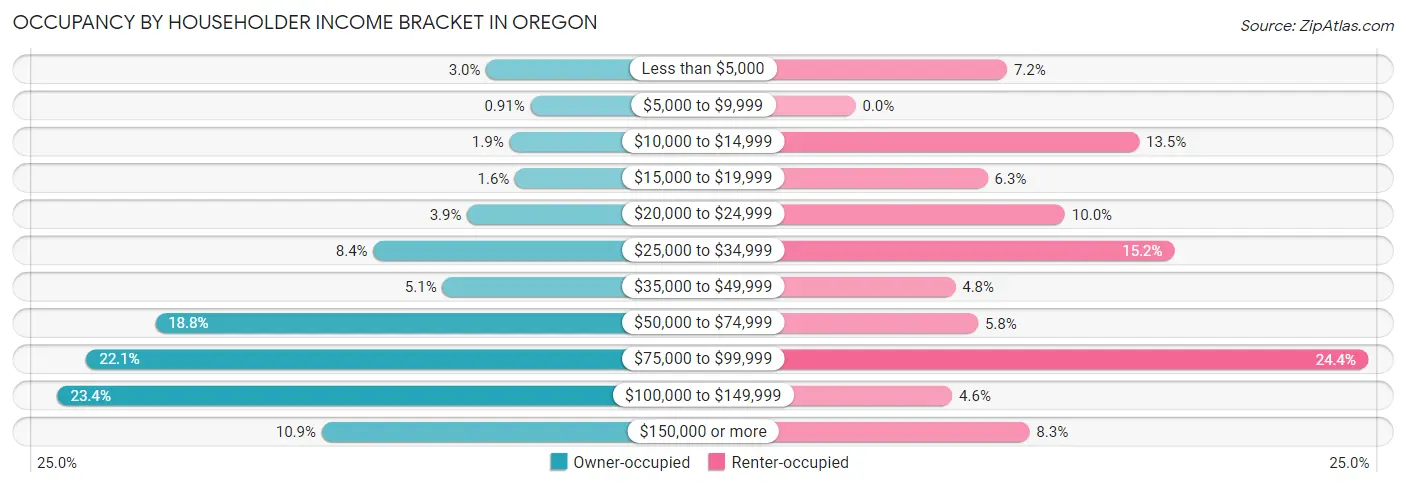
| Income Bracket | Owner-occupied | Renter-occupied |
| Less than $5,000 | 33 (3.0%) | 47 (7.2%) |
| $5,000 to $9,999 | 10 (0.9%) | 0 (0.0%) |
| $10,000 to $14,999 | 21 (1.9%) | 88 (13.5%) |
| $15,000 to $19,999 | 18 (1.6%) | 41 (6.3%) |
| $20,000 to $24,999 | 43 (3.9%) | 65 (10.0%) |
| $25,000 to $34,999 | 92 (8.4%) | 99 (15.2%) |
| $35,000 to $49,999 | 56 (5.1%) | 31 (4.8%) |
| $50,000 to $74,999 | 206 (18.8%) | 38 (5.8%) |
| $75,000 to $99,999 | 242 (22.1%) | 159 (24.4%) |
| $100,000 to $149,999 | 257 (23.4%) | 30 (4.6%) |
| $150,000 or more | 119 (10.8%) | 54 (8.3%) |
| Total | 1,097 (100.0%) | 652 (100.0%) |
Monthly Housing Cost Tiers in Oregon
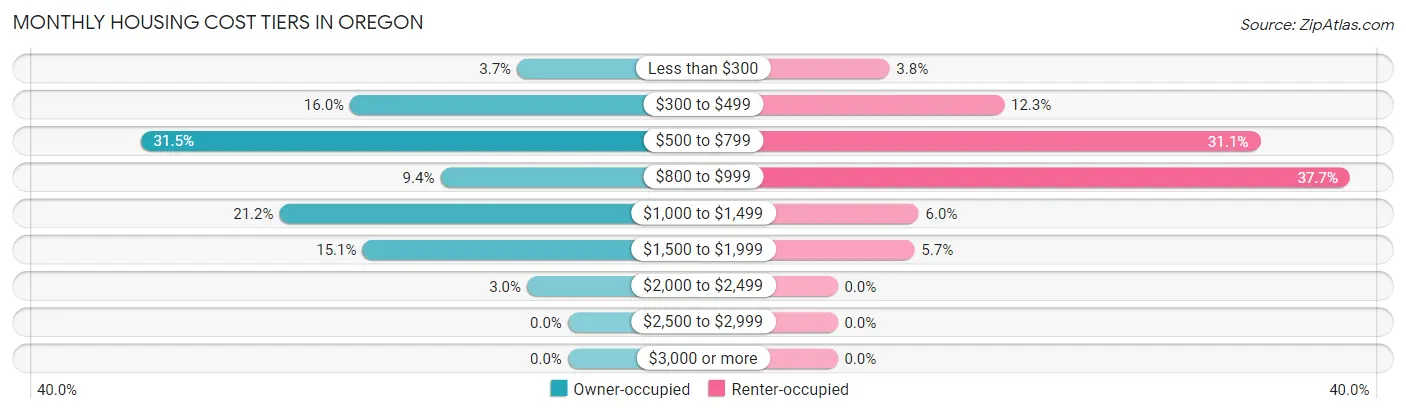
| Monthly Cost | Owner-occupied | Renter-occupied |
| Less than $300 | 41 (3.7%) | 25 (3.8%) |
| $300 to $499 | 176 (16.0%) | 80 (12.3%) |
| $500 to $799 | 345 (31.5%) | 203 (31.1%) |
| $800 to $999 | 103 (9.4%) | 246 (37.7%) |
| $1,000 to $1,499 | 233 (21.2%) | 39 (6.0%) |
| $1,500 to $1,999 | 166 (15.1%) | 37 (5.7%) |
| $2,000 to $2,499 | 33 (3.0%) | 0 (0.0%) |
| $2,500 to $2,999 | 0 (0.0%) | 0 (0.0%) |
| $3,000 or more | 0 (0.0%) | 0 (0.0%) |
| Total | 1,097 (100.0%) | 652 (100.0%) |
Physical Housing Characteristics in Oregon
Housing Structures in Oregon
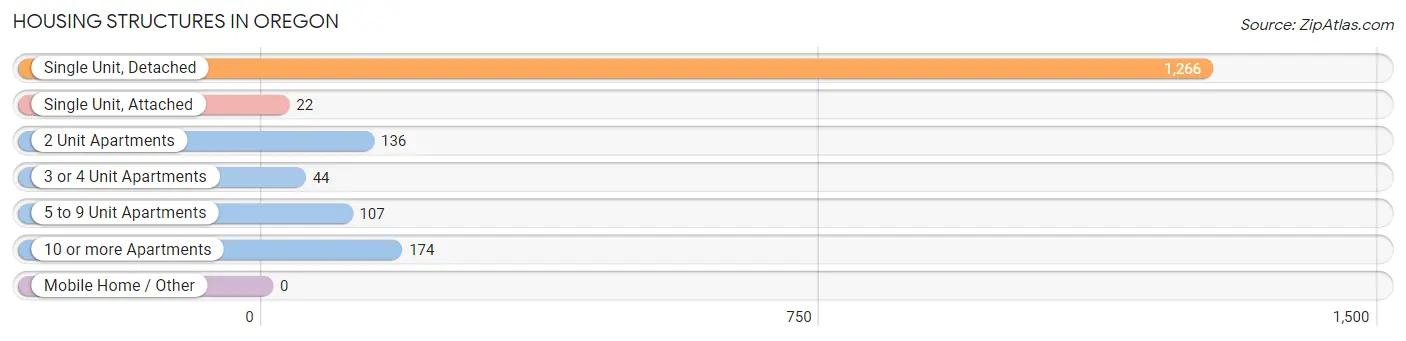
| Structure Type | # Housing Units | % Housing Units |
| Single Unit, Detached | 1,266 | 72.4% |
| Single Unit, Attached | 22 | 1.3% |
| 2 Unit Apartments | 136 | 7.8% |
| 3 or 4 Unit Apartments | 44 | 2.5% |
| 5 to 9 Unit Apartments | 107 | 6.1% |
| 10 or more Apartments | 174 | 10.0% |
| Mobile Home / Other | 0 | 0.0% |
| Total | 1,749 | 100.0% |
Housing Structures by Occupancy in Oregon
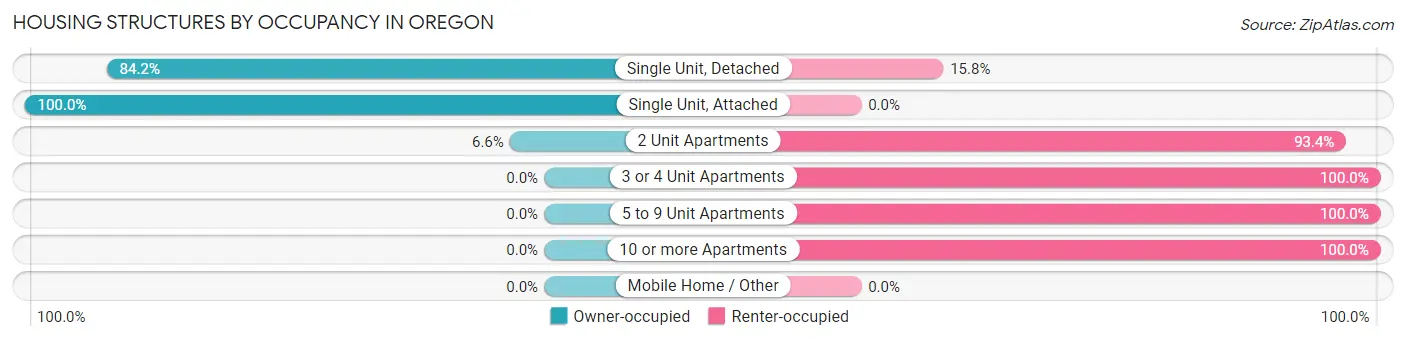
| Structure Type | Owner-occupied | Renter-occupied |
| Single Unit, Detached | 1,066 (84.2%) | 200 (15.8%) |
| Single Unit, Attached | 22 (100.0%) | 0 (0.0%) |
| 2 Unit Apartments | 9 (6.6%) | 127 (93.4%) |
| 3 or 4 Unit Apartments | 0 (0.0%) | 44 (100.0%) |
| 5 to 9 Unit Apartments | 0 (0.0%) | 107 (100.0%) |
| 10 or more Apartments | 0 (0.0%) | 174 (100.0%) |
| Mobile Home / Other | 0 (0.0%) | 0 (0.0%) |
| Total | 1,097 (62.7%) | 652 (37.3%) |
Housing Structures by Number of Rooms in Oregon
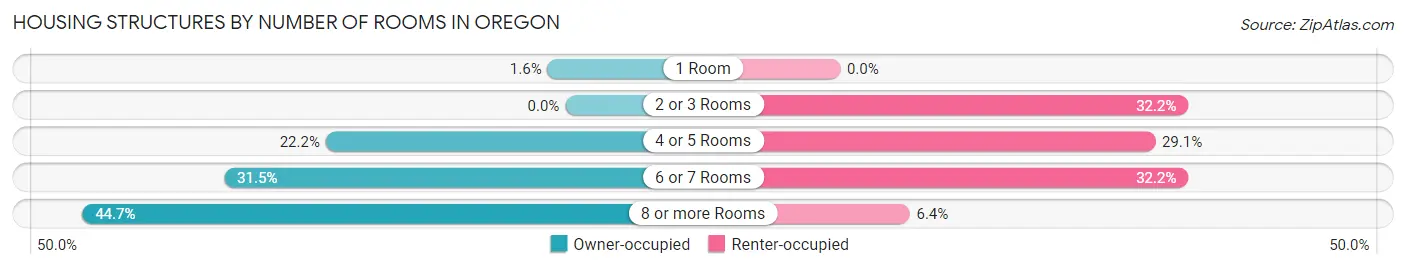
| Number of Rooms | Owner-occupied | Renter-occupied |
| 1 Room | 18 (1.6%) | 0 (0.0%) |
| 2 or 3 Rooms | 0 (0.0%) | 210 (32.2%) |
| 4 or 5 Rooms | 243 (22.2%) | 190 (29.1%) |
| 6 or 7 Rooms | 346 (31.5%) | 210 (32.2%) |
| 8 or more Rooms | 490 (44.7%) | 42 (6.4%) |
| Total | 1,097 (100.0%) | 652 (100.0%) |
Housing Structure by Heating Type in Oregon
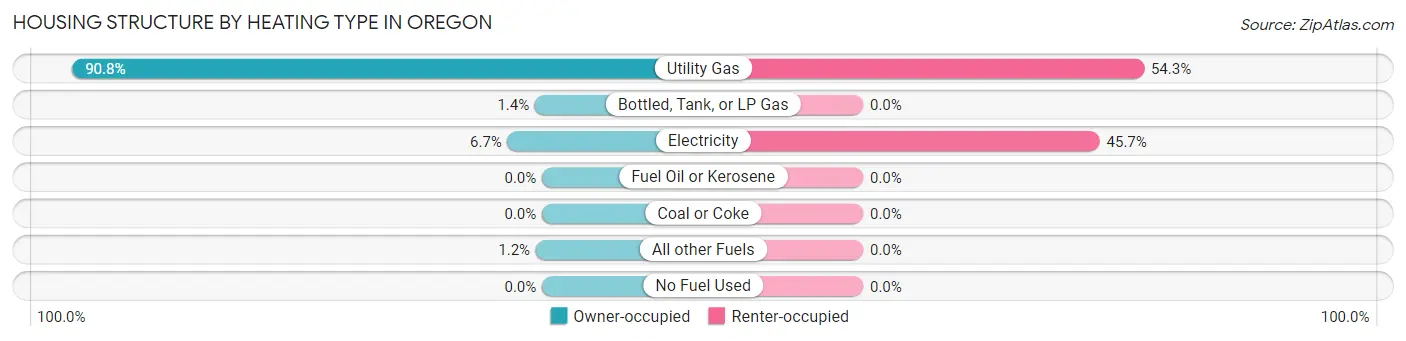
| Heating Type | Owner-occupied | Renter-occupied |
| Utility Gas | 996 (90.8%) | 354 (54.3%) |
| Bottled, Tank, or LP Gas | 15 (1.4%) | 0 (0.0%) |
| Electricity | 73 (6.7%) | 298 (45.7%) |
| Fuel Oil or Kerosene | 0 (0.0%) | 0 (0.0%) |
| Coal or Coke | 0 (0.0%) | 0 (0.0%) |
| All other Fuels | 13 (1.2%) | 0 (0.0%) |
| No Fuel Used | 0 (0.0%) | 0 (0.0%) |
| Total | 1,097 (100.0%) | 652 (100.0%) |
Household Vehicle Usage in Oregon
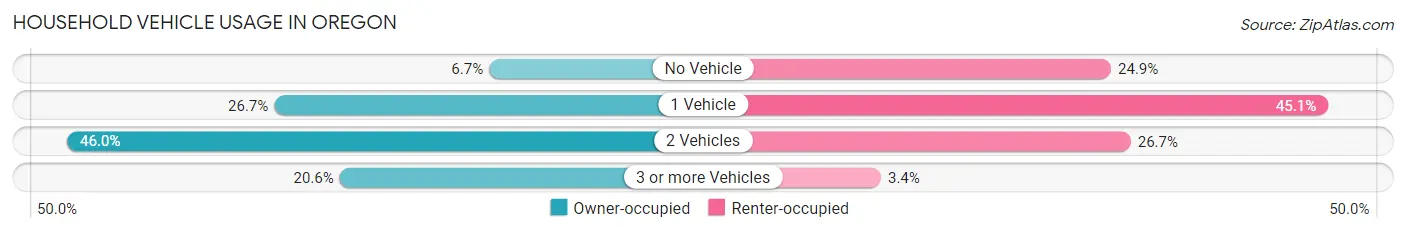
| Vehicles per Household | Owner-occupied | Renter-occupied |
| No Vehicle | 73 (6.7%) | 162 (24.8%) |
| 1 Vehicle | 293 (26.7%) | 294 (45.1%) |
| 2 Vehicles | 505 (46.0%) | 174 (26.7%) |
| 3 or more Vehicles | 226 (20.6%) | 22 (3.4%) |
| Total | 1,097 (100.0%) | 652 (100.0%) |
Real Estate & Mortgages in Oregon
Real Estate and Mortgage Overview in Oregon
| Characteristic | Without Mortgage | With Mortgage |
| Housing Units | 514 | 583 |
| Median Property Value | $122,700 | $143,000 |
| Median Household Income | $68,077 | $96 |
| Monthly Housing Costs | $538 | $0 |
| Real Estate Taxes | $2,778 | $0 |
Property Value by Mortgage Status in Oregon
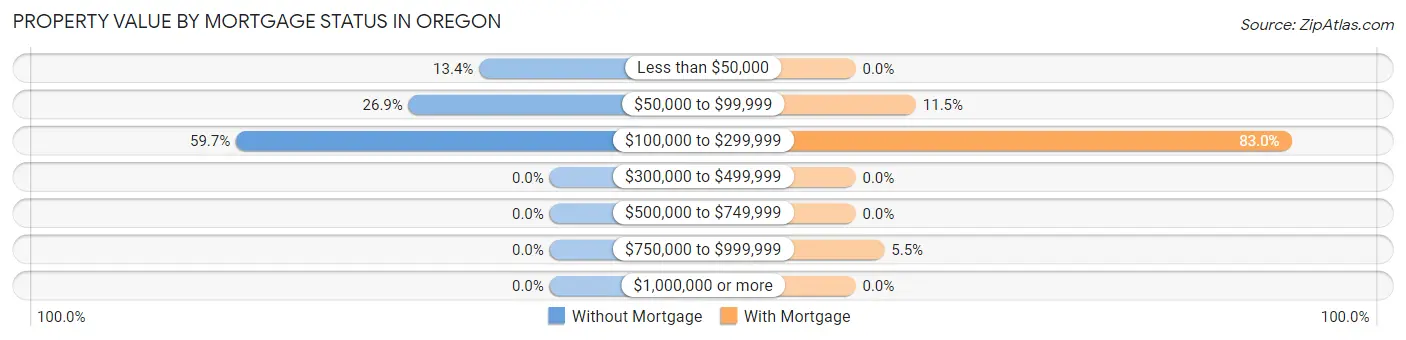
| Property Value | Without Mortgage | With Mortgage |
| Less than $50,000 | 69 (13.4%) | 0 (0.0%) |
| $50,000 to $99,999 | 138 (26.9%) | 67 (11.5%) |
| $100,000 to $299,999 | 307 (59.7%) | 484 (83.0%) |
| $300,000 to $499,999 | 0 (0.0%) | 0 (0.0%) |
| $500,000 to $749,999 | 0 (0.0%) | 0 (0.0%) |
| $750,000 to $999,999 | 0 (0.0%) | 32 (5.5%) |
| $1,000,000 or more | 0 (0.0%) | 0 (0.0%) |
| Total | 514 (100.0%) | 583 (100.0%) |
Household Income by Mortgage Status in Oregon
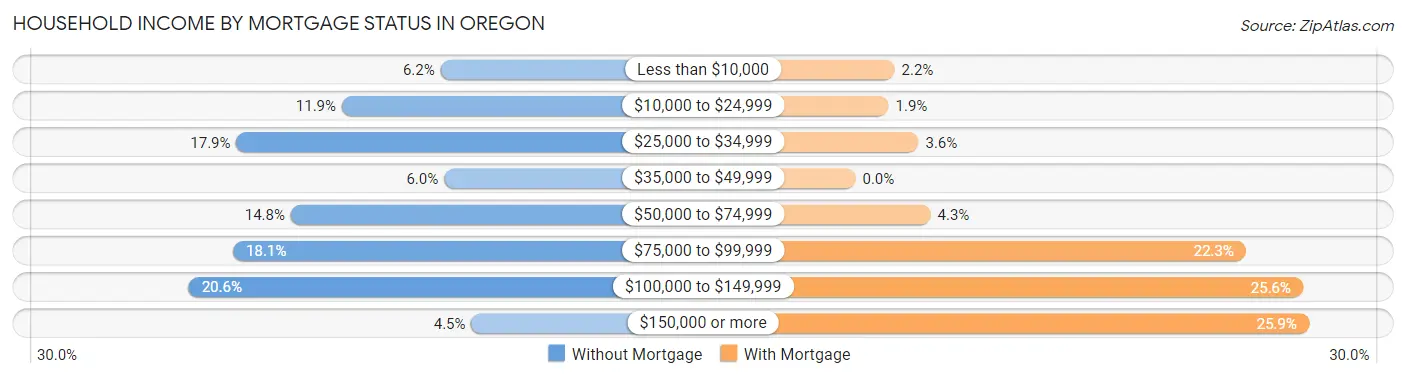
| Household Income | Without Mortgage | With Mortgage |
| Less than $10,000 | 32 (6.2%) | 13 (2.2%) |
| $10,000 to $24,999 | 61 (11.9%) | 11 (1.9%) |
| $25,000 to $34,999 | 92 (17.9%) | 21 (3.6%) |
| $35,000 to $49,999 | 31 (6.0%) | 0 (0.0%) |
| $50,000 to $74,999 | 76 (14.8%) | 25 (4.3%) |
| $75,000 to $99,999 | 93 (18.1%) | 130 (22.3%) |
| $100,000 to $149,999 | 106 (20.6%) | 149 (25.6%) |
| $150,000 or more | 23 (4.5%) | 151 (25.9%) |
| Total | 514 (100.0%) | 583 (100.0%) |
Property Value to Household Income Ratio in Oregon
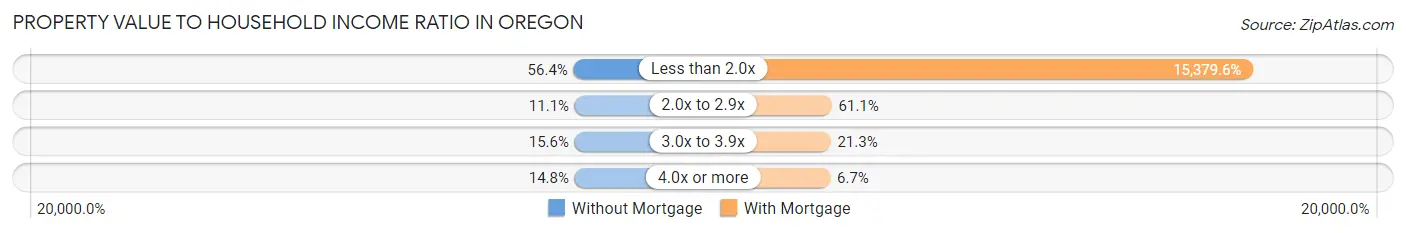
| Value-to-Income Ratio | Without Mortgage | With Mortgage |
| Less than 2.0x | 290 (56.4%) | 89,663 (15,379.6%) |
| 2.0x to 2.9x | 57 (11.1%) | 356 (61.1%) |
| 3.0x to 3.9x | 80 (15.6%) | 124 (21.3%) |
| 4.0x or more | 76 (14.8%) | 39 (6.7%) |
| Total | 514 (100.0%) | 583 (100.0%) |
Real Estate Taxes by Mortgage Status in Oregon
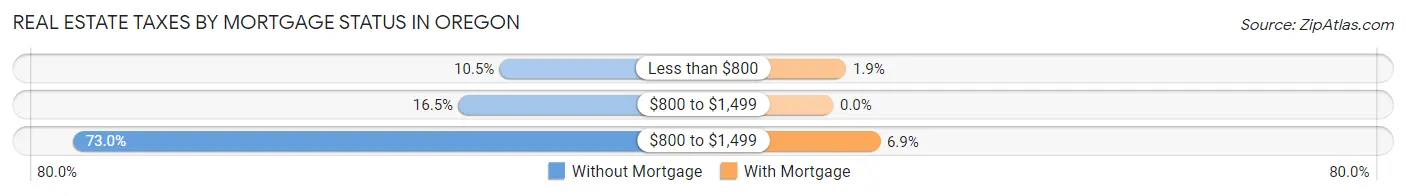
| Property Taxes | Without Mortgage | With Mortgage |
| Less than $800 | 54 (10.5%) | 11 (1.9%) |
| $800 to $1,499 | 85 (16.5%) | 0 (0.0%) |
| $800 to $1,499 | 375 (73.0%) | 40 (6.9%) |
| Total | 514 (100.0%) | 583 (100.0%) |
Health & Disability in Oregon
Health Insurance Coverage by Age in Oregon
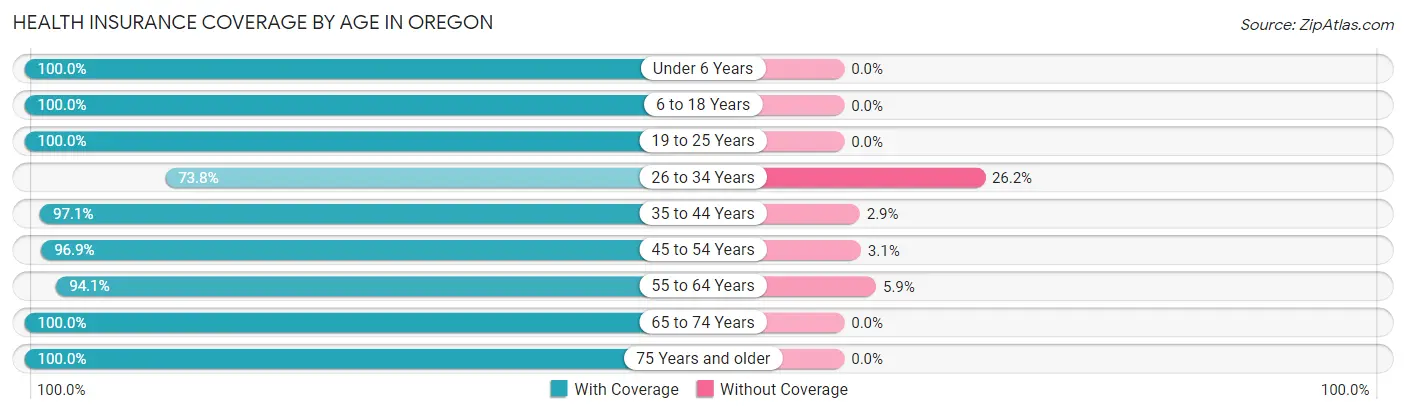
| Age Bracket | With Coverage | Without Coverage |
| Under 6 Years | 173 (100.0%) | 0 (0.0%) |
| 6 to 18 Years | 708 (100.0%) | 0 (0.0%) |
| 19 to 25 Years | 250 (100.0%) | 0 (0.0%) |
| 26 to 34 Years | 135 (73.8%) | 48 (26.2%) |
| 35 to 44 Years | 538 (97.1%) | 16 (2.9%) |
| 45 to 54 Years | 626 (96.9%) | 20 (3.1%) |
| 55 to 64 Years | 461 (94.1%) | 29 (5.9%) |
| 65 to 74 Years | 386 (100.0%) | 0 (0.0%) |
| 75 Years and older | 460 (100.0%) | 0 (0.0%) |
| Total | 3,737 (97.1%) | 113 (2.9%) |
Health Insurance Coverage by Citizenship Status in Oregon
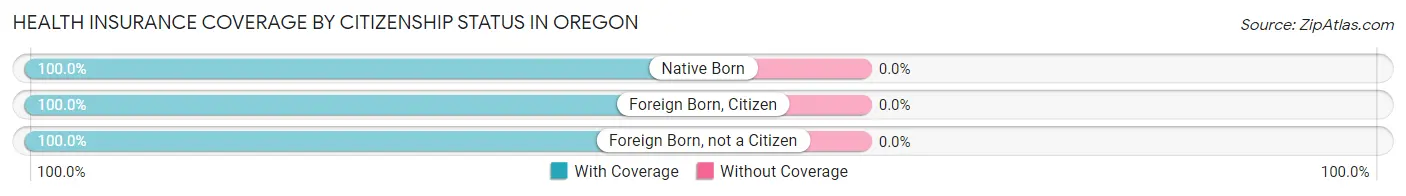
| Citizenship Status | With Coverage | Without Coverage |
| Native Born | 173 (100.0%) | 0 (0.0%) |
| Foreign Born, Citizen | 708 (100.0%) | 0 (0.0%) |
| Foreign Born, not a Citizen | 250 (100.0%) | 0 (0.0%) |
Health Insurance Coverage by Household Income in Oregon
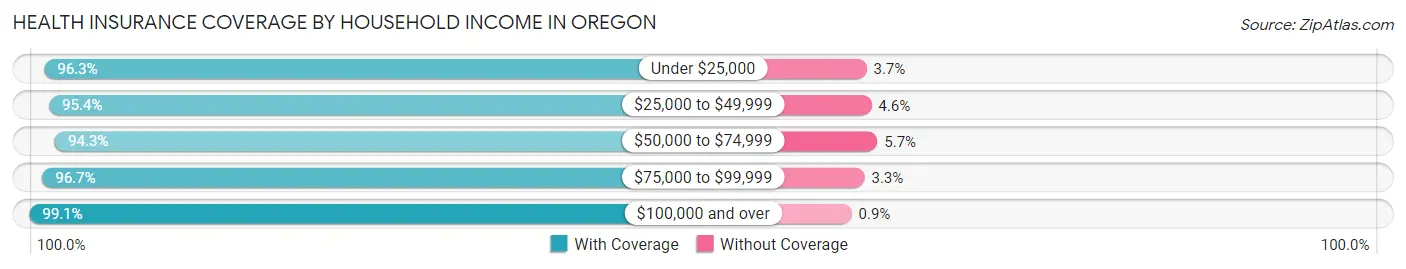
| Household Income | With Coverage | Without Coverage |
| Under $25,000 | 469 (96.3%) | 18 (3.7%) |
| $25,000 to $49,999 | 517 (95.4%) | 25 (4.6%) |
| $50,000 to $74,999 | 478 (94.3%) | 29 (5.7%) |
| $75,000 to $99,999 | 815 (96.7%) | 28 (3.3%) |
| $100,000 and over | 1,433 (99.1%) | 13 (0.9%) |
Public vs Private Health Insurance Coverage by Age in Oregon
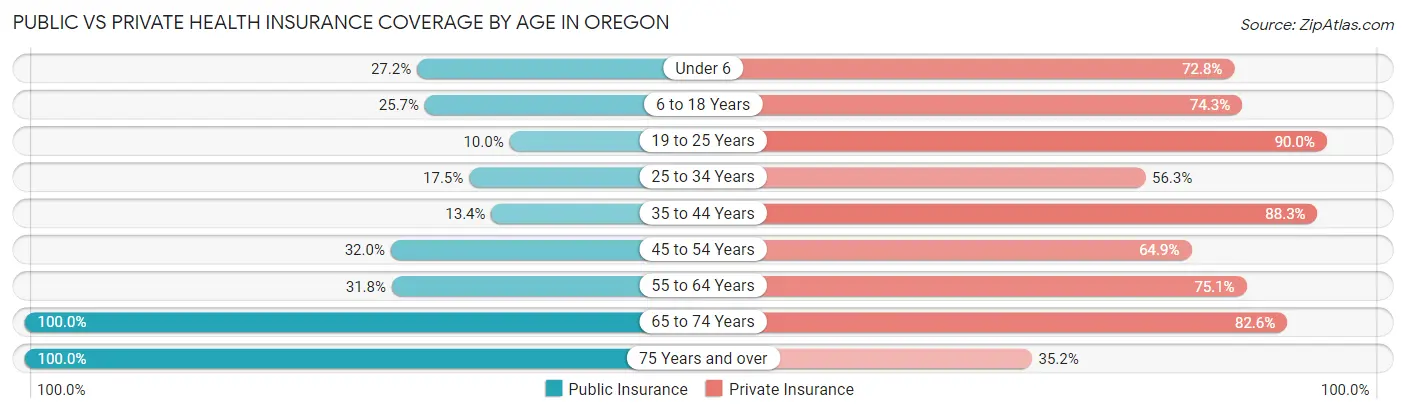
| Age Bracket | Public Insurance | Private Insurance |
| Under 6 | 47 (27.2%) | 126 (72.8%) |
| 6 to 18 Years | 182 (25.7%) | 526 (74.3%) |
| 19 to 25 Years | 25 (10.0%) | 225 (90.0%) |
| 25 to 34 Years | 32 (17.5%) | 103 (56.3%) |
| 35 to 44 Years | 74 (13.4%) | 489 (88.3%) |
| 45 to 54 Years | 207 (32.0%) | 419 (64.9%) |
| 55 to 64 Years | 156 (31.8%) | 368 (75.1%) |
| 65 to 74 Years | 386 (100.0%) | 319 (82.6%) |
| 75 Years and over | 460 (100.0%) | 162 (35.2%) |
| Total | 1,569 (40.7%) | 2,737 (71.1%) |
Disability Status by Sex by Age in Oregon
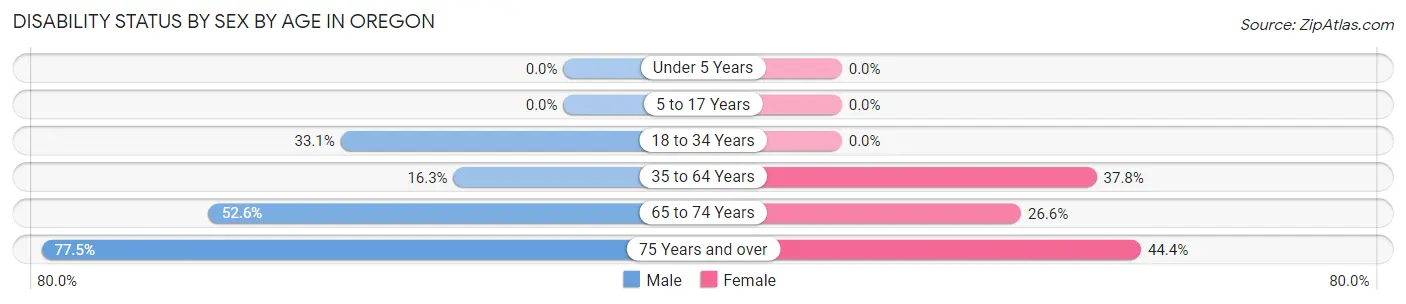
| Age Bracket | Male | Female |
| Under 5 Years | 0 (0.0%) | 0 (0.0%) |
| 5 to 17 Years | 0 (0.0%) | 0 (0.0%) |
| 18 to 34 Years | 88 (33.1%) | 0 (0.0%) |
| 35 to 64 Years | 149 (16.3%) | 294 (37.8%) |
| 65 to 74 Years | 130 (52.6%) | 37 (26.6%) |
| 75 Years and over | 203 (77.5%) | 88 (44.4%) |
Disability Class by Sex by Age in Oregon
Disability Class: Hearing Difficulty
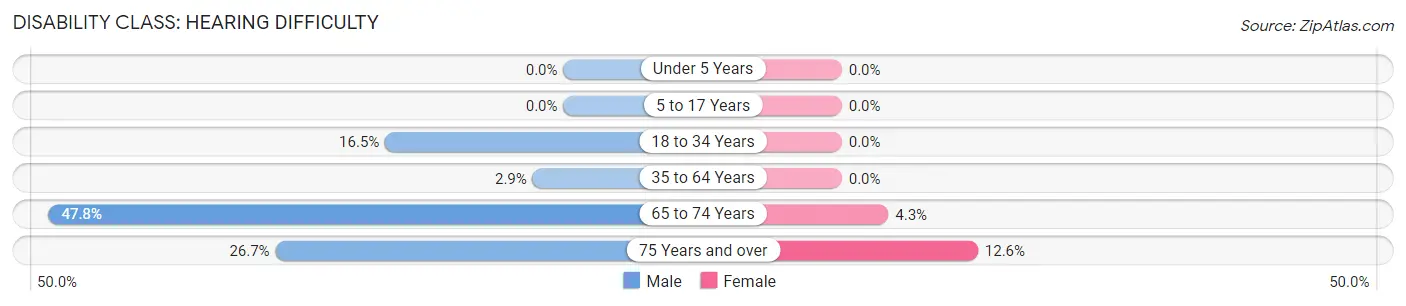
| Age Bracket | Male | Female |
| Under 5 Years | 0 (0.0%) | 0 (0.0%) |
| 5 to 17 Years | 0 (0.0%) | 0 (0.0%) |
| 18 to 34 Years | 44 (16.5%) | 0 (0.0%) |
| 35 to 64 Years | 26 (2.9%) | 0 (0.0%) |
| 65 to 74 Years | 118 (47.8%) | 6 (4.3%) |
| 75 Years and over | 70 (26.7%) | 25 (12.6%) |
Disability Class: Vision Difficulty
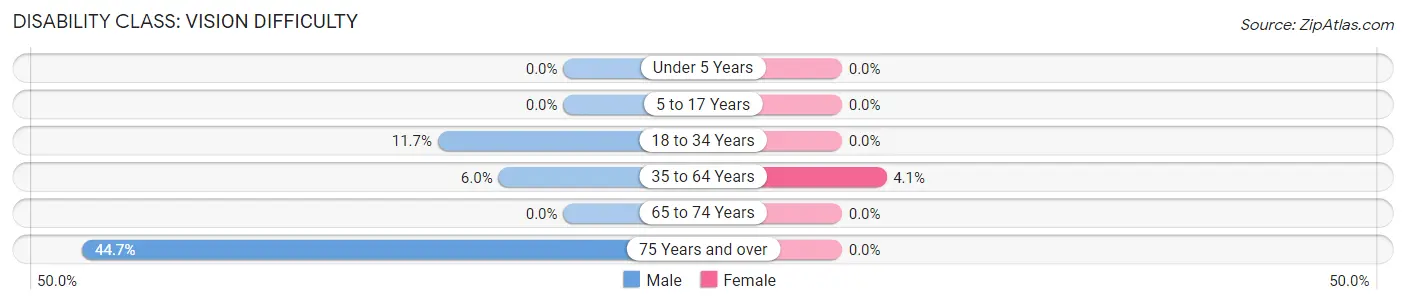
| Age Bracket | Male | Female |
| Under 5 Years | 0 (0.0%) | 0 (0.0%) |
| 5 to 17 Years | 0 (0.0%) | 0 (0.0%) |
| 18 to 34 Years | 31 (11.7%) | 0 (0.0%) |
| 35 to 64 Years | 55 (6.0%) | 32 (4.1%) |
| 65 to 74 Years | 0 (0.0%) | 0 (0.0%) |
| 75 Years and over | 117 (44.7%) | 0 (0.0%) |
Disability Class: Cognitive Difficulty
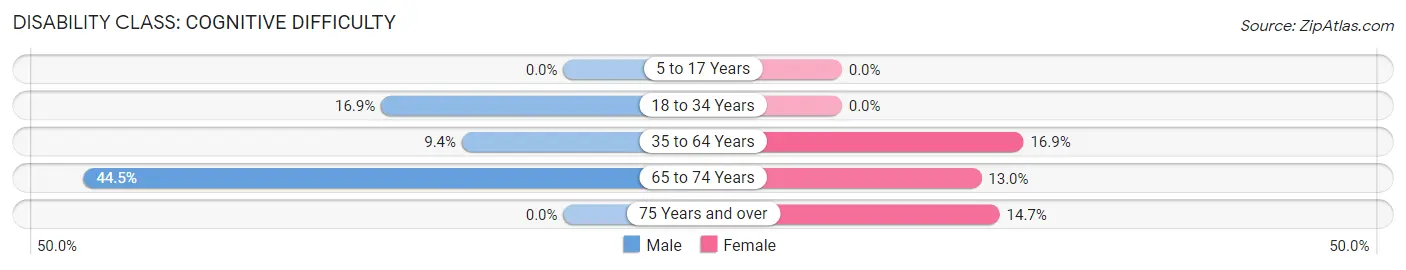
| Age Bracket | Male | Female |
| 5 to 17 Years | 0 (0.0%) | 0 (0.0%) |
| 18 to 34 Years | 45 (16.9%) | 0 (0.0%) |
| 35 to 64 Years | 86 (9.4%) | 131 (16.9%) |
| 65 to 74 Years | 110 (44.5%) | 18 (13.0%) |
| 75 Years and over | 0 (0.0%) | 29 (14.6%) |
Disability Class: Ambulatory Difficulty
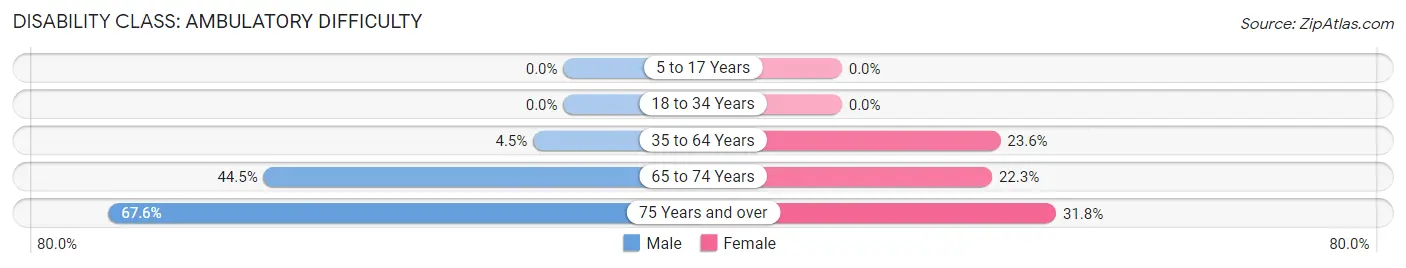
| Age Bracket | Male | Female |
| 5 to 17 Years | 0 (0.0%) | 0 (0.0%) |
| 18 to 34 Years | 0 (0.0%) | 0 (0.0%) |
| 35 to 64 Years | 41 (4.5%) | 183 (23.5%) |
| 65 to 74 Years | 110 (44.5%) | 31 (22.3%) |
| 75 Years and over | 177 (67.6%) | 63 (31.8%) |
Disability Class: Self-Care Difficulty
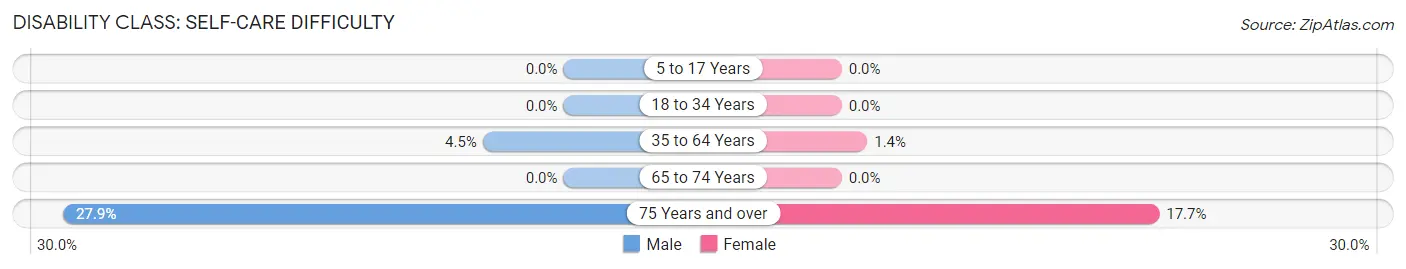
| Age Bracket | Male | Female |
| 5 to 17 Years | 0 (0.0%) | 0 (0.0%) |
| 18 to 34 Years | 0 (0.0%) | 0 (0.0%) |
| 35 to 64 Years | 41 (4.5%) | 11 (1.4%) |
| 65 to 74 Years | 0 (0.0%) | 0 (0.0%) |
| 75 Years and over | 73 (27.9%) | 35 (17.7%) |
Technology Access in Oregon
Computing Device Access in Oregon
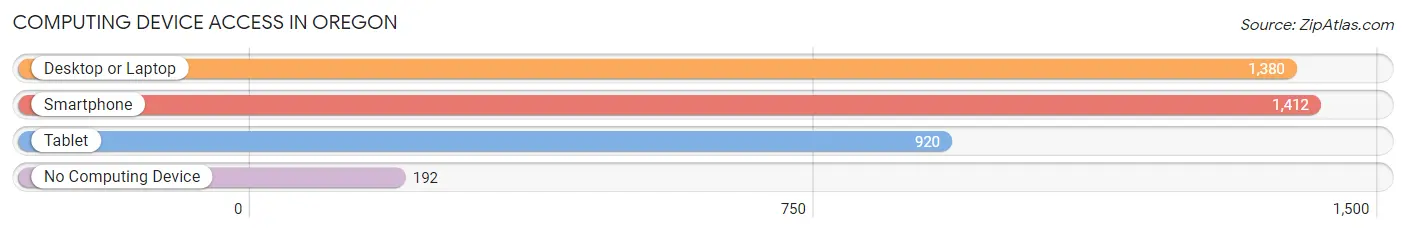
| Device Type | # Households | % Households |
| Desktop or Laptop | 1,380 | 78.9% |
| Smartphone | 1,412 | 80.7% |
| Tablet | 920 | 52.6% |
| No Computing Device | 192 | 11.0% |
| Total | 1,749 | 100.0% |
Internet Access in Oregon
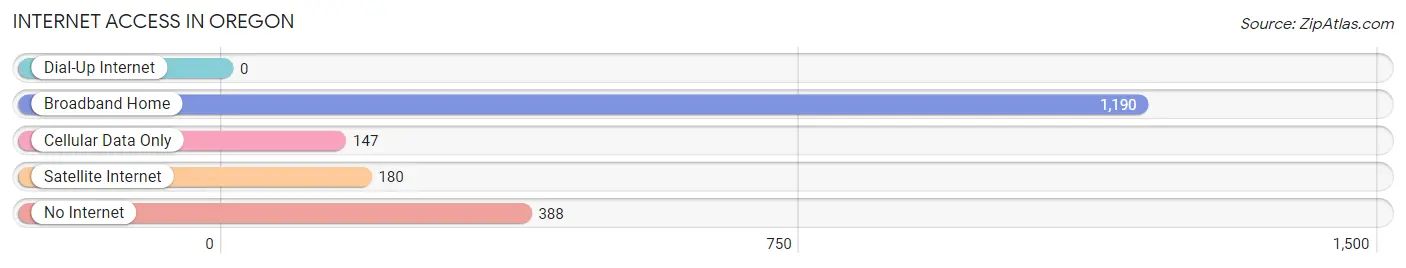
| Internet Type | # Households | % Households |
| Dial-Up Internet | 0 | 0.0% |
| Broadband Home | 1,190 | 68.0% |
| Cellular Data Only | 147 | 8.4% |
| Satellite Internet | 180 | 10.3% |
| No Internet | 388 | 22.2% |
| Total | 1,749 | 100.0% |
Oregon Summary
Oregon, Illinois is a small city located in Ogle County, Illinois, United States. It is situated on the Rock River, approximately 80 miles west of Chicago. The city has a population of 3,719 as of the 2010 census.
History
Oregon, Illinois was founded in 1836 by settlers from New York and New England. The city was named after the Oregon Territory, which was established in 1848. The first settlers were attracted to the area by the abundance of timber and the potential for farming. The first post office was established in 1837 and the first school was built in 1838.
The city was incorporated in 1853 and the first mayor was elected in 1854. The first newspaper, the Oregon Free Press, was established in 1855. The city was a major stop on the Underground Railroad, with many slaves escaping to freedom in Canada.
In 1864, the city was the site of a major Civil War battle, the Battle of Oregon. The Union forces were victorious and the city was spared from destruction.
Geography
Oregon, Illinois is located at 42°14'N, 89°25'W (42.23, -89.41). The city is situated on the Rock River, approximately 80 miles west of Chicago. The city has a total area of 2.2 square miles, all of which is land.
The city has a humid continental climate, with cold, snowy winters and hot, humid summers. The average annual temperature is 48°F, with an average high of 68°F in July and an average low of 28°F in January. The average annual precipitation is 36 inches.
Economy
Oregon, Illinois is a small city with a diverse economy. The city is home to several manufacturing companies, including a paper mill, a plastics factory, and a metal fabrication plant. The city also has a strong agricultural sector, with several farms located in the area.
The city is also home to several retail stores, restaurants, and other businesses. The city is served by the Ogle County Airport, which provides air service to Chicago and other cities.
Demographics
As of the 2010 census, Oregon, Illinois had a population of 3,719. The racial makeup of the city was 95.2% White, 0.7% African American, 0.3% Native American, 0.7% Asian, 0.1% Pacific Islander, 1.3% from other races, and 1.7% from two or more races. Hispanic or Latino of any race were 3.2% of the population.
The median income for a household in the city was $45,938, and the median income for a family was $51,938. The per capita income for the city was $20,938. About 8.2% of families and 10.2% of the population were below the poverty line, including 14.2% of those under age 18 and 6.2% of those age 65 or over.
Common Questions
What is Per Capita Income in Oregon?
Per Capita income in Oregon is $33,377.
What is the Median Family Income in Oregon?
Median Family Income in Oregon is $84,432.
What is the Median Household income in Oregon?
Median Household Income in Oregon is $72,443.
What is Income or Wage Gap in Oregon?
Income or Wage Gap in Oregon is 34.3%.
Women in Oregon earn 65.7 cents for every dollar earned by a man.
What is Inequality or Gini Index in Oregon?
Inequality or Gini Index in Oregon is 0.39.
What is the Total Population of Oregon?
Total Population of Oregon is 3,963.
What is the Total Male Population of Oregon?
Total Male Population of Oregon is 2,063.
What is the Total Female Population of Oregon?
Total Female Population of Oregon is 1,900.
What is the Ratio of Males per 100 Females in Oregon?
There are 108.58 Males per 100 Females in Oregon.
What is the Ratio of Females per 100 Males in Oregon?
There are 92.10 Females per 100 Males in Oregon.
What is the Median Population Age in Oregon?
Median Population Age in Oregon is 46.0 Years.
What is the Average Family Size in Oregon
Average Family Size in Oregon is 2.9 People.
What is the Average Household Size in Oregon
Average Household Size in Oregon is 2.2 People.
How Large is the Labor Force in Oregon?
There are 1,652 People in the Labor Forcein in Oregon.
What is the Percentage of People in the Labor Force in Oregon?
50.8% of People are in the Labor Force in Oregon.
What is the Unemployment Rate in Oregon?
Unemployment Rate in Oregon is 5.0%.