Roxana, IL Map & Demographics
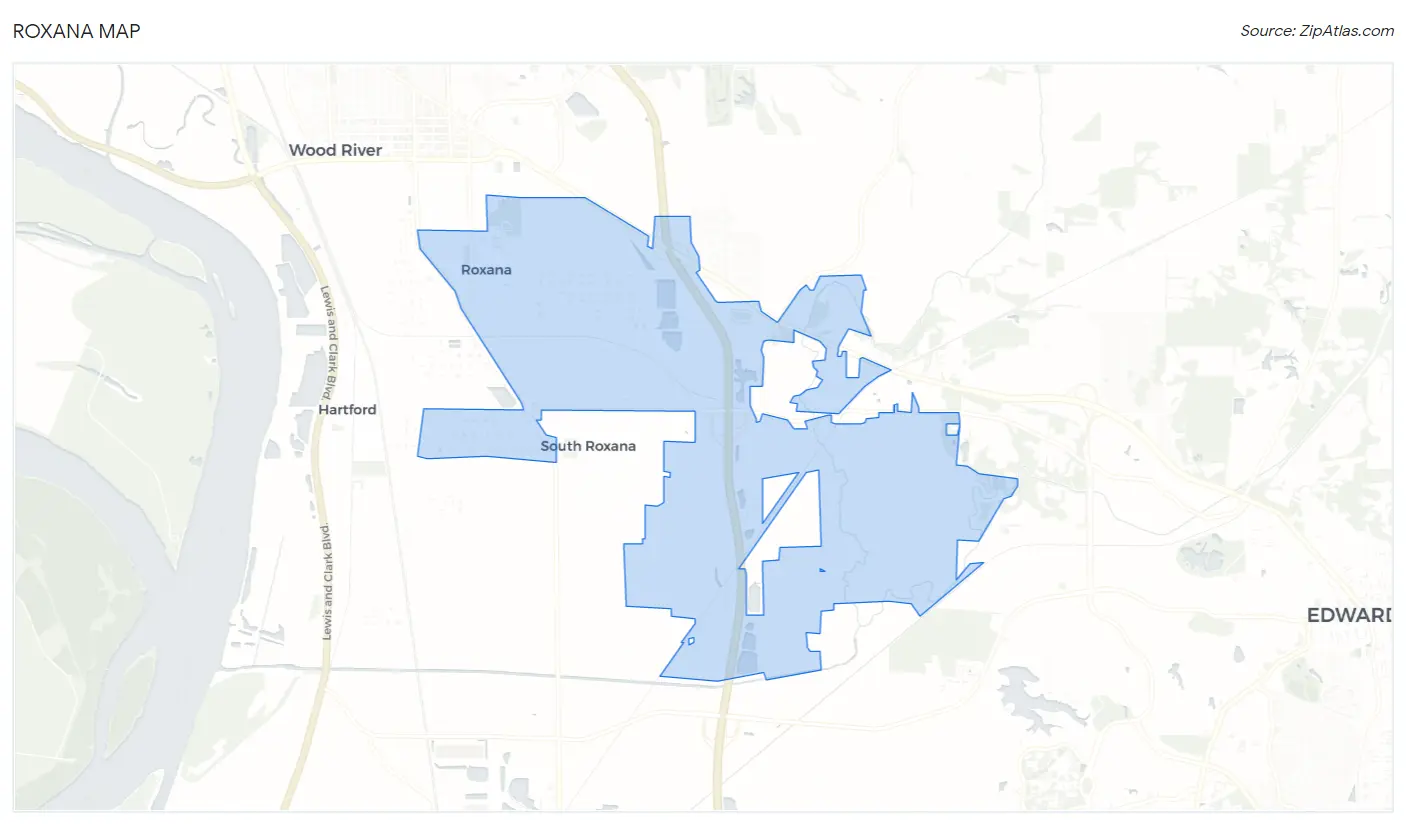
Roxana Map
Roxana Overview
$36,773
PER CAPITA INCOME
$73,625
AVG FAMILY INCOME
$61,528
AVG HOUSEHOLD INCOME
0.47
INEQUALITY / GINI INDEX
1,570
TOTAL POPULATION
749
MALE POPULATION
821
FEMALE POPULATION
91.23
MALES / 100 FEMALES
109.61
FEMALES / 100 MALES
39.8
MEDIAN AGE
2.6
AVG FAMILY SIZE
2.3
AVG HOUSEHOLD SIZE
762
LABOR FORCE [ PEOPLE ]
60.6%
PERCENT IN LABOR FORCE
3.0%
UNEMPLOYMENT RATE
Roxana Zip Codes
Income in Roxana
Income Overview in Roxana
Per Capita Income in Roxana is $36,773, while median incomes of families and households are $73,625 and $61,528 respectively.
| Characteristic | Number | Measure |
| Per Capita Income | 1,570 | $36,773 |
| Median Family Income | 483 | $73,625 |
| Mean Family Income | 483 | $82,234 |
| Median Household Income | 691 | $61,528 |
| Mean Household Income | 691 | $83,548 |
| Income Deficit | 483 | $0 |
| Wage / Income Gap (%) | 1,570 | 0.00% |
| Wage / Income Gap ($) | 1,570 | 100.00¢ per $1 |
| Gini / Inequality Index | 1,570 | 0.47 |
Earnings by Sex in Roxana
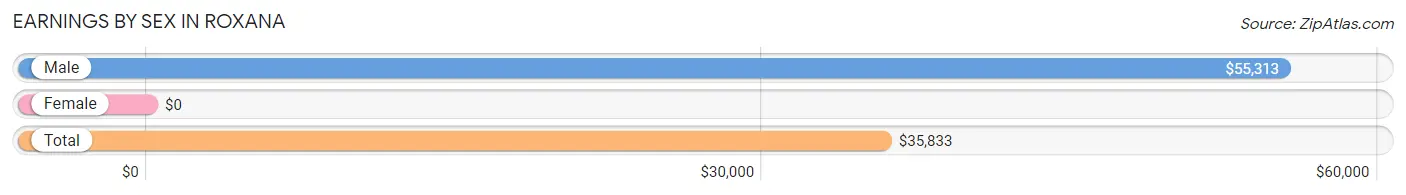
| Sex | Number | Average Earnings |
| Male | 445 (54.3%) | $55,313 |
| Female | 375 (45.7%) | $0 |
| Total | 820 (100.0%) | $35,833 |
Earnings by Sex by Income Bracket in Roxana
The most common earnings brackets in Roxana are $75,000 to $99,999 for men (83 | 18.6%) and $12,500 to $14,999 for women (46 | 12.3%).
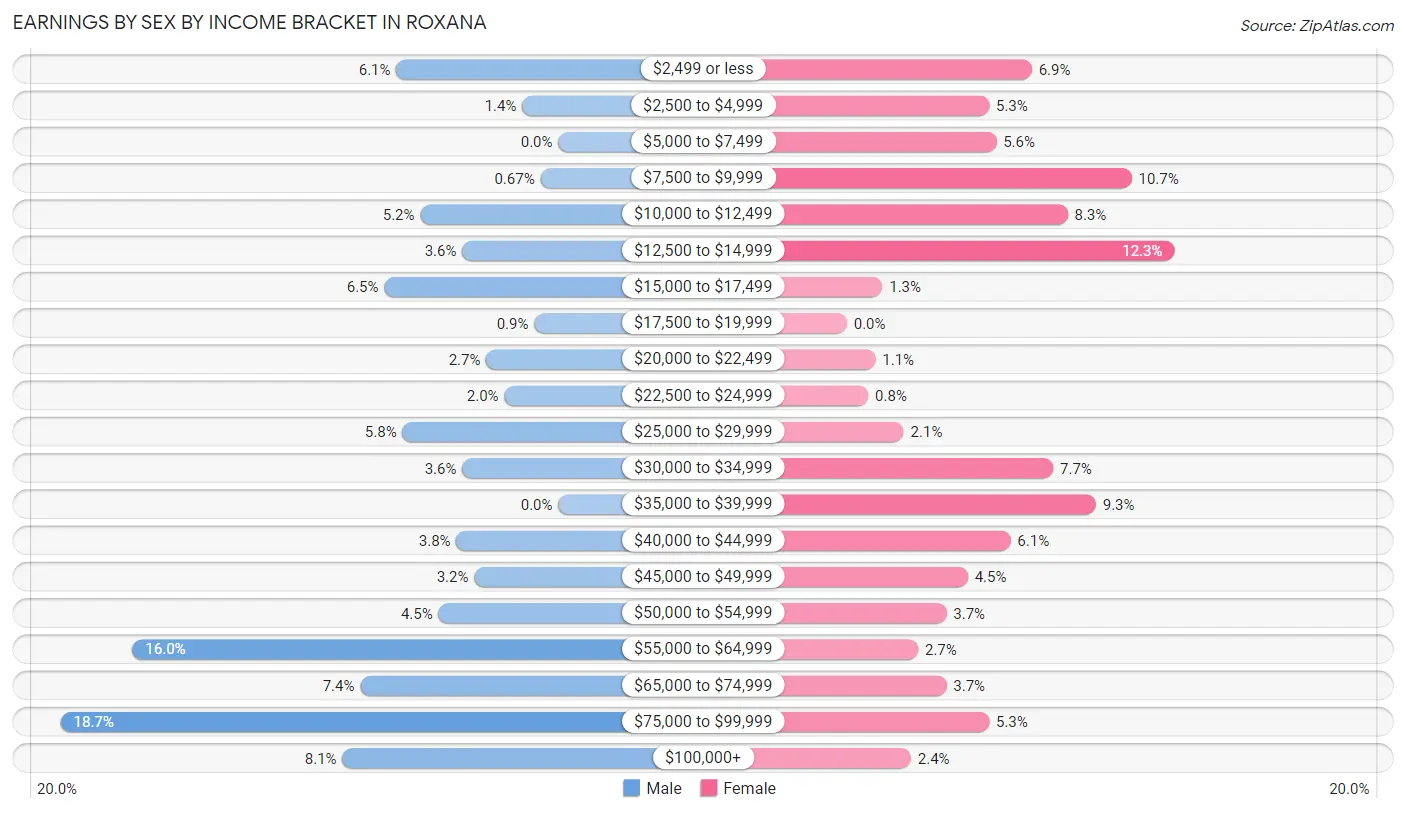
| Income | Male | Female |
| $2,499 or less | 27 (6.1%) | 26 (6.9%) |
| $2,500 to $4,999 | 6 (1.3%) | 20 (5.3%) |
| $5,000 to $7,499 | 0 (0.0%) | 21 (5.6%) |
| $7,500 to $9,999 | 3 (0.7%) | 40 (10.7%) |
| $10,000 to $12,499 | 23 (5.2%) | 31 (8.3%) |
| $12,500 to $14,999 | 16 (3.6%) | 46 (12.3%) |
| $15,000 to $17,499 | 29 (6.5%) | 5 (1.3%) |
| $17,500 to $19,999 | 4 (0.9%) | 0 (0.0%) |
| $20,000 to $22,499 | 12 (2.7%) | 4 (1.1%) |
| $22,500 to $24,999 | 9 (2.0%) | 3 (0.8%) |
| $25,000 to $29,999 | 26 (5.8%) | 8 (2.1%) |
| $30,000 to $34,999 | 16 (3.6%) | 29 (7.7%) |
| $35,000 to $39,999 | 0 (0.0%) | 35 (9.3%) |
| $40,000 to $44,999 | 17 (3.8%) | 23 (6.1%) |
| $45,000 to $49,999 | 14 (3.2%) | 17 (4.5%) |
| $50,000 to $54,999 | 20 (4.5%) | 14 (3.7%) |
| $55,000 to $64,999 | 71 (16.0%) | 10 (2.7%) |
| $65,000 to $74,999 | 33 (7.4%) | 14 (3.7%) |
| $75,000 to $99,999 | 83 (18.6%) | 20 (5.3%) |
| $100,000+ | 36 (8.1%) | 9 (2.4%) |
| Total | 445 (100.0%) | 375 (100.0%) |
Earnings by Sex by Educational Attainment in Roxana
Average earnings in Roxana are $58,138 for men and $32,292 for women, a difference of 44.5%. Men with an educational attainment of bachelor's degree enjoy the highest average annual earnings of $85,814, while those with high school diploma education earn the least with $47,000. Women with an educational attainment of graduate degree earn the most with the average annual earnings of $50,625, while those with less than high school education have the smallest earnings of $9,318.
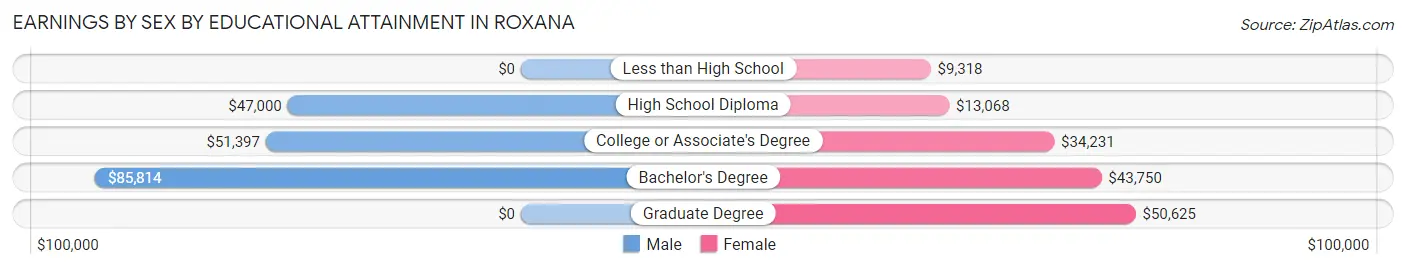
| Educational Attainment | Male Income | Female Income |
| Less than High School | - | - |
| High School Diploma | $47,000 | $13,068 |
| College or Associate's Degree | $51,397 | $34,231 |
| Bachelor's Degree | $85,814 | $43,750 |
| Graduate Degree | - | - |
| Total | $58,138 | $32,292 |
Family Income in Roxana
Family Income Brackets in Roxana
According to the Roxana family income data, there are 107 families falling into the $75,000 to $99,999 income range, which is the most common income bracket and makes up 22.2% of all families. Conversely, the $15,000 to $24,999 income bracket is the least frequent group with only 5 families (1.0%) belonging to this category.
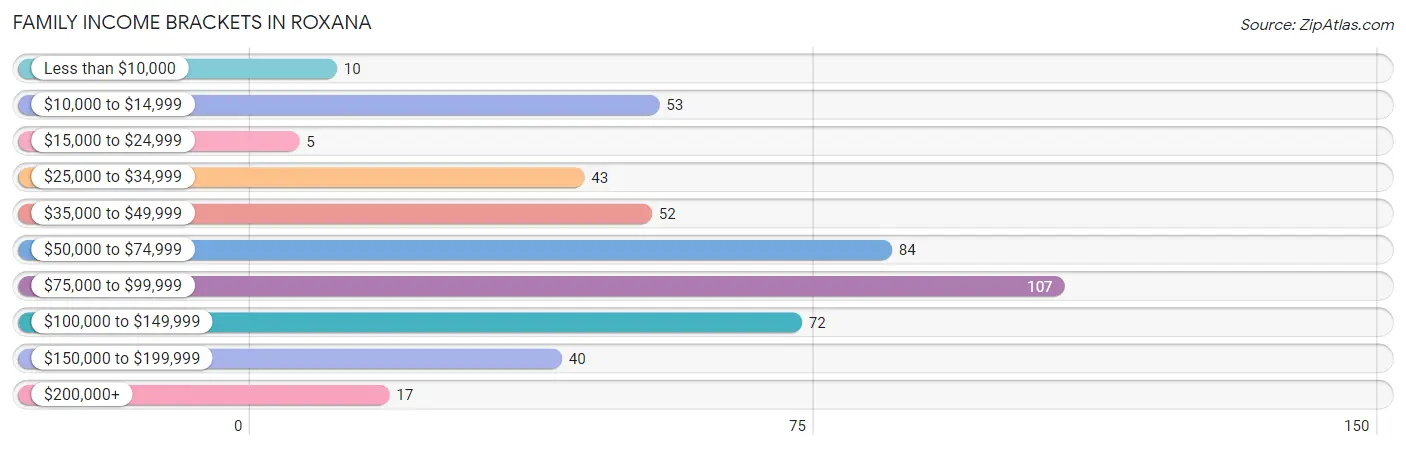
| Income Bracket | # Families | % Families |
| Less than $10,000 | 10 | 2.1% |
| $10,000 to $14,999 | 53 | 11.0% |
| $15,000 to $24,999 | 5 | 1.0% |
| $25,000 to $34,999 | 43 | 8.9% |
| $35,000 to $49,999 | 52 | 10.8% |
| $50,000 to $74,999 | 84 | 17.4% |
| $75,000 to $99,999 | 107 | 22.2% |
| $100,000 to $149,999 | 72 | 14.9% |
| $150,000 to $199,999 | 40 | 8.3% |
| $200,000+ | 17 | 3.5% |
Family Income by Famaliy Size in Roxana
3-person families (160 | 33.1%) account for the highest median family income in Roxana with $85,000 per family, while 2-person families (243 | 50.3%) have the highest median income of $36,406 per family member.
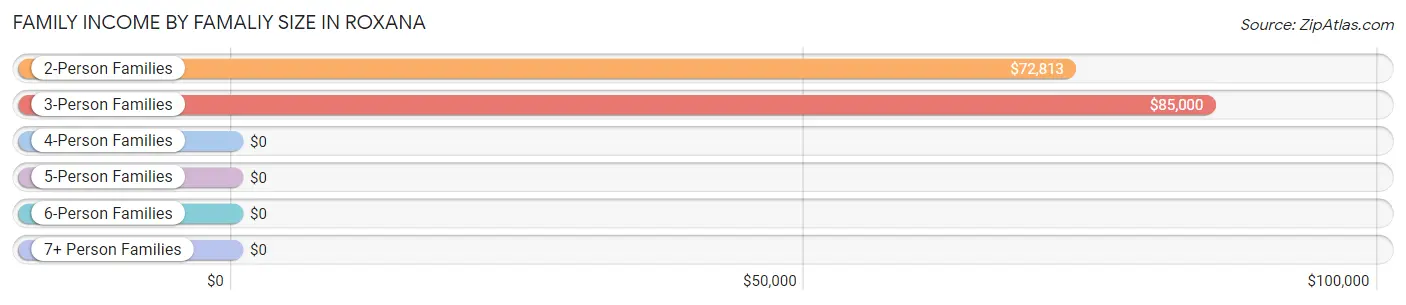
| Income Bracket | # Families | Median Income |
| 2-Person Families | 243 (50.3%) | $72,813 |
| 3-Person Families | 160 (33.1%) | $85,000 |
| 4-Person Families | 55 (11.4%) | $0 |
| 5-Person Families | 20 (4.1%) | $0 |
| 6-Person Families | 0 (0.0%) | $0 |
| 7+ Person Families | 5 (1.0%) | $0 |
| Total | 483 (100.0%) | $73,625 |
Family Income by Number of Earners in Roxana
The median family income in Roxana is $73,625, with families comprising 3+ earners (32) having the highest median family income of $156,875, while families with 1 earner (117) have the lowest median family income of $40,114, accounting for 6.6% and 24.2% of families, respectively.
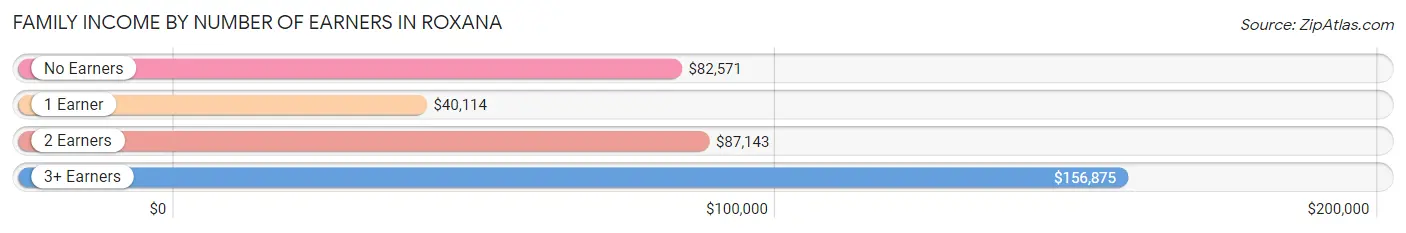
| Number of Earners | # Families | Median Income |
| No Earners | 98 (20.3%) | $82,571 |
| 1 Earner | 117 (24.2%) | $40,114 |
| 2 Earners | 236 (48.9%) | $87,143 |
| 3+ Earners | 32 (6.6%) | $156,875 |
| Total | 483 (100.0%) | $73,625 |
Household Income in Roxana
Household Income Brackets in Roxana
With 123 households falling in the category, the $50,000 to $74,999 income range is the most frequent in Roxana, accounting for 17.8% of all households. In contrast, only 13 households (1.9%) fall into the less than $10,000 income bracket, making it the least populous group.
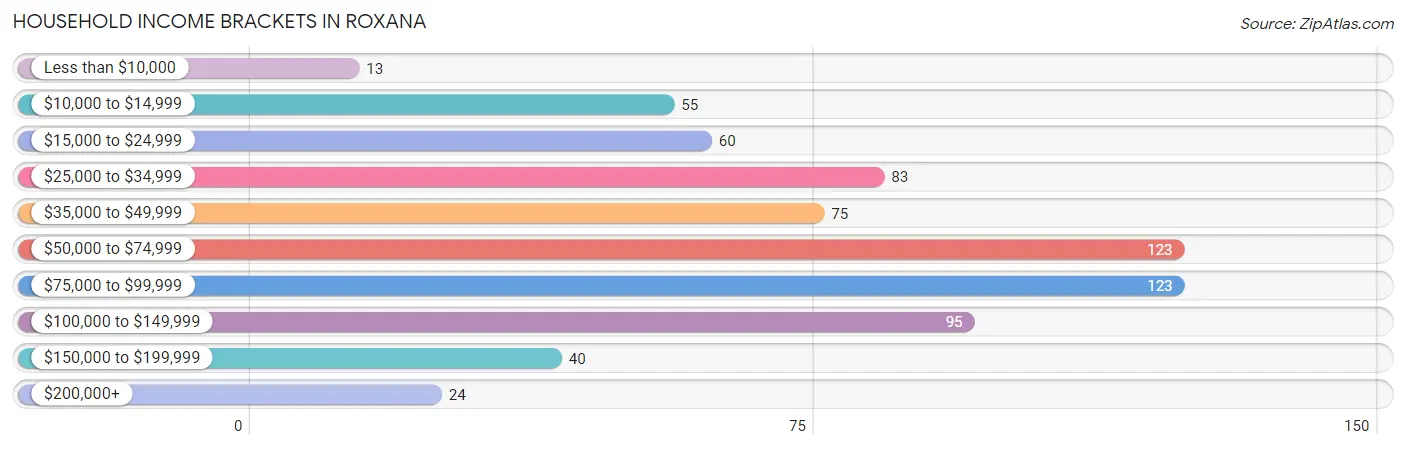
| Income Bracket | # Households | % Households |
| Less than $10,000 | 13 | 1.9% |
| $10,000 to $14,999 | 55 | 8.0% |
| $15,000 to $24,999 | 60 | 8.7% |
| $25,000 to $34,999 | 83 | 12.0% |
| $35,000 to $49,999 | 75 | 10.9% |
| $50,000 to $74,999 | 123 | 17.8% |
| $75,000 to $99,999 | 123 | 17.8% |
| $100,000 to $149,999 | 95 | 13.7% |
| $150,000 to $199,999 | 40 | 5.8% |
| $200,000+ | 24 | 3.5% |
Household Income by Householder Age in Roxana
The median household income in Roxana is $61,528, with the highest median household income of $68,819 found in the 45 to 64 years age bracket for the primary householder. A total of 235 households (34.0%) fall into this category. Meanwhile, the 15 to 24 years age bracket for the primary householder has the lowest median household income of $22,083, with 18 households (2.6%) in this group.
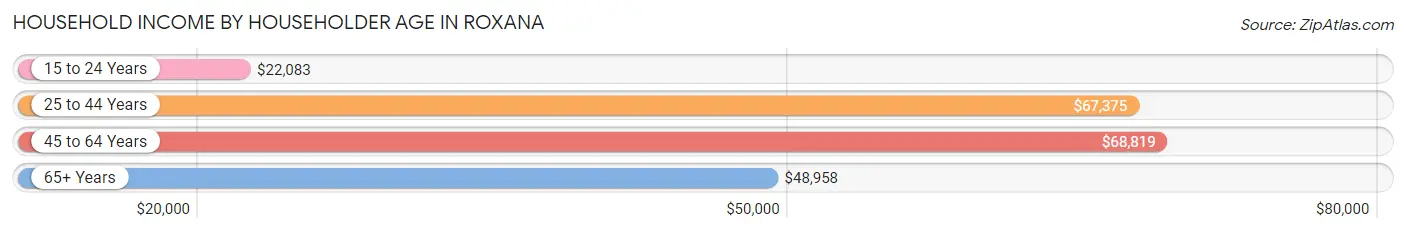
| Income Bracket | # Households | Median Income |
| 15 to 24 Years | 18 (2.6%) | $22,083 |
| 25 to 44 Years | 277 (40.1%) | $67,375 |
| 45 to 64 Years | 235 (34.0%) | $68,819 |
| 65+ Years | 161 (23.3%) | $48,958 |
| Total | 691 (100.0%) | $61,528 |
Poverty in Roxana
Income Below Poverty by Sex and Age in Roxana
With 14.0% poverty level for males and 21.7% for females among the residents of Roxana, 15 year old males and 5 year old females are the most vulnerable to poverty, with 8 males (72.7%) and 10 females (55.6%) in their respective age groups living below the poverty level.
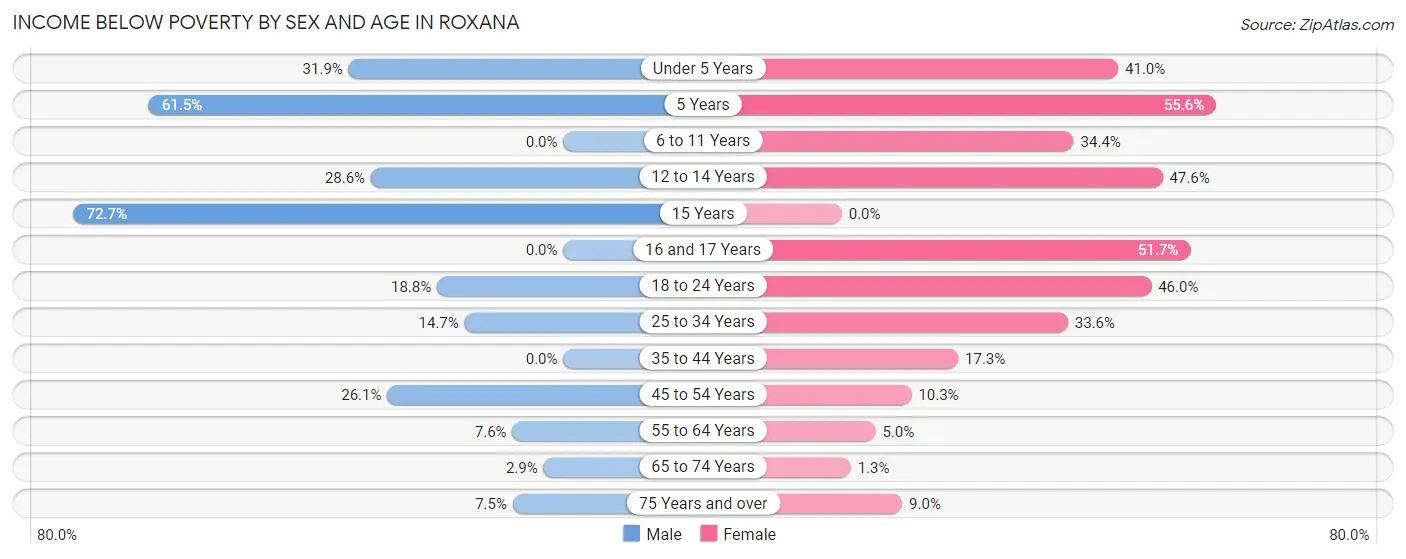
| Age Bracket | Male | Female |
| Under 5 Years | 22 (31.9%) | 16 (41.0%) |
| 5 Years | 8 (61.5%) | 10 (55.6%) |
| 6 to 11 Years | 0 (0.0%) | 21 (34.4%) |
| 12 to 14 Years | 6 (28.6%) | 10 (47.6%) |
| 15 Years | 8 (72.7%) | 0 (0.0%) |
| 16 and 17 Years | 0 (0.0%) | 15 (51.7%) |
| 18 to 24 Years | 6 (18.8%) | 17 (46.0%) |
| 25 to 34 Years | 17 (14.7%) | 47 (33.6%) |
| 35 to 44 Years | 0 (0.0%) | 19 (17.3%) |
| 45 to 54 Years | 23 (26.1%) | 6 (10.3%) |
| 55 to 64 Years | 9 (7.6%) | 7 (5.0%) |
| 65 to 74 Years | 2 (2.9%) | 1 (1.3%) |
| 75 Years and over | 3 (7.5%) | 6 (9.0%) |
| Total | 104 (14.0%) | 175 (21.7%) |
Income Above Poverty by Sex and Age in Roxana
According to the poverty statistics in Roxana, males aged 6 to 11 years and females aged 15 years are the age groups that are most secure financially, with 100.0% of males and 100.0% of females in these age groups living above the poverty line.
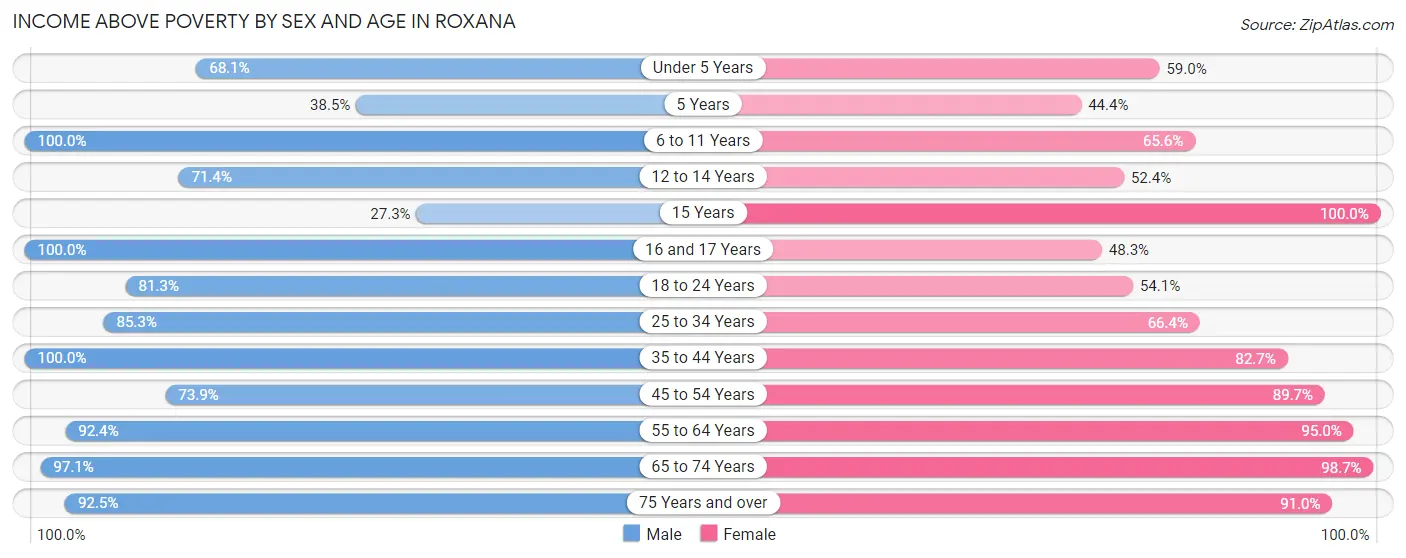
| Age Bracket | Male | Female |
| Under 5 Years | 47 (68.1%) | 23 (59.0%) |
| 5 Years | 5 (38.5%) | 8 (44.4%) |
| 6 to 11 Years | 27 (100.0%) | 40 (65.6%) |
| 12 to 14 Years | 15 (71.4%) | 11 (52.4%) |
| 15 Years | 3 (27.3%) | 11 (100.0%) |
| 16 and 17 Years | 13 (100.0%) | 14 (48.3%) |
| 18 to 24 Years | 26 (81.2%) | 20 (54.0%) |
| 25 to 34 Years | 99 (85.3%) | 93 (66.4%) |
| 35 to 44 Years | 125 (100.0%) | 91 (82.7%) |
| 45 to 54 Years | 65 (73.9%) | 52 (89.7%) |
| 55 to 64 Years | 110 (92.4%) | 133 (95.0%) |
| 65 to 74 Years | 66 (97.1%) | 74 (98.7%) |
| 75 Years and over | 37 (92.5%) | 61 (91.0%) |
| Total | 638 (86.0%) | 631 (78.3%) |
Income Below Poverty Among Married-Couple Families in Roxana
The poverty statistics for married-couple families in Roxana show that 5.9% or 23 of the total 391 families live below the poverty line. Families with 1 or 2 children have the highest poverty rate of 9.2%, comprising of 12 families. On the other hand, families with 3 or 4 children have the lowest poverty rate of 0.0%, which includes 0 families.
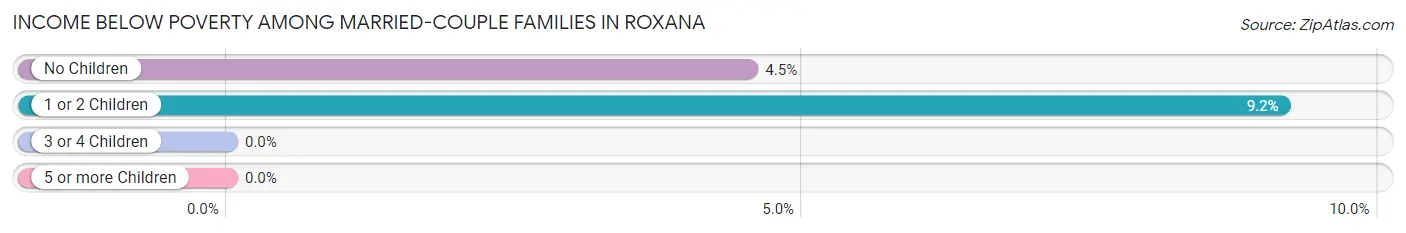
| Children | Above Poverty | Below Poverty |
| No Children | 232 (95.5%) | 11 (4.5%) |
| 1 or 2 Children | 119 (90.8%) | 12 (9.2%) |
| 3 or 4 Children | 12 (100.0%) | 0 (0.0%) |
| 5 or more Children | 5 (100.0%) | 0 (0.0%) |
| Total | 368 (94.1%) | 23 (5.9%) |
Income Below Poverty Among Single-Parent Households in Roxana
According to the poverty data in Roxana, 58.3% or 14 single-father households and 55.9% or 38 single-mother households are living below the poverty line. Among single-father households, those with 1 or 2 children have the highest poverty rate, with 14 households (87.5%) experiencing poverty. Likewise, among single-mother households, those with 3 or 4 children have the highest poverty rate, with 19 households (79.2%) falling below the poverty line.
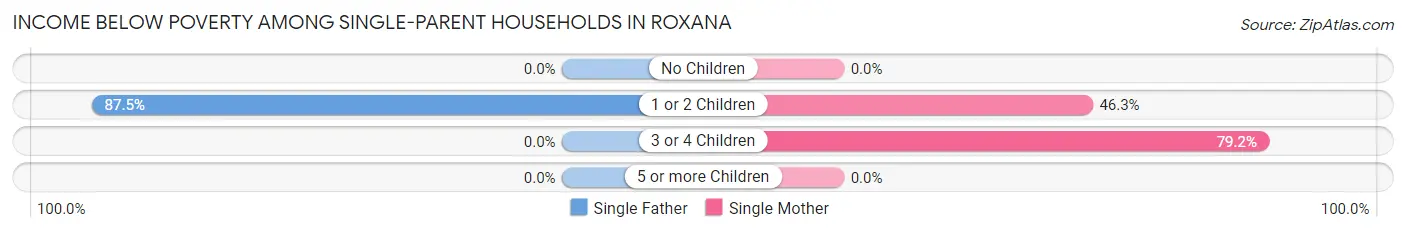
| Children | Single Father | Single Mother |
| No Children | 0 (0.0%) | 0 (0.0%) |
| 1 or 2 Children | 14 (87.5%) | 19 (46.3%) |
| 3 or 4 Children | 0 (0.0%) | 19 (79.2%) |
| 5 or more Children | 0 (0.0%) | 0 (0.0%) |
| Total | 14 (58.3%) | 38 (55.9%) |
Income Below Poverty Among Married-Couple vs Single-Parent Households in Roxana
The poverty data for Roxana shows that 23 of the married-couple family households (5.9%) and 52 of the single-parent households (56.5%) are living below the poverty level. Within the married-couple family households, those with 1 or 2 children have the highest poverty rate, with 12 households (9.2%) falling below the poverty line. Among the single-parent households, those with 3 or 4 children have the highest poverty rate, with 19 household (79.2%) living below poverty.
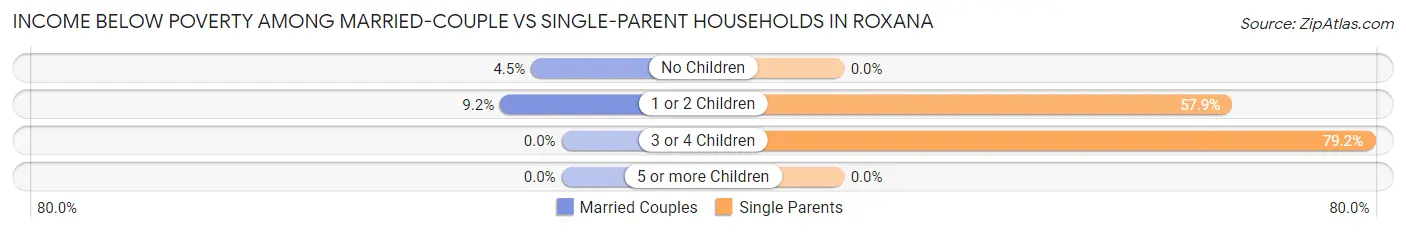
| Children | Married-Couple Families | Single-Parent Households |
| No Children | 11 (4.5%) | 0 (0.0%) |
| 1 or 2 Children | 12 (9.2%) | 33 (57.9%) |
| 3 or 4 Children | 0 (0.0%) | 19 (79.2%) |
| 5 or more Children | 0 (0.0%) | 0 (0.0%) |
| Total | 23 (5.9%) | 52 (56.5%) |
Race in Roxana
The most populous races in Roxana are White / Caucasian (1,491 | 95.0%), Black / African American (48 | 3.1%), and Asian (14 | 0.9%).
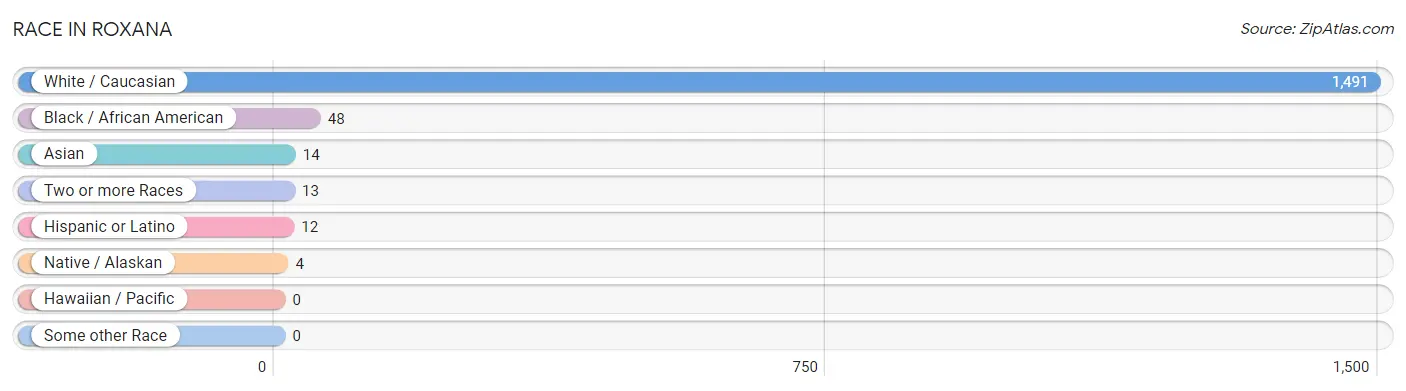
| Race | # Population | % Population |
| Asian | 14 | 0.9% |
| Black / African American | 48 | 3.1% |
| Hawaiian / Pacific | 0 | 0.0% |
| Hispanic or Latino | 12 | 0.8% |
| Native / Alaskan | 4 | 0.3% |
| White / Caucasian | 1,491 | 95.0% |
| Two or more Races | 13 | 0.8% |
| Some other Race | 0 | 0.0% |
| Total | 1,570 | 100.0% |
Ancestry in Roxana
The most populous ancestries reported in Roxana are German (477 | 30.4%), Irish (262 | 16.7%), English (148 | 9.4%), Italian (143 | 9.1%), and American (115 | 7.3%), together accounting for 72.9% of all Roxana residents.
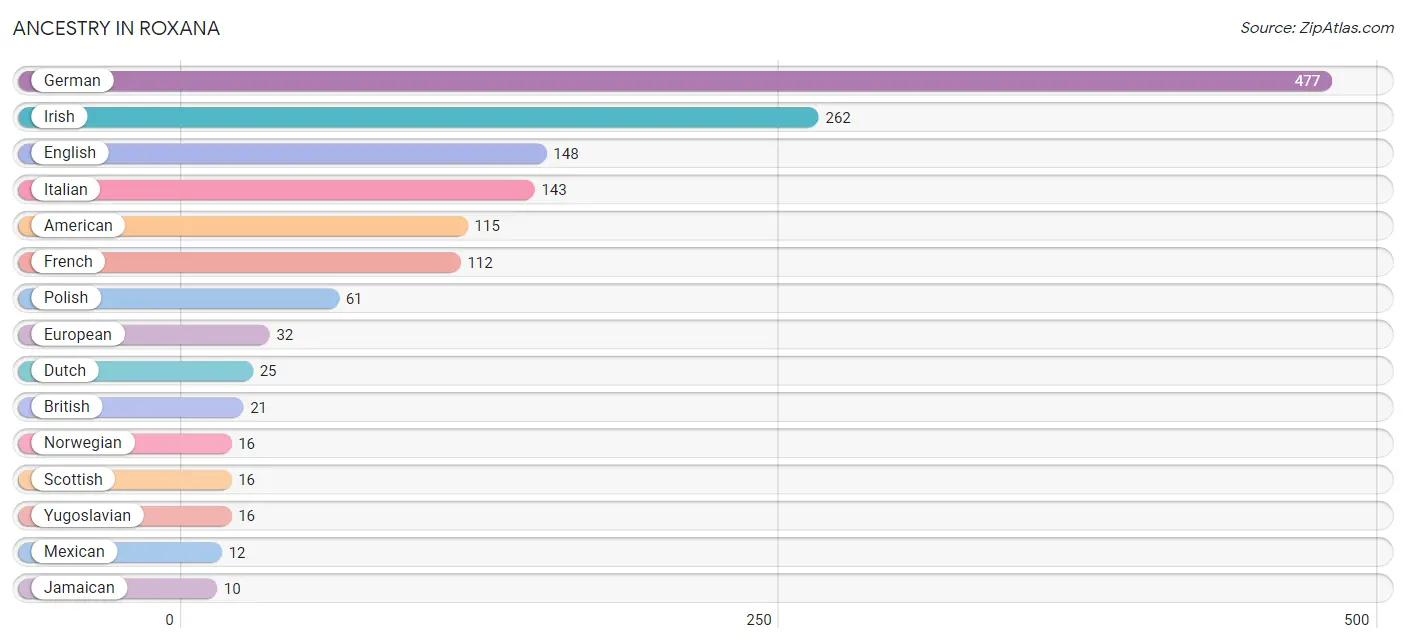
| Ancestry | # Population | % Population |
| American | 115 | 7.3% |
| British | 21 | 1.3% |
| Canadian | 4 | 0.3% |
| Cherokee | 3 | 0.2% |
| Czech | 4 | 0.3% |
| Danish | 8 | 0.5% |
| Dutch | 25 | 1.6% |
| English | 148 | 9.4% |
| European | 32 | 2.0% |
| French | 112 | 7.1% |
| German | 477 | 30.4% |
| Indian (Asian) | 6 | 0.4% |
| Irish | 262 | 16.7% |
| Italian | 143 | 9.1% |
| Jamaican | 10 | 0.6% |
| Korean | 7 | 0.4% |
| Lithuanian | 8 | 0.5% |
| Menominee | 1 | 0.1% |
| Mexican | 12 | 0.8% |
| Native Hawaiian | 4 | 0.3% |
| Norwegian | 16 | 1.0% |
| Polish | 61 | 3.9% |
| Russian | 9 | 0.6% |
| Scotch-Irish | 10 | 0.6% |
| Scottish | 16 | 1.0% |
| Serbian | 8 | 0.5% |
| Sri Lankan | 1 | 0.1% |
| Swedish | 3 | 0.2% |
| Swiss | 2 | 0.1% |
| Ukrainian | 3 | 0.2% |
| Yugoslavian | 16 | 1.0% |
| Yup'ik | 3 | 0.2% | View All 32 Rows |
Immigrants in Roxana
The most numerous immigrant groups reported in Roxana came from Asia (14 | 0.9%), South Eastern Asia (8 | 0.5%), Philippines (7 | 0.4%), China (6 | 0.4%), and Eastern Asia (6 | 0.4%), together accounting for 2.6% of all Roxana residents.
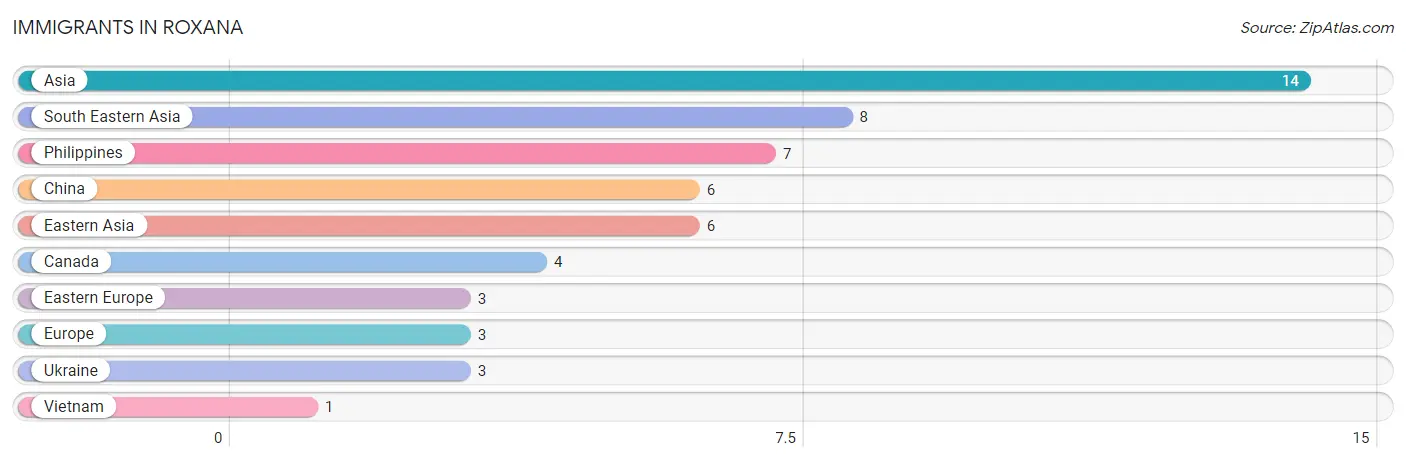
| Immigration Origin | # Population | % Population |
| Asia | 14 | 0.9% |
| Canada | 4 | 0.3% |
| China | 6 | 0.4% |
| Eastern Asia | 6 | 0.4% |
| Eastern Europe | 3 | 0.2% |
| Europe | 3 | 0.2% |
| Philippines | 7 | 0.4% |
| South Eastern Asia | 8 | 0.5% |
| Ukraine | 3 | 0.2% |
| Vietnam | 1 | 0.1% | View All 10 Rows |
Sex and Age in Roxana
Sex and Age in Roxana
The most populous age groups in Roxana are 40 to 44 Years (91 | 12.1%) for men and 55 to 59 Years (91 | 11.1%) for women.
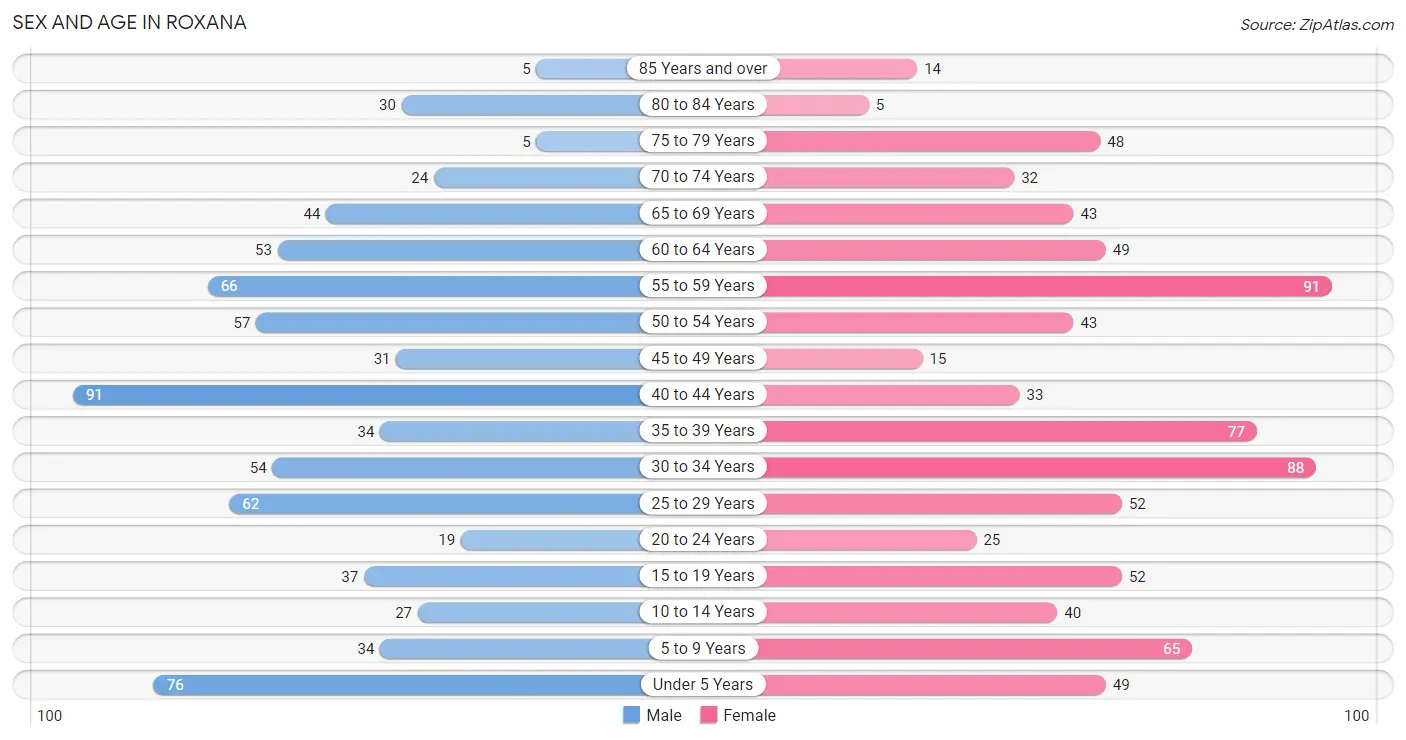
| Age Bracket | Male | Female |
| Under 5 Years | 76 (10.2%) | 49 (6.0%) |
| 5 to 9 Years | 34 (4.5%) | 65 (7.9%) |
| 10 to 14 Years | 27 (3.6%) | 40 (4.9%) |
| 15 to 19 Years | 37 (4.9%) | 52 (6.3%) |
| 20 to 24 Years | 19 (2.5%) | 25 (3.0%) |
| 25 to 29 Years | 62 (8.3%) | 52 (6.3%) |
| 30 to 34 Years | 54 (7.2%) | 88 (10.7%) |
| 35 to 39 Years | 34 (4.5%) | 77 (9.4%) |
| 40 to 44 Years | 91 (12.1%) | 33 (4.0%) |
| 45 to 49 Years | 31 (4.1%) | 15 (1.8%) |
| 50 to 54 Years | 57 (7.6%) | 43 (5.2%) |
| 55 to 59 Years | 66 (8.8%) | 91 (11.1%) |
| 60 to 64 Years | 53 (7.1%) | 49 (6.0%) |
| 65 to 69 Years | 44 (5.9%) | 43 (5.2%) |
| 70 to 74 Years | 24 (3.2%) | 32 (3.9%) |
| 75 to 79 Years | 5 (0.7%) | 48 (5.9%) |
| 80 to 84 Years | 30 (4.0%) | 5 (0.6%) |
| 85 Years and over | 5 (0.7%) | 14 (1.7%) |
| Total | 749 (100.0%) | 821 (100.0%) |
Families and Households in Roxana
Median Family Size in Roxana
The median family size in Roxana is 2.62 persons per family, with single female/mother families (68 | 14.1%) accounting for the largest median family size of 2.91 persons per family. On the other hand, single male/father families (24 | 5.0%) represent the smallest median family size with 2.21 persons per family.
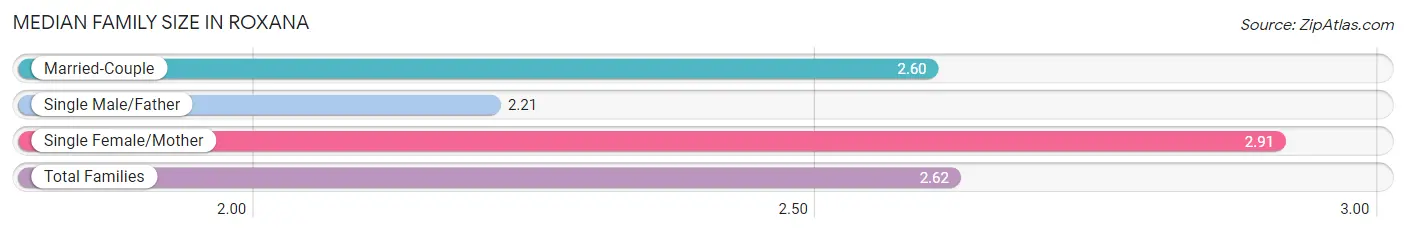
| Family Type | # Families | Family Size |
| Married-Couple | 391 (80.9%) | 2.60 |
| Single Male/Father | 24 (5.0%) | 2.21 |
| Single Female/Mother | 68 (14.1%) | 2.91 |
| Total Families | 483 (100.0%) | 2.62 |
Median Household Size in Roxana
The median household size in Roxana is 2.27 persons per household, with single female/mother households (68 | 9.8%) accounting for the largest median household size of 3.22 persons per household. non-family households (208 | 30.1%) represent the smallest median household size with 1.29 persons per household.
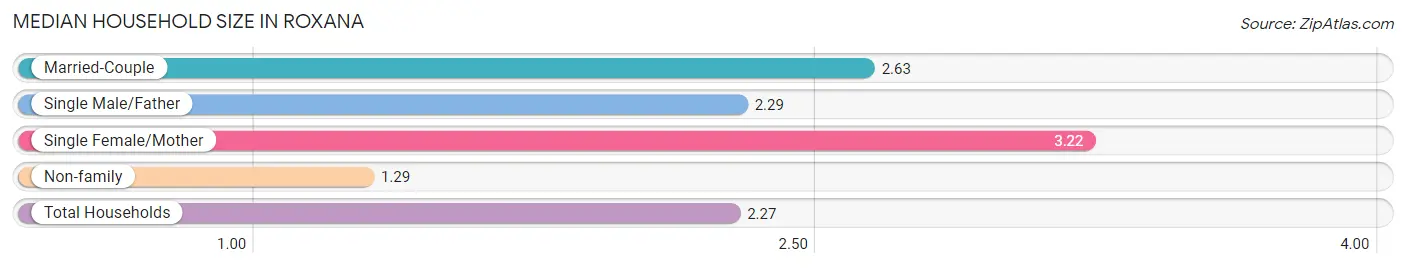
| Household Type | # Households | Household Size |
| Married-Couple | 391 (56.6%) | 2.63 |
| Single Male/Father | 24 (3.5%) | 2.29 |
| Single Female/Mother | 68 (9.8%) | 3.22 |
| Non-family | 208 (30.1%) | 1.29 |
| Total Households | 691 (100.0%) | 2.27 |
Household Size by Marriage Status in Roxana
Out of a total of 691 households in Roxana, 483 (69.9%) are family households, while 208 (30.1%) are nonfamily households. The most numerous type of family households are 2-person households, comprising 232, and the most common type of nonfamily households are 1-person households, comprising 164.
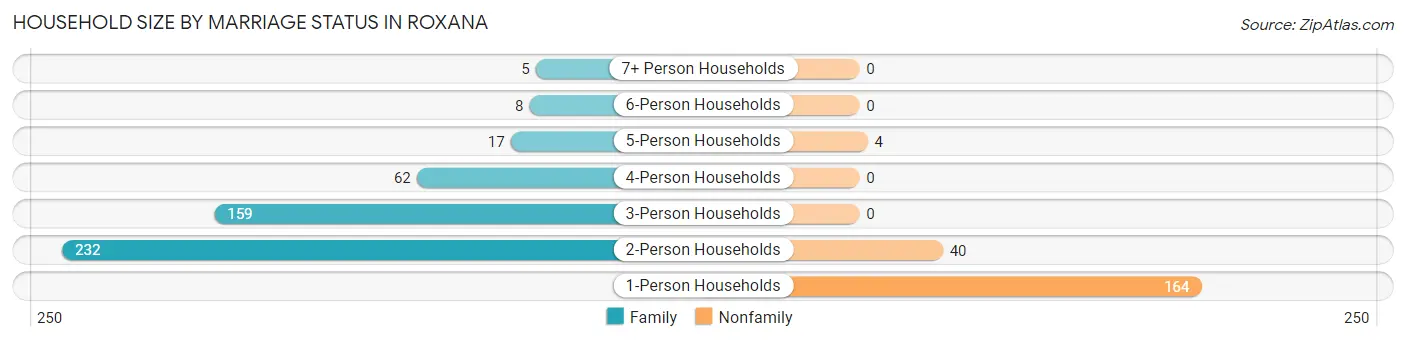
| Household Size | Family Households | Nonfamily Households |
| 1-Person Households | - | 164 (23.7%) |
| 2-Person Households | 232 (33.6%) | 40 (5.8%) |
| 3-Person Households | 159 (23.0%) | 0 (0.0%) |
| 4-Person Households | 62 (9.0%) | 0 (0.0%) |
| 5-Person Households | 17 (2.5%) | 4 (0.6%) |
| 6-Person Households | 8 (1.2%) | 0 (0.0%) |
| 7+ Person Households | 5 (0.7%) | 0 (0.0%) |
| Total | 483 (69.9%) | 208 (30.1%) |
Female Fertility in Roxana
Fertility by Age in Roxana
Average fertility rate in Roxana is 59.0 births per 1,000 women. Women in the age bracket of 20 to 34 years have the highest fertility rate with 109.0 births per 1,000 women. Women in the age bracket of 20 to 34 years acount for 85.7% of all women with births.
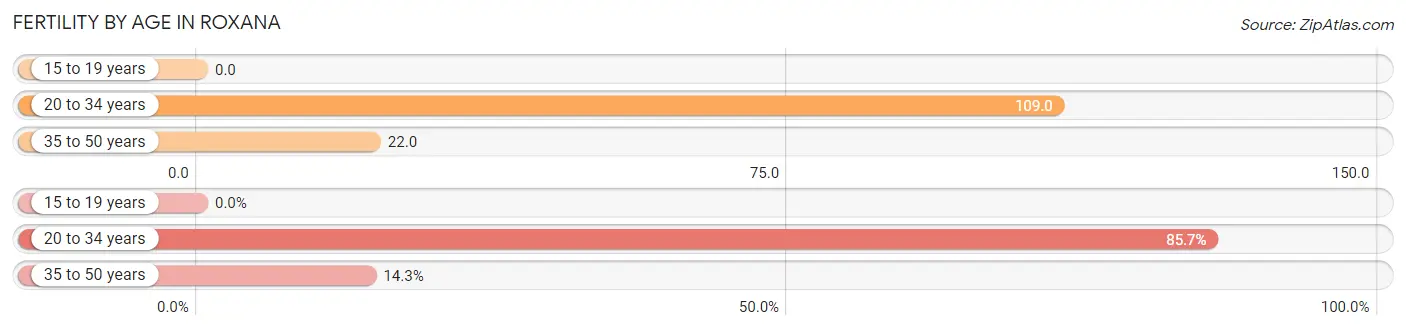
| Age Bracket | Women with Births | Births / 1,000 Women |
| 15 to 19 years | 0 (0.0%) | 0.0 |
| 20 to 34 years | 18 (85.7%) | 109.0 |
| 35 to 50 years | 3 (14.3%) | 22.0 |
| Total | 21 (100.0%) | 59.0 |
Fertility by Age by Marriage Status in Roxana
38.1% of women with births (21) in Roxana are married. The highest percentage of unmarried women with births falls into 20 to 34 years age bracket with 72.2% of them unmarried at the time of birth, while the lowest percentage of unmarried women with births belong to 35 to 50 years age bracket with 0.0% of them unmarried.
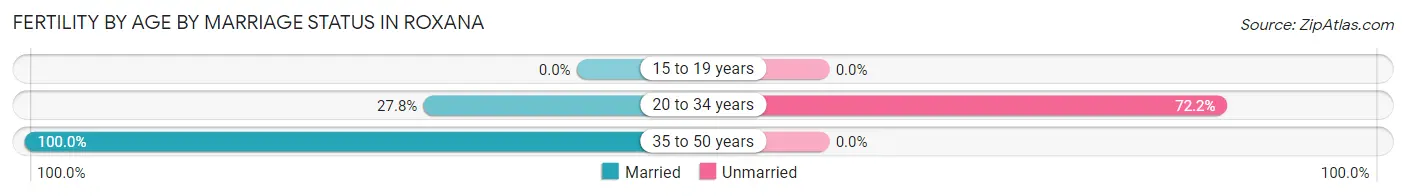
| Age Bracket | Married | Unmarried |
| 15 to 19 years | 0 (0.0%) | 0 (0.0%) |
| 20 to 34 years | 5 (27.8%) | 13 (72.2%) |
| 35 to 50 years | 3 (100.0%) | 0 (0.0%) |
| Total | 8 (38.1%) | 13 (61.9%) |
Fertility by Education in Roxana
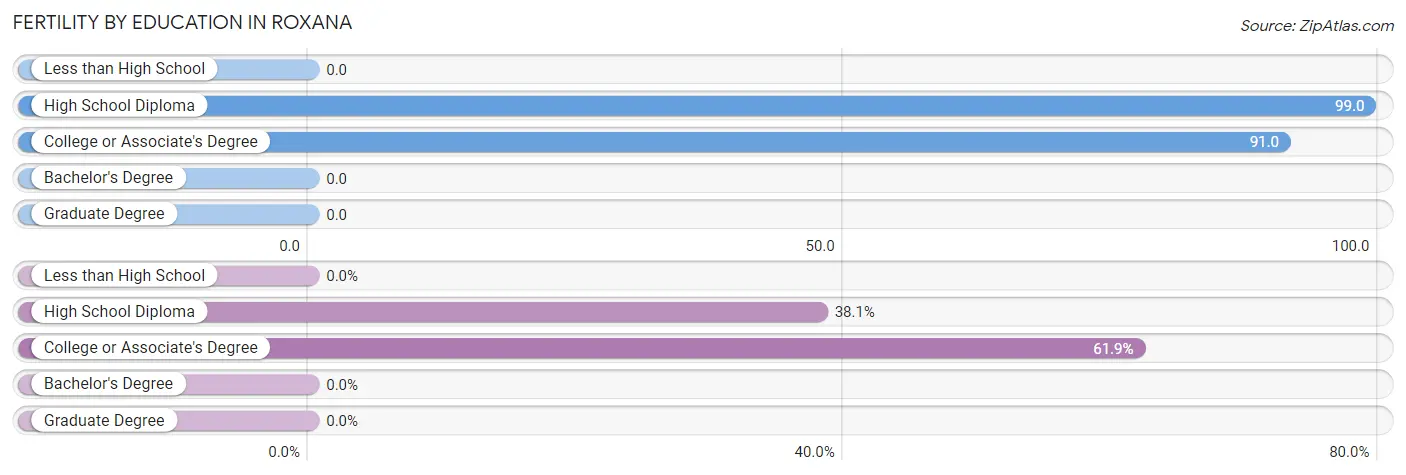
| Educational Attainment | Women with Births | Births / 1,000 Women |
| Less than High School | 0 (0.0%) | 0.0 |
| High School Diploma | 8 (38.1%) | 99.0 |
| College or Associate's Degree | 13 (61.9%) | 91.0 |
| Bachelor's Degree | 0 (0.0%) | 0.0 |
| Graduate Degree | 0 (0.0%) | 0.0 |
| Total | 21 (100.0%) | 59.0 |
Fertility by Education by Marriage Status in Roxana
61.9% of women with births in Roxana are unmarried. Women with the educational attainment of college or associate's degree are most likely to be married with 61.5% of them married at childbirth, while women with the educational attainment of high school diploma are least likely to be married with 100.0% of them unmarried at childbirth.
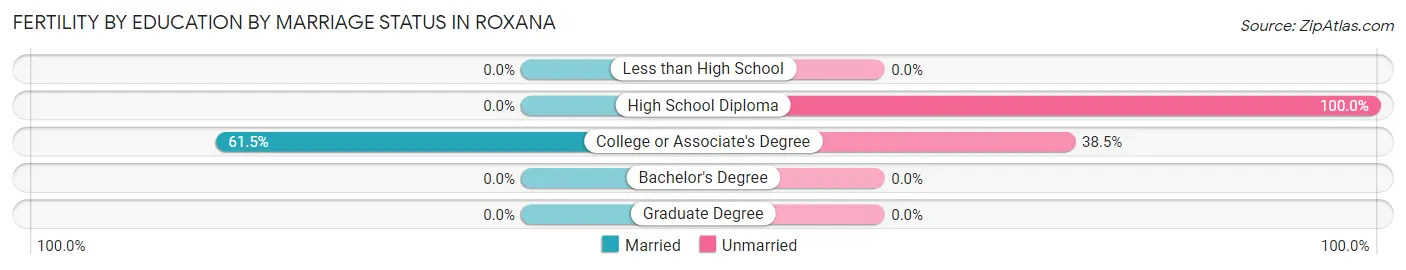
| Educational Attainment | Married | Unmarried |
| Less than High School | 0 (0.0%) | 0 (0.0%) |
| High School Diploma | 0 (0.0%) | 8 (100.0%) |
| College or Associate's Degree | 8 (61.5%) | 5 (38.5%) |
| Bachelor's Degree | 0 (0.0%) | 0 (0.0%) |
| Graduate Degree | 0 (0.0%) | 0 (0.0%) |
| Total | 8 (38.1%) | 13 (61.9%) |
Employment Characteristics in Roxana
Employment by Class of Employer in Roxana
Among the 728 employed individuals in Roxana, private company employees (534 | 73.4%), local government employees (81 | 11.1%), and not-for-profit organizations (72 | 9.9%) make up the most common classes of employment.
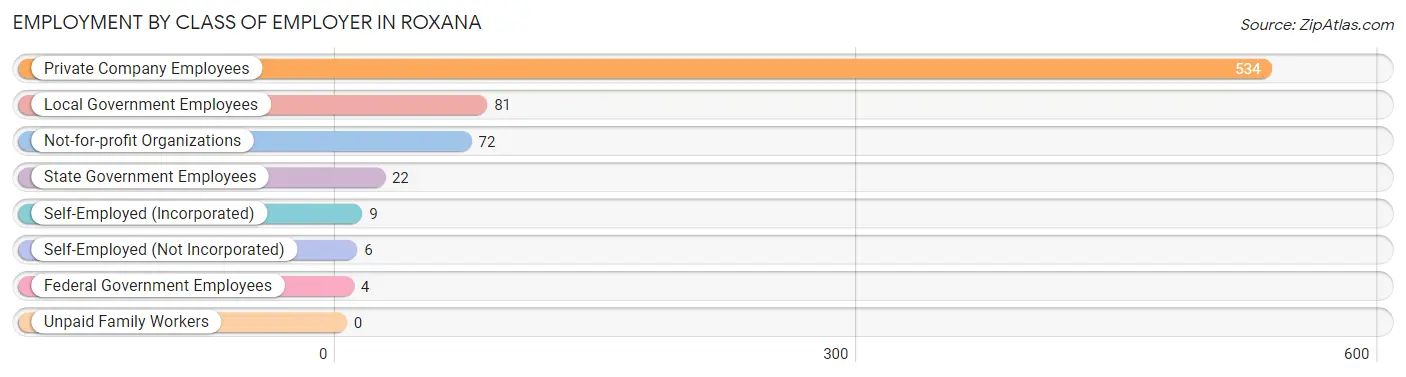
| Employer Class | # Employees | % Employees |
| Private Company Employees | 534 | 73.4% |
| Self-Employed (Incorporated) | 9 | 1.2% |
| Self-Employed (Not Incorporated) | 6 | 0.8% |
| Not-for-profit Organizations | 72 | 9.9% |
| Local Government Employees | 81 | 11.1% |
| State Government Employees | 22 | 3.0% |
| Federal Government Employees | 4 | 0.5% |
| Unpaid Family Workers | 0 | 0.0% |
| Total | 728 | 100.0% |
Employment Status by Age in Roxana
According to the labor force statistics for Roxana, out of the total population over 16 years of age (1,257), 60.6% or 762 individuals are in the labor force, with 3.0% or 23 of them unemployed. The age group with the highest labor force participation rate is 25 to 29 years, with 93.9% or 107 individuals in the labor force. Within the labor force, the 45 to 54 years age range has the highest percentage of unemployed individuals, with 17.9% or 20 of them being unemployed.
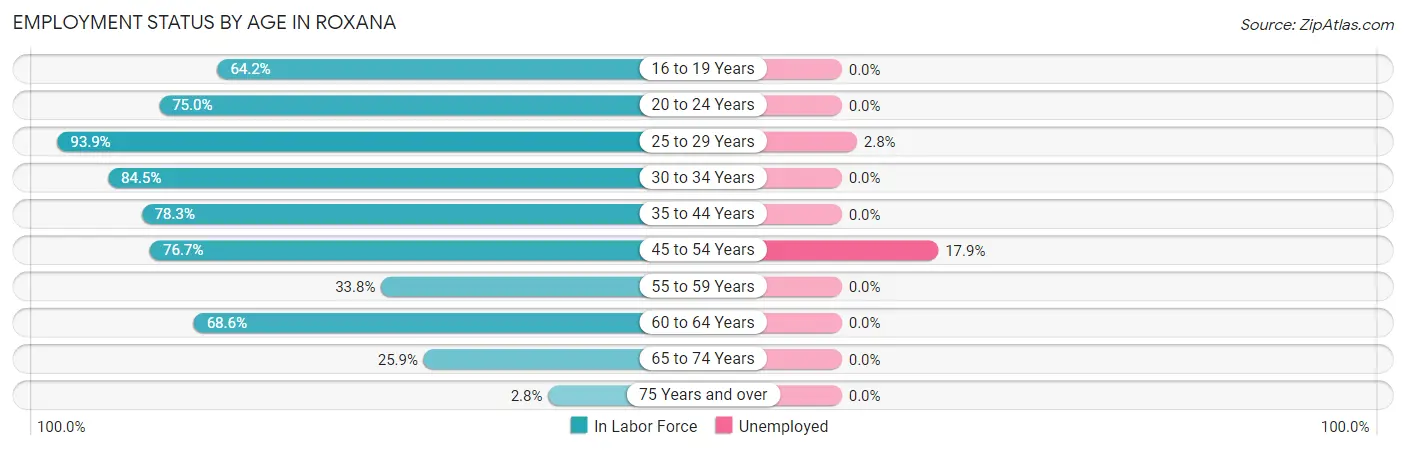
| Age Bracket | In Labor Force | Unemployed |
| 16 to 19 Years | 43 (64.2%) | 0 (0.0%) |
| 20 to 24 Years | 33 (75.0%) | 0 (0.0%) |
| 25 to 29 Years | 107 (93.9%) | 3 (2.8%) |
| 30 to 34 Years | 120 (84.5%) | 0 (0.0%) |
| 35 to 44 Years | 184 (78.3%) | 0 (0.0%) |
| 45 to 54 Years | 112 (76.7%) | 20 (17.9%) |
| 55 to 59 Years | 53 (33.8%) | 0 (0.0%) |
| 60 to 64 Years | 70 (68.6%) | 0 (0.0%) |
| 65 to 74 Years | 37 (25.9%) | 0 (0.0%) |
| 75 Years and over | 3 (2.8%) | 0 (0.0%) |
| Total | 762 (60.6%) | 23 (3.0%) |
Employment Status by Educational Attainment in Roxana
According to labor force statistics for Roxana, 72.1% of individuals (646) out of the total population between 25 and 64 years of age (896) are in the labor force, with 3.6% or 23 of them being unemployed. The group with the highest labor force participation rate are those with the educational attainment of bachelor's degree or higher, with 97.7% or 171 individuals in the labor force. Within the labor force, individuals with college / associate degree education have the highest percentage of unemployment, with 7.2% or 20 of them being unemployed.
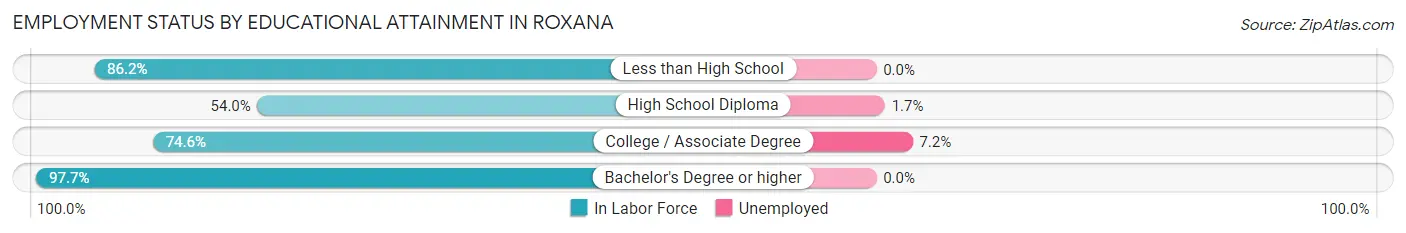
| Educational Attainment | In Labor Force | Unemployed |
| Less than High School | 25 (86.2%) | 0 (0.0%) |
| High School Diploma | 174 (54.0%) | 5 (1.7%) |
| College / Associate Degree | 276 (74.6%) | 27 (7.2%) |
| Bachelor's Degree or higher | 171 (97.7%) | 0 (0.0%) |
| Total | 646 (72.1%) | 32 (3.6%) |
Employment Occupations by Sex in Roxana
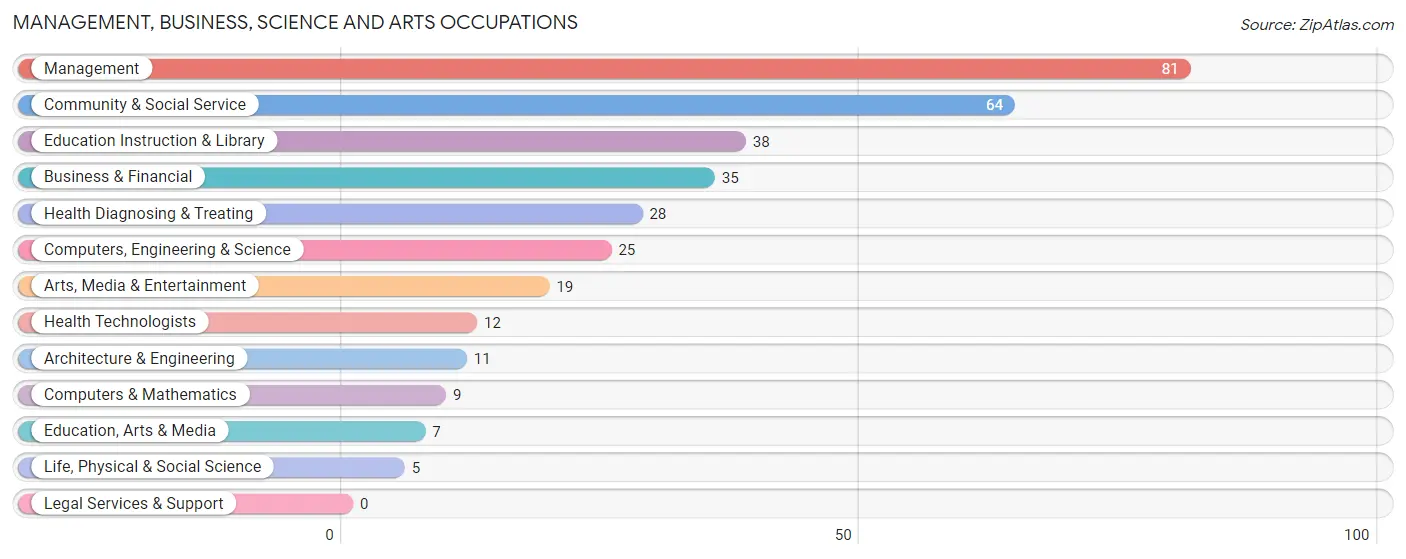
Management, Business, Science and Arts Occupations
The most common Management, Business, Science and Arts occupations in Roxana are Management (81 | 11.0%), Community & Social Service (64 | 8.7%), Education Instruction & Library (38 | 5.1%), Business & Financial (35 | 4.7%), and Health Diagnosing & Treating (28 | 3.8%).
Management, Business, Science and Arts Occupations by Sex
Within the Management, Business, Science and Arts occupations in Roxana, the most male-oriented occupations are Architecture & Engineering (100.0%), Life, Physical & Social Science (100.0%), and Arts, Media & Entertainment (100.0%), while the most female-oriented occupations are Education, Arts & Media (100.0%), Health Diagnosing & Treating (100.0%), and Health Technologists (100.0%).
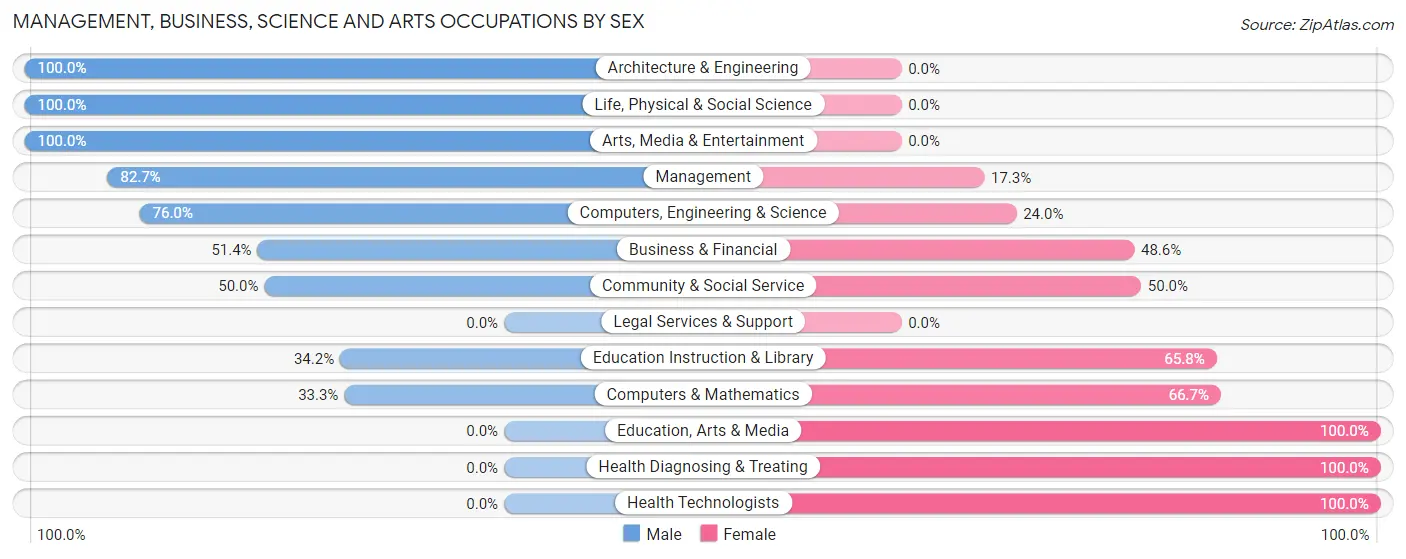
| Occupation | Male | Female |
| Management | 67 (82.7%) | 14 (17.3%) |
| Business & Financial | 18 (51.4%) | 17 (48.6%) |
| Computers, Engineering & Science | 19 (76.0%) | 6 (24.0%) |
| Computers & Mathematics | 3 (33.3%) | 6 (66.7%) |
| Architecture & Engineering | 11 (100.0%) | 0 (0.0%) |
| Life, Physical & Social Science | 5 (100.0%) | 0 (0.0%) |
| Community & Social Service | 32 (50.0%) | 32 (50.0%) |
| Education, Arts & Media | 0 (0.0%) | 7 (100.0%) |
| Legal Services & Support | 0 (0.0%) | 0 (0.0%) |
| Education Instruction & Library | 13 (34.2%) | 25 (65.8%) |
| Arts, Media & Entertainment | 19 (100.0%) | 0 (0.0%) |
| Health Diagnosing & Treating | 0 (0.0%) | 28 (100.0%) |
| Health Technologists | 0 (0.0%) | 12 (100.0%) |
| Total (Category) | 136 (58.4%) | 97 (41.6%) |
| Total (Overall) | 410 (55.5%) | 329 (44.5%) |
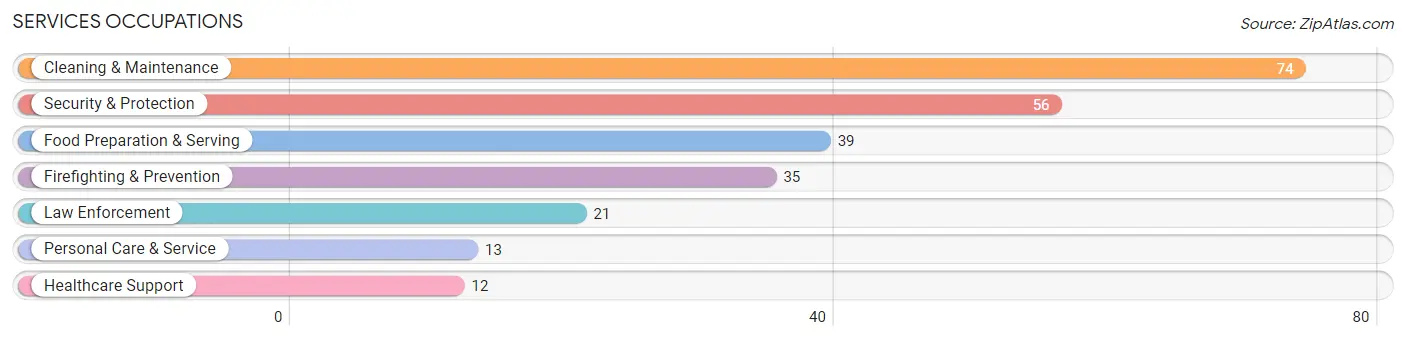
Services Occupations
The most common Services occupations in Roxana are Cleaning & Maintenance (74 | 10.0%), Security & Protection (56 | 7.6%), Food Preparation & Serving (39 | 5.3%), Firefighting & Prevention (35 | 4.7%), and Law Enforcement (21 | 2.8%).
Services Occupations by Sex
Within the Services occupations in Roxana, the most male-oriented occupations are Firefighting & Prevention (100.0%), Security & Protection (94.6%), and Law Enforcement (85.7%), while the most female-oriented occupations are Healthcare Support (100.0%), Personal Care & Service (76.9%), and Food Preparation & Serving (61.5%).
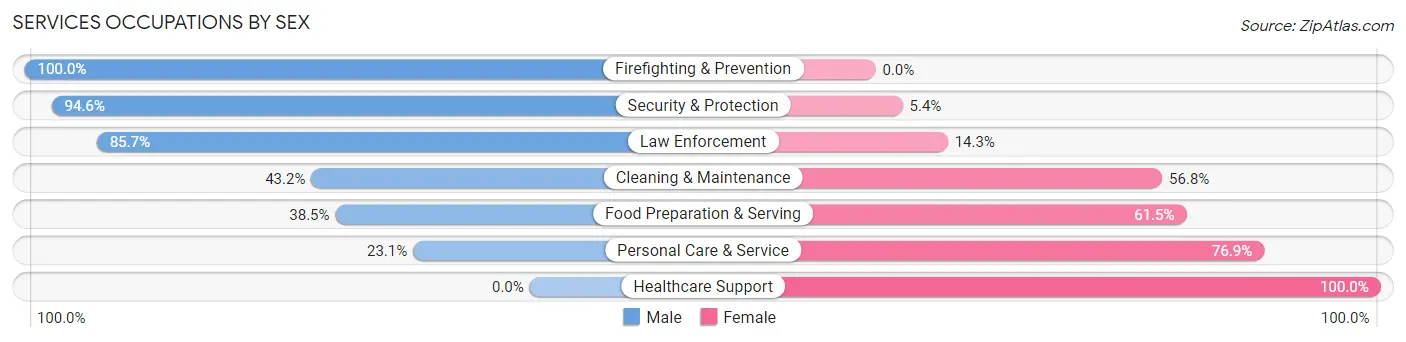
| Occupation | Male | Female |
| Healthcare Support | 0 (0.0%) | 12 (100.0%) |
| Security & Protection | 53 (94.6%) | 3 (5.4%) |
| Firefighting & Prevention | 35 (100.0%) | 0 (0.0%) |
| Law Enforcement | 18 (85.7%) | 3 (14.3%) |
| Food Preparation & Serving | 15 (38.5%) | 24 (61.5%) |
| Cleaning & Maintenance | 32 (43.2%) | 42 (56.8%) |
| Personal Care & Service | 3 (23.1%) | 10 (76.9%) |
| Total (Category) | 103 (53.1%) | 91 (46.9%) |
| Total (Overall) | 410 (55.5%) | 329 (44.5%) |
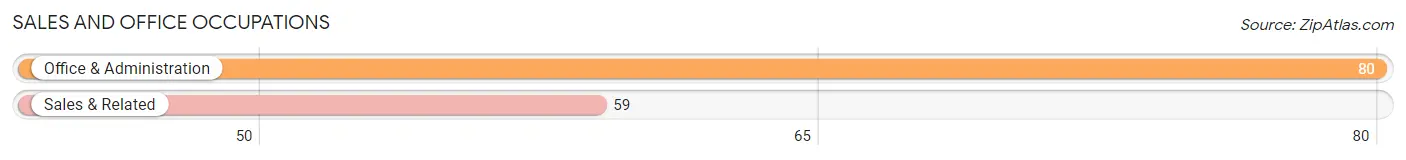
Sales and Office Occupations
The most common Sales and Office occupations in Roxana are Office & Administration (80 | 10.8%), and Sales & Related (59 | 8.0%).
Sales and Office Occupations by Sex
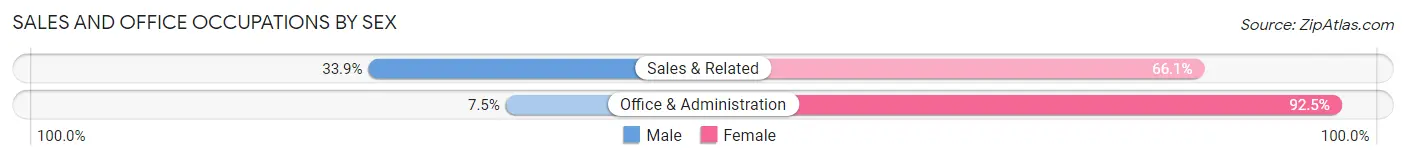
| Occupation | Male | Female |
| Sales & Related | 20 (33.9%) | 39 (66.1%) |
| Office & Administration | 6 (7.5%) | 74 (92.5%) |
| Total (Category) | 26 (18.7%) | 113 (81.3%) |
| Total (Overall) | 410 (55.5%) | 329 (44.5%) |
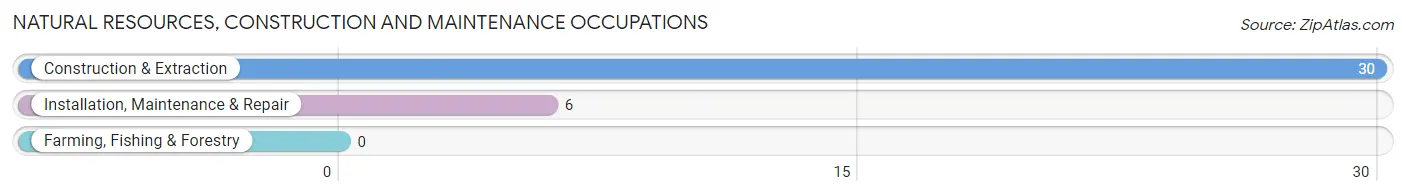
Natural Resources, Construction and Maintenance Occupations
The most common Natural Resources, Construction and Maintenance occupations in Roxana are Construction & Extraction (30 | 4.1%), and Installation, Maintenance & Repair (6 | 0.8%).
Natural Resources, Construction and Maintenance Occupations by Sex
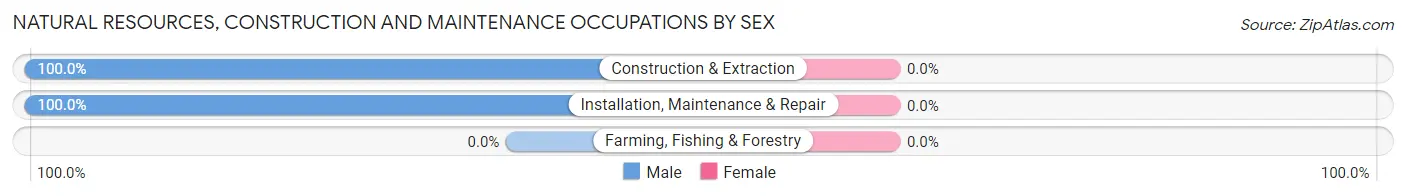
| Occupation | Male | Female |
| Farming, Fishing & Forestry | 0 (0.0%) | 0 (0.0%) |
| Construction & Extraction | 30 (100.0%) | 0 (0.0%) |
| Installation, Maintenance & Repair | 6 (100.0%) | 0 (0.0%) |
| Total (Category) | 36 (100.0%) | 0 (0.0%) |
| Total (Overall) | 410 (55.5%) | 329 (44.5%) |
Production, Transportation and Moving Occupations
The most common Production, Transportation and Moving occupations in Roxana are Material Moving (70 | 9.5%), Production (45 | 6.1%), and Transportation (22 | 3.0%).
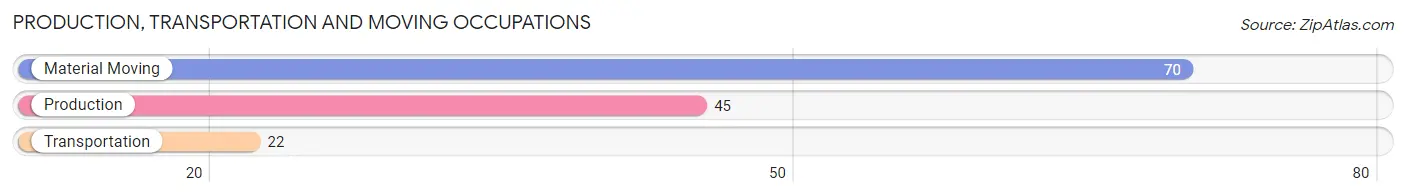
Production, Transportation and Moving Occupations by Sex
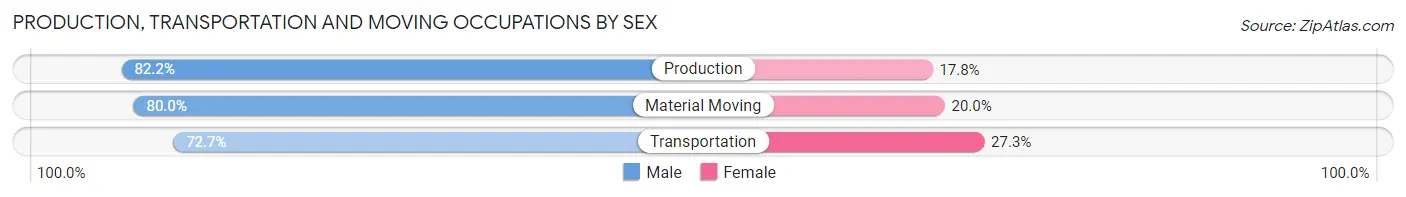
| Occupation | Male | Female |
| Production | 37 (82.2%) | 8 (17.8%) |
| Transportation | 16 (72.7%) | 6 (27.3%) |
| Material Moving | 56 (80.0%) | 14 (20.0%) |
| Total (Category) | 109 (79.6%) | 28 (20.4%) |
| Total (Overall) | 410 (55.5%) | 329 (44.5%) |
Employment Industries by Sex in Roxana
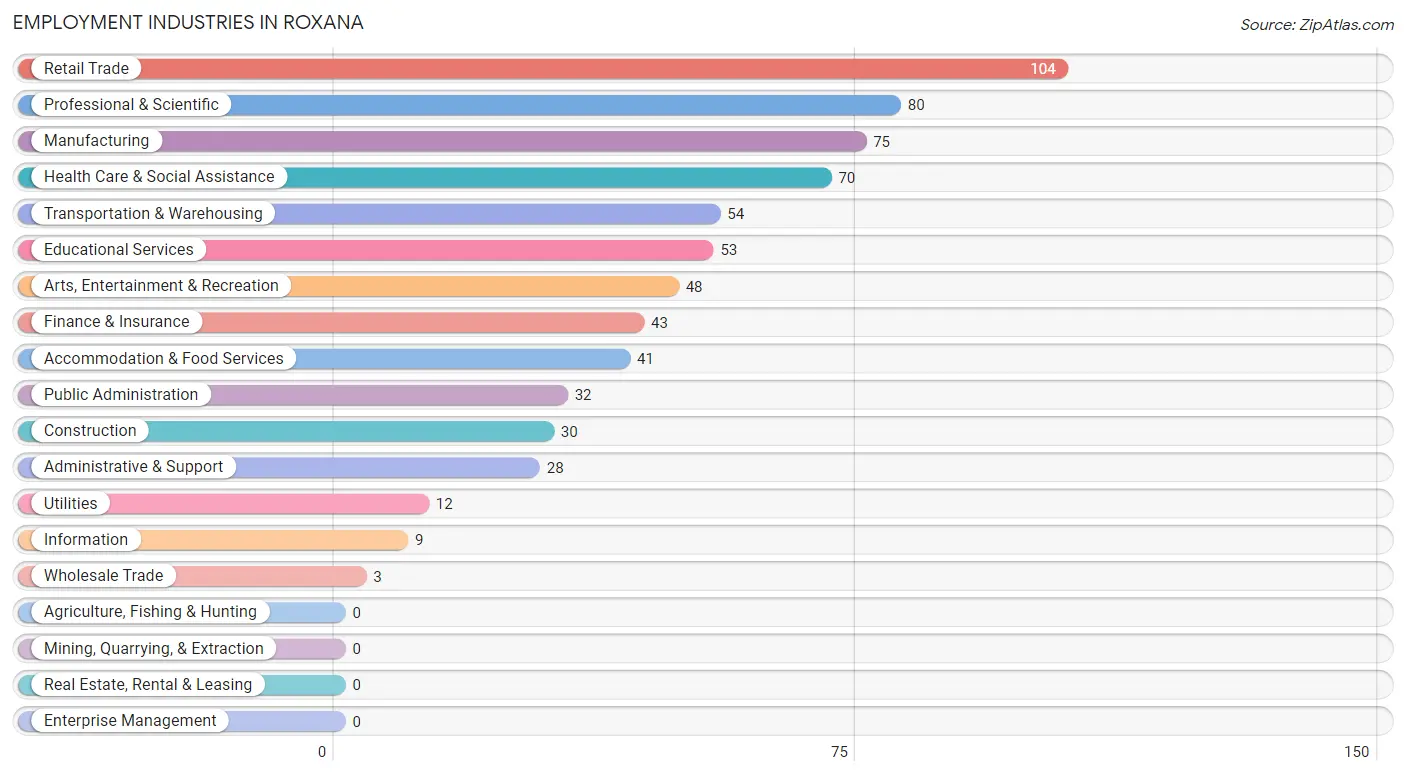
Employment Industries in Roxana
The major employment industries in Roxana include Retail Trade (104 | 14.1%), Professional & Scientific (80 | 10.8%), Manufacturing (75 | 10.2%), Health Care & Social Assistance (70 | 9.5%), and Transportation & Warehousing (54 | 7.3%).
Employment Industries by Sex in Roxana
The Roxana industries that see more men than women are Construction (100.0%), Wholesale Trade (100.0%), and Public Administration (90.6%), whereas the industries that tend to have a higher number of women are Information (100.0%), Health Care & Social Assistance (97.1%), and Accommodation & Food Services (90.2%).
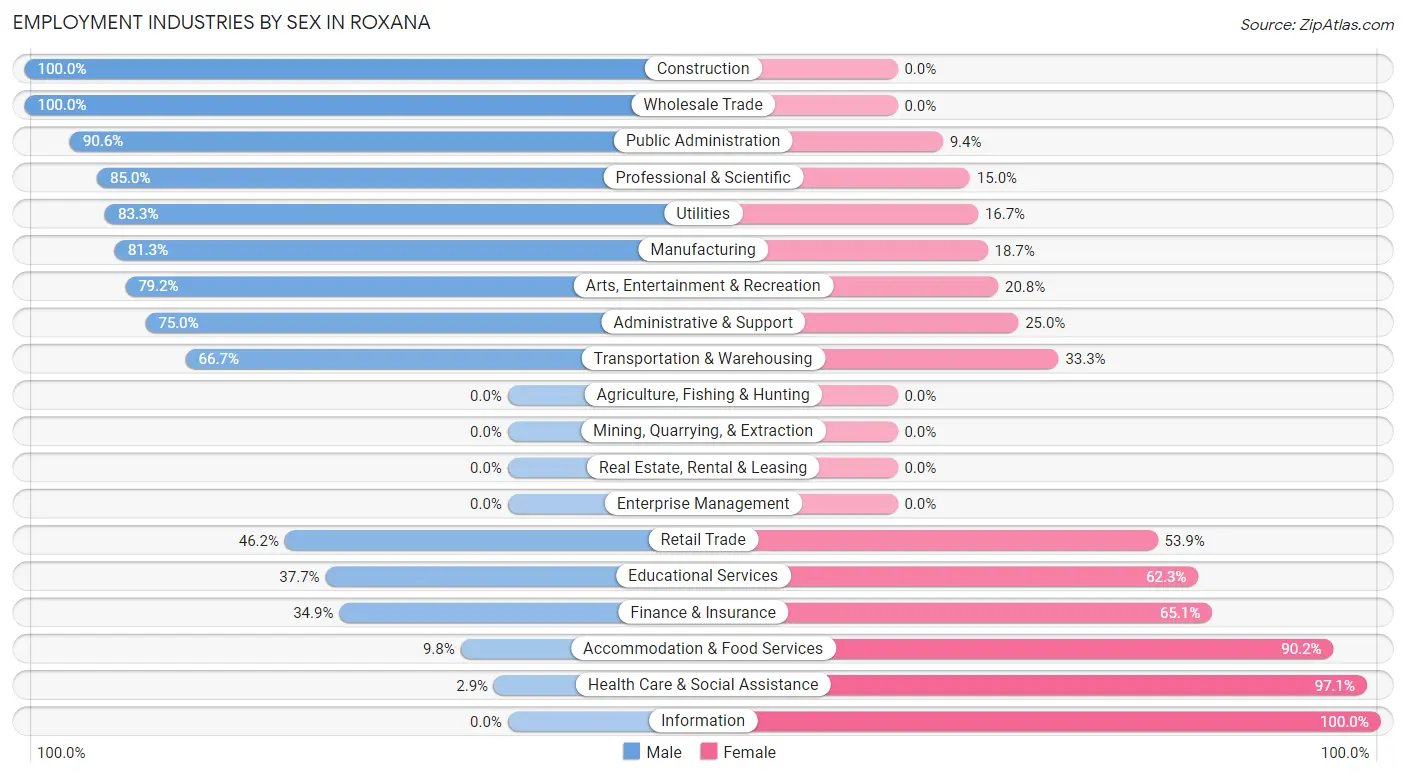
| Industry | Male | Female |
| Agriculture, Fishing & Hunting | 0 (0.0%) | 0 (0.0%) |
| Mining, Quarrying, & Extraction | 0 (0.0%) | 0 (0.0%) |
| Construction | 30 (100.0%) | 0 (0.0%) |
| Manufacturing | 61 (81.3%) | 14 (18.7%) |
| Wholesale Trade | 3 (100.0%) | 0 (0.0%) |
| Retail Trade | 48 (46.2%) | 56 (53.8%) |
| Transportation & Warehousing | 36 (66.7%) | 18 (33.3%) |
| Utilities | 10 (83.3%) | 2 (16.7%) |
| Information | 0 (0.0%) | 9 (100.0%) |
| Finance & Insurance | 15 (34.9%) | 28 (65.1%) |
| Real Estate, Rental & Leasing | 0 (0.0%) | 0 (0.0%) |
| Professional & Scientific | 68 (85.0%) | 12 (15.0%) |
| Enterprise Management | 0 (0.0%) | 0 (0.0%) |
| Administrative & Support | 21 (75.0%) | 7 (25.0%) |
| Educational Services | 20 (37.7%) | 33 (62.3%) |
| Health Care & Social Assistance | 2 (2.9%) | 68 (97.1%) |
| Arts, Entertainment & Recreation | 38 (79.2%) | 10 (20.8%) |
| Accommodation & Food Services | 4 (9.8%) | 37 (90.2%) |
| Public Administration | 29 (90.6%) | 3 (9.4%) |
| Total | 410 (55.5%) | 329 (44.5%) |
Education in Roxana
School Enrollment in Roxana
The most common levels of schooling among the 319 students in Roxana are college / undergraduate (72 | 22.6%), high school (68 | 21.3%), and middle school (63 | 19.8%).
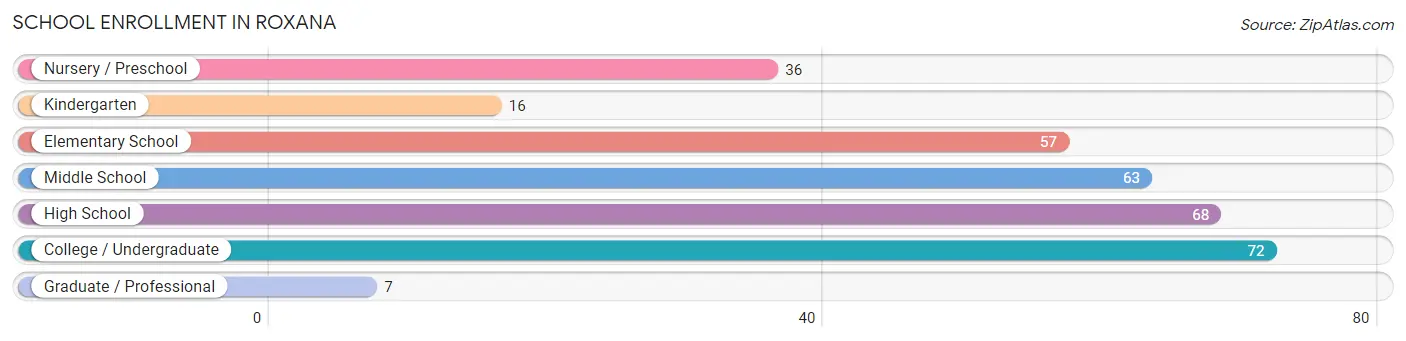
| School Level | # Students | % Students |
| Nursery / Preschool | 36 | 11.3% |
| Kindergarten | 16 | 5.0% |
| Elementary School | 57 | 17.9% |
| Middle School | 63 | 19.8% |
| High School | 68 | 21.3% |
| College / Undergraduate | 72 | 22.6% |
| Graduate / Professional | 7 | 2.2% |
| Total | 319 | 100.0% |
School Enrollment by Age by Funding Source in Roxana
Out of a total of 319 students who are enrolled in schools in Roxana, 6 (1.9%) attend a private institution, while the remaining 313 (98.1%) are enrolled in public schools. The age group of 25 to 34 year olds has the highest likelihood of being enrolled in private schools, with 6 (16.2% in the age bracket) enrolled. Conversely, the age group of 3 to 4 year olds has the lowest likelihood of being enrolled in a private school, with 10 (100.0% in the age bracket) attending a public institution.
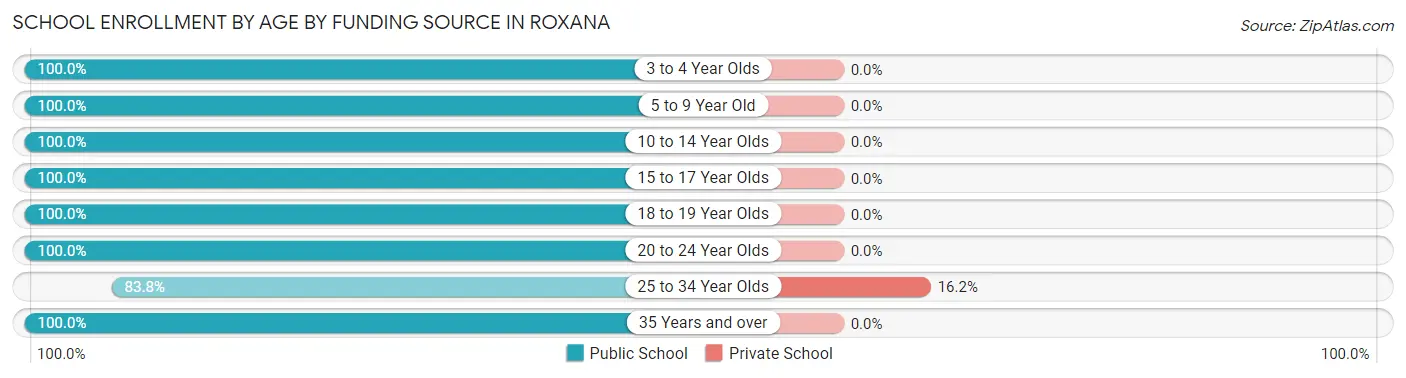
| Age Bracket | Public School | Private School |
| 3 to 4 Year Olds | 10 (100.0%) | 0 (0.0%) |
| 5 to 9 Year Old | 99 (100.0%) | 0 (0.0%) |
| 10 to 14 Year Olds | 67 (100.0%) | 0 (0.0%) |
| 15 to 17 Year Olds | 64 (100.0%) | 0 (0.0%) |
| 18 to 19 Year Olds | 6 (100.0%) | 0 (0.0%) |
| 20 to 24 Year Olds | 23 (100.0%) | 0 (0.0%) |
| 25 to 34 Year Olds | 31 (83.8%) | 6 (16.2%) |
| 35 Years and over | 13 (100.0%) | 0 (0.0%) |
| Total | 313 (98.1%) | 6 (1.9%) |
Educational Attainment by Field of Study in Roxana
Education (56 | 23.1%), engineering (52 | 21.5%), business (26 | 10.7%), arts & humanities (25 | 10.3%), and visual & performing arts (20 | 8.3%) are the most common fields of study among 242 individuals in Roxana who have obtained a bachelor's degree or higher.
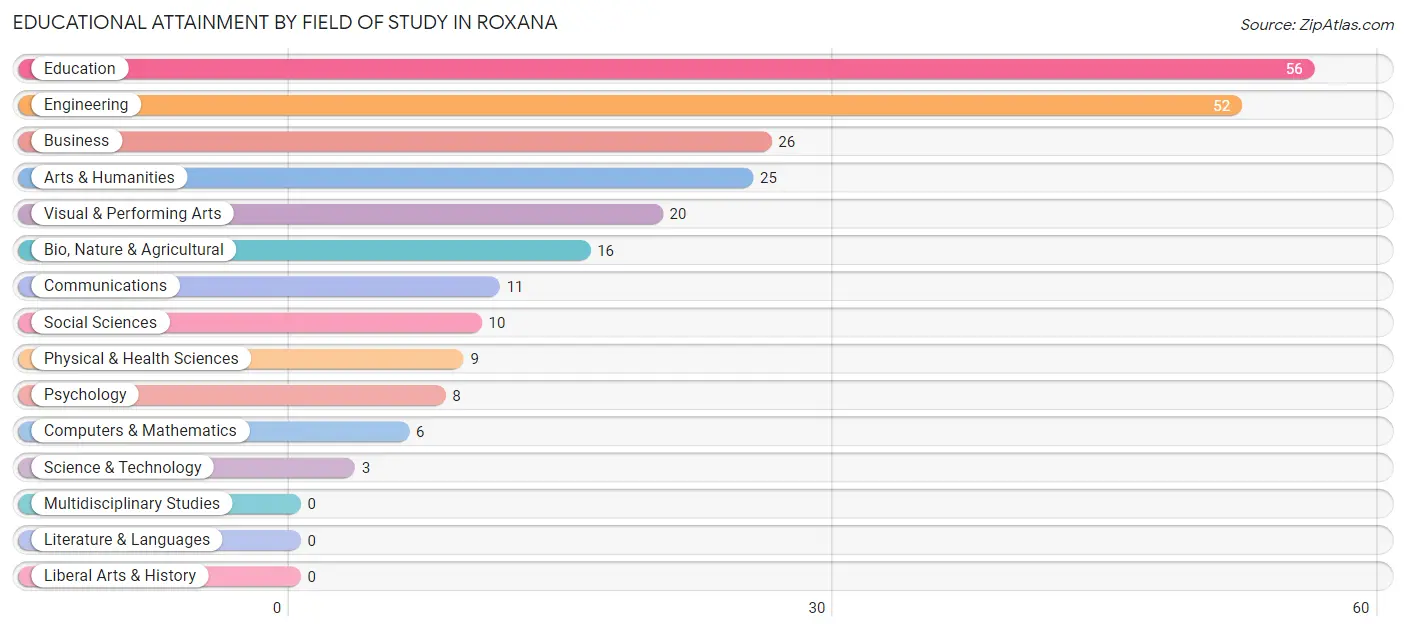
| Field of Study | # Graduates | % Graduates |
| Computers & Mathematics | 6 | 2.5% |
| Bio, Nature & Agricultural | 16 | 6.6% |
| Physical & Health Sciences | 9 | 3.7% |
| Psychology | 8 | 3.3% |
| Social Sciences | 10 | 4.1% |
| Engineering | 52 | 21.5% |
| Multidisciplinary Studies | 0 | 0.0% |
| Science & Technology | 3 | 1.2% |
| Business | 26 | 10.7% |
| Education | 56 | 23.1% |
| Literature & Languages | 0 | 0.0% |
| Liberal Arts & History | 0 | 0.0% |
| Visual & Performing Arts | 20 | 8.3% |
| Communications | 11 | 4.5% |
| Arts & Humanities | 25 | 10.3% |
| Total | 242 | 100.0% |
Transportation & Commute in Roxana
Vehicle Availability by Sex in Roxana
The most prevalent vehicle ownership categories in Roxana are males with 2 vehicles (210, accounting for 51.5%) and females with 2 vehicles (139, making up 65.6%).
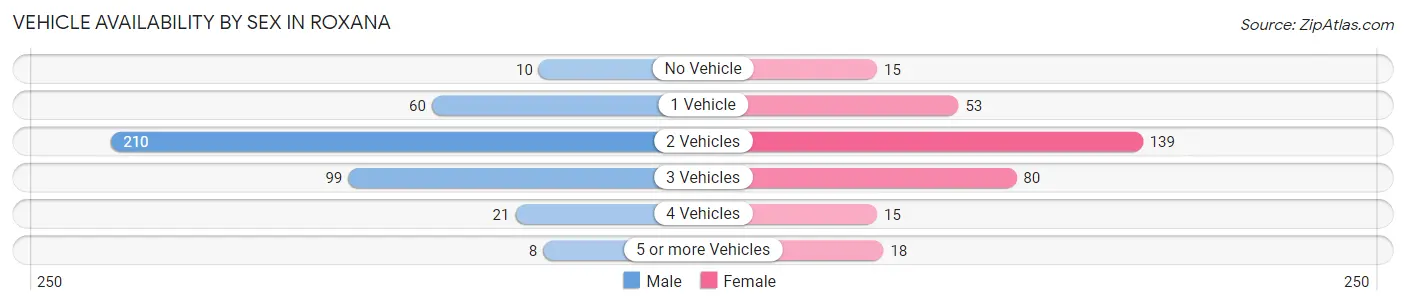
| Vehicles Available | Male | Female |
| No Vehicle | 10 (2.5%) | 15 (4.7%) |
| 1 Vehicle | 60 (14.7%) | 53 (16.6%) |
| 2 Vehicles | 210 (51.5%) | 139 (43.4%) |
| 3 Vehicles | 99 (24.3%) | 80 (25.0%) |
| 4 Vehicles | 21 (5.1%) | 15 (4.7%) |
| 5 or more Vehicles | 8 (2.0%) | 18 (5.6%) |
| Total | 408 (100.0%) | 320 (100.0%) |
Commute Time in Roxana
The most frequently occuring commute durations in Roxana are 10 to 14 minutes (125 commuters, 18.2%), 5 to 9 minutes (97 commuters, 14.1%), and 20 to 24 minutes (95 commuters, 13.8%).
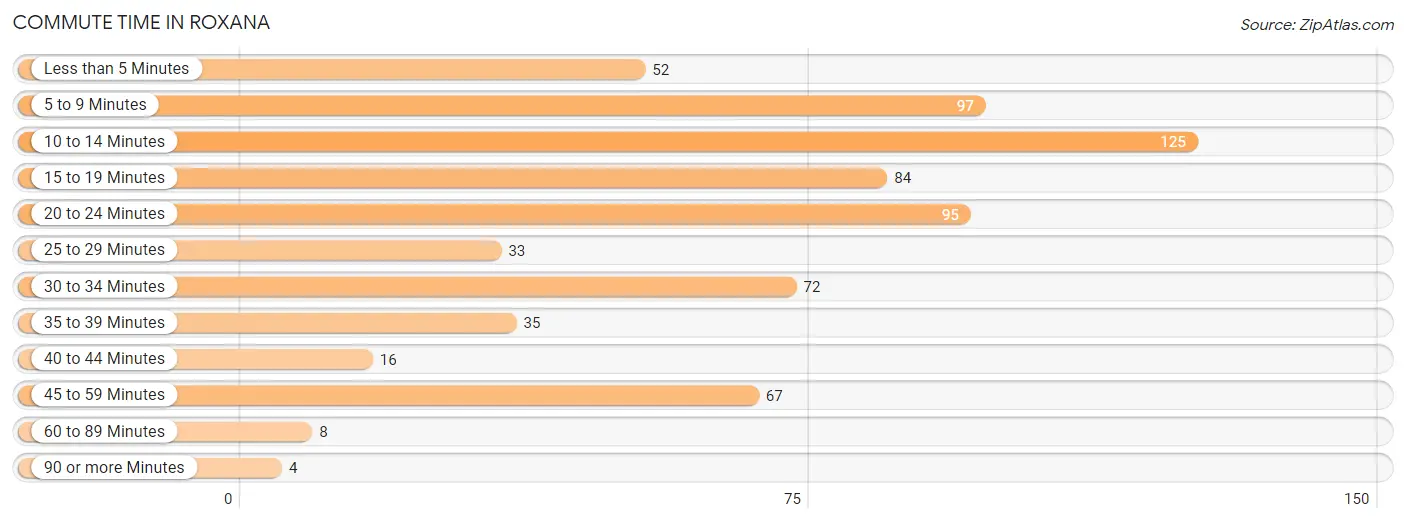
| Commute Time | # Commuters | % Commuters |
| Less than 5 Minutes | 52 | 7.6% |
| 5 to 9 Minutes | 97 | 14.1% |
| 10 to 14 Minutes | 125 | 18.2% |
| 15 to 19 Minutes | 84 | 12.2% |
| 20 to 24 Minutes | 95 | 13.8% |
| 25 to 29 Minutes | 33 | 4.8% |
| 30 to 34 Minutes | 72 | 10.5% |
| 35 to 39 Minutes | 35 | 5.1% |
| 40 to 44 Minutes | 16 | 2.3% |
| 45 to 59 Minutes | 67 | 9.7% |
| 60 to 89 Minutes | 8 | 1.2% |
| 90 or more Minutes | 4 | 0.6% |
Commute Time by Sex in Roxana
The most common commute times in Roxana are 10 to 14 minutes (93 commuters, 23.5%) for males and 20 to 24 minutes (48 commuters, 16.4%) for females.
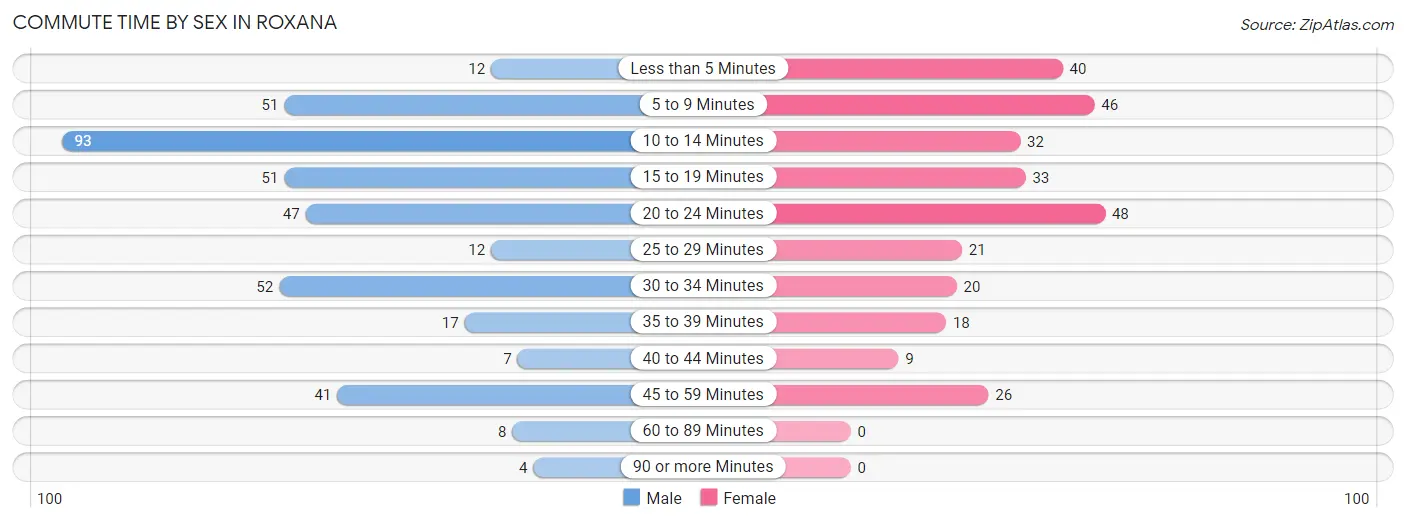
| Commute Time | Male | Female |
| Less than 5 Minutes | 12 (3.0%) | 40 (13.7%) |
| 5 to 9 Minutes | 51 (12.9%) | 46 (15.7%) |
| 10 to 14 Minutes | 93 (23.5%) | 32 (10.9%) |
| 15 to 19 Minutes | 51 (12.9%) | 33 (11.3%) |
| 20 to 24 Minutes | 47 (11.9%) | 48 (16.4%) |
| 25 to 29 Minutes | 12 (3.0%) | 21 (7.2%) |
| 30 to 34 Minutes | 52 (13.2%) | 20 (6.8%) |
| 35 to 39 Minutes | 17 (4.3%) | 18 (6.1%) |
| 40 to 44 Minutes | 7 (1.8%) | 9 (3.1%) |
| 45 to 59 Minutes | 41 (10.4%) | 26 (8.9%) |
| 60 to 89 Minutes | 8 (2.0%) | 0 (0.0%) |
| 90 or more Minutes | 4 (1.0%) | 0 (0.0%) |
Time of Departure to Work by Sex in Roxana
The most frequent times of departure to work in Roxana are 6:30 AM to 6:59 AM (78, 19.8%) for males and 8:00 AM to 8:29 AM (46, 15.7%) for females.
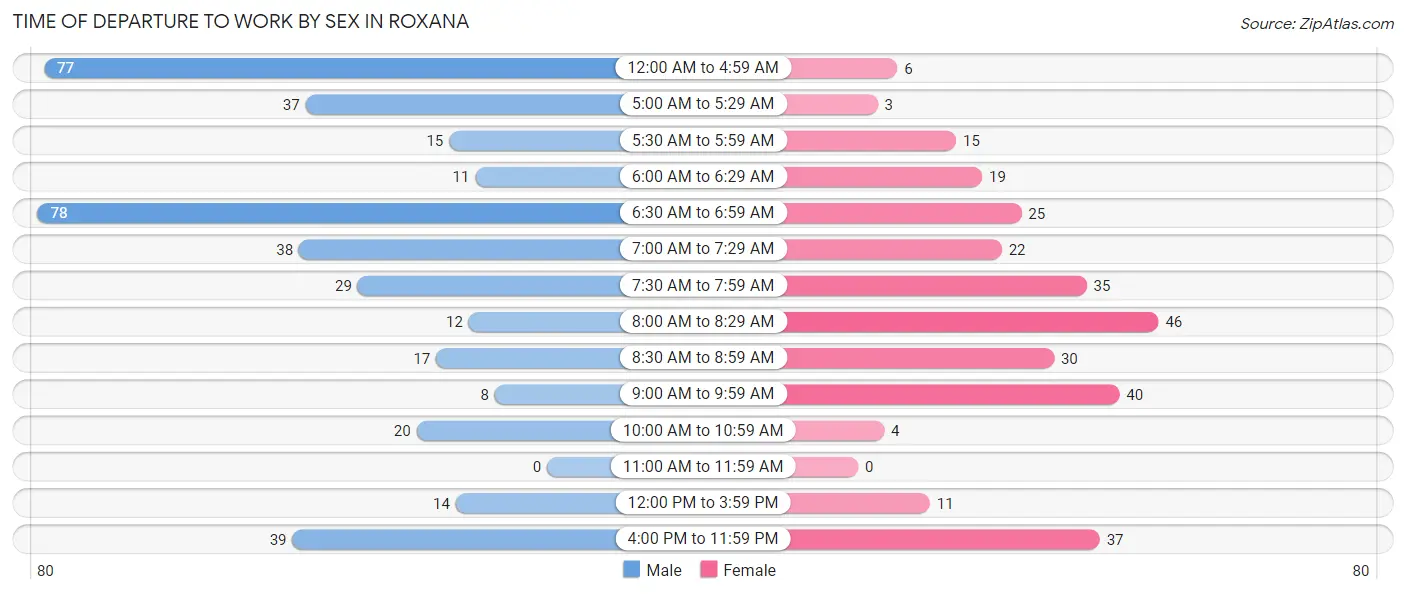
| Time of Departure | Male | Female |
| 12:00 AM to 4:59 AM | 77 (19.5%) | 6 (2.1%) |
| 5:00 AM to 5:29 AM | 37 (9.4%) | 3 (1.0%) |
| 5:30 AM to 5:59 AM | 15 (3.8%) | 15 (5.1%) |
| 6:00 AM to 6:29 AM | 11 (2.8%) | 19 (6.5%) |
| 6:30 AM to 6:59 AM | 78 (19.8%) | 25 (8.5%) |
| 7:00 AM to 7:29 AM | 38 (9.6%) | 22 (7.5%) |
| 7:30 AM to 7:59 AM | 29 (7.3%) | 35 (11.9%) |
| 8:00 AM to 8:29 AM | 12 (3.0%) | 46 (15.7%) |
| 8:30 AM to 8:59 AM | 17 (4.3%) | 30 (10.2%) |
| 9:00 AM to 9:59 AM | 8 (2.0%) | 40 (13.7%) |
| 10:00 AM to 10:59 AM | 20 (5.1%) | 4 (1.4%) |
| 11:00 AM to 11:59 AM | 0 (0.0%) | 0 (0.0%) |
| 12:00 PM to 3:59 PM | 14 (3.5%) | 11 (3.7%) |
| 4:00 PM to 11:59 PM | 39 (9.9%) | 37 (12.6%) |
| Total | 395 (100.0%) | 293 (100.0%) |
Housing Occupancy in Roxana
Occupancy by Ownership in Roxana
Of the total 691 dwellings in Roxana, owner-occupied units account for 525 (76.0%), while renter-occupied units make up 166 (24.0%).
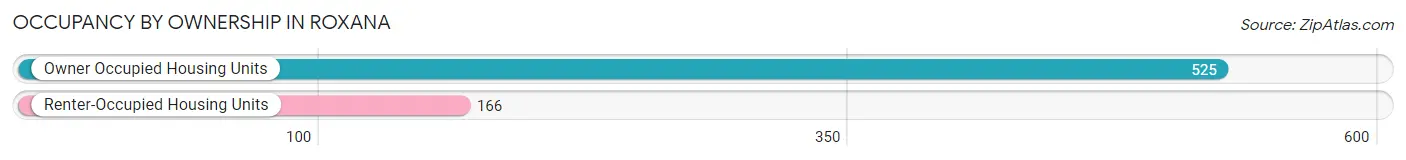
| Occupancy | # Housing Units | % Housing Units |
| Owner Occupied Housing Units | 525 | 76.0% |
| Renter-Occupied Housing Units | 166 | 24.0% |
| Total Occupied Housing Units | 691 | 100.0% |
Occupancy by Household Size in Roxana
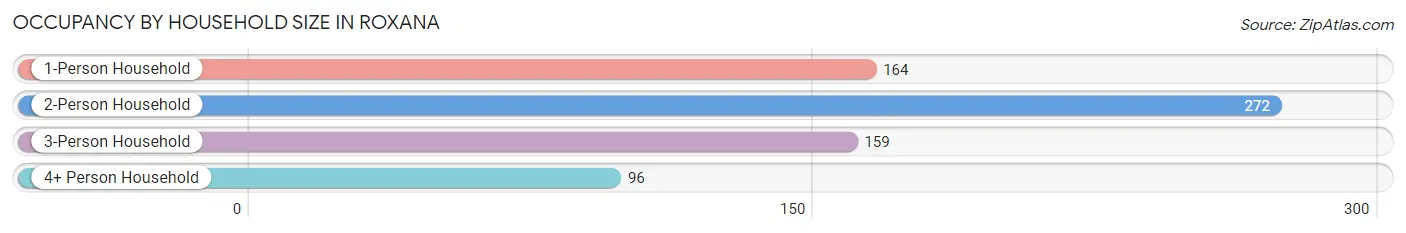
| Household Size | # Housing Units | % Housing Units |
| 1-Person Household | 164 | 23.7% |
| 2-Person Household | 272 | 39.4% |
| 3-Person Household | 159 | 23.0% |
| 4+ Person Household | 96 | 13.9% |
| Total Housing Units | 691 | 100.0% |
Occupancy by Ownership by Household Size in Roxana
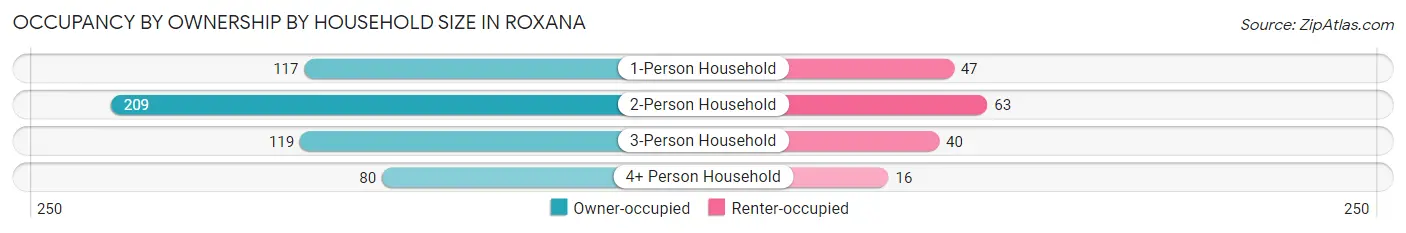
| Household Size | Owner-occupied | Renter-occupied |
| 1-Person Household | 117 (71.3%) | 47 (28.7%) |
| 2-Person Household | 209 (76.8%) | 63 (23.2%) |
| 3-Person Household | 119 (74.8%) | 40 (25.2%) |
| 4+ Person Household | 80 (83.3%) | 16 (16.7%) |
| Total Housing Units | 525 (76.0%) | 166 (24.0%) |
Occupancy by Educational Attainment in Roxana
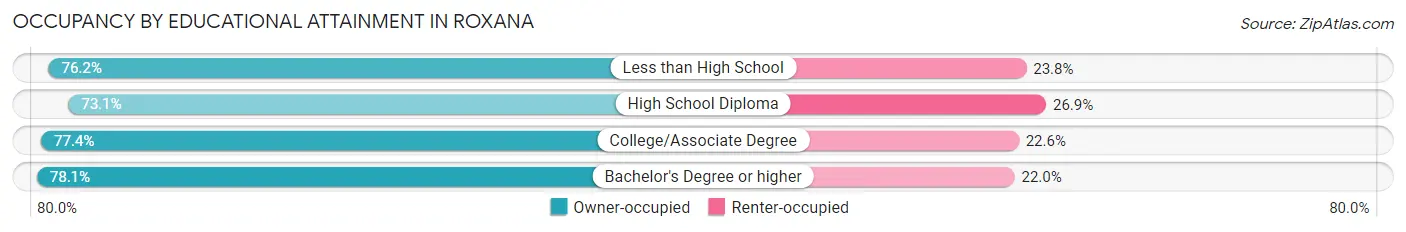
| Household Size | Owner-occupied | Renter-occupied |
| Less than High School | 16 (76.2%) | 5 (23.8%) |
| High School Diploma | 179 (73.1%) | 66 (26.9%) |
| College/Associate Degree | 202 (77.4%) | 59 (22.6%) |
| Bachelor's Degree or higher | 128 (78.0%) | 36 (22.0%) |
Occupancy by Age of Householder in Roxana
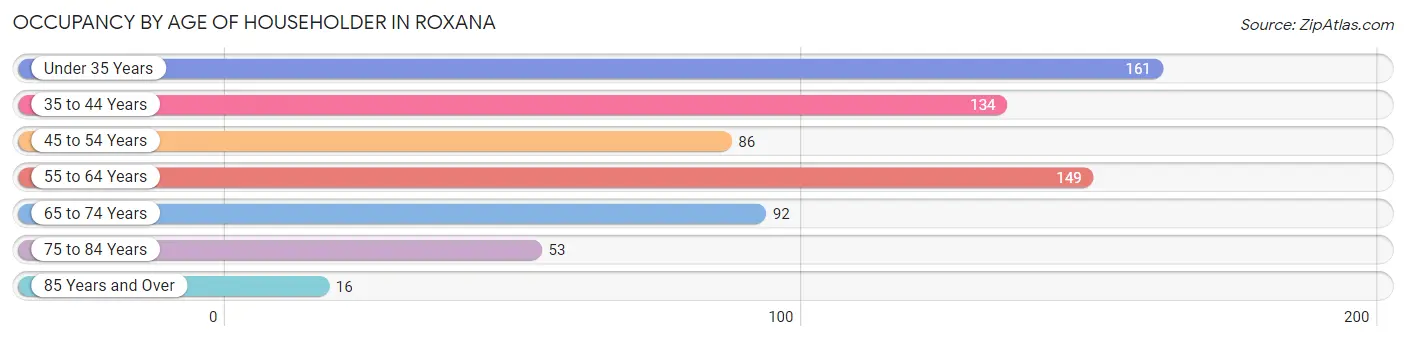
| Age Bracket | # Households | % Households |
| Under 35 Years | 161 | 23.3% |
| 35 to 44 Years | 134 | 19.4% |
| 45 to 54 Years | 86 | 12.4% |
| 55 to 64 Years | 149 | 21.6% |
| 65 to 74 Years | 92 | 13.3% |
| 75 to 84 Years | 53 | 7.7% |
| 85 Years and Over | 16 | 2.3% |
| Total | 691 | 100.0% |
Housing Finances in Roxana
Median Income by Occupancy in Roxana
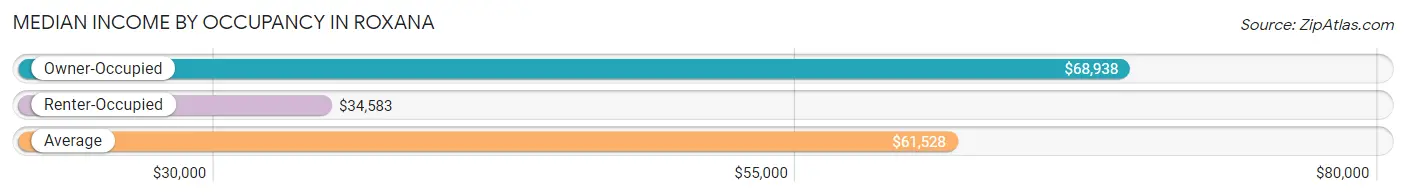
| Occupancy Type | # Households | Median Income |
| Owner-Occupied | 525 (76.0%) | $68,938 |
| Renter-Occupied | 166 (24.0%) | $34,583 |
| Average | 691 (100.0%) | $61,528 |
Occupancy by Householder Income Bracket in Roxana
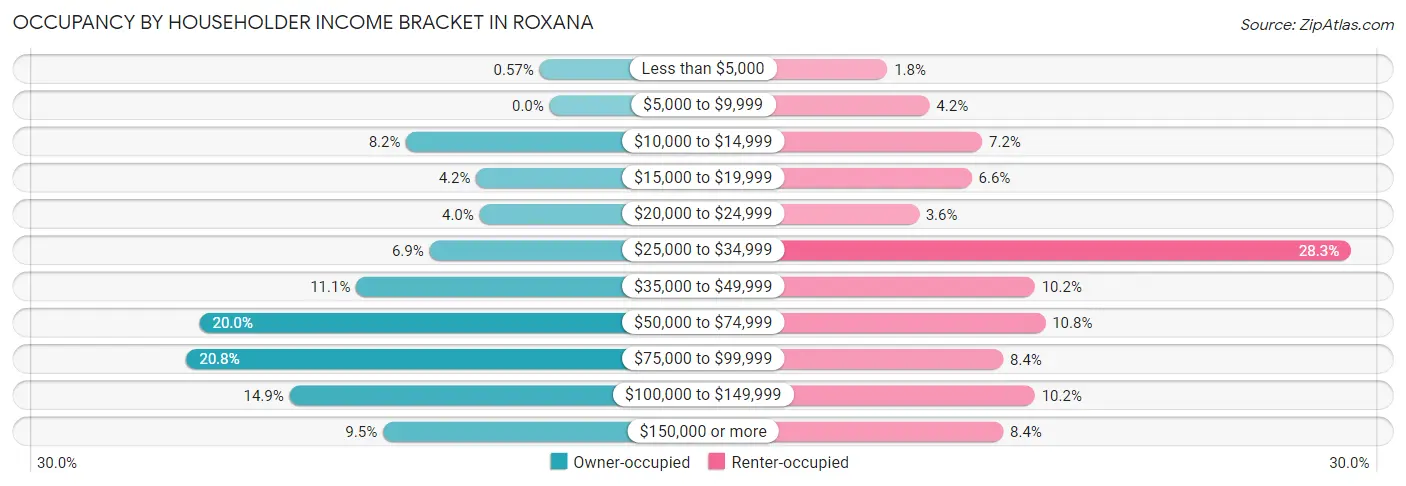
| Income Bracket | Owner-occupied | Renter-occupied |
| Less than $5,000 | 3 (0.6%) | 3 (1.8%) |
| $5,000 to $9,999 | 0 (0.0%) | 7 (4.2%) |
| $10,000 to $14,999 | 43 (8.2%) | 12 (7.2%) |
| $15,000 to $19,999 | 22 (4.2%) | 11 (6.6%) |
| $20,000 to $24,999 | 21 (4.0%) | 6 (3.6%) |
| $25,000 to $34,999 | 36 (6.9%) | 47 (28.3%) |
| $35,000 to $49,999 | 58 (11.1%) | 17 (10.2%) |
| $50,000 to $74,999 | 105 (20.0%) | 18 (10.8%) |
| $75,000 to $99,999 | 109 (20.8%) | 14 (8.4%) |
| $100,000 to $149,999 | 78 (14.9%) | 17 (10.2%) |
| $150,000 or more | 50 (9.5%) | 14 (8.4%) |
| Total | 525 (100.0%) | 166 (100.0%) |
Monthly Housing Cost Tiers in Roxana
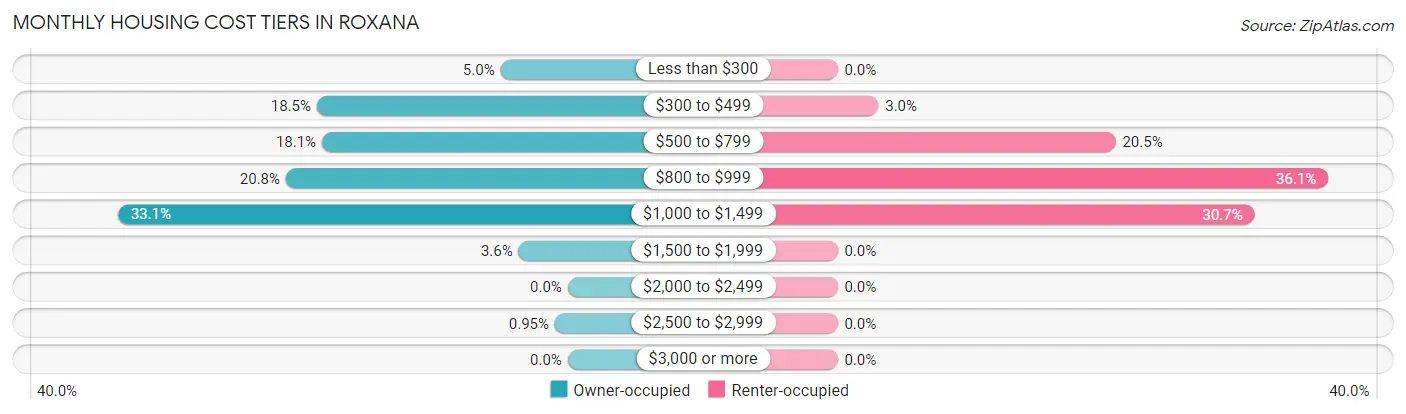
| Monthly Cost | Owner-occupied | Renter-occupied |
| Less than $300 | 26 (5.0%) | 0 (0.0%) |
| $300 to $499 | 97 (18.5%) | 5 (3.0%) |
| $500 to $799 | 95 (18.1%) | 34 (20.5%) |
| $800 to $999 | 109 (20.8%) | 60 (36.1%) |
| $1,000 to $1,499 | 174 (33.1%) | 51 (30.7%) |
| $1,500 to $1,999 | 19 (3.6%) | 0 (0.0%) |
| $2,000 to $2,499 | 0 (0.0%) | 0 (0.0%) |
| $2,500 to $2,999 | 5 (0.9%) | 0 (0.0%) |
| $3,000 or more | 0 (0.0%) | 0 (0.0%) |
| Total | 525 (100.0%) | 166 (100.0%) |
Physical Housing Characteristics in Roxana
Housing Structures in Roxana
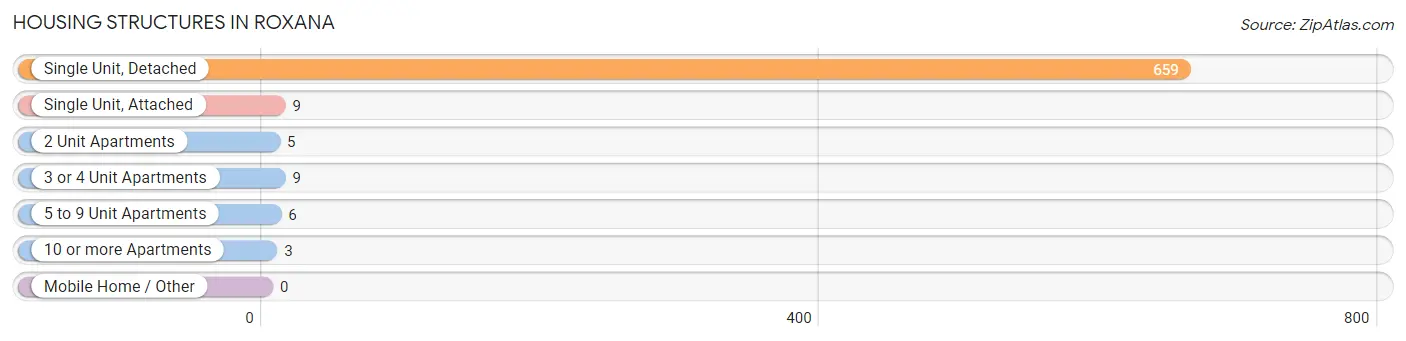
| Structure Type | # Housing Units | % Housing Units |
| Single Unit, Detached | 659 | 95.4% |
| Single Unit, Attached | 9 | 1.3% |
| 2 Unit Apartments | 5 | 0.7% |
| 3 or 4 Unit Apartments | 9 | 1.3% |
| 5 to 9 Unit Apartments | 6 | 0.9% |
| 10 or more Apartments | 3 | 0.4% |
| Mobile Home / Other | 0 | 0.0% |
| Total | 691 | 100.0% |
Housing Structures by Occupancy in Roxana
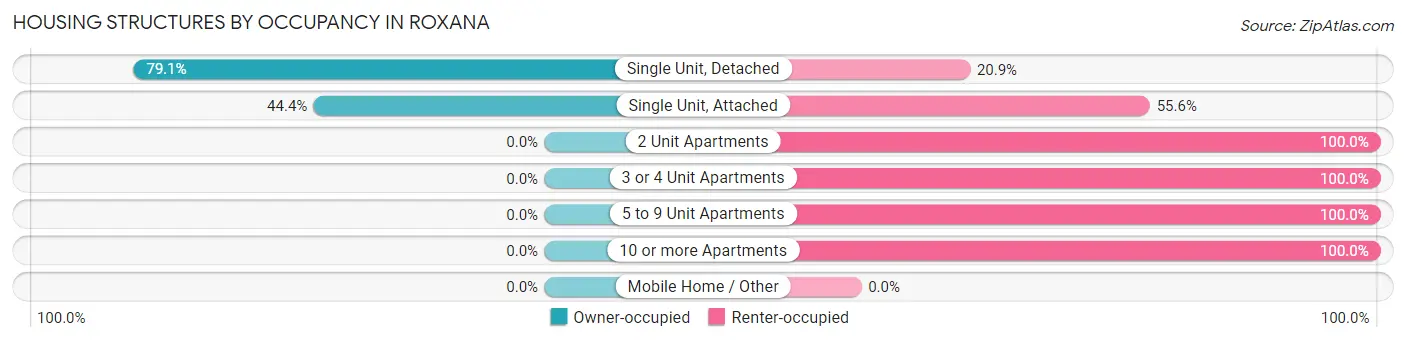
| Structure Type | Owner-occupied | Renter-occupied |
| Single Unit, Detached | 521 (79.1%) | 138 (20.9%) |
| Single Unit, Attached | 4 (44.4%) | 5 (55.6%) |
| 2 Unit Apartments | 0 (0.0%) | 5 (100.0%) |
| 3 or 4 Unit Apartments | 0 (0.0%) | 9 (100.0%) |
| 5 to 9 Unit Apartments | 0 (0.0%) | 6 (100.0%) |
| 10 or more Apartments | 0 (0.0%) | 3 (100.0%) |
| Mobile Home / Other | 0 (0.0%) | 0 (0.0%) |
| Total | 525 (76.0%) | 166 (24.0%) |
Housing Structures by Number of Rooms in Roxana
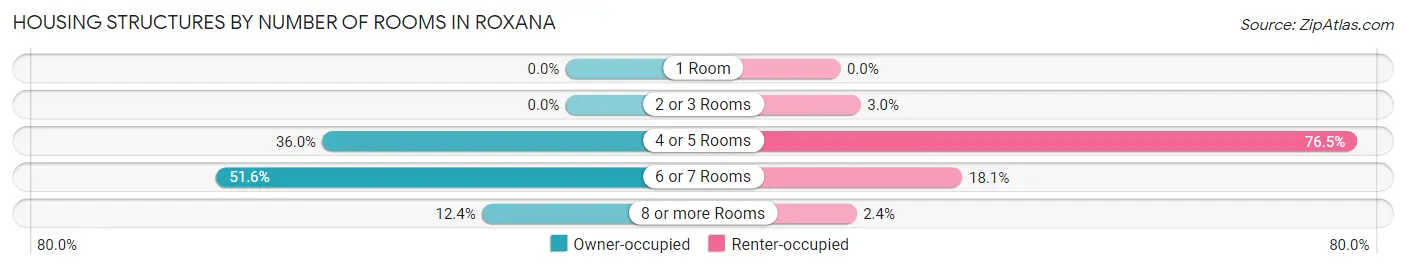
| Number of Rooms | Owner-occupied | Renter-occupied |
| 1 Room | 0 (0.0%) | 0 (0.0%) |
| 2 or 3 Rooms | 0 (0.0%) | 5 (3.0%) |
| 4 or 5 Rooms | 189 (36.0%) | 127 (76.5%) |
| 6 or 7 Rooms | 271 (51.6%) | 30 (18.1%) |
| 8 or more Rooms | 65 (12.4%) | 4 (2.4%) |
| Total | 525 (100.0%) | 166 (100.0%) |
Housing Structure by Heating Type in Roxana
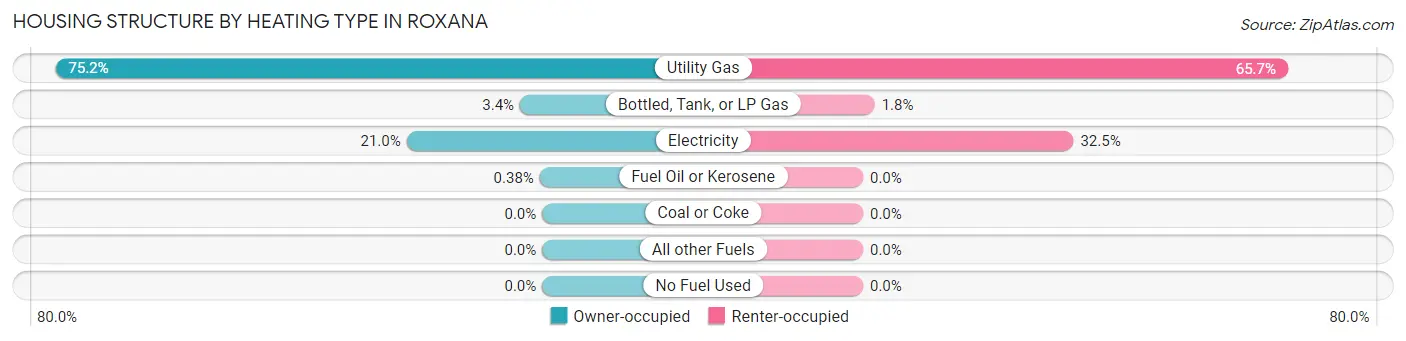
| Heating Type | Owner-occupied | Renter-occupied |
| Utility Gas | 395 (75.2%) | 109 (65.7%) |
| Bottled, Tank, or LP Gas | 18 (3.4%) | 3 (1.8%) |
| Electricity | 110 (20.9%) | 54 (32.5%) |
| Fuel Oil or Kerosene | 2 (0.4%) | 0 (0.0%) |
| Coal or Coke | 0 (0.0%) | 0 (0.0%) |
| All other Fuels | 0 (0.0%) | 0 (0.0%) |
| No Fuel Used | 0 (0.0%) | 0 (0.0%) |
| Total | 525 (100.0%) | 166 (100.0%) |
Household Vehicle Usage in Roxana
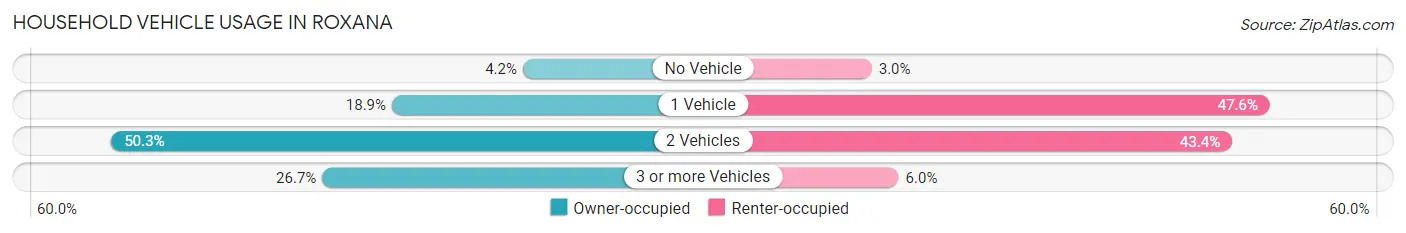
| Vehicles per Household | Owner-occupied | Renter-occupied |
| No Vehicle | 22 (4.2%) | 5 (3.0%) |
| 1 Vehicle | 99 (18.9%) | 79 (47.6%) |
| 2 Vehicles | 264 (50.3%) | 72 (43.4%) |
| 3 or more Vehicles | 140 (26.7%) | 10 (6.0%) |
| Total | 525 (100.0%) | 166 (100.0%) |
Real Estate & Mortgages in Roxana
Real Estate and Mortgage Overview in Roxana
| Characteristic | Without Mortgage | With Mortgage |
| Housing Units | 167 | 358 |
| Median Property Value | $78,000 | $102,900 |
| Median Household Income | $49,375 | $28 |
| Monthly Housing Costs | $424 | $0 |
| Real Estate Taxes | $1,397 | $0 |
Property Value by Mortgage Status in Roxana
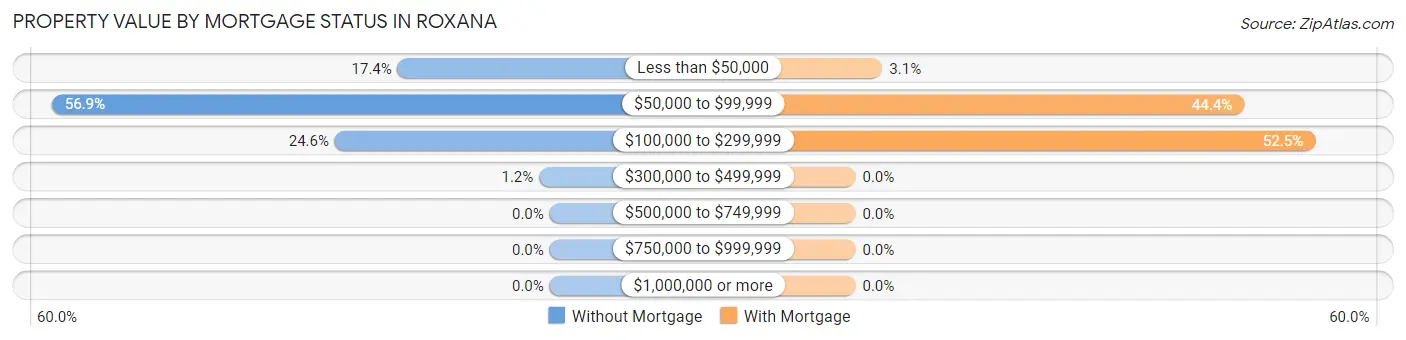
| Property Value | Without Mortgage | With Mortgage |
| Less than $50,000 | 29 (17.4%) | 11 (3.1%) |
| $50,000 to $99,999 | 95 (56.9%) | 159 (44.4%) |
| $100,000 to $299,999 | 41 (24.5%) | 188 (52.5%) |
| $300,000 to $499,999 | 2 (1.2%) | 0 (0.0%) |
| $500,000 to $749,999 | 0 (0.0%) | 0 (0.0%) |
| $750,000 to $999,999 | 0 (0.0%) | 0 (0.0%) |
| $1,000,000 or more | 0 (0.0%) | 0 (0.0%) |
| Total | 167 (100.0%) | 358 (100.0%) |
Household Income by Mortgage Status in Roxana
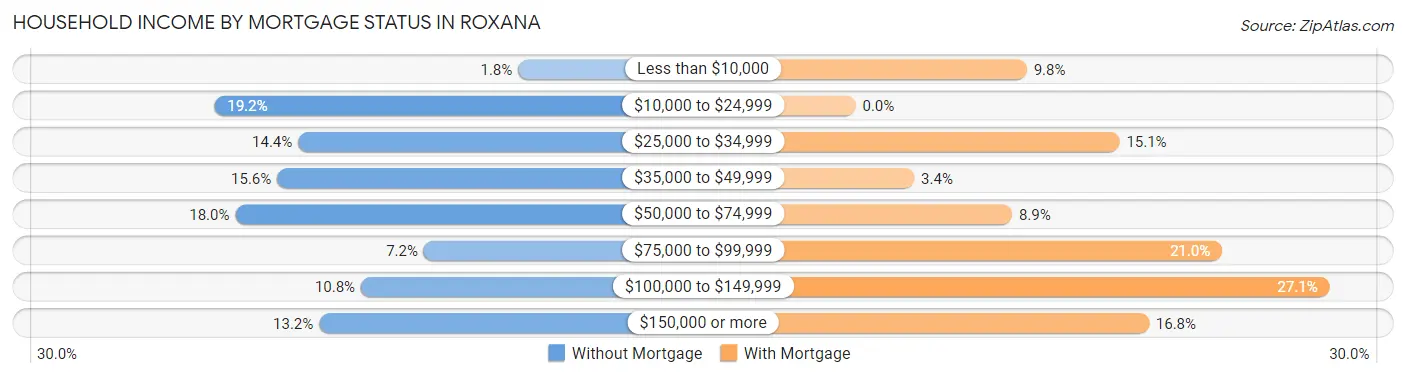
| Household Income | Without Mortgage | With Mortgage |
| Less than $10,000 | 3 (1.8%) | 35 (9.8%) |
| $10,000 to $24,999 | 32 (19.2%) | 0 (0.0%) |
| $25,000 to $34,999 | 24 (14.4%) | 54 (15.1%) |
| $35,000 to $49,999 | 26 (15.6%) | 12 (3.4%) |
| $50,000 to $74,999 | 30 (18.0%) | 32 (8.9%) |
| $75,000 to $99,999 | 12 (7.2%) | 75 (20.9%) |
| $100,000 to $149,999 | 18 (10.8%) | 97 (27.1%) |
| $150,000 or more | 22 (13.2%) | 60 (16.8%) |
| Total | 167 (100.0%) | 358 (100.0%) |
Property Value to Household Income Ratio in Roxana
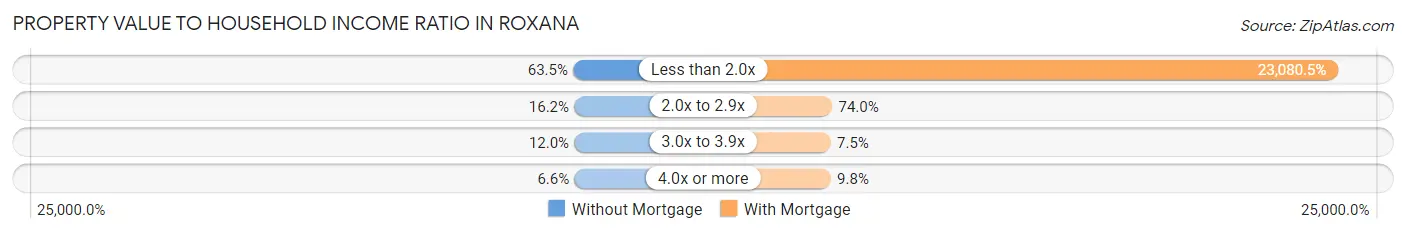
| Value-to-Income Ratio | Without Mortgage | With Mortgage |
| Less than 2.0x | 106 (63.5%) | 82,628 (23,080.4%) |
| 2.0x to 2.9x | 27 (16.2%) | 265 (74.0%) |
| 3.0x to 3.9x | 20 (12.0%) | 27 (7.5%) |
| 4.0x or more | 11 (6.6%) | 35 (9.8%) |
| Total | 167 (100.0%) | 358 (100.0%) |
Real Estate Taxes by Mortgage Status in Roxana
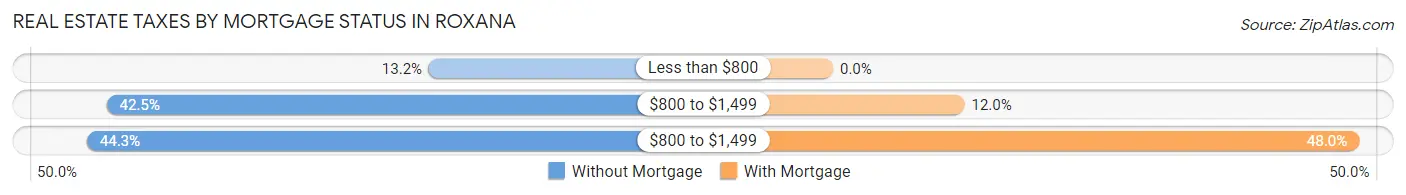
| Property Taxes | Without Mortgage | With Mortgage |
| Less than $800 | 22 (13.2%) | 0 (0.0%) |
| $800 to $1,499 | 71 (42.5%) | 43 (12.0%) |
| $800 to $1,499 | 74 (44.3%) | 172 (48.0%) |
| Total | 167 (100.0%) | 358 (100.0%) |
Health & Disability in Roxana
Health Insurance Coverage by Age in Roxana
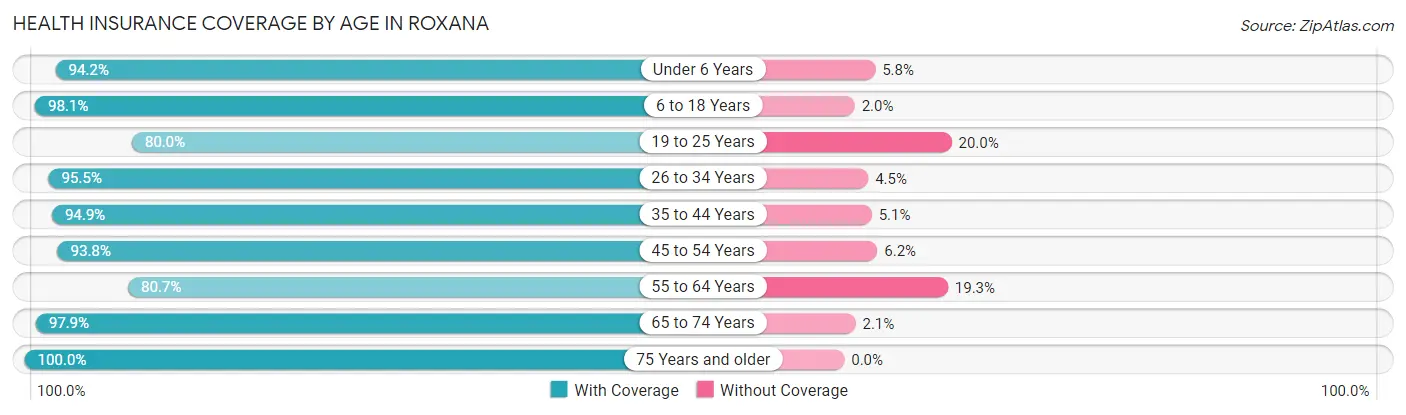
| Age Bracket | With Coverage | Without Coverage |
| Under 6 Years | 147 (94.2%) | 9 (5.8%) |
| 6 to 18 Years | 201 (98.1%) | 4 (1.9%) |
| 19 to 25 Years | 76 (80.0%) | 19 (20.0%) |
| 26 to 34 Years | 214 (95.5%) | 10 (4.5%) |
| 35 to 44 Years | 223 (94.9%) | 12 (5.1%) |
| 45 to 54 Years | 137 (93.8%) | 9 (6.2%) |
| 55 to 64 Years | 209 (80.7%) | 50 (19.3%) |
| 65 to 74 Years | 140 (97.9%) | 3 (2.1%) |
| 75 Years and older | 107 (100.0%) | 0 (0.0%) |
| Total | 1,454 (92.6%) | 116 (7.4%) |
Health Insurance Coverage by Citizenship Status in Roxana
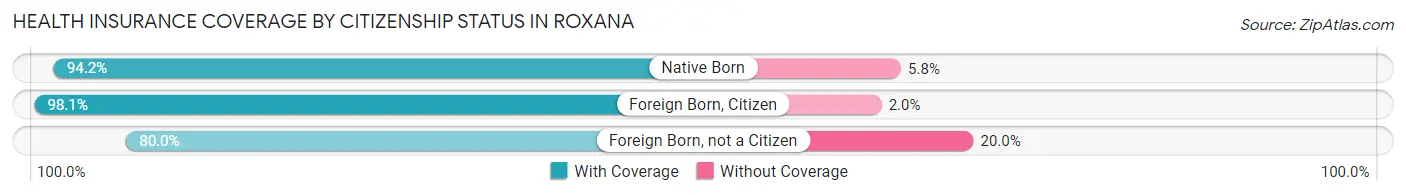
| Citizenship Status | With Coverage | Without Coverage |
| Native Born | 147 (94.2%) | 9 (5.8%) |
| Foreign Born, Citizen | 201 (98.1%) | 4 (1.9%) |
| Foreign Born, not a Citizen | 76 (80.0%) | 19 (20.0%) |
Health Insurance Coverage by Household Income in Roxana
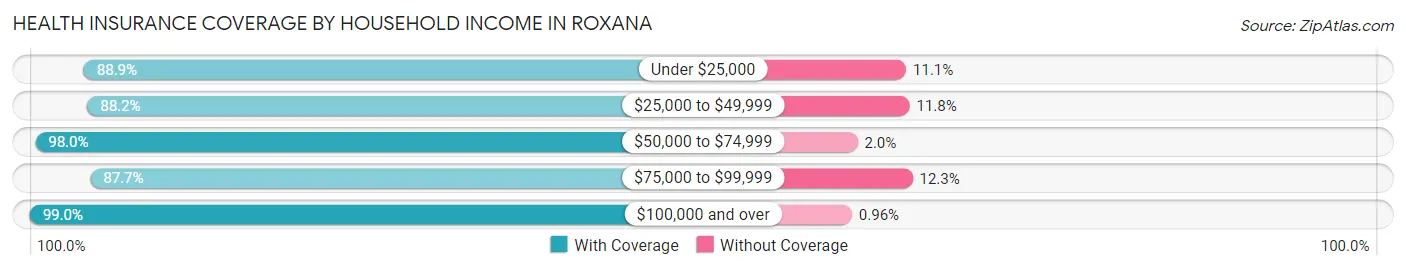
| Household Income | With Coverage | Without Coverage |
| Under $25,000 | 192 (88.9%) | 24 (11.1%) |
| $25,000 to $49,999 | 300 (88.2%) | 40 (11.8%) |
| $50,000 to $74,999 | 244 (98.0%) | 5 (2.0%) |
| $75,000 to $99,999 | 306 (87.7%) | 43 (12.3%) |
| $100,000 and over | 412 (99.0%) | 4 (1.0%) |
Public vs Private Health Insurance Coverage by Age in Roxana
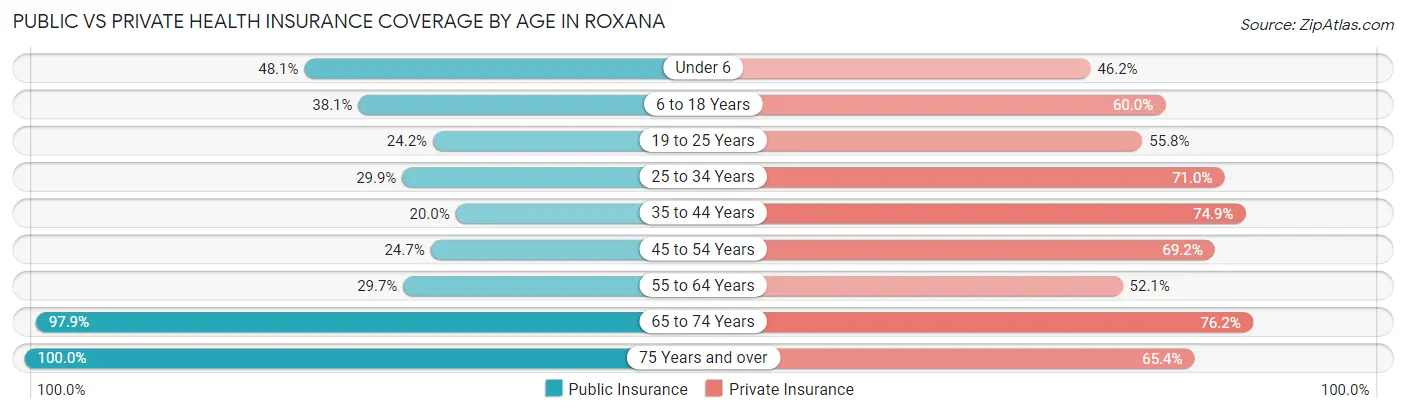
| Age Bracket | Public Insurance | Private Insurance |
| Under 6 | 75 (48.1%) | 72 (46.2%) |
| 6 to 18 Years | 78 (38.1%) | 123 (60.0%) |
| 19 to 25 Years | 23 (24.2%) | 53 (55.8%) |
| 25 to 34 Years | 67 (29.9%) | 159 (71.0%) |
| 35 to 44 Years | 47 (20.0%) | 176 (74.9%) |
| 45 to 54 Years | 36 (24.7%) | 101 (69.2%) |
| 55 to 64 Years | 77 (29.7%) | 135 (52.1%) |
| 65 to 74 Years | 140 (97.9%) | 109 (76.2%) |
| 75 Years and over | 107 (100.0%) | 70 (65.4%) |
| Total | 650 (41.4%) | 998 (63.6%) |
Disability Status by Sex by Age in Roxana
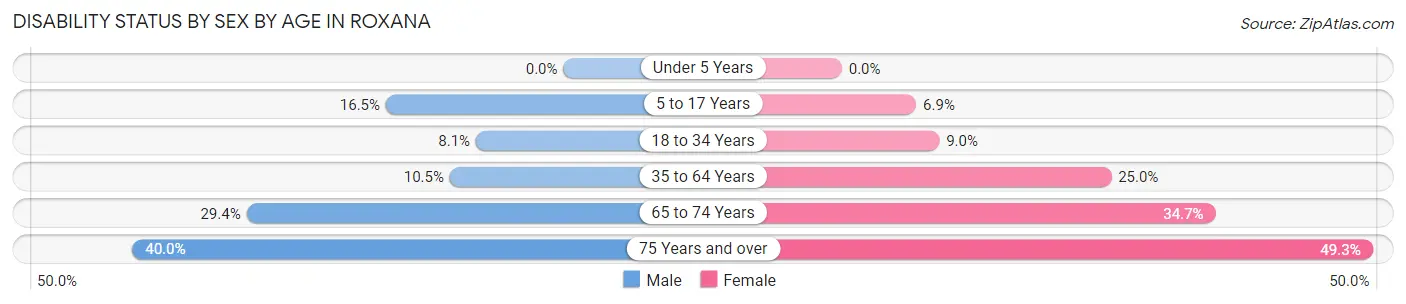
| Age Bracket | Male | Female |
| Under 5 Years | 0 (0.0%) | 0 (0.0%) |
| 5 to 17 Years | 14 (16.5%) | 10 (6.9%) |
| 18 to 34 Years | 12 (8.1%) | 16 (9.0%) |
| 35 to 64 Years | 35 (10.5%) | 77 (25.0%) |
| 65 to 74 Years | 20 (29.4%) | 26 (34.7%) |
| 75 Years and over | 16 (40.0%) | 33 (49.2%) |
Disability Class by Sex by Age in Roxana
Disability Class: Hearing Difficulty
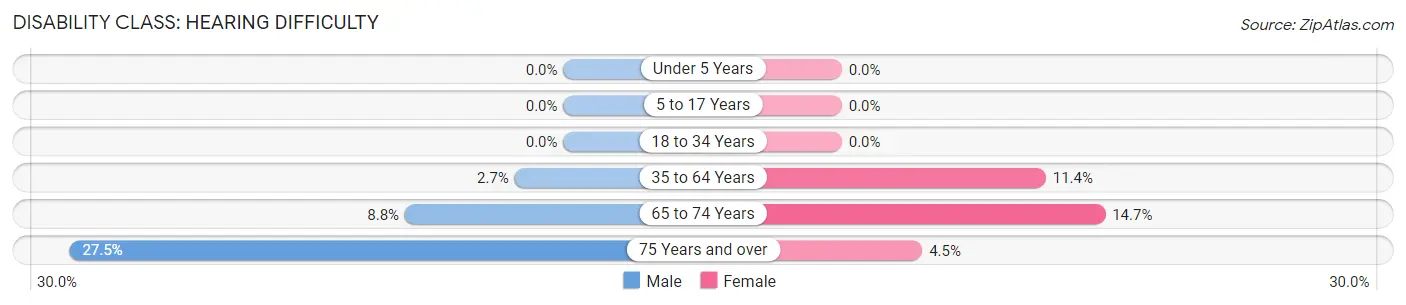
| Age Bracket | Male | Female |
| Under 5 Years | 0 (0.0%) | 0 (0.0%) |
| 5 to 17 Years | 0 (0.0%) | 0 (0.0%) |
| 18 to 34 Years | 0 (0.0%) | 0 (0.0%) |
| 35 to 64 Years | 9 (2.7%) | 35 (11.4%) |
| 65 to 74 Years | 6 (8.8%) | 11 (14.7%) |
| 75 Years and over | 11 (27.5%) | 3 (4.5%) |
Disability Class: Vision Difficulty
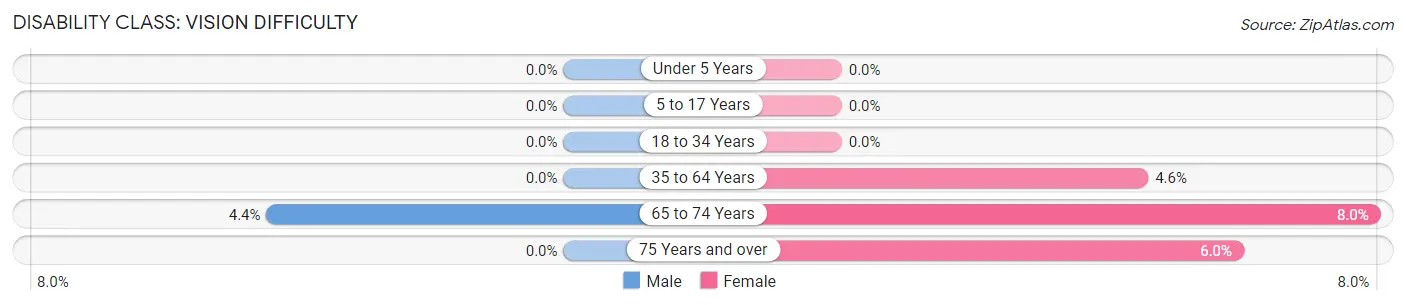
| Age Bracket | Male | Female |
| Under 5 Years | 0 (0.0%) | 0 (0.0%) |
| 5 to 17 Years | 0 (0.0%) | 0 (0.0%) |
| 18 to 34 Years | 0 (0.0%) | 0 (0.0%) |
| 35 to 64 Years | 0 (0.0%) | 14 (4.5%) |
| 65 to 74 Years | 3 (4.4%) | 6 (8.0%) |
| 75 Years and over | 0 (0.0%) | 4 (6.0%) |
Disability Class: Cognitive Difficulty
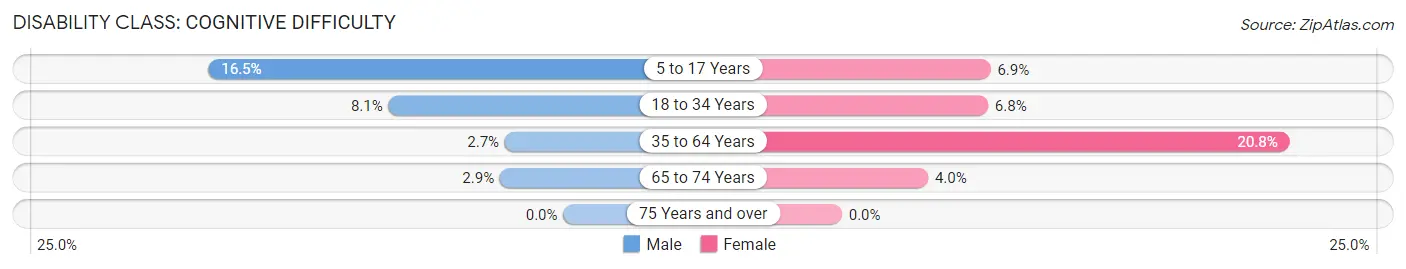
| Age Bracket | Male | Female |
| 5 to 17 Years | 14 (16.5%) | 10 (6.9%) |
| 18 to 34 Years | 12 (8.1%) | 12 (6.8%) |
| 35 to 64 Years | 9 (2.7%) | 64 (20.8%) |
| 65 to 74 Years | 2 (2.9%) | 3 (4.0%) |
| 75 Years and over | 0 (0.0%) | 0 (0.0%) |
Disability Class: Ambulatory Difficulty
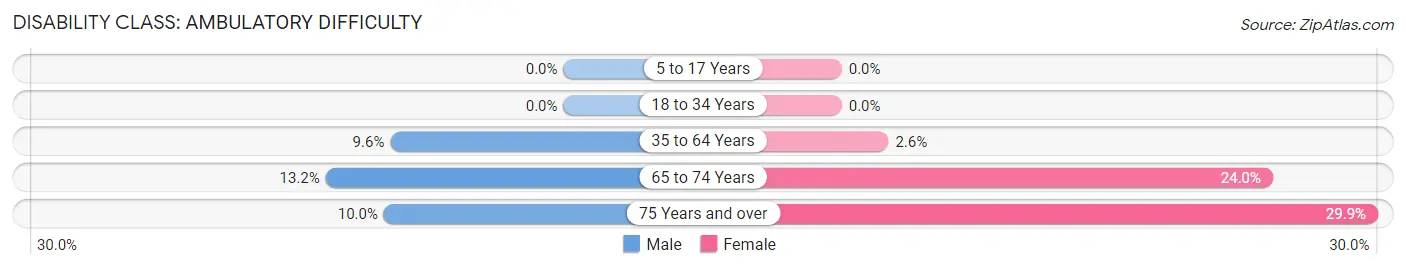
| Age Bracket | Male | Female |
| 5 to 17 Years | 0 (0.0%) | 0 (0.0%) |
| 18 to 34 Years | 0 (0.0%) | 0 (0.0%) |
| 35 to 64 Years | 32 (9.6%) | 8 (2.6%) |
| 65 to 74 Years | 9 (13.2%) | 18 (24.0%) |
| 75 Years and over | 4 (10.0%) | 20 (29.8%) |
Disability Class: Self-Care Difficulty
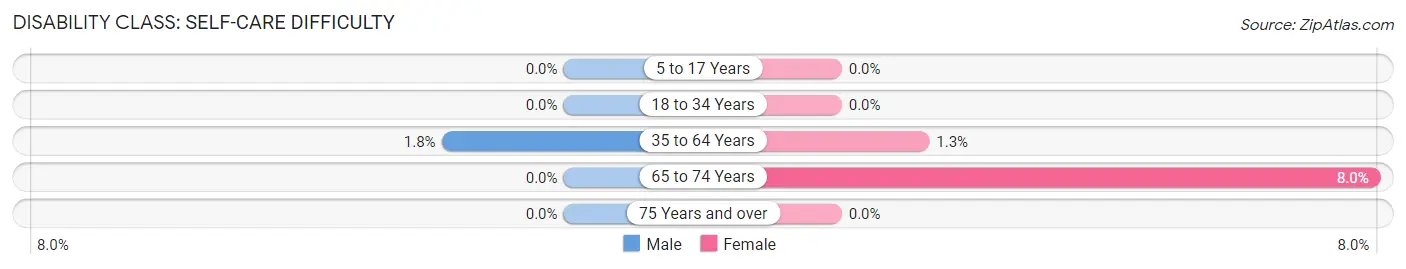
| Age Bracket | Male | Female |
| 5 to 17 Years | 0 (0.0%) | 0 (0.0%) |
| 18 to 34 Years | 0 (0.0%) | 0 (0.0%) |
| 35 to 64 Years | 6 (1.8%) | 4 (1.3%) |
| 65 to 74 Years | 0 (0.0%) | 6 (8.0%) |
| 75 Years and over | 0 (0.0%) | 0 (0.0%) |
Technology Access in Roxana
Computing Device Access in Roxana
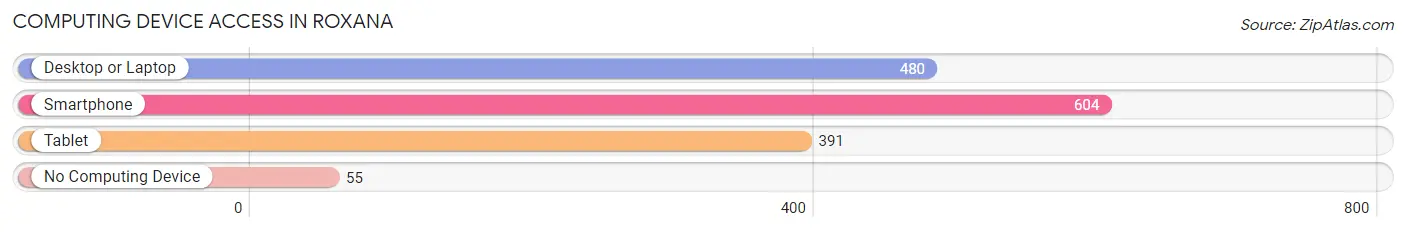
| Device Type | # Households | % Households |
| Desktop or Laptop | 480 | 69.5% |
| Smartphone | 604 | 87.4% |
| Tablet | 391 | 56.6% |
| No Computing Device | 55 | 8.0% |
| Total | 691 | 100.0% |
Internet Access in Roxana

| Internet Type | # Households | % Households |
| Dial-Up Internet | 0 | 0.0% |
| Broadband Home | 536 | 77.6% |
| Cellular Data Only | 51 | 7.4% |
| Satellite Internet | 33 | 4.8% |
| No Internet | 82 | 11.9% |
| Total | 691 | 100.0% |
Roxana Summary
Roxana, Illinois is a small village located in Madison County, Illinois. It is situated on the banks of the Mississippi River, just south of the city of Alton. The village has a population of approximately 2,000 people and is part of the Greater St. Louis metropolitan area.
History
Roxana was founded in 1883 by a group of settlers from the nearby town of Alton. The village was named after the daughter of one of the settlers, Roxana Smith. The village was incorporated in 1891 and has remained a small, rural community ever since.
The village was originally a farming community, but in the early 1900s, the area began to experience a period of industrial growth. The village was home to several factories, including a glass factory, a brickyard, and a paper mill. These industries provided employment for many of the residents of Roxana.
In the 1950s, the village experienced a period of decline as the factories began to close. The population of the village decreased significantly during this time. However, in the late 1970s, the village began to experience a period of revitalization. The village was able to attract new businesses and industries, and the population began to increase again.
Geography
Roxana is located in Madison County, Illinois, on the banks of the Mississippi River. The village is situated just south of the city of Alton. The village is located in the Central Lowland region of the United States, and is part of the Greater St. Louis metropolitan area.
The village is located in a flat, low-lying area, with an elevation of approximately 500 feet above sea level. The climate in the area is humid continental, with hot, humid summers and cold, snowy winters.
Economy
Roxana is a small, rural community, and the economy is largely based on agriculture and small businesses. The village is home to several small businesses, including restaurants, retail stores, and service providers.
The village is also home to several industrial facilities, including a paper mill, a glass factory, and a brickyard. These industries provide employment for many of the residents of Roxana.
Demographics
As of the 2010 census, the population of Roxana was 2,000. The racial makeup of the village was 97.2% White, 0.7% African American, 0.3% Native American, 0.3% Asian, and 1.5% from other races. The median household income in the village was $41,250, and the median family income was $50,000.
The village is served by the Roxana Community Unit School District, which includes two elementary schools, one middle school, and one high school. The village is also home to several churches, including the First Baptist Church of Roxana and the Church of the Nazarene.
Common Questions
What is Per Capita Income in Roxana?
Per Capita income in Roxana is $36,773.
What is the Median Family Income in Roxana?
Median Family Income in Roxana is $73,625.
What is the Median Household income in Roxana?
Median Household Income in Roxana is $61,528.
What is Inequality or Gini Index in Roxana?
Inequality or Gini Index in Roxana is 0.47.
What is the Total Population of Roxana?
Total Population of Roxana is 1,570.
What is the Total Male Population of Roxana?
Total Male Population of Roxana is 749.
What is the Total Female Population of Roxana?
Total Female Population of Roxana is 821.
What is the Ratio of Males per 100 Females in Roxana?
There are 91.23 Males per 100 Females in Roxana.
What is the Ratio of Females per 100 Males in Roxana?
There are 109.61 Females per 100 Males in Roxana.
What is the Median Population Age in Roxana?
Median Population Age in Roxana is 39.8 Years.
What is the Average Family Size in Roxana
Average Family Size in Roxana is 2.6 People.
What is the Average Household Size in Roxana
Average Household Size in Roxana is 2.3 People.
How Large is the Labor Force in Roxana?
There are 762 People in the Labor Forcein in Roxana.
What is the Percentage of People in the Labor Force in Roxana?
60.6% of People are in the Labor Force in Roxana.
What is the Unemployment Rate in Roxana?
Unemployment Rate in Roxana is 3.0%.