Hazel Crest, IL Map & Demographics
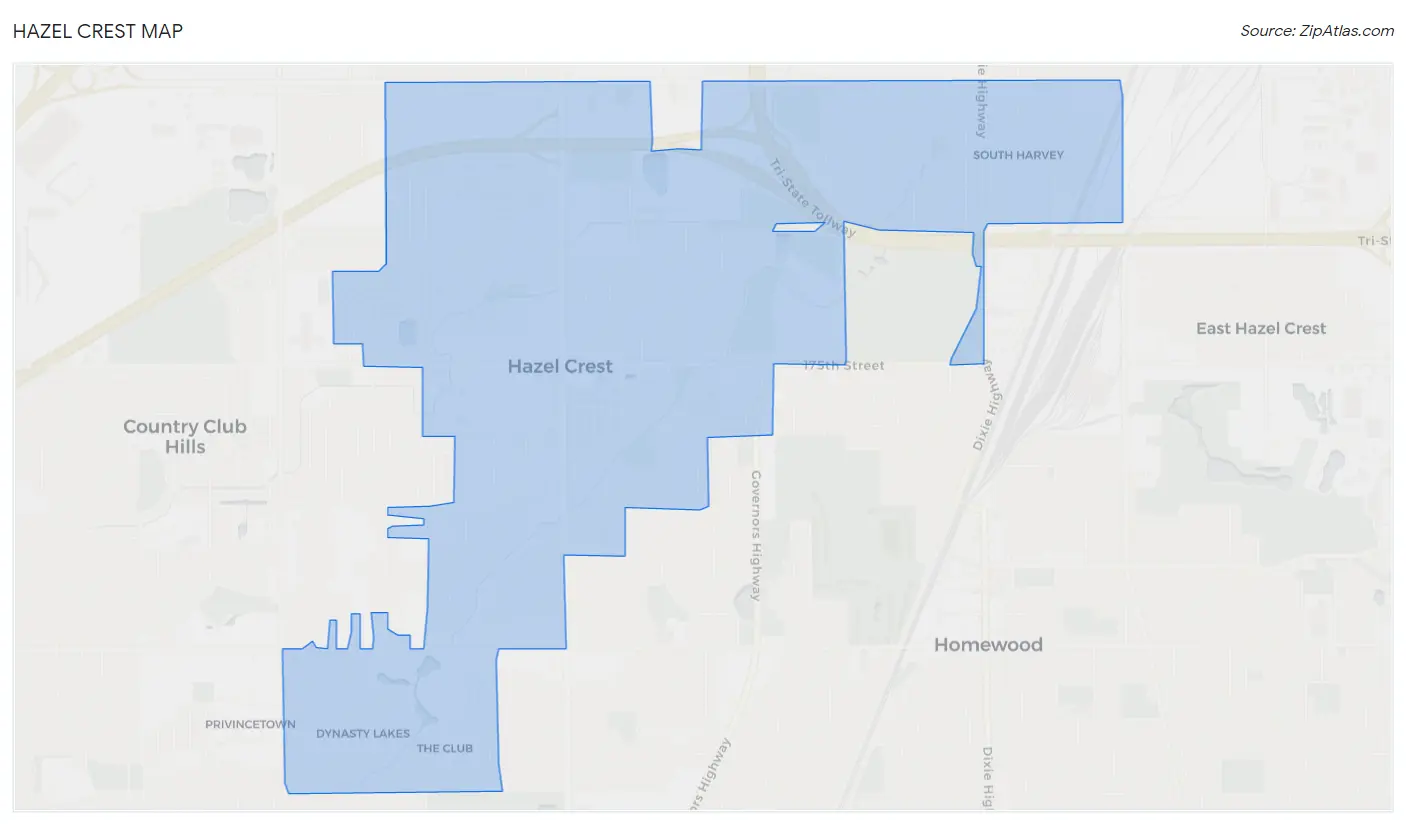
Hazel Crest Map
Hazel Crest Overview
$27,288
PER CAPITA INCOME
$64,349
AVG FAMILY INCOME
$57,247
AVG HOUSEHOLD INCOME
5.3%
WAGE / INCOME GAP [ % ]
94.7¢/ $1
WAGE / INCOME GAP [ $ ]
0.47
INEQUALITY / GINI INDEX
13,737
TOTAL POPULATION
5,916
MALE POPULATION
7,821
FEMALE POPULATION
75.64
MALES / 100 FEMALES
132.20
FEMALES / 100 MALES
33.0
MEDIAN AGE
3.5
AVG FAMILY SIZE
2.9
AVG HOUSEHOLD SIZE
6,511
LABOR FORCE [ PEOPLE ]
66.2%
PERCENT IN LABOR FORCE
13.7%
UNEMPLOYMENT RATE
Hazel Crest Zip Codes
Income in Hazel Crest
Income Overview in Hazel Crest
Per Capita Income in Hazel Crest is $27,288, while median incomes of families and households are $64,349 and $57,247 respectively.
| Characteristic | Number | Measure |
| Per Capita Income | 13,737 | $27,288 |
| Median Family Income | 3,275 | $64,349 |
| Mean Family Income | 3,275 | $81,205 |
| Median Household Income | 4,670 | $57,247 |
| Mean Household Income | 4,670 | $76,490 |
| Income Deficit | 3,275 | $0 |
| Wage / Income Gap (%) | 13,737 | 5.33% |
| Wage / Income Gap ($) | 13,737 | 94.67¢ per $1 |
| Gini / Inequality Index | 13,737 | 0.47 |
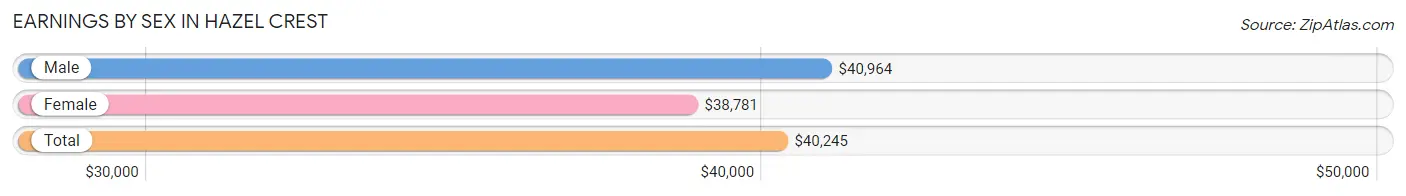
Earnings by Sex in Hazel Crest
Average Earnings in Hazel Crest are $40,245, $40,964 for men and $38,781 for women, a difference of 5.3%.
| Sex | Number | Average Earnings |
| Male | 2,630 (42.6%) | $40,964 |
| Female | 3,537 (57.4%) | $38,781 |
| Total | 6,167 (100.0%) | $40,245 |
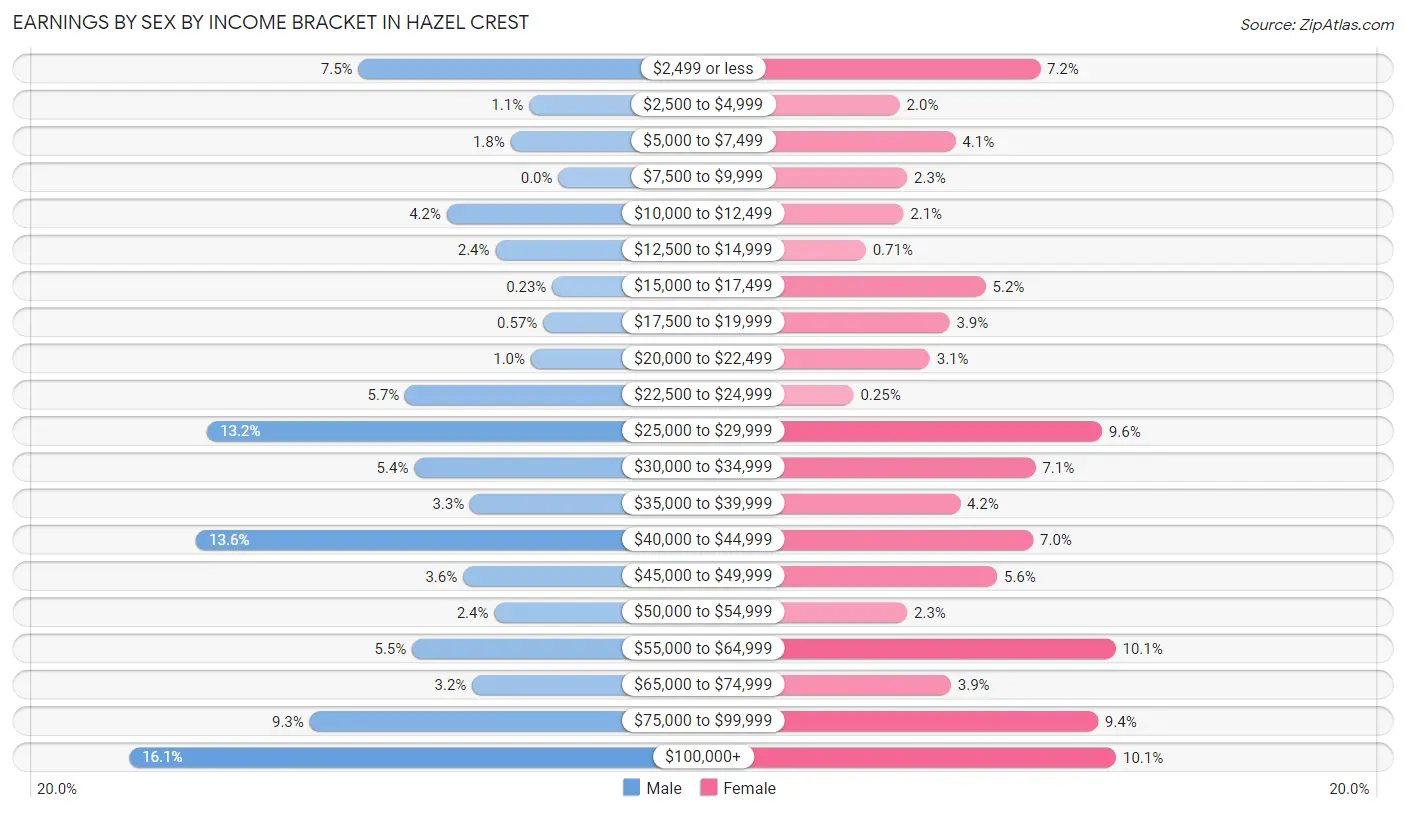
Earnings by Sex by Income Bracket in Hazel Crest
The most common earnings brackets in Hazel Crest are $100,000+ for men (423 | 16.1%) and $100,000+ for women (357 | 10.1%).
| Income | Male | Female |
| $2,499 or less | 197 (7.5%) | 256 (7.2%) |
| $2,500 to $4,999 | 29 (1.1%) | 70 (2.0%) |
| $5,000 to $7,499 | 47 (1.8%) | 144 (4.1%) |
| $7,500 to $9,999 | 0 (0.0%) | 80 (2.3%) |
| $10,000 to $12,499 | 110 (4.2%) | 75 (2.1%) |
| $12,500 to $14,999 | 62 (2.4%) | 25 (0.7%) |
| $15,000 to $17,499 | 6 (0.2%) | 184 (5.2%) |
| $17,500 to $19,999 | 15 (0.6%) | 136 (3.8%) |
| $20,000 to $22,499 | 27 (1.0%) | 110 (3.1%) |
| $22,500 to $24,999 | 151 (5.7%) | 9 (0.3%) |
| $25,000 to $29,999 | 346 (13.2%) | 338 (9.6%) |
| $30,000 to $34,999 | 142 (5.4%) | 250 (7.1%) |
| $35,000 to $39,999 | 87 (3.3%) | 150 (4.2%) |
| $40,000 to $44,999 | 357 (13.6%) | 247 (7.0%) |
| $45,000 to $49,999 | 94 (3.6%) | 199 (5.6%) |
| $50,000 to $54,999 | 63 (2.4%) | 80 (2.3%) |
| $55,000 to $64,999 | 144 (5.5%) | 356 (10.1%) |
| $65,000 to $74,999 | 85 (3.2%) | 138 (3.9%) |
| $75,000 to $99,999 | 245 (9.3%) | 333 (9.4%) |
| $100,000+ | 423 (16.1%) | 357 (10.1%) |
| Total | 2,630 (100.0%) | 3,537 (100.0%) |
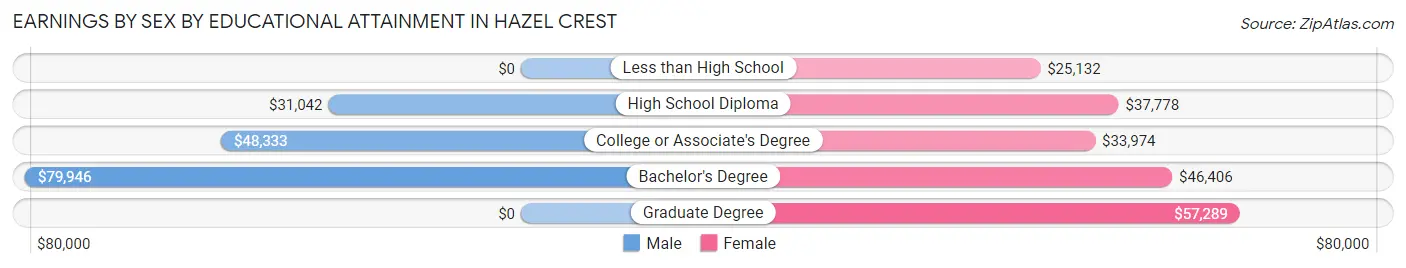
Earnings by Sex by Educational Attainment in Hazel Crest
Average earnings in Hazel Crest are $41,481 for men and $43,164 for women, a difference of 3.9%. Men with an educational attainment of bachelor's degree enjoy the highest average annual earnings of $79,946, while those with high school diploma education earn the least with $31,042. Women with an educational attainment of graduate degree earn the most with the average annual earnings of $57,289, while those with less than high school education have the smallest earnings of $25,132.
| Educational Attainment | Male Income | Female Income |
| Less than High School | - | - |
| High School Diploma | $31,042 | $37,778 |
| College or Associate's Degree | $48,333 | $33,974 |
| Bachelor's Degree | $79,946 | $46,406 |
| Graduate Degree | - | - |
| Total | $41,481 | $43,164 |
Family Income in Hazel Crest
Family Income Brackets in Hazel Crest
According to the Hazel Crest family income data, there are 832 families falling into the $100,000 to $149,999 income range, which is the most common income bracket and makes up 25.4% of all families.
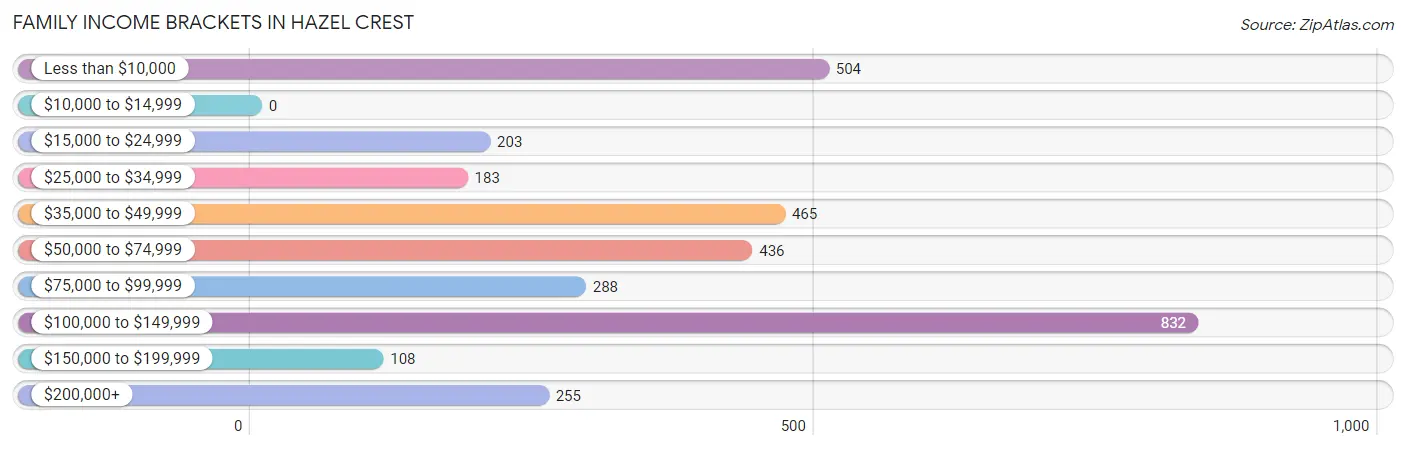
| Income Bracket | # Families | % Families |
| Less than $10,000 | 504 | 15.4% |
| $10,000 to $14,999 | 0 | 0.0% |
| $15,000 to $24,999 | 203 | 6.2% |
| $25,000 to $34,999 | 183 | 5.6% |
| $35,000 to $49,999 | 465 | 14.2% |
| $50,000 to $74,999 | 436 | 13.3% |
| $75,000 to $99,999 | 288 | 8.8% |
| $100,000 to $149,999 | 832 | 25.4% |
| $150,000 to $199,999 | 108 | 3.3% |
| $200,000+ | 255 | 7.8% |
Family Income by Famaliy Size in Hazel Crest
7+ person families (45 | 1.4%) account for the highest median family income in Hazel Crest with $105,817 per family, while 2-person families (1,139 | 34.8%) have the highest median income of $46,128 per family member.
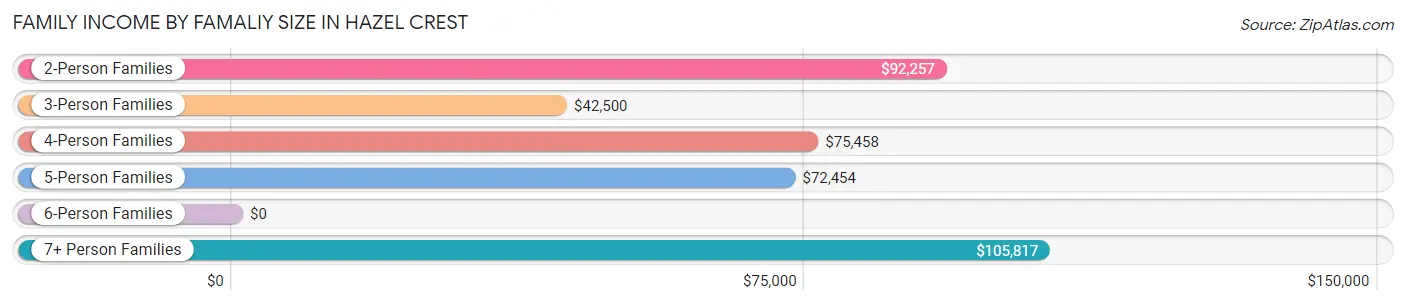
| Income Bracket | # Families | Median Income |
| 2-Person Families | 1,139 (34.8%) | $92,257 |
| 3-Person Families | 1,140 (34.8%) | $42,500 |
| 4-Person Families | 517 (15.8%) | $75,458 |
| 5-Person Families | 397 (12.1%) | $72,454 |
| 6-Person Families | 37 (1.1%) | $0 |
| 7+ Person Families | 45 (1.4%) | $105,817 |
| Total | 3,275 (100.0%) | $64,349 |
Family Income by Number of Earners in Hazel Crest
The median family income in Hazel Crest is $64,349, with families comprising 3+ earners (303) having the highest median family income of $227,386, while families with no earners (706) have the lowest median family income of $2,499, accounting for 9.2% and 21.6% of families, respectively.
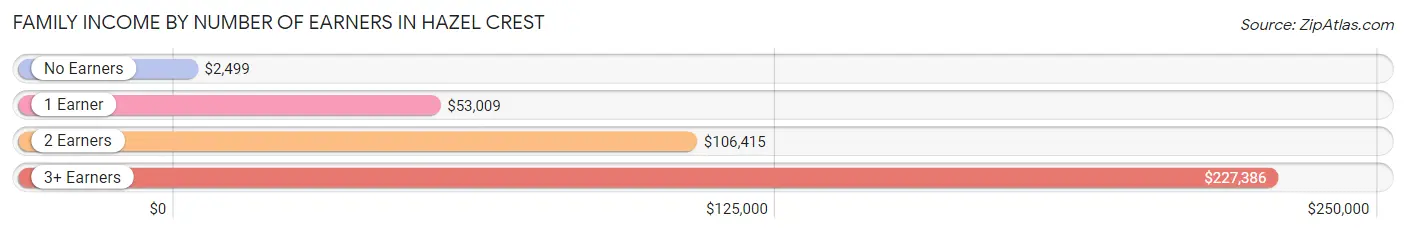
| Number of Earners | # Families | Median Income |
| No Earners | 706 (21.6%) | $2,499 |
| 1 Earner | 1,170 (35.7%) | $53,009 |
| 2 Earners | 1,096 (33.5%) | $106,415 |
| 3+ Earners | 303 (9.2%) | $227,386 |
| Total | 3,275 (100.0%) | $64,349 |
Household Income in Hazel Crest
Household Income Brackets in Hazel Crest
With 864 households falling in the category, the $100,000 to $149,999 income range is the most frequent in Hazel Crest, accounting for 18.5% of all households. In contrast, only 51 households (1.1%) fall into the $10,000 to $14,999 income bracket, making it the least populous group.
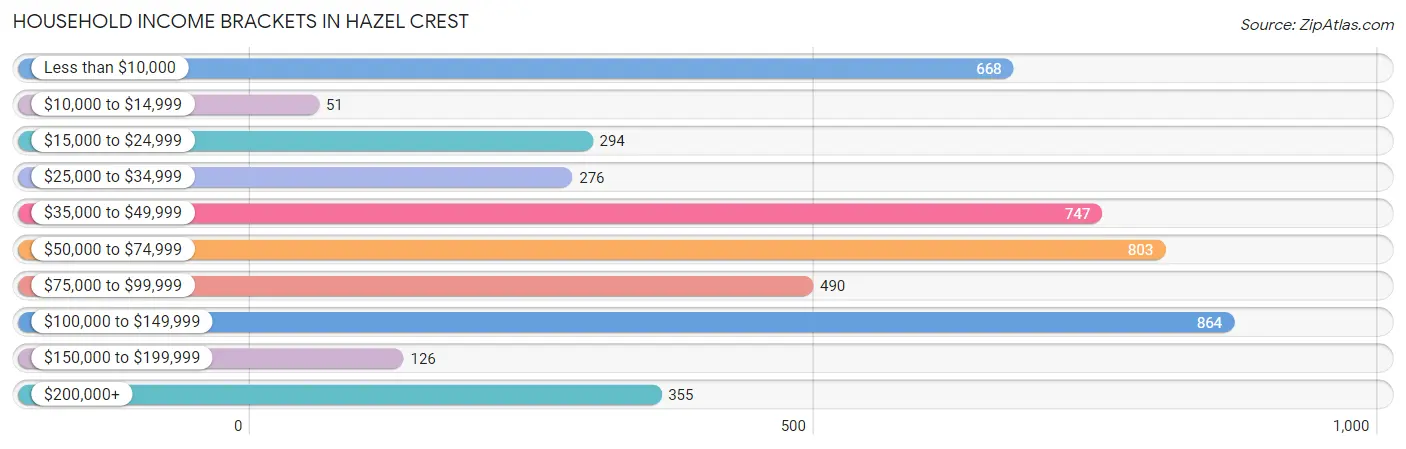
| Income Bracket | # Households | % Households |
| Less than $10,000 | 668 | 14.3% |
| $10,000 to $14,999 | 51 | 1.1% |
| $15,000 to $24,999 | 294 | 6.3% |
| $25,000 to $34,999 | 276 | 5.9% |
| $35,000 to $49,999 | 747 | 16.0% |
| $50,000 to $74,999 | 803 | 17.2% |
| $75,000 to $99,999 | 490 | 10.5% |
| $100,000 to $149,999 | 864 | 18.5% |
| $150,000 to $199,999 | 126 | 2.7% |
| $200,000+ | 355 | 7.6% |
Household Income by Householder Age in Hazel Crest
The median household income in Hazel Crest is $57,247, with the highest median household income of $88,476 found in the 45 to 64 years age bracket for the primary householder. A total of 1,768 households (37.9%) fall into this category. Meanwhile, the 15 to 24 years age bracket for the primary householder has the lowest median household income of $0, with 63 households (1.3%) in this group.
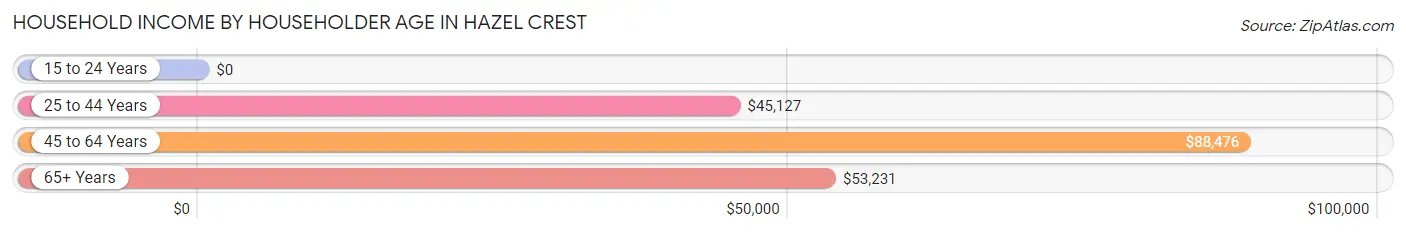
| Income Bracket | # Households | Median Income |
| 15 to 24 Years | 63 (1.3%) | $0 |
| 25 to 44 Years | 1,486 (31.8%) | $45,127 |
| 45 to 64 Years | 1,768 (37.9%) | $88,476 |
| 65+ Years | 1,353 (29.0%) | $53,231 |
| Total | 4,670 (100.0%) | $57,247 |
Poverty in Hazel Crest
Income Below Poverty by Sex and Age in Hazel Crest
With 22.9% poverty level for males and 22.6% for females among the residents of Hazel Crest, 12 to 14 year old males and 15 year old females are the most vulnerable to poverty, with 251 males (65.2%) and 293 females (81.2%) in their respective age groups living below the poverty level.
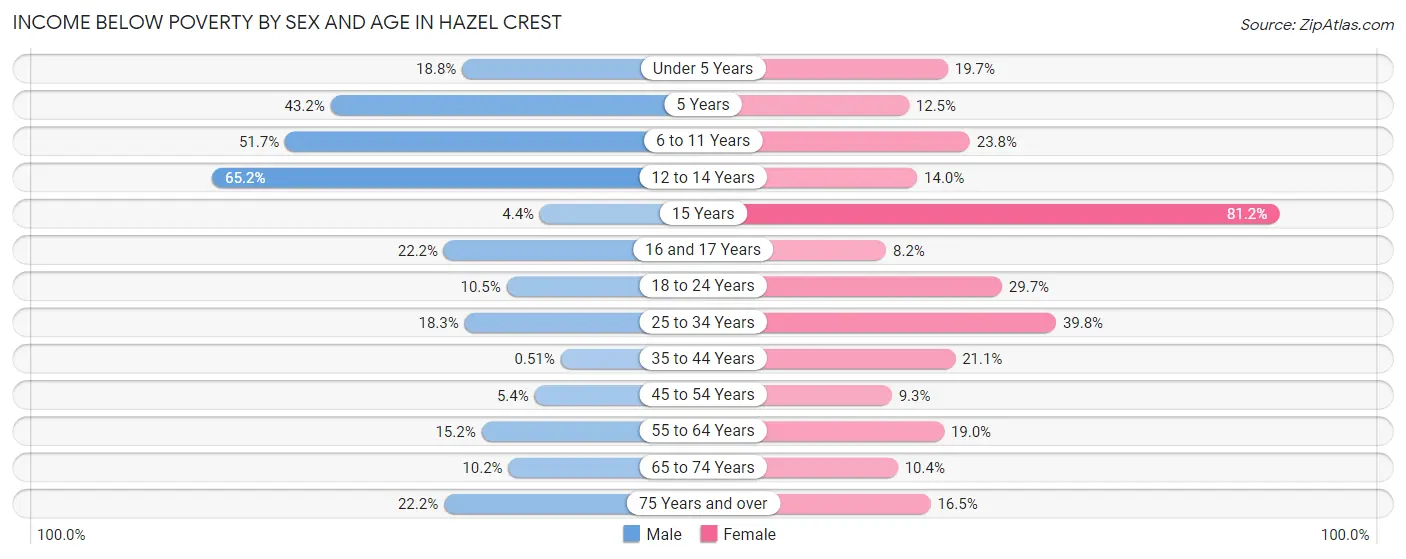
| Age Bracket | Male | Female |
| Under 5 Years | 37 (18.8%) | 131 (19.7%) |
| 5 Years | 35 (43.2%) | 29 (12.4%) |
| 6 to 11 Years | 464 (51.7%) | 105 (23.8%) |
| 12 to 14 Years | 251 (65.2%) | 66 (14.0%) |
| 15 Years | 6 (4.3%) | 293 (81.2%) |
| 16 and 17 Years | 59 (22.2%) | 24 (8.2%) |
| 18 to 24 Years | 41 (10.5%) | 129 (29.7%) |
| 25 to 34 Years | 192 (18.3%) | 448 (39.8%) |
| 35 to 44 Years | 2 (0.5%) | 157 (21.0%) |
| 45 to 54 Years | 34 (5.3%) | 124 (9.3%) |
| 55 to 64 Years | 96 (15.2%) | 113 (19.0%) |
| 65 to 74 Years | 46 (10.2%) | 69 (10.4%) |
| 75 Years and over | 74 (22.2%) | 67 (16.5%) |
| Total | 1,337 (22.9%) | 1,755 (22.6%) |
Income Above Poverty by Sex and Age in Hazel Crest
According to the poverty statistics in Hazel Crest, males aged 35 to 44 years and females aged 16 and 17 years are the age groups that are most secure financially, with 99.5% of males and 91.8% of females in these age groups living above the poverty line.
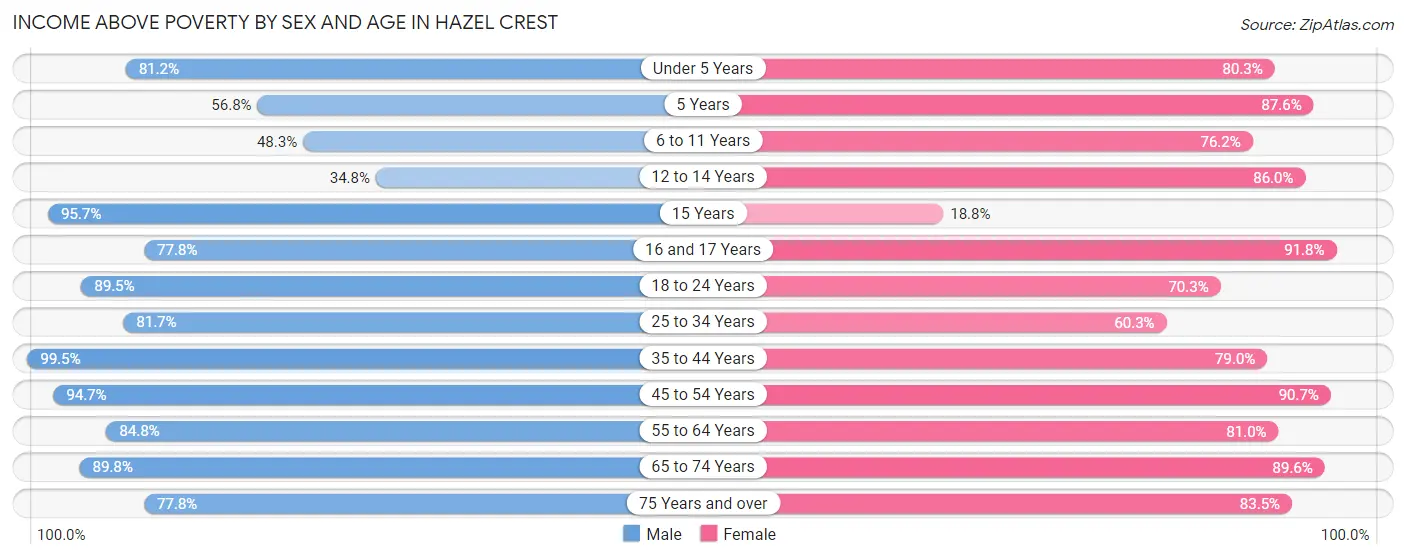
| Age Bracket | Male | Female |
| Under 5 Years | 160 (81.2%) | 535 (80.3%) |
| 5 Years | 46 (56.8%) | 204 (87.5%) |
| 6 to 11 Years | 434 (48.3%) | 337 (76.2%) |
| 12 to 14 Years | 134 (34.8%) | 406 (86.0%) |
| 15 Years | 132 (95.7%) | 68 (18.8%) |
| 16 and 17 Years | 207 (77.8%) | 268 (91.8%) |
| 18 to 24 Years | 348 (89.5%) | 305 (70.3%) |
| 25 to 34 Years | 855 (81.7%) | 679 (60.3%) |
| 35 to 44 Years | 392 (99.5%) | 589 (78.9%) |
| 45 to 54 Years | 602 (94.7%) | 1,215 (90.7%) |
| 55 to 64 Years | 536 (84.8%) | 483 (81.0%) |
| 65 to 74 Years | 405 (89.8%) | 596 (89.6%) |
| 75 Years and over | 260 (77.8%) | 340 (83.5%) |
| Total | 4,511 (77.1%) | 6,025 (77.4%) |
Income Below Poverty Among Married-Couple Families in Hazel Crest
The poverty statistics for married-couple families in Hazel Crest show that 13.3% or 152 of the total 1,141 families live below the poverty line. Families with 1 or 2 children have the highest poverty rate of 15.6%, comprising of 73 families. On the other hand, families with no children have the lowest poverty rate of 11.0%, which includes 60 families.
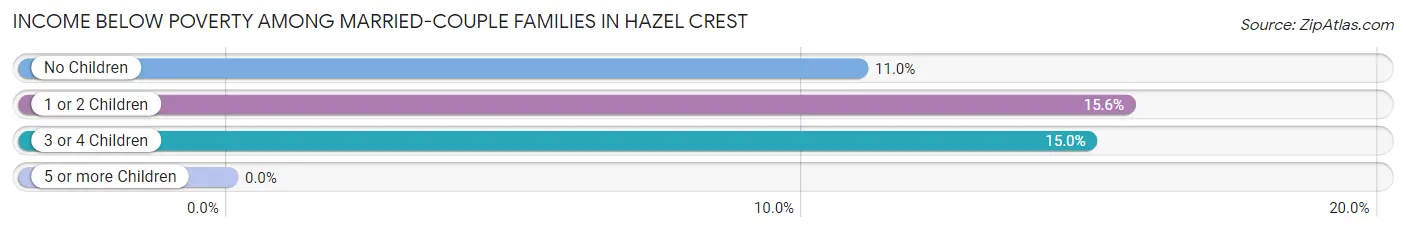
| Children | Above Poverty | Below Poverty |
| No Children | 487 (89.0%) | 60 (11.0%) |
| 1 or 2 Children | 394 (84.4%) | 73 (15.6%) |
| 3 or 4 Children | 108 (85.0%) | 19 (15.0%) |
| 5 or more Children | 0 (0.0%) | 0 (0.0%) |
| Total | 989 (86.7%) | 152 (13.3%) |
Income Below Poverty Among Single-Parent Households in Hazel Crest
According to the poverty data in Hazel Crest, 1.4% or 6 single-father households and 34.4% or 583 single-mother households are living below the poverty line. Among single-father households, those with 1 or 2 children have the highest poverty rate, with 6 households (4.8%) experiencing poverty. Likewise, among single-mother households, those with 1 or 2 children have the highest poverty rate, with 432 households (49.0%) falling below the poverty line.
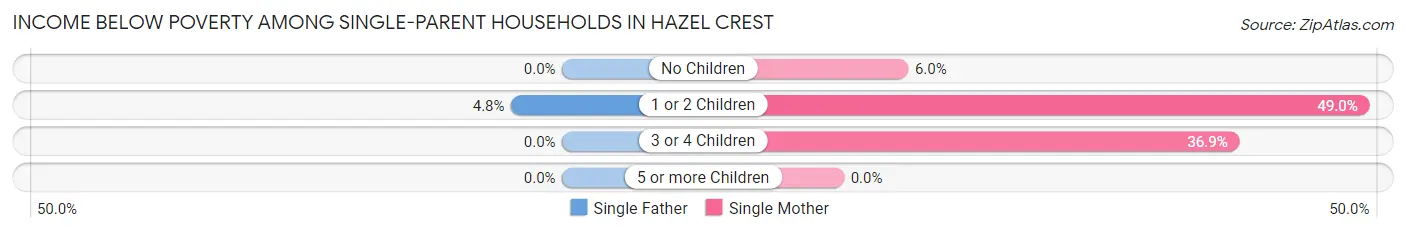
| Children | Single Father | Single Mother |
| No Children | 0 (0.0%) | 29 (6.0%) |
| 1 or 2 Children | 6 (4.8%) | 432 (49.0%) |
| 3 or 4 Children | 0 (0.0%) | 122 (36.9%) |
| 5 or more Children | 0 (0.0%) | 0 (0.0%) |
| Total | 6 (1.4%) | 583 (34.4%) |
Income Below Poverty Among Married-Couple vs Single-Parent Households in Hazel Crest
The poverty data for Hazel Crest shows that 152 of the married-couple family households (13.3%) and 589 of the single-parent households (27.6%) are living below the poverty level. Within the married-couple family households, those with 1 or 2 children have the highest poverty rate, with 73 households (15.6%) falling below the poverty line. Among the single-parent households, those with 1 or 2 children have the highest poverty rate, with 438 household (43.4%) living below poverty.
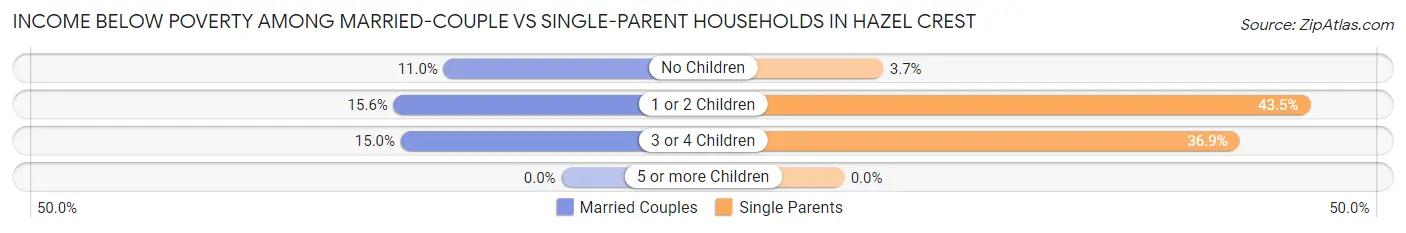
| Children | Married-Couple Families | Single-Parent Households |
| No Children | 60 (11.0%) | 29 (3.6%) |
| 1 or 2 Children | 73 (15.6%) | 438 (43.4%) |
| 3 or 4 Children | 19 (15.0%) | 122 (36.9%) |
| 5 or more Children | 0 (0.0%) | 0 (0.0%) |
| Total | 152 (13.3%) | 589 (27.6%) |
Race in Hazel Crest
The most populous races in Hazel Crest are Black / African American (11,897 | 86.6%), White / Caucasian (872 | 6.4%), and Hispanic or Latino (733 | 5.3%).
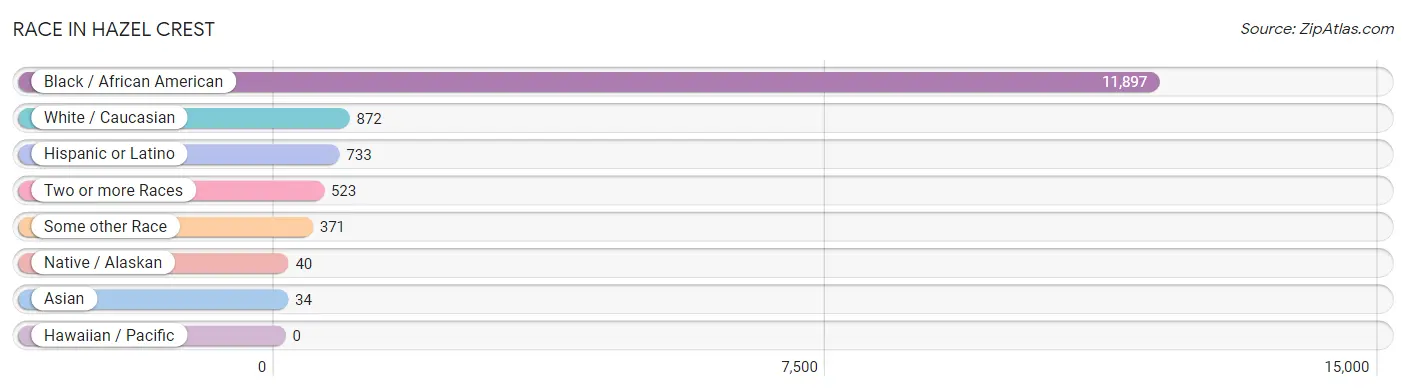
| Race | # Population | % Population |
| Asian | 34 | 0.3% |
| Black / African American | 11,897 | 86.6% |
| Hawaiian / Pacific | 0 | 0.0% |
| Hispanic or Latino | 733 | 5.3% |
| Native / Alaskan | 40 | 0.3% |
| White / Caucasian | 872 | 6.4% |
| Two or more Races | 523 | 3.8% |
| Some other Race | 371 | 2.7% |
| Total | 13,737 | 100.0% |
Ancestry in Hazel Crest
The most populous ancestries reported in Hazel Crest are Mexican (664 | 4.8%), Subsaharan African (544 | 4.0%), African (350 | 2.5%), Irish (246 | 1.8%), and Nigerian (194 | 1.4%), together accounting for 14.5% of all Hazel Crest residents.
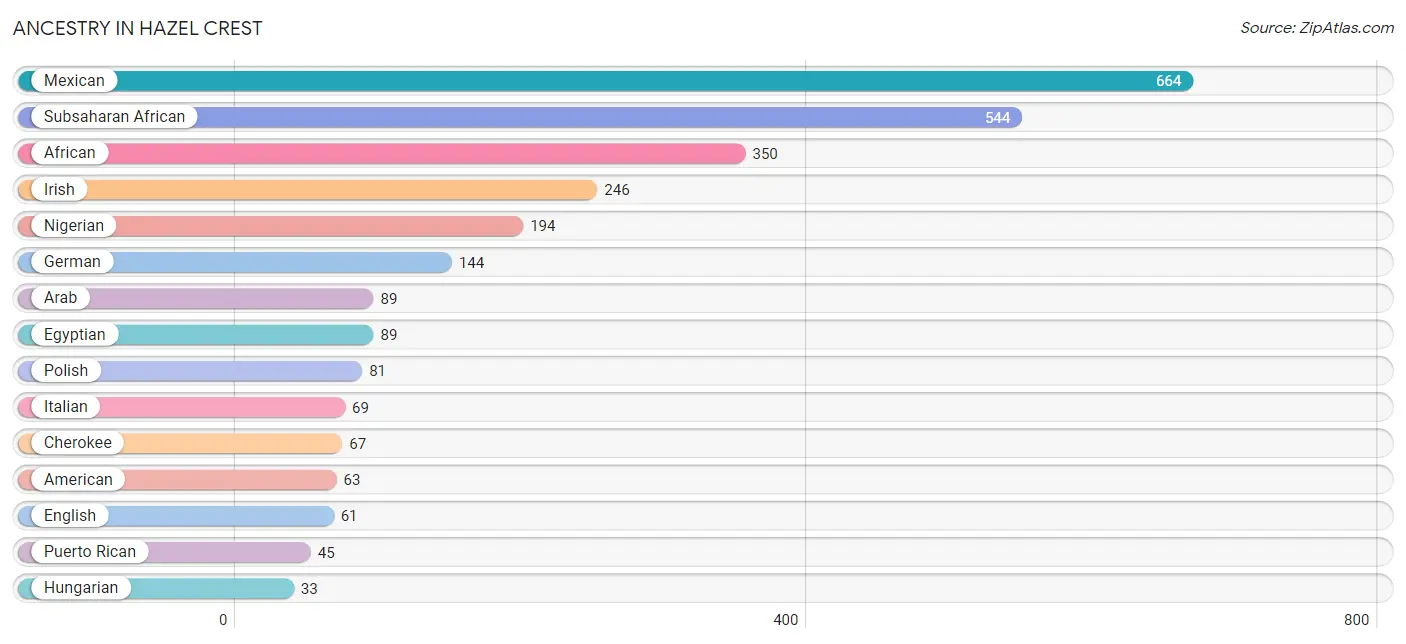
| Ancestry | # Population | % Population |
| African | 350 | 2.5% |
| American | 63 | 0.5% |
| Apache | 17 | 0.1% |
| Arab | 89 | 0.6% |
| Belizean | 27 | 0.2% |
| Bhutanese | 25 | 0.2% |
| Burmese | 12 | 0.1% |
| Central American Indian | 3 | 0.0% |
| Cherokee | 67 | 0.5% |
| Cuban | 3 | 0.0% |
| Egyptian | 89 | 0.6% |
| English | 61 | 0.4% |
| French | 13 | 0.1% |
| German | 144 | 1.1% |
| Hungarian | 33 | 0.2% |
| Indian (Asian) | 1 | 0.0% |
| Irish | 246 | 1.8% |
| Italian | 69 | 0.5% |
| Korean | 21 | 0.2% |
| Lithuanian | 9 | 0.1% |
| Mexican | 664 | 4.8% |
| Nigerian | 194 | 1.4% |
| Polish | 81 | 0.6% |
| Puerto Rican | 45 | 0.3% |
| Russian | 23 | 0.2% |
| Scotch-Irish | 20 | 0.2% |
| Sioux | 17 | 0.1% |
| Subsaharan African | 544 | 4.0% | View All 28 Rows |
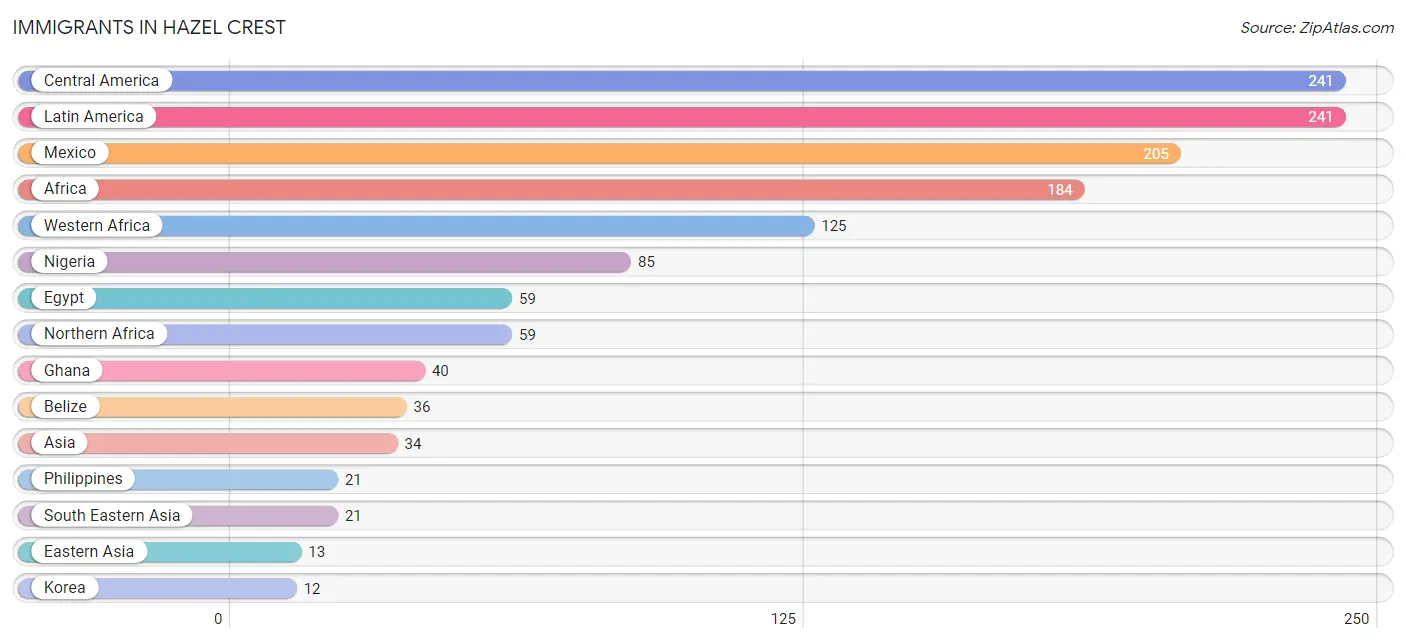
Immigrants in Hazel Crest
The most numerous immigrant groups reported in Hazel Crest came from Central America (241 | 1.8%), Latin America (241 | 1.8%), Mexico (205 | 1.5%), Africa (184 | 1.3%), and Western Africa (125 | 0.9%), together accounting for 7.2% of all Hazel Crest residents.
| Immigration Origin | # Population | % Population |
| Africa | 184 | 1.3% |
| Asia | 34 | 0.3% |
| Belize | 36 | 0.3% |
| Central America | 241 | 1.8% |
| China | 1 | 0.0% |
| Eastern Asia | 13 | 0.1% |
| Egypt | 59 | 0.4% |
| Ghana | 40 | 0.3% |
| Korea | 12 | 0.1% |
| Latin America | 241 | 1.8% |
| Mexico | 205 | 1.5% |
| Nigeria | 85 | 0.6% |
| Northern Africa | 59 | 0.4% |
| Philippines | 21 | 0.2% |
| South Eastern Asia | 21 | 0.2% |
| Western Africa | 125 | 0.9% | View All 16 Rows |
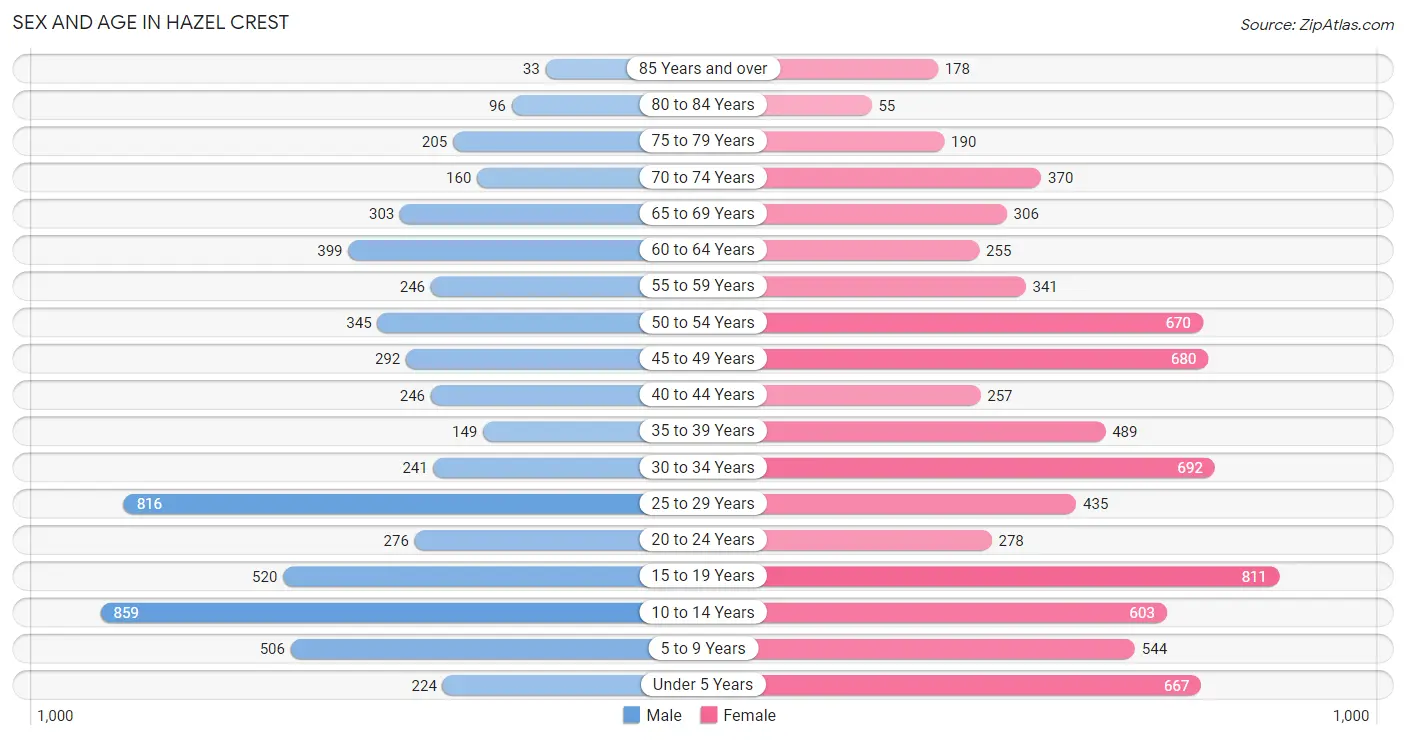
Sex and Age in Hazel Crest
Sex and Age in Hazel Crest
The most populous age groups in Hazel Crest are 10 to 14 Years (859 | 14.5%) for men and 15 to 19 Years (811 | 10.4%) for women.
| Age Bracket | Male | Female |
| Under 5 Years | 224 (3.8%) | 667 (8.5%) |
| 5 to 9 Years | 506 (8.6%) | 544 (7.0%) |
| 10 to 14 Years | 859 (14.5%) | 603 (7.7%) |
| 15 to 19 Years | 520 (8.8%) | 811 (10.4%) |
| 20 to 24 Years | 276 (4.7%) | 278 (3.5%) |
| 25 to 29 Years | 816 (13.8%) | 435 (5.6%) |
| 30 to 34 Years | 241 (4.1%) | 692 (8.8%) |
| 35 to 39 Years | 149 (2.5%) | 489 (6.2%) |
| 40 to 44 Years | 246 (4.2%) | 257 (3.3%) |
| 45 to 49 Years | 292 (4.9%) | 680 (8.7%) |
| 50 to 54 Years | 345 (5.8%) | 670 (8.6%) |
| 55 to 59 Years | 246 (4.2%) | 341 (4.4%) |
| 60 to 64 Years | 399 (6.7%) | 255 (3.3%) |
| 65 to 69 Years | 303 (5.1%) | 306 (3.9%) |
| 70 to 74 Years | 160 (2.7%) | 370 (4.7%) |
| 75 to 79 Years | 205 (3.5%) | 190 (2.4%) |
| 80 to 84 Years | 96 (1.6%) | 55 (0.7%) |
| 85 Years and over | 33 (0.6%) | 178 (2.3%) |
| Total | 5,916 (100.0%) | 7,821 (100.0%) |
Families and Households in Hazel Crest
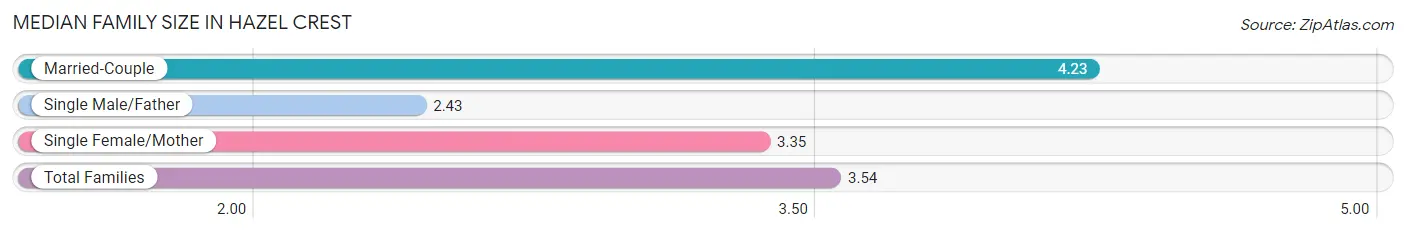
Median Family Size in Hazel Crest
The median family size in Hazel Crest is 3.54 persons per family, with married-couple families (1,141 | 34.8%) accounting for the largest median family size of 4.23 persons per family. On the other hand, single male/father families (437 | 13.3%) represent the smallest median family size with 2.43 persons per family.
| Family Type | # Families | Family Size |
| Married-Couple | 1,141 (34.8%) | 4.23 |
| Single Male/Father | 437 (13.3%) | 2.43 |
| Single Female/Mother | 1,697 (51.8%) | 3.35 |
| Total Families | 3,275 (100.0%) | 3.54 |
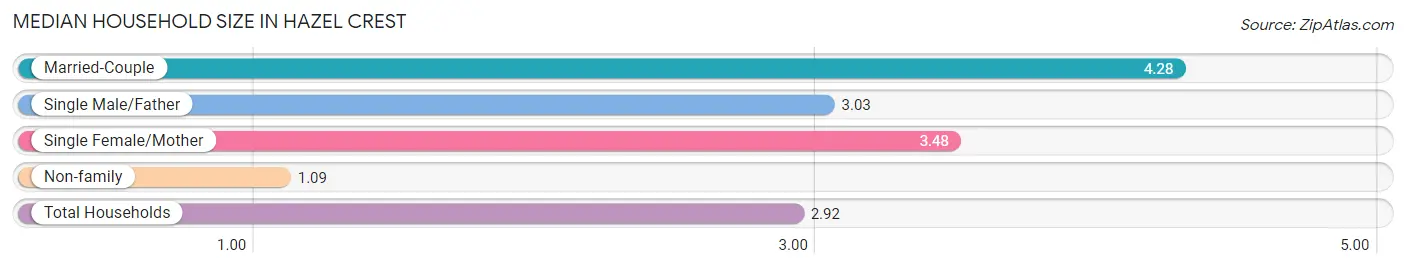
Median Household Size in Hazel Crest
The median household size in Hazel Crest is 2.92 persons per household, with married-couple households (1,141 | 24.4%) accounting for the largest median household size of 4.28 persons per household. non-family households (1,395 | 29.9%) represent the smallest median household size with 1.09 persons per household.
| Household Type | # Households | Household Size |
| Married-Couple | 1,141 (24.4%) | 4.28 |
| Single Male/Father | 437 (9.4%) | 3.03 |
| Single Female/Mother | 1,697 (36.3%) | 3.48 |
| Non-family | 1,395 (29.9%) | 1.09 |
| Total Households | 4,670 (100.0%) | 2.92 |
Household Size by Marriage Status in Hazel Crest
Out of a total of 4,670 households in Hazel Crest, 3,275 (70.1%) are family households, while 1,395 (29.9%) are nonfamily households. The most numerous type of family households are 3-person households, comprising 1,398, and the most common type of nonfamily households are 1-person households, comprising 1,317.
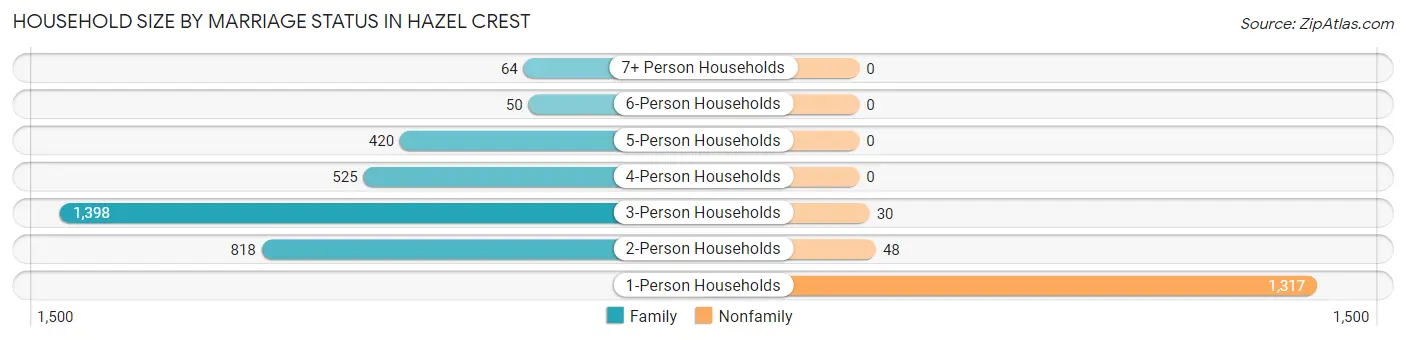
| Household Size | Family Households | Nonfamily Households |
| 1-Person Households | - | 1,317 (28.2%) |
| 2-Person Households | 818 (17.5%) | 48 (1.0%) |
| 3-Person Households | 1,398 (29.9%) | 30 (0.6%) |
| 4-Person Households | 525 (11.2%) | 0 (0.0%) |
| 5-Person Households | 420 (9.0%) | 0 (0.0%) |
| 6-Person Households | 50 (1.1%) | 0 (0.0%) |
| 7+ Person Households | 64 (1.4%) | 0 (0.0%) |
| Total | 3,275 (70.1%) | 1,395 (29.9%) |
Female Fertility in Hazel Crest
Fertility by Age in Hazel Crest
Average fertility rate in Hazel Crest is 20.0 births per 1,000 women. Women in the age bracket of 20 to 34 years have the highest fertility rate with 36.0 births per 1,000 women. Women in the age bracket of 20 to 34 years acount for 65.8% of all women with births.
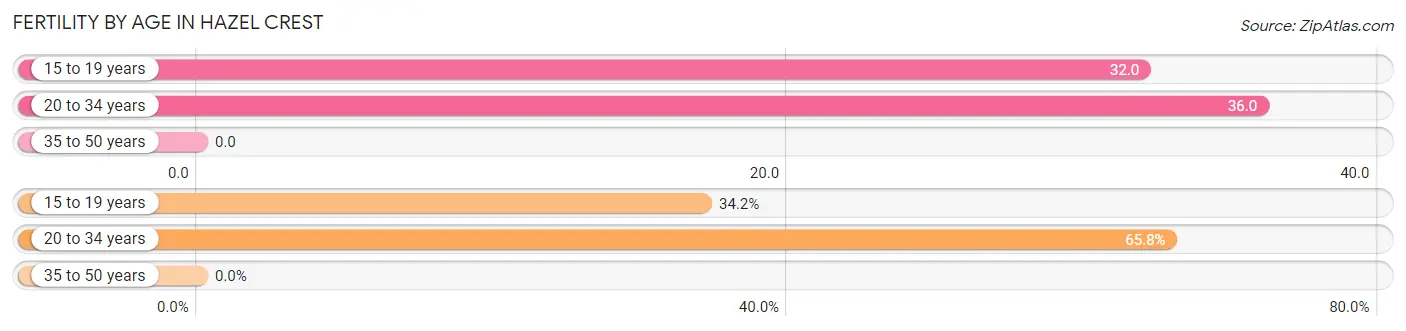
| Age Bracket | Women with Births | Births / 1,000 Women |
| 15 to 19 years | 26 (34.2%) | 32.0 |
| 20 to 34 years | 50 (65.8%) | 36.0 |
| 35 to 50 years | 0 (0.0%) | 0.0 |
| Total | 76 (100.0%) | 20.0 |
Fertility by Age by Marriage Status in Hazel Crest
65.8% of women with births (76) in Hazel Crest are married. The highest percentage of unmarried women with births falls into 15 to 19 years age bracket with 100.0% of them unmarried at the time of birth, while the lowest percentage of unmarried women with births belong to 20 to 34 years age bracket with 0.0% of them unmarried.
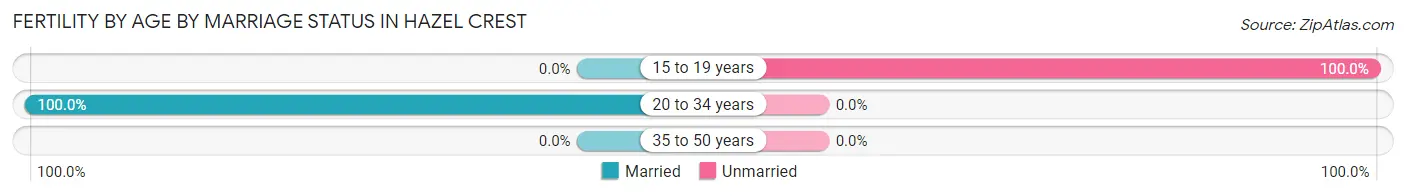
| Age Bracket | Married | Unmarried |
| 15 to 19 years | 0 (0.0%) | 26 (100.0%) |
| 20 to 34 years | 50 (100.0%) | 0 (0.0%) |
| 35 to 50 years | 0 (0.0%) | 0 (0.0%) |
| Total | 50 (65.8%) | 26 (34.2%) |
Fertility by Education in Hazel Crest
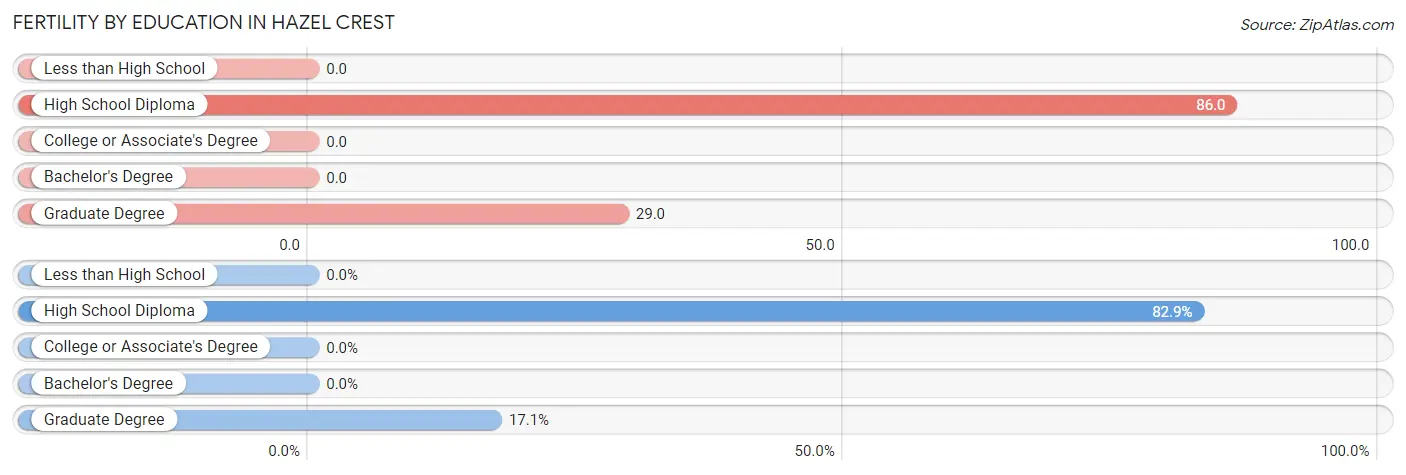
| Educational Attainment | Women with Births | Births / 1,000 Women |
| Less than High School | 0 (0.0%) | 0.0 |
| High School Diploma | 63 (82.9%) | 86.0 |
| College or Associate's Degree | 0 (0.0%) | 0.0 |
| Bachelor's Degree | 0 (0.0%) | 0.0 |
| Graduate Degree | 13 (17.1%) | 29.0 |
| Total | 76 (100.0%) | 20.0 |
Fertility by Education by Marriage Status in Hazel Crest
34.2% of women with births in Hazel Crest are unmarried. Women with the educational attainment of graduate degree are most likely to be married with 100.0% of them married at childbirth, while women with the educational attainment of high school diploma are least likely to be married with 41.3% of them unmarried at childbirth.
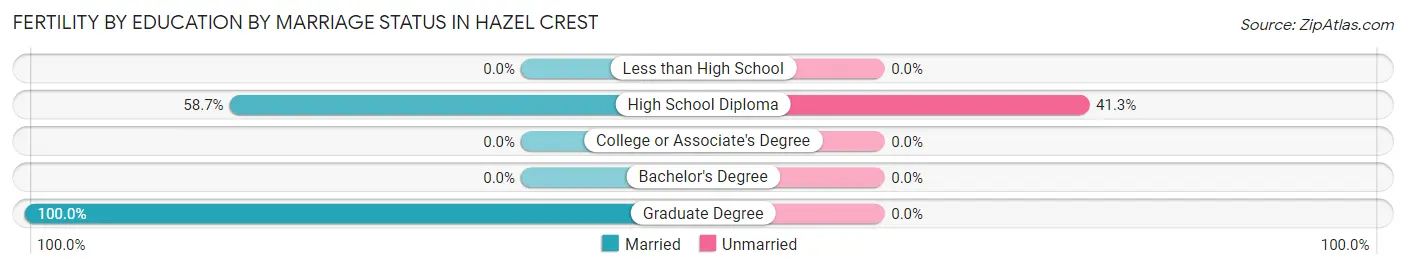
| Educational Attainment | Married | Unmarried |
| Less than High School | 0 (0.0%) | 0 (0.0%) |
| High School Diploma | 37 (58.7%) | 26 (41.3%) |
| College or Associate's Degree | 0 (0.0%) | 0 (0.0%) |
| Bachelor's Degree | 0 (0.0%) | 0 (0.0%) |
| Graduate Degree | 13 (100.0%) | 0 (0.0%) |
| Total | 50 (65.8%) | 26 (34.2%) |
Employment Characteristics in Hazel Crest
Employment by Class of Employer in Hazel Crest
Among the 5,483 employed individuals in Hazel Crest, private company employees (3,386 | 61.8%), local government employees (803 | 14.6%), and not-for-profit organizations (586 | 10.7%) make up the most common classes of employment.
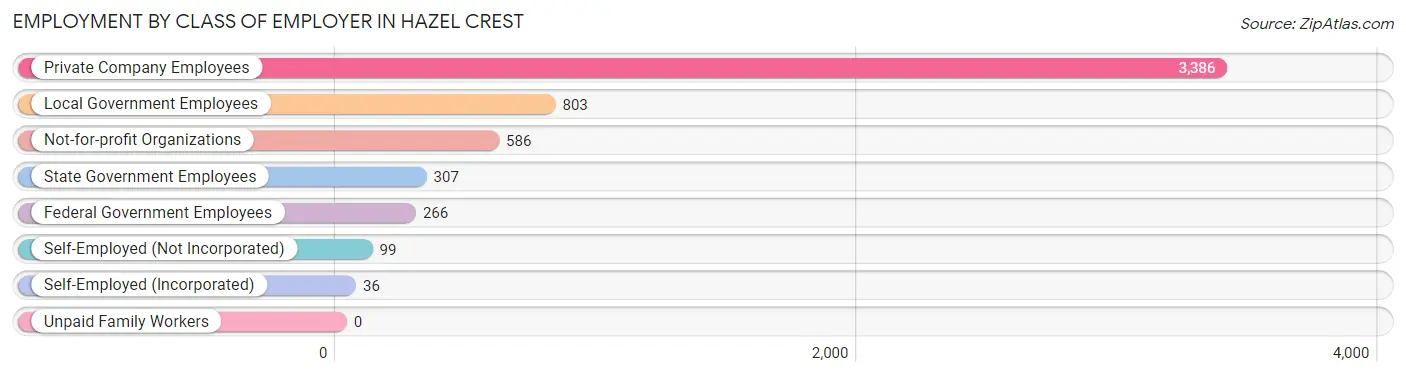
| Employer Class | # Employees | % Employees |
| Private Company Employees | 3,386 | 61.8% |
| Self-Employed (Incorporated) | 36 | 0.7% |
| Self-Employed (Not Incorporated) | 99 | 1.8% |
| Not-for-profit Organizations | 586 | 10.7% |
| Local Government Employees | 803 | 14.6% |
| State Government Employees | 307 | 5.6% |
| Federal Government Employees | 266 | 4.9% |
| Unpaid Family Workers | 0 | 0.0% |
| Total | 5,483 | 100.0% |
Employment Status by Age in Hazel Crest
According to the labor force statistics for Hazel Crest, out of the total population over 16 years of age (9,835), 66.2% or 6,511 individuals are in the labor force, with 13.7% or 892 of them unemployed. The age group with the highest labor force participation rate is 30 to 34 years, with 88.2% or 823 individuals in the labor force. Within the labor force, the 16 to 19 years age range has the highest percentage of unemployed individuals, with 41.6% or 124 of them being unemployed.
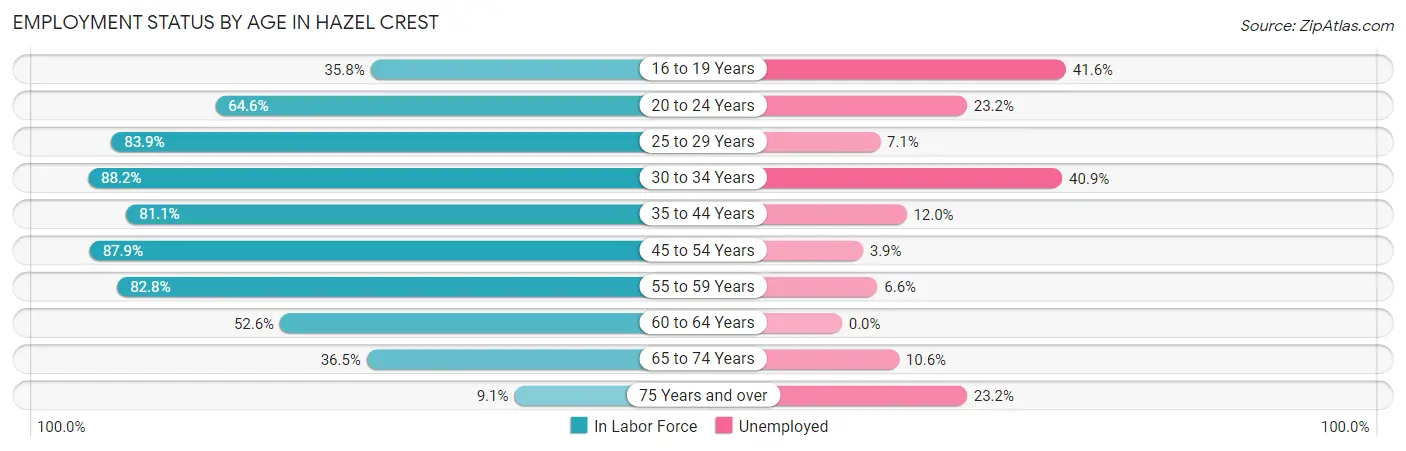
| Age Bracket | In Labor Force | Unemployed |
| 16 to 19 Years | 298 (35.8%) | 124 (41.6%) |
| 20 to 24 Years | 358 (64.6%) | 83 (23.2%) |
| 25 to 29 Years | 1,050 (83.9%) | 75 (7.1%) |
| 30 to 34 Years | 823 (88.2%) | 337 (40.9%) |
| 35 to 44 Years | 925 (81.1%) | 111 (12.0%) |
| 45 to 54 Years | 1,747 (87.9%) | 68 (3.9%) |
| 55 to 59 Years | 486 (82.8%) | 32 (6.6%) |
| 60 to 64 Years | 344 (52.6%) | 0 (0.0%) |
| 65 to 74 Years | 416 (36.5%) | 44 (10.6%) |
| 75 Years and over | 69 (9.1%) | 16 (23.2%) |
| Total | 6,511 (66.2%) | 892 (13.7%) |
Employment Status by Educational Attainment in Hazel Crest
According to labor force statistics for Hazel Crest, 82.0% of individuals (5,373) out of the total population between 25 and 64 years of age (6,553) are in the labor force, with 11.6% or 623 of them being unemployed. The group with the highest labor force participation rate are those with the educational attainment of bachelor's degree or higher, with 87.1% or 1,819 individuals in the labor force. Within the labor force, individuals with less than high school education have the highest percentage of unemployment, with 30.9% or 30 of them being unemployed.
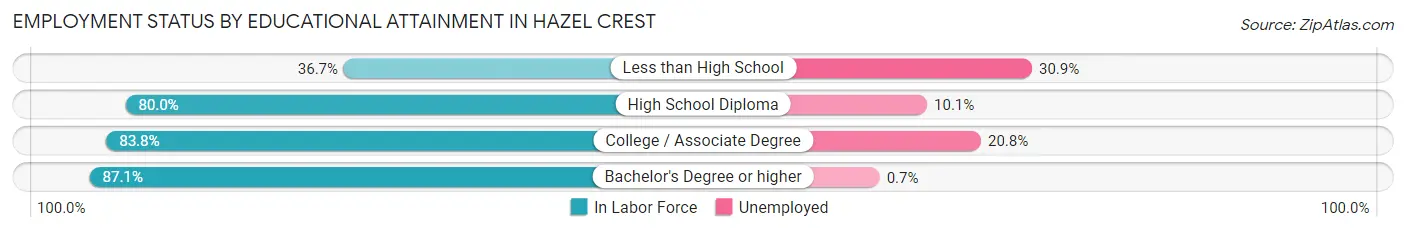
| Educational Attainment | In Labor Force | Unemployed |
| Less than High School | 97 (36.7%) | 82 (30.9%) |
| High School Diploma | 1,304 (80.0%) | 165 (10.1%) |
| College / Associate Degree | 2,154 (83.8%) | 535 (20.8%) |
| Bachelor's Degree or higher | 1,819 (87.1%) | 15 (0.7%) |
| Total | 5,373 (82.0%) | 760 (11.6%) |
Employment Occupations by Sex in Hazel Crest
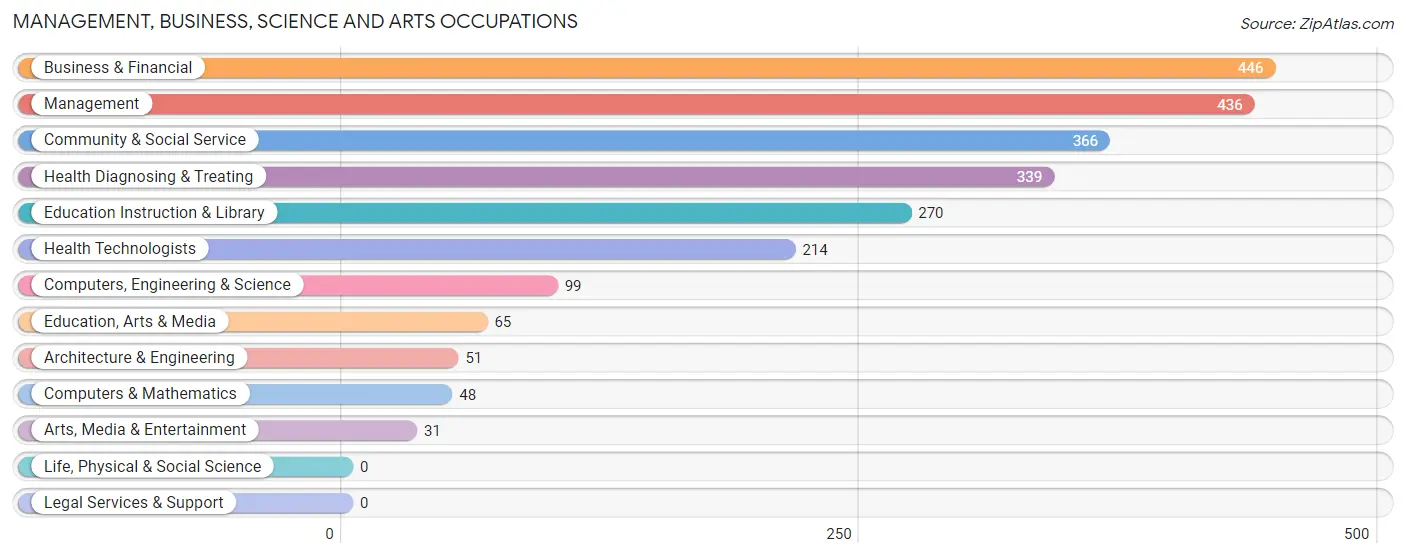
Management, Business, Science and Arts Occupations
The most common Management, Business, Science and Arts occupations in Hazel Crest are Business & Financial (446 | 7.9%), Management (436 | 7.7%), Community & Social Service (366 | 6.5%), Health Diagnosing & Treating (339 | 6.0%), and Education Instruction & Library (270 | 4.8%).
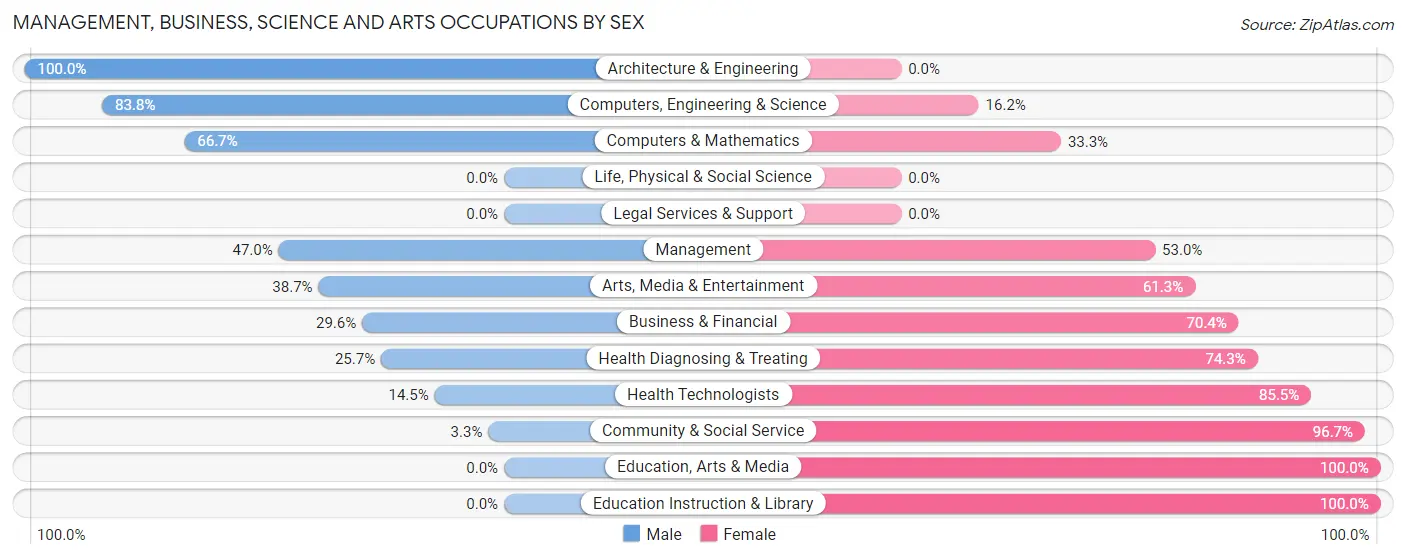
Management, Business, Science and Arts Occupations by Sex
Within the Management, Business, Science and Arts occupations in Hazel Crest, the most male-oriented occupations are Architecture & Engineering (100.0%), Computers, Engineering & Science (83.8%), and Computers & Mathematics (66.7%), while the most female-oriented occupations are Education, Arts & Media (100.0%), Education Instruction & Library (100.0%), and Community & Social Service (96.7%).
| Occupation | Male | Female |
| Management | 205 (47.0%) | 231 (53.0%) |
| Business & Financial | 132 (29.6%) | 314 (70.4%) |
| Computers, Engineering & Science | 83 (83.8%) | 16 (16.2%) |
| Computers & Mathematics | 32 (66.7%) | 16 (33.3%) |
| Architecture & Engineering | 51 (100.0%) | 0 (0.0%) |
| Life, Physical & Social Science | 0 (0.0%) | 0 (0.0%) |
| Community & Social Service | 12 (3.3%) | 354 (96.7%) |
| Education, Arts & Media | 0 (0.0%) | 65 (100.0%) |
| Legal Services & Support | 0 (0.0%) | 0 (0.0%) |
| Education Instruction & Library | 0 (0.0%) | 270 (100.0%) |
| Arts, Media & Entertainment | 12 (38.7%) | 19 (61.3%) |
| Health Diagnosing & Treating | 87 (25.7%) | 252 (74.3%) |
| Health Technologists | 31 (14.5%) | 183 (85.5%) |
| Total (Category) | 519 (30.8%) | 1,167 (69.2%) |
| Total (Overall) | 2,442 (43.4%) | 3,183 (56.6%) |
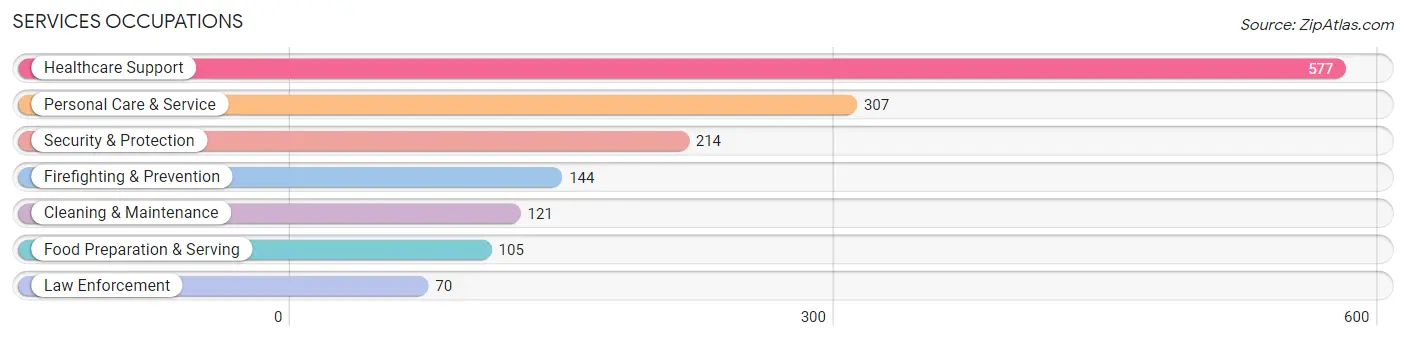
Services Occupations
The most common Services occupations in Hazel Crest are Healthcare Support (577 | 10.3%), Personal Care & Service (307 | 5.5%), Security & Protection (214 | 3.8%), Firefighting & Prevention (144 | 2.6%), and Cleaning & Maintenance (121 | 2.1%).
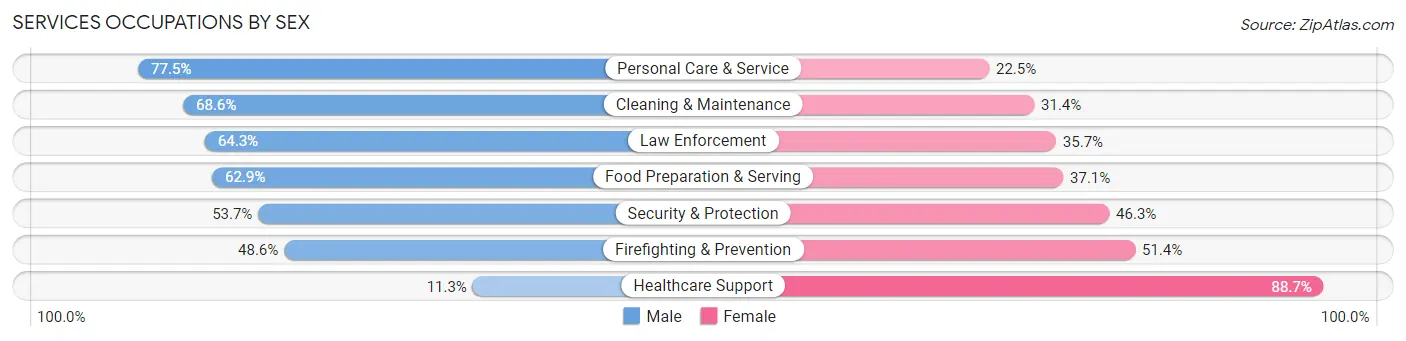
Services Occupations by Sex
Within the Services occupations in Hazel Crest, the most male-oriented occupations are Personal Care & Service (77.5%), Cleaning & Maintenance (68.6%), and Law Enforcement (64.3%), while the most female-oriented occupations are Healthcare Support (88.7%), Firefighting & Prevention (51.4%), and Security & Protection (46.3%).
| Occupation | Male | Female |
| Healthcare Support | 65 (11.3%) | 512 (88.7%) |
| Security & Protection | 115 (53.7%) | 99 (46.3%) |
| Firefighting & Prevention | 70 (48.6%) | 74 (51.4%) |
| Law Enforcement | 45 (64.3%) | 25 (35.7%) |
| Food Preparation & Serving | 66 (62.9%) | 39 (37.1%) |
| Cleaning & Maintenance | 83 (68.6%) | 38 (31.4%) |
| Personal Care & Service | 238 (77.5%) | 69 (22.5%) |
| Total (Category) | 567 (42.8%) | 757 (57.2%) |
| Total (Overall) | 2,442 (43.4%) | 3,183 (56.6%) |
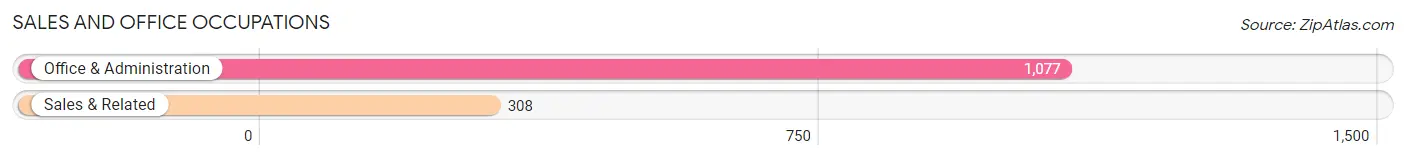
Sales and Office Occupations
The most common Sales and Office occupations in Hazel Crest are Office & Administration (1,077 | 19.2%), and Sales & Related (308 | 5.5%).
Sales and Office Occupations by Sex
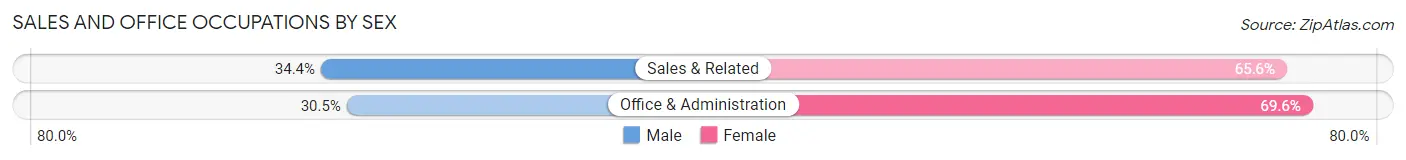
| Occupation | Male | Female |
| Sales & Related | 106 (34.4%) | 202 (65.6%) |
| Office & Administration | 328 (30.4%) | 749 (69.6%) |
| Total (Category) | 434 (31.3%) | 951 (68.7%) |
| Total (Overall) | 2,442 (43.4%) | 3,183 (56.6%) |
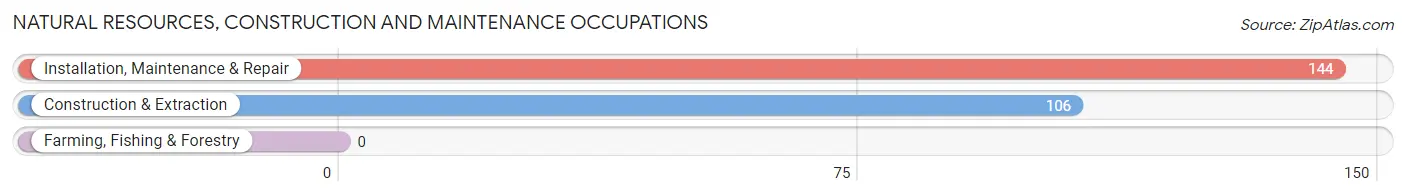
Natural Resources, Construction and Maintenance Occupations
The most common Natural Resources, Construction and Maintenance occupations in Hazel Crest are Installation, Maintenance & Repair (144 | 2.6%), and Construction & Extraction (106 | 1.9%).
Natural Resources, Construction and Maintenance Occupations by Sex
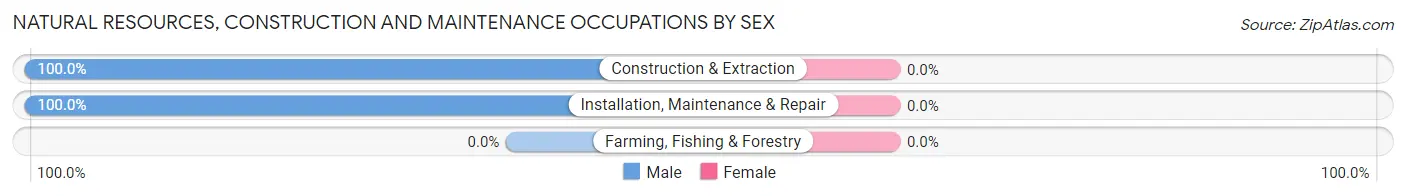
| Occupation | Male | Female |
| Farming, Fishing & Forestry | 0 (0.0%) | 0 (0.0%) |
| Construction & Extraction | 106 (100.0%) | 0 (0.0%) |
| Installation, Maintenance & Repair | 144 (100.0%) | 0 (0.0%) |
| Total (Category) | 250 (100.0%) | 0 (0.0%) |
| Total (Overall) | 2,442 (43.4%) | 3,183 (56.6%) |
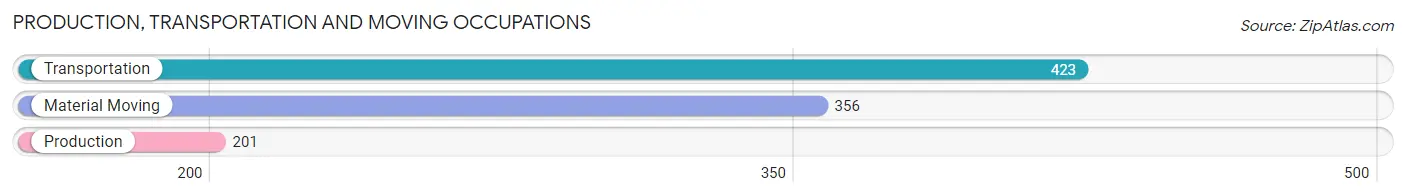
Production, Transportation and Moving Occupations
The most common Production, Transportation and Moving occupations in Hazel Crest are Transportation (423 | 7.5%), Material Moving (356 | 6.3%), and Production (201 | 3.6%).
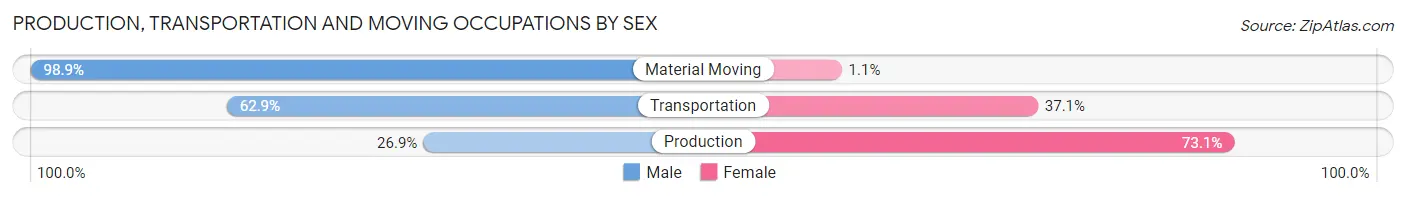
Production, Transportation and Moving Occupations by Sex
| Occupation | Male | Female |
| Production | 54 (26.9%) | 147 (73.1%) |
| Transportation | 266 (62.9%) | 157 (37.1%) |
| Material Moving | 352 (98.9%) | 4 (1.1%) |
| Total (Category) | 672 (68.6%) | 308 (31.4%) |
| Total (Overall) | 2,442 (43.4%) | 3,183 (56.6%) |
Employment Industries by Sex in Hazel Crest
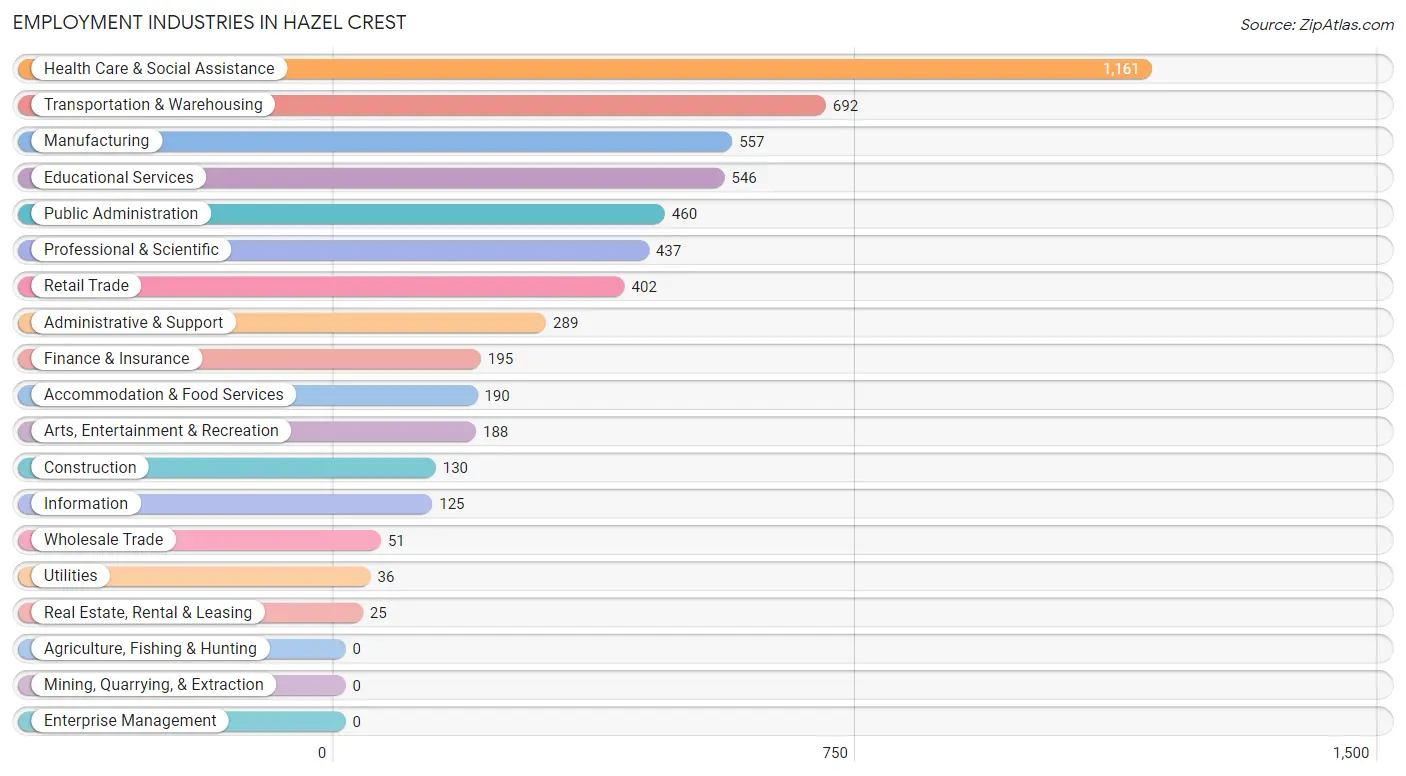
Employment Industries in Hazel Crest
The major employment industries in Hazel Crest include Health Care & Social Assistance (1,161 | 20.6%), Transportation & Warehousing (692 | 12.3%), Manufacturing (557 | 9.9%), Educational Services (546 | 9.7%), and Public Administration (460 | 8.2%).
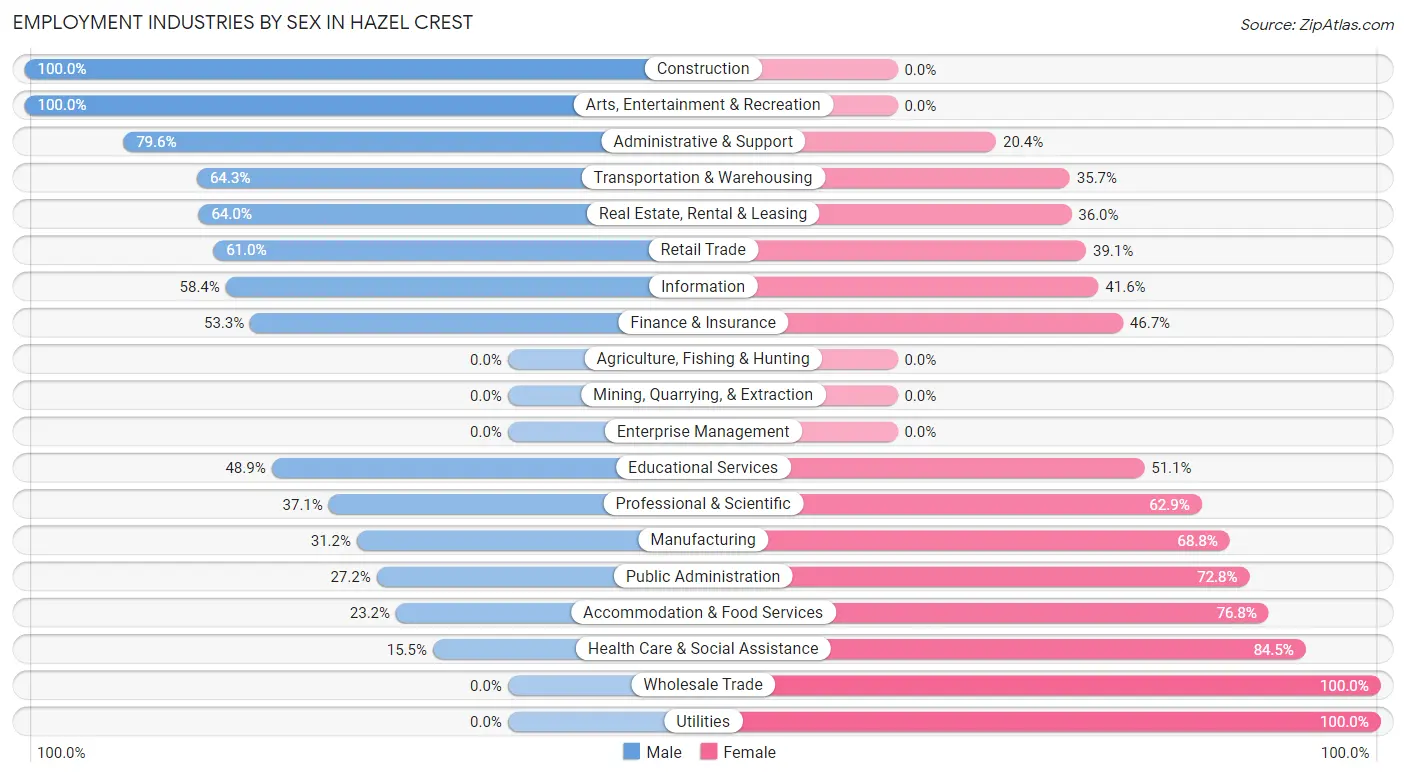
Employment Industries by Sex in Hazel Crest
The Hazel Crest industries that see more men than women are Construction (100.0%), Arts, Entertainment & Recreation (100.0%), and Administrative & Support (79.6%), whereas the industries that tend to have a higher number of women are Wholesale Trade (100.0%), Utilities (100.0%), and Health Care & Social Assistance (84.5%).
| Industry | Male | Female |
| Agriculture, Fishing & Hunting | 0 (0.0%) | 0 (0.0%) |
| Mining, Quarrying, & Extraction | 0 (0.0%) | 0 (0.0%) |
| Construction | 130 (100.0%) | 0 (0.0%) |
| Manufacturing | 174 (31.2%) | 383 (68.8%) |
| Wholesale Trade | 0 (0.0%) | 51 (100.0%) |
| Retail Trade | 245 (61.0%) | 157 (39.1%) |
| Transportation & Warehousing | 445 (64.3%) | 247 (35.7%) |
| Utilities | 0 (0.0%) | 36 (100.0%) |
| Information | 73 (58.4%) | 52 (41.6%) |
| Finance & Insurance | 104 (53.3%) | 91 (46.7%) |
| Real Estate, Rental & Leasing | 16 (64.0%) | 9 (36.0%) |
| Professional & Scientific | 162 (37.1%) | 275 (62.9%) |
| Enterprise Management | 0 (0.0%) | 0 (0.0%) |
| Administrative & Support | 230 (79.6%) | 59 (20.4%) |
| Educational Services | 267 (48.9%) | 279 (51.1%) |
| Health Care & Social Assistance | 180 (15.5%) | 981 (84.5%) |
| Arts, Entertainment & Recreation | 188 (100.0%) | 0 (0.0%) |
| Accommodation & Food Services | 44 (23.2%) | 146 (76.8%) |
| Public Administration | 125 (27.2%) | 335 (72.8%) |
| Total | 2,442 (43.4%) | 3,183 (56.6%) |
Education in Hazel Crest
School Enrollment in Hazel Crest
The most common levels of schooling among the 4,203 students in Hazel Crest are middle school (1,337 | 31.8%), high school (1,037 | 24.7%), and college / undergraduate (594 | 14.1%).
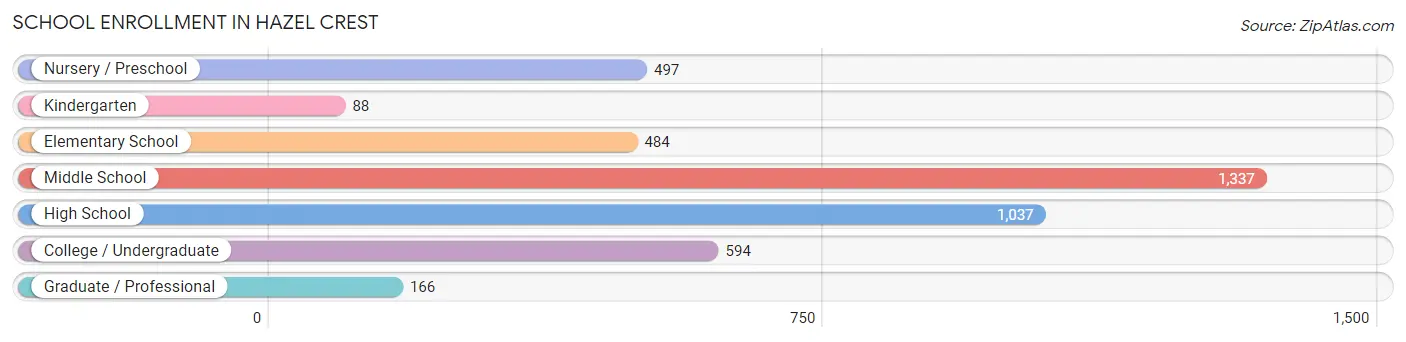
| School Level | # Students | % Students |
| Nursery / Preschool | 497 | 11.8% |
| Kindergarten | 88 | 2.1% |
| Elementary School | 484 | 11.5% |
| Middle School | 1,337 | 31.8% |
| High School | 1,037 | 24.7% |
| College / Undergraduate | 594 | 14.1% |
| Graduate / Professional | 166 | 4.0% |
| Total | 4,203 | 100.0% |
School Enrollment by Age by Funding Source in Hazel Crest
Out of a total of 4,203 students who are enrolled in schools in Hazel Crest, 681 (16.2%) attend a private institution, while the remaining 3,522 (83.8%) are enrolled in public schools. The age group of 18 to 19 year olds has the highest likelihood of being enrolled in private schools, with 49 (63.6% in the age bracket) enrolled. Conversely, the age group of 15 to 17 year olds has the lowest likelihood of being enrolled in a private school, with 918 (95.8% in the age bracket) attending a public institution.
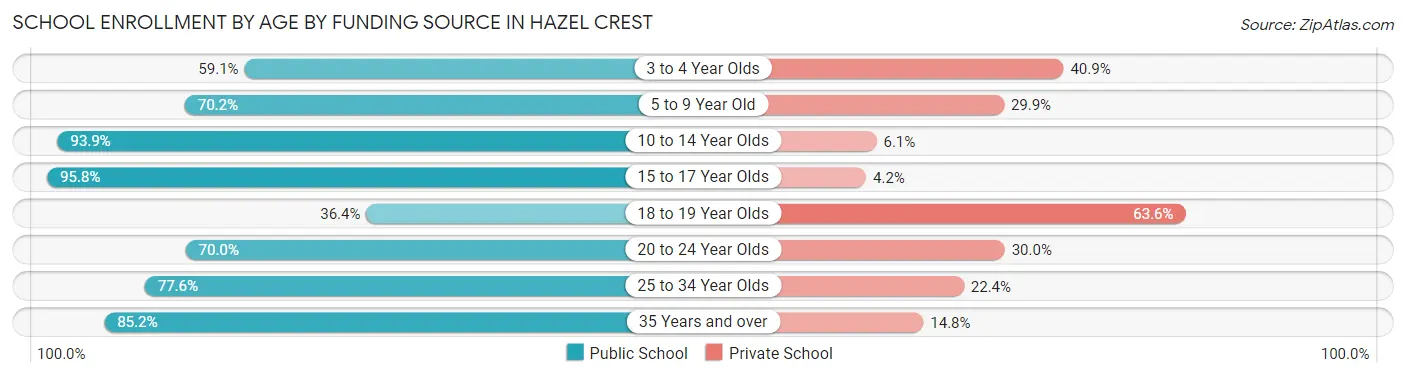
| Age Bracket | Public School | Private School |
| 3 to 4 Year Olds | 176 (59.1%) | 122 (40.9%) |
| 5 to 9 Year Old | 531 (70.2%) | 226 (29.8%) |
| 10 to 14 Year Olds | 1,319 (93.9%) | 86 (6.1%) |
| 15 to 17 Year Olds | 918 (95.8%) | 40 (4.2%) |
| 18 to 19 Year Olds | 28 (36.4%) | 49 (63.6%) |
| 20 to 24 Year Olds | 84 (70.0%) | 36 (30.0%) |
| 25 to 34 Year Olds | 357 (77.6%) | 103 (22.4%) |
| 35 Years and over | 109 (85.2%) | 19 (14.8%) |
| Total | 3,522 (83.8%) | 681 (16.2%) |
Educational Attainment by Field of Study in Hazel Crest
Business (426 | 17.1%), education (401 | 16.1%), liberal arts & history (251 | 10.1%), science & technology (219 | 8.8%), and arts & humanities (218 | 8.7%) are the most common fields of study among 2,495 individuals in Hazel Crest who have obtained a bachelor's degree or higher.
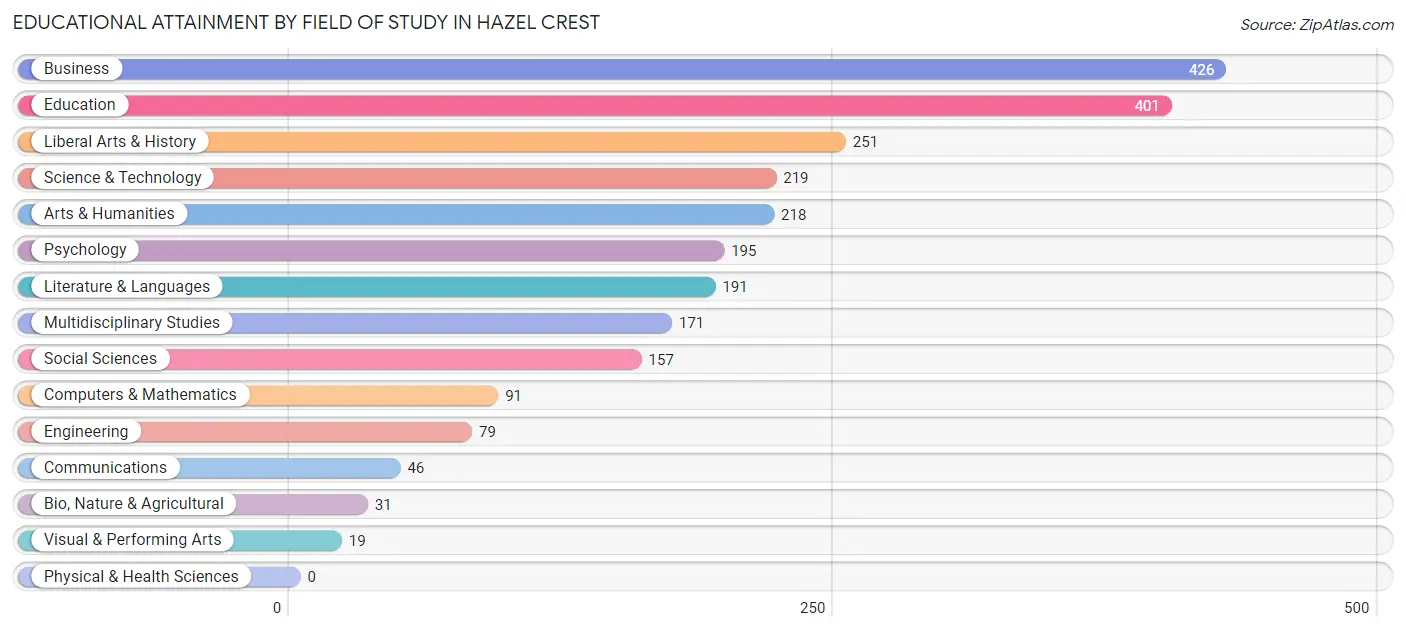
| Field of Study | # Graduates | % Graduates |
| Computers & Mathematics | 91 | 3.6% |
| Bio, Nature & Agricultural | 31 | 1.2% |
| Physical & Health Sciences | 0 | 0.0% |
| Psychology | 195 | 7.8% |
| Social Sciences | 157 | 6.3% |
| Engineering | 79 | 3.2% |
| Multidisciplinary Studies | 171 | 6.9% |
| Science & Technology | 219 | 8.8% |
| Business | 426 | 17.1% |
| Education | 401 | 16.1% |
| Literature & Languages | 191 | 7.7% |
| Liberal Arts & History | 251 | 10.1% |
| Visual & Performing Arts | 19 | 0.8% |
| Communications | 46 | 1.8% |
| Arts & Humanities | 218 | 8.7% |
| Total | 2,495 | 100.0% |
Transportation & Commute in Hazel Crest
Vehicle Availability by Sex in Hazel Crest
The most prevalent vehicle ownership categories in Hazel Crest are males with 2 vehicles (823, accounting for 33.7%) and females with 2 vehicles (1,209, making up 27.1%).
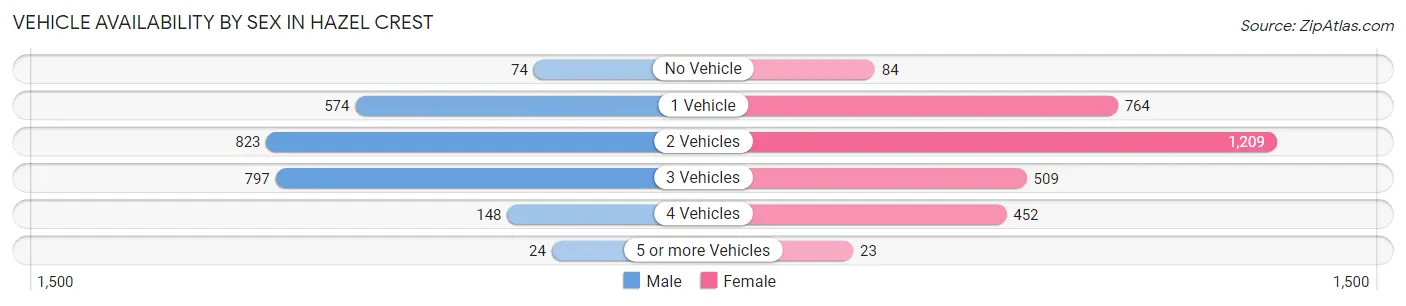
| Vehicles Available | Male | Female |
| No Vehicle | 74 (3.0%) | 84 (2.8%) |
| 1 Vehicle | 574 (23.5%) | 764 (25.1%) |
| 2 Vehicles | 823 (33.7%) | 1,209 (39.8%) |
| 3 Vehicles | 797 (32.7%) | 509 (16.7%) |
| 4 Vehicles | 148 (6.1%) | 452 (14.9%) |
| 5 or more Vehicles | 24 (1.0%) | 23 (0.8%) |
| Total | 2,440 (100.0%) | 3,041 (100.0%) |
Commute Time in Hazel Crest
The most frequently occuring commute durations in Hazel Crest are 60 to 89 minutes (840 commuters, 17.6%), 20 to 24 minutes (802 commuters, 16.8%), and 30 to 34 minutes (529 commuters, 11.1%).
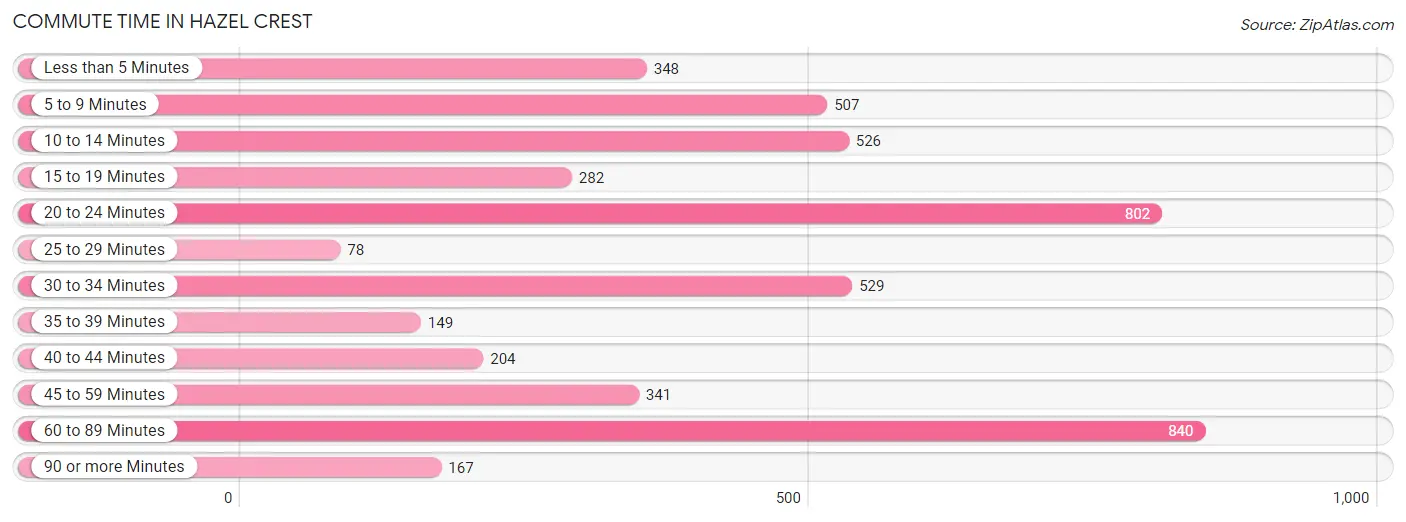
| Commute Time | # Commuters | % Commuters |
| Less than 5 Minutes | 348 | 7.3% |
| 5 to 9 Minutes | 507 | 10.6% |
| 10 to 14 Minutes | 526 | 11.0% |
| 15 to 19 Minutes | 282 | 5.9% |
| 20 to 24 Minutes | 802 | 16.8% |
| 25 to 29 Minutes | 78 | 1.6% |
| 30 to 34 Minutes | 529 | 11.1% |
| 35 to 39 Minutes | 149 | 3.1% |
| 40 to 44 Minutes | 204 | 4.3% |
| 45 to 59 Minutes | 341 | 7.1% |
| 60 to 89 Minutes | 840 | 17.6% |
| 90 or more Minutes | 167 | 3.5% |
Commute Time by Sex in Hazel Crest
The most common commute times in Hazel Crest are 60 to 89 minutes (370 commuters, 18.6%) for males and 20 to 24 minutes (673 commuters, 24.1%) for females.
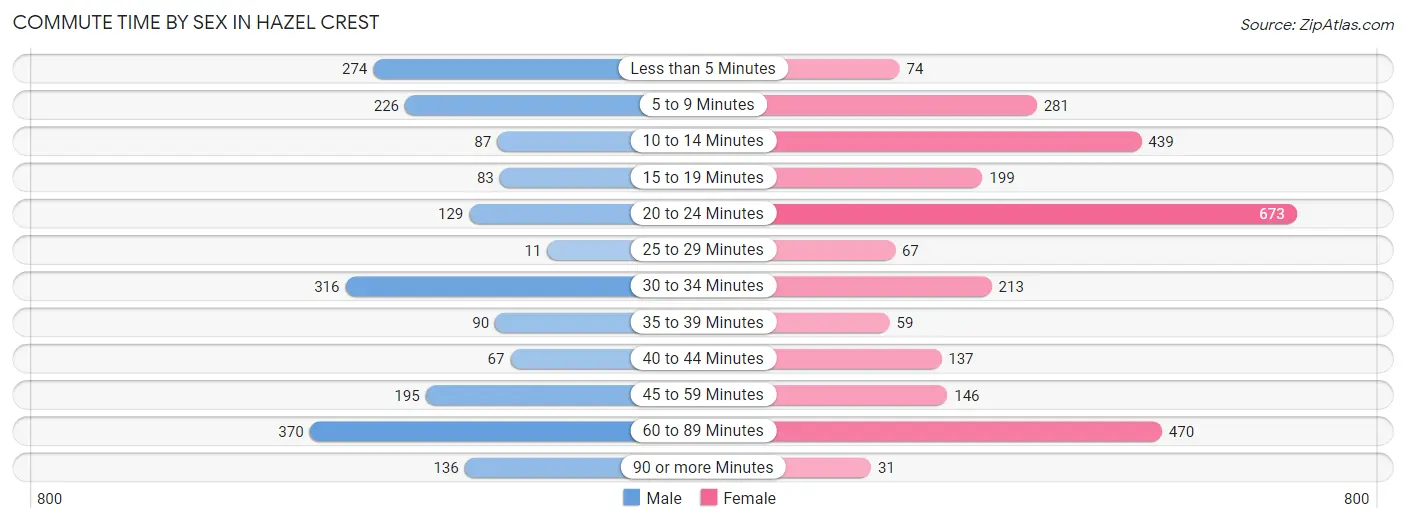
| Commute Time | Male | Female |
| Less than 5 Minutes | 274 (13.8%) | 74 (2.6%) |
| 5 to 9 Minutes | 226 (11.4%) | 281 (10.1%) |
| 10 to 14 Minutes | 87 (4.4%) | 439 (15.7%) |
| 15 to 19 Minutes | 83 (4.2%) | 199 (7.1%) |
| 20 to 24 Minutes | 129 (6.5%) | 673 (24.1%) |
| 25 to 29 Minutes | 11 (0.5%) | 67 (2.4%) |
| 30 to 34 Minutes | 316 (15.9%) | 213 (7.6%) |
| 35 to 39 Minutes | 90 (4.5%) | 59 (2.1%) |
| 40 to 44 Minutes | 67 (3.4%) | 137 (4.9%) |
| 45 to 59 Minutes | 195 (9.8%) | 146 (5.2%) |
| 60 to 89 Minutes | 370 (18.6%) | 470 (16.9%) |
| 90 or more Minutes | 136 (6.9%) | 31 (1.1%) |
Time of Departure to Work by Sex in Hazel Crest
The most frequent times of departure to work in Hazel Crest are 12:00 AM to 4:59 AM (367, 18.5%) for males and 7:00 AM to 7:29 AM (449, 16.1%) for females.
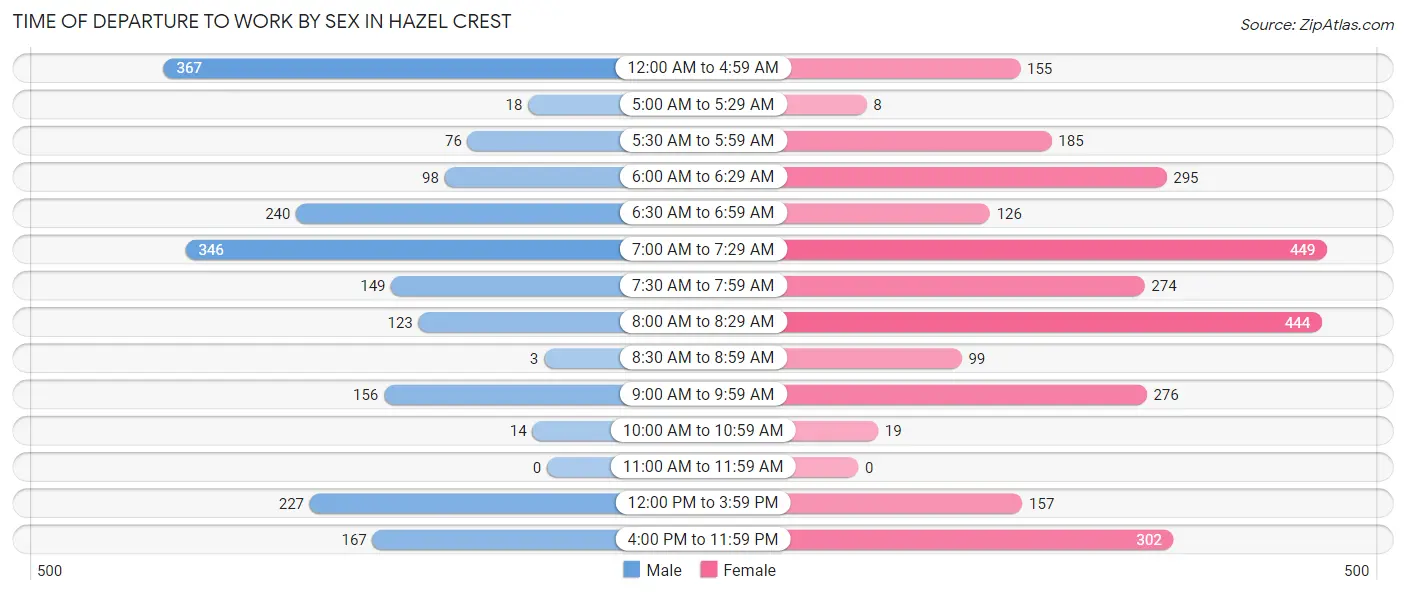
| Time of Departure | Male | Female |
| 12:00 AM to 4:59 AM | 367 (18.5%) | 155 (5.6%) |
| 5:00 AM to 5:29 AM | 18 (0.9%) | 8 (0.3%) |
| 5:30 AM to 5:59 AM | 76 (3.8%) | 185 (6.6%) |
| 6:00 AM to 6:29 AM | 98 (4.9%) | 295 (10.6%) |
| 6:30 AM to 6:59 AM | 240 (12.1%) | 126 (4.5%) |
| 7:00 AM to 7:29 AM | 346 (17.4%) | 449 (16.1%) |
| 7:30 AM to 7:59 AM | 149 (7.5%) | 274 (9.8%) |
| 8:00 AM to 8:29 AM | 123 (6.2%) | 444 (15.9%) |
| 8:30 AM to 8:59 AM | 3 (0.2%) | 99 (3.5%) |
| 9:00 AM to 9:59 AM | 156 (7.9%) | 276 (9.9%) |
| 10:00 AM to 10:59 AM | 14 (0.7%) | 19 (0.7%) |
| 11:00 AM to 11:59 AM | 0 (0.0%) | 0 (0.0%) |
| 12:00 PM to 3:59 PM | 227 (11.4%) | 157 (5.6%) |
| 4:00 PM to 11:59 PM | 167 (8.4%) | 302 (10.8%) |
| Total | 1,984 (100.0%) | 2,789 (100.0%) |
Housing Occupancy in Hazel Crest
Occupancy by Ownership in Hazel Crest
Of the total 4,670 dwellings in Hazel Crest, owner-occupied units account for 3,142 (67.3%), while renter-occupied units make up 1,528 (32.7%).
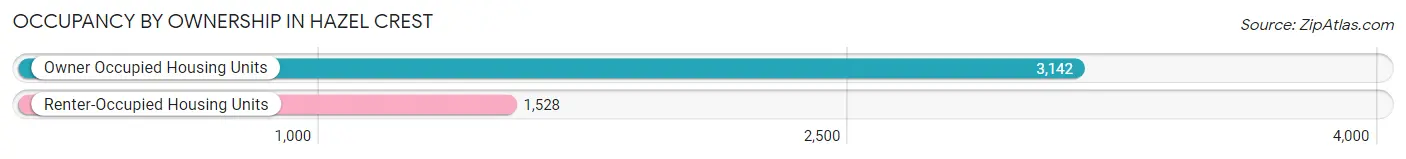
| Occupancy | # Housing Units | % Housing Units |
| Owner Occupied Housing Units | 3,142 | 67.3% |
| Renter-Occupied Housing Units | 1,528 | 32.7% |
| Total Occupied Housing Units | 4,670 | 100.0% |
Occupancy by Household Size in Hazel Crest
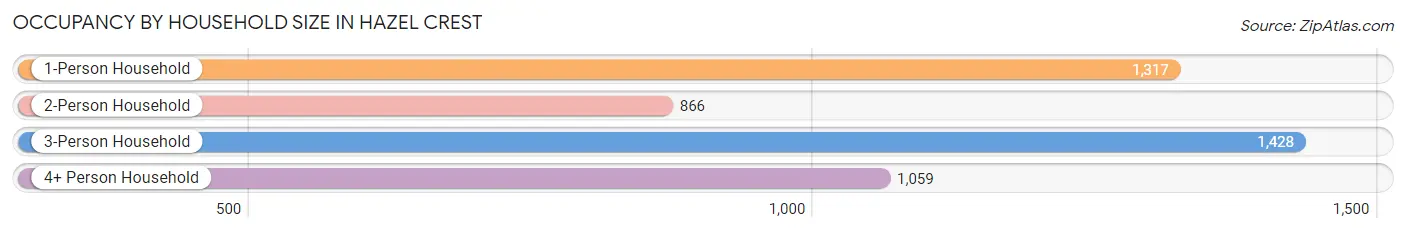
| Household Size | # Housing Units | % Housing Units |
| 1-Person Household | 1,317 | 28.2% |
| 2-Person Household | 866 | 18.5% |
| 3-Person Household | 1,428 | 30.6% |
| 4+ Person Household | 1,059 | 22.7% |
| Total Housing Units | 4,670 | 100.0% |
Occupancy by Ownership by Household Size in Hazel Crest
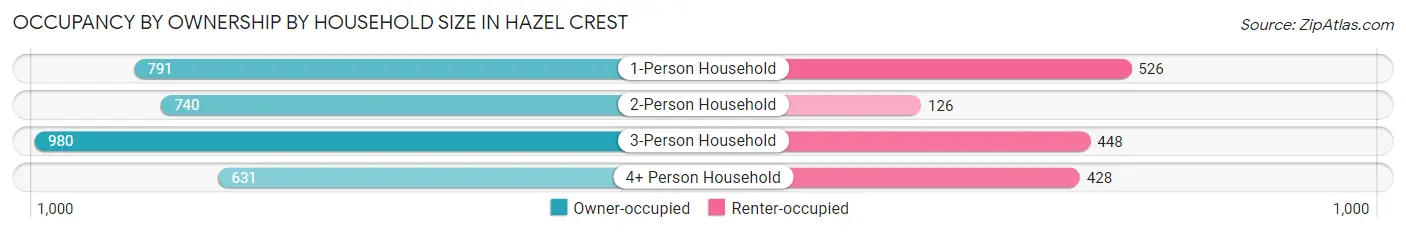
| Household Size | Owner-occupied | Renter-occupied |
| 1-Person Household | 791 (60.1%) | 526 (39.9%) |
| 2-Person Household | 740 (85.5%) | 126 (14.5%) |
| 3-Person Household | 980 (68.6%) | 448 (31.4%) |
| 4+ Person Household | 631 (59.6%) | 428 (40.4%) |
| Total Housing Units | 3,142 (67.3%) | 1,528 (32.7%) |
Occupancy by Educational Attainment in Hazel Crest
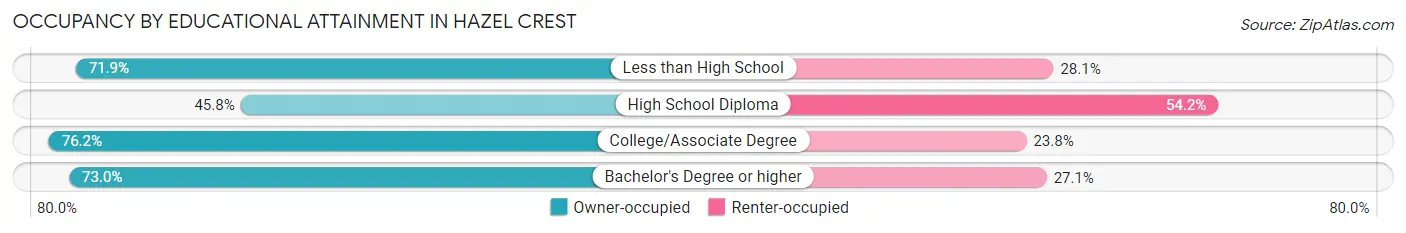
| Household Size | Owner-occupied | Renter-occupied |
| Less than High School | 161 (71.9%) | 63 (28.1%) |
| High School Diploma | 539 (45.8%) | 639 (54.2%) |
| College/Associate Degree | 1,377 (76.2%) | 431 (23.8%) |
| Bachelor's Degree or higher | 1,065 (73.0%) | 395 (27.1%) |
Occupancy by Age of Householder in Hazel Crest
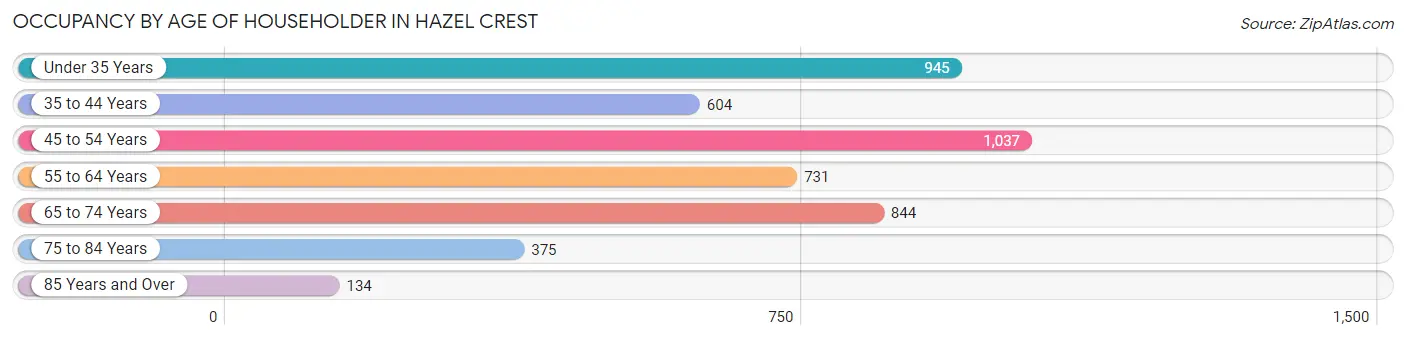
| Age Bracket | # Households | % Households |
| Under 35 Years | 945 | 20.2% |
| 35 to 44 Years | 604 | 12.9% |
| 45 to 54 Years | 1,037 | 22.2% |
| 55 to 64 Years | 731 | 15.7% |
| 65 to 74 Years | 844 | 18.1% |
| 75 to 84 Years | 375 | 8.0% |
| 85 Years and Over | 134 | 2.9% |
| Total | 4,670 | 100.0% |
Housing Finances in Hazel Crest
Median Income by Occupancy in Hazel Crest
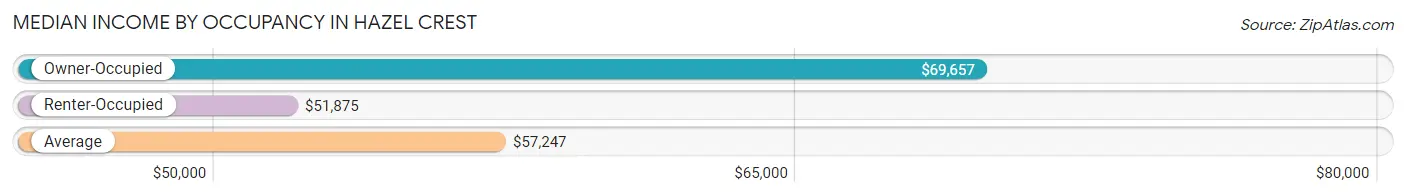
| Occupancy Type | # Households | Median Income |
| Owner-Occupied | 3,142 (67.3%) | $69,657 |
| Renter-Occupied | 1,528 (32.7%) | $51,875 |
| Average | 4,670 (100.0%) | $57,247 |
Occupancy by Householder Income Bracket in Hazel Crest
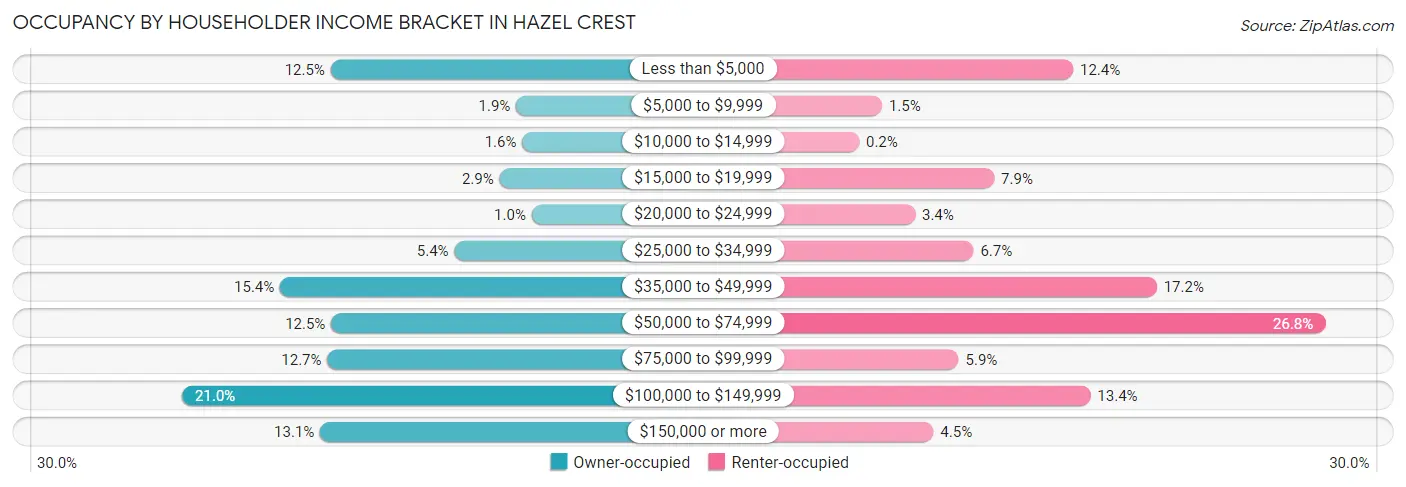
| Income Bracket | Owner-occupied | Renter-occupied |
| Less than $5,000 | 393 (12.5%) | 190 (12.4%) |
| $5,000 to $9,999 | 60 (1.9%) | 23 (1.5%) |
| $10,000 to $14,999 | 49 (1.6%) | 3 (0.2%) |
| $15,000 to $19,999 | 90 (2.9%) | 121 (7.9%) |
| $20,000 to $24,999 | 32 (1.0%) | 52 (3.4%) |
| $25,000 to $34,999 | 171 (5.4%) | 103 (6.7%) |
| $35,000 to $49,999 | 484 (15.4%) | 263 (17.2%) |
| $50,000 to $74,999 | 392 (12.5%) | 410 (26.8%) |
| $75,000 to $99,999 | 399 (12.7%) | 90 (5.9%) |
| $100,000 to $149,999 | 660 (21.0%) | 205 (13.4%) |
| $150,000 or more | 412 (13.1%) | 68 (4.4%) |
| Total | 3,142 (100.0%) | 1,528 (100.0%) |
Monthly Housing Cost Tiers in Hazel Crest
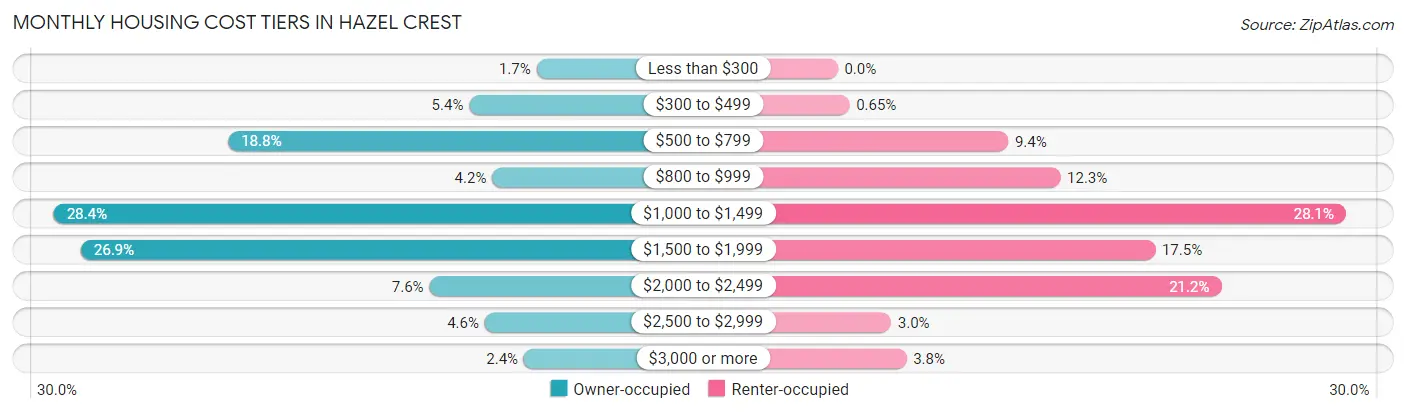
| Monthly Cost | Owner-occupied | Renter-occupied |
| Less than $300 | 54 (1.7%) | 0 (0.0%) |
| $300 to $499 | 171 (5.4%) | 10 (0.6%) |
| $500 to $799 | 589 (18.8%) | 144 (9.4%) |
| $800 to $999 | 131 (4.2%) | 188 (12.3%) |
| $1,000 to $1,499 | 892 (28.4%) | 429 (28.1%) |
| $1,500 to $1,999 | 845 (26.9%) | 268 (17.5%) |
| $2,000 to $2,499 | 240 (7.6%) | 324 (21.2%) |
| $2,500 to $2,999 | 144 (4.6%) | 45 (2.9%) |
| $3,000 or more | 76 (2.4%) | 58 (3.8%) |
| Total | 3,142 (100.0%) | 1,528 (100.0%) |
Physical Housing Characteristics in Hazel Crest
Housing Structures in Hazel Crest
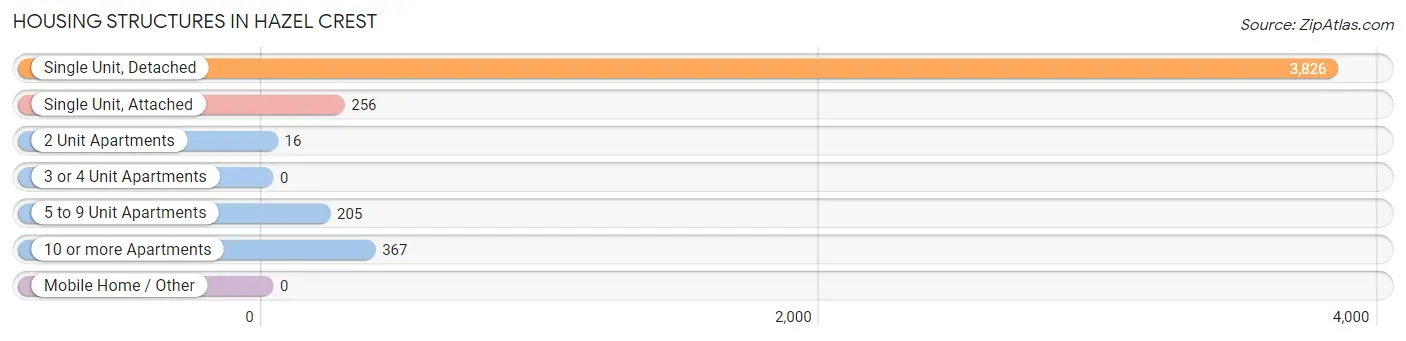
| Structure Type | # Housing Units | % Housing Units |
| Single Unit, Detached | 3,826 | 81.9% |
| Single Unit, Attached | 256 | 5.5% |
| 2 Unit Apartments | 16 | 0.3% |
| 3 or 4 Unit Apartments | 0 | 0.0% |
| 5 to 9 Unit Apartments | 205 | 4.4% |
| 10 or more Apartments | 367 | 7.9% |
| Mobile Home / Other | 0 | 0.0% |
| Total | 4,670 | 100.0% |
Housing Structures by Occupancy in Hazel Crest
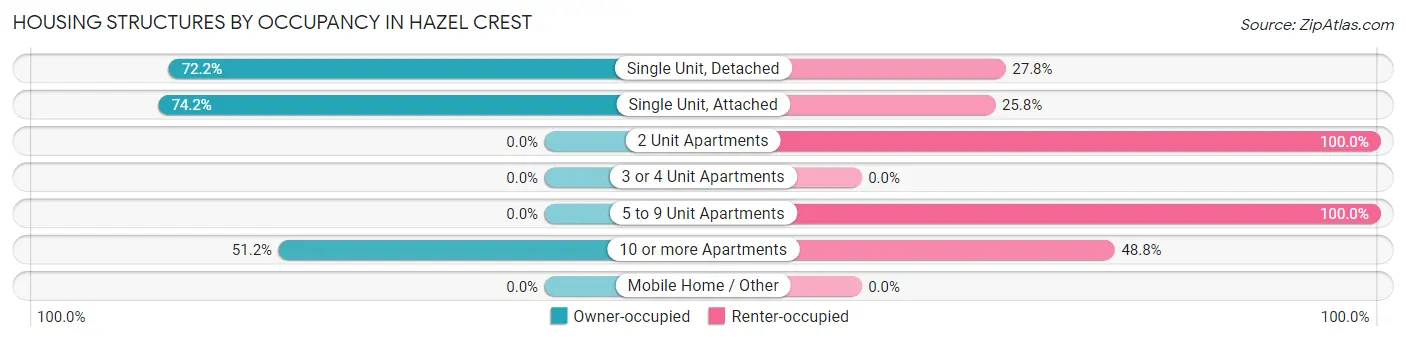
| Structure Type | Owner-occupied | Renter-occupied |
| Single Unit, Detached | 2,764 (72.2%) | 1,062 (27.8%) |
| Single Unit, Attached | 190 (74.2%) | 66 (25.8%) |
| 2 Unit Apartments | 0 (0.0%) | 16 (100.0%) |
| 3 or 4 Unit Apartments | 0 (0.0%) | 0 (0.0%) |
| 5 to 9 Unit Apartments | 0 (0.0%) | 205 (100.0%) |
| 10 or more Apartments | 188 (51.2%) | 179 (48.8%) |
| Mobile Home / Other | 0 (0.0%) | 0 (0.0%) |
| Total | 3,142 (67.3%) | 1,528 (32.7%) |
Housing Structures by Number of Rooms in Hazel Crest
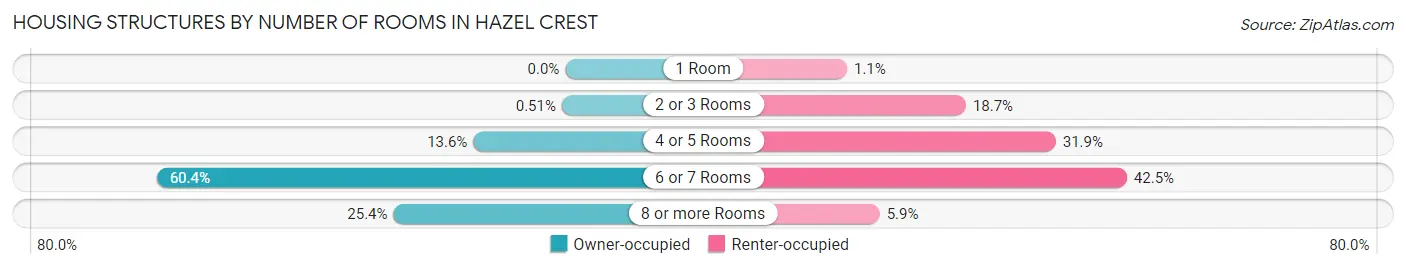
| Number of Rooms | Owner-occupied | Renter-occupied |
| 1 Room | 0 (0.0%) | 16 (1.1%) |
| 2 or 3 Rooms | 16 (0.5%) | 285 (18.6%) |
| 4 or 5 Rooms | 428 (13.6%) | 488 (31.9%) |
| 6 or 7 Rooms | 1,899 (60.4%) | 649 (42.5%) |
| 8 or more Rooms | 799 (25.4%) | 90 (5.9%) |
| Total | 3,142 (100.0%) | 1,528 (100.0%) |
Housing Structure by Heating Type in Hazel Crest
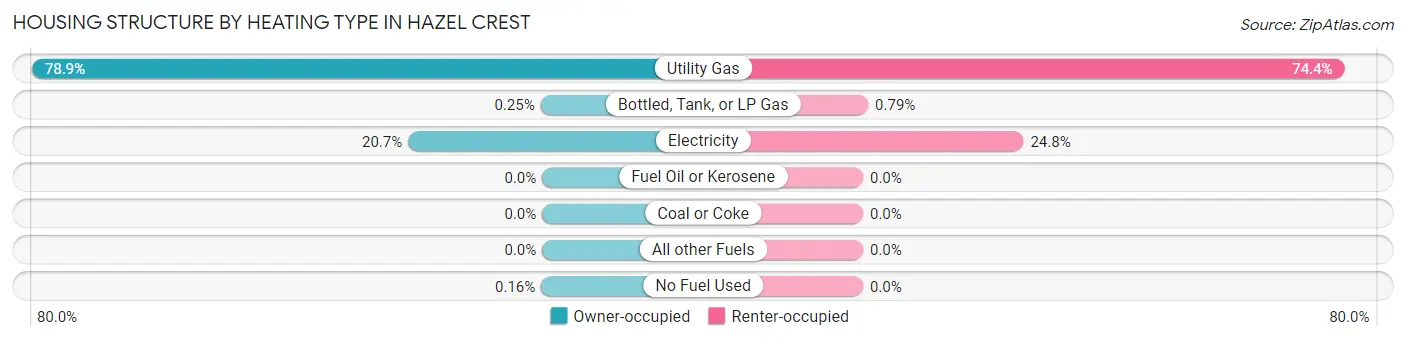
| Heating Type | Owner-occupied | Renter-occupied |
| Utility Gas | 2,478 (78.9%) | 1,137 (74.4%) |
| Bottled, Tank, or LP Gas | 8 (0.3%) | 12 (0.8%) |
| Electricity | 651 (20.7%) | 379 (24.8%) |
| Fuel Oil or Kerosene | 0 (0.0%) | 0 (0.0%) |
| Coal or Coke | 0 (0.0%) | 0 (0.0%) |
| All other Fuels | 0 (0.0%) | 0 (0.0%) |
| No Fuel Used | 5 (0.2%) | 0 (0.0%) |
| Total | 3,142 (100.0%) | 1,528 (100.0%) |
Household Vehicle Usage in Hazel Crest
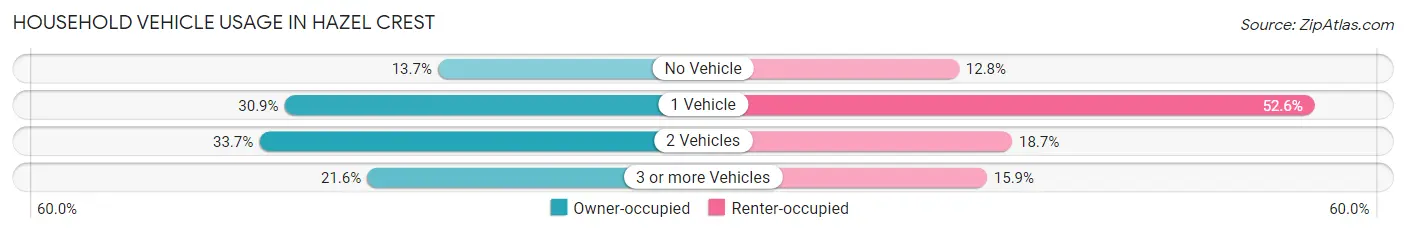
| Vehicles per Household | Owner-occupied | Renter-occupied |
| No Vehicle | 431 (13.7%) | 195 (12.8%) |
| 1 Vehicle | 971 (30.9%) | 804 (52.6%) |
| 2 Vehicles | 1,060 (33.7%) | 286 (18.7%) |
| 3 or more Vehicles | 680 (21.6%) | 243 (15.9%) |
| Total | 3,142 (100.0%) | 1,528 (100.0%) |
Real Estate & Mortgages in Hazel Crest
Real Estate and Mortgage Overview in Hazel Crest
| Characteristic | Without Mortgage | With Mortgage |
| Housing Units | 966 | 2,176 |
| Median Property Value | $116,100 | $173,200 |
| Median Household Income | - | - |
| Monthly Housing Costs | $736 | $76 |
| Real Estate Taxes | $4,385 | $24 |
Property Value by Mortgage Status in Hazel Crest
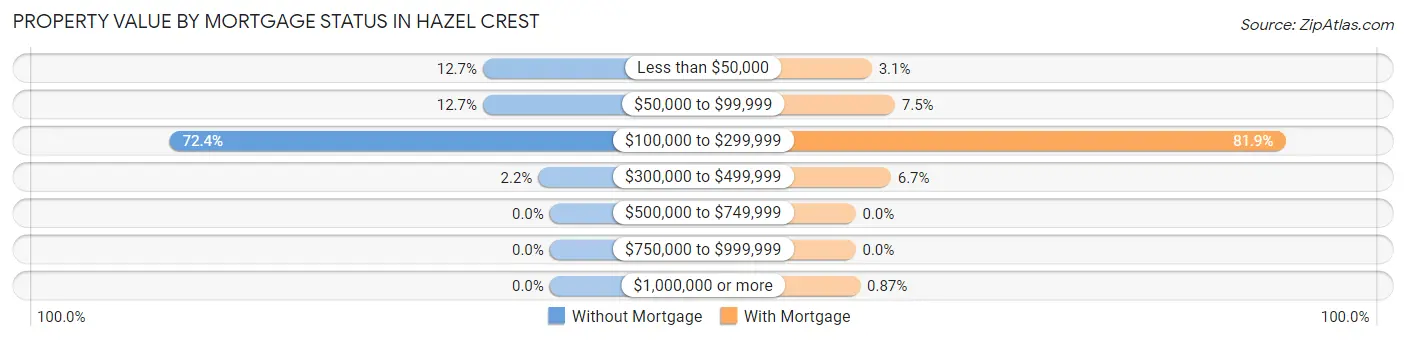
| Property Value | Without Mortgage | With Mortgage |
| Less than $50,000 | 123 (12.7%) | 67 (3.1%) |
| $50,000 to $99,999 | 123 (12.7%) | 163 (7.5%) |
| $100,000 to $299,999 | 699 (72.4%) | 1,781 (81.9%) |
| $300,000 to $499,999 | 21 (2.2%) | 146 (6.7%) |
| $500,000 to $749,999 | 0 (0.0%) | 0 (0.0%) |
| $750,000 to $999,999 | 0 (0.0%) | 0 (0.0%) |
| $1,000,000 or more | 0 (0.0%) | 19 (0.9%) |
| Total | 966 (100.0%) | 2,176 (100.0%) |
Household Income by Mortgage Status in Hazel Crest
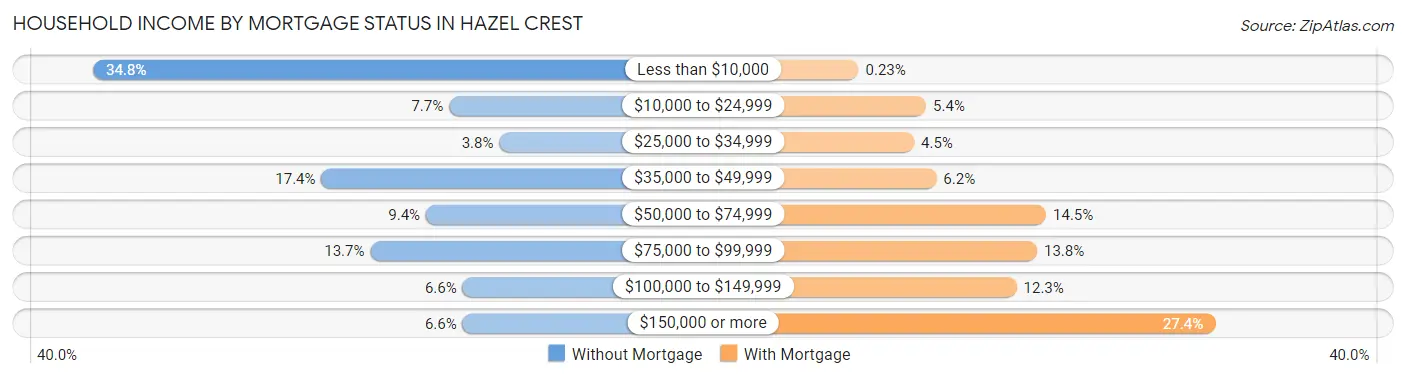
| Household Income | Without Mortgage | With Mortgage |
| Less than $10,000 | 336 (34.8%) | 5 (0.2%) |
| $10,000 to $24,999 | 74 (7.7%) | 117 (5.4%) |
| $25,000 to $34,999 | 37 (3.8%) | 97 (4.5%) |
| $35,000 to $49,999 | 168 (17.4%) | 134 (6.2%) |
| $50,000 to $74,999 | 91 (9.4%) | 316 (14.5%) |
| $75,000 to $99,999 | 132 (13.7%) | 301 (13.8%) |
| $100,000 to $149,999 | 64 (6.6%) | 267 (12.3%) |
| $150,000 or more | 64 (6.6%) | 596 (27.4%) |
| Total | 966 (100.0%) | 2,176 (100.0%) |
Property Value to Household Income Ratio in Hazel Crest
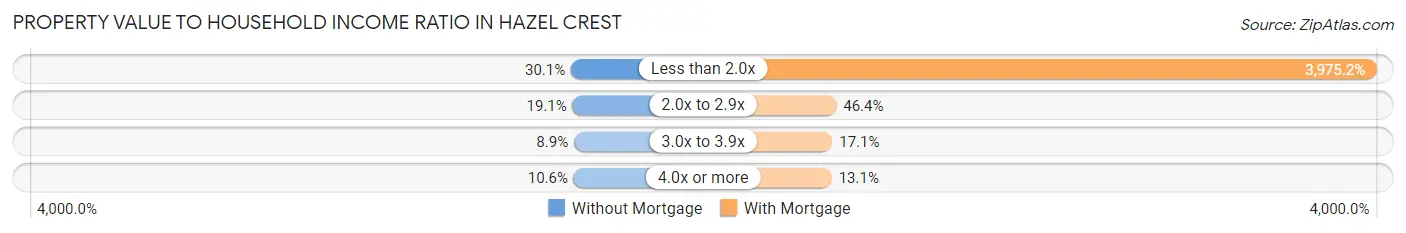
| Value-to-Income Ratio | Without Mortgage | With Mortgage |
| Less than 2.0x | 291 (30.1%) | 86,500 (3,975.2%) |
| 2.0x to 2.9x | 184 (19.1%) | 1,009 (46.4%) |
| 3.0x to 3.9x | 86 (8.9%) | 371 (17.1%) |
| 4.0x or more | 102 (10.6%) | 286 (13.1%) |
| Total | 966 (100.0%) | 2,176 (100.0%) |
Real Estate Taxes by Mortgage Status in Hazel Crest
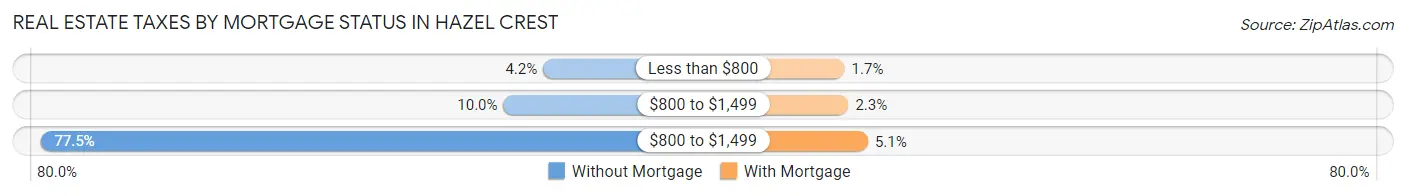
| Property Taxes | Without Mortgage | With Mortgage |
| Less than $800 | 41 (4.2%) | 37 (1.7%) |
| $800 to $1,499 | 97 (10.0%) | 49 (2.2%) |
| $800 to $1,499 | 749 (77.5%) | 111 (5.1%) |
| Total | 966 (100.0%) | 2,176 (100.0%) |
Health & Disability in Hazel Crest
Health Insurance Coverage by Age in Hazel Crest
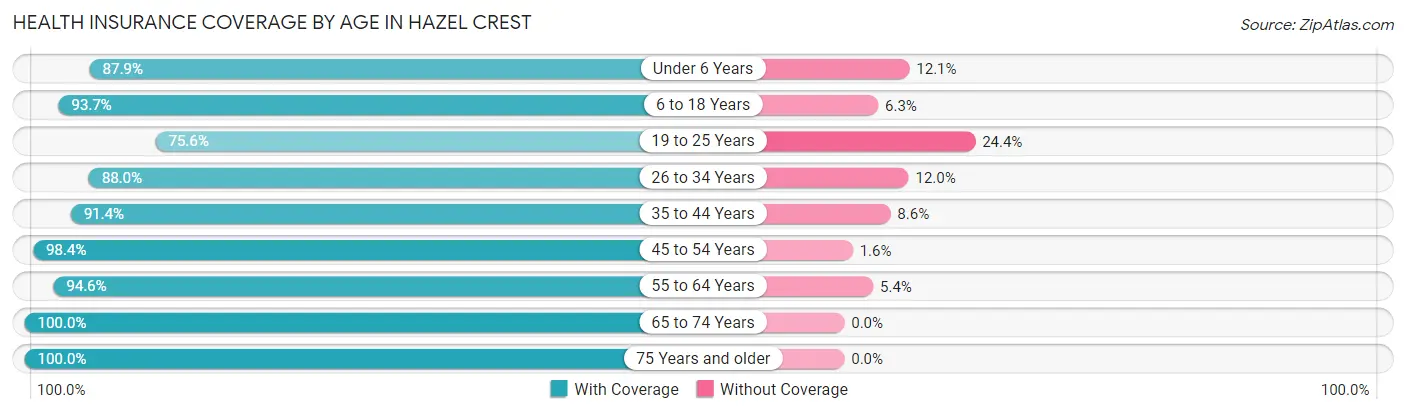
| Age Bracket | With Coverage | Without Coverage |
| Under 6 Years | 1,058 (87.9%) | 146 (12.1%) |
| 6 to 18 Years | 3,105 (93.7%) | 209 (6.3%) |
| 19 to 25 Years | 901 (75.6%) | 291 (24.4%) |
| 26 to 34 Years | 1,536 (88.0%) | 209 (12.0%) |
| 35 to 44 Years | 1,042 (91.4%) | 98 (8.6%) |
| 45 to 54 Years | 1,944 (98.4%) | 31 (1.6%) |
| 55 to 64 Years | 1,162 (94.6%) | 66 (5.4%) |
| 65 to 74 Years | 1,116 (100.0%) | 0 (0.0%) |
| 75 Years and older | 741 (100.0%) | 0 (0.0%) |
| Total | 12,605 (92.3%) | 1,050 (7.7%) |
Health Insurance Coverage by Citizenship Status in Hazel Crest
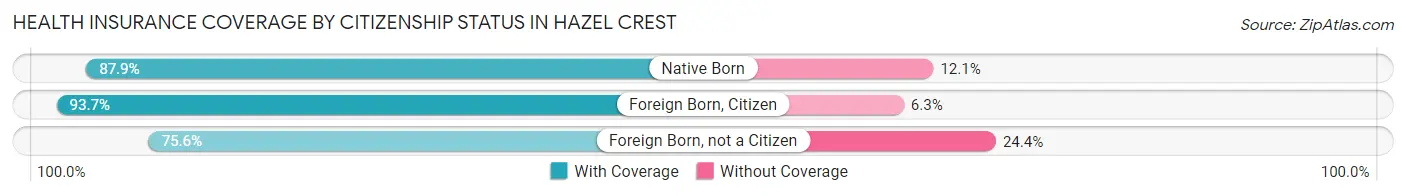
| Citizenship Status | With Coverage | Without Coverage |
| Native Born | 1,058 (87.9%) | 146 (12.1%) |
| Foreign Born, Citizen | 3,105 (93.7%) | 209 (6.3%) |
| Foreign Born, not a Citizen | 901 (75.6%) | 291 (24.4%) |
Health Insurance Coverage by Household Income in Hazel Crest
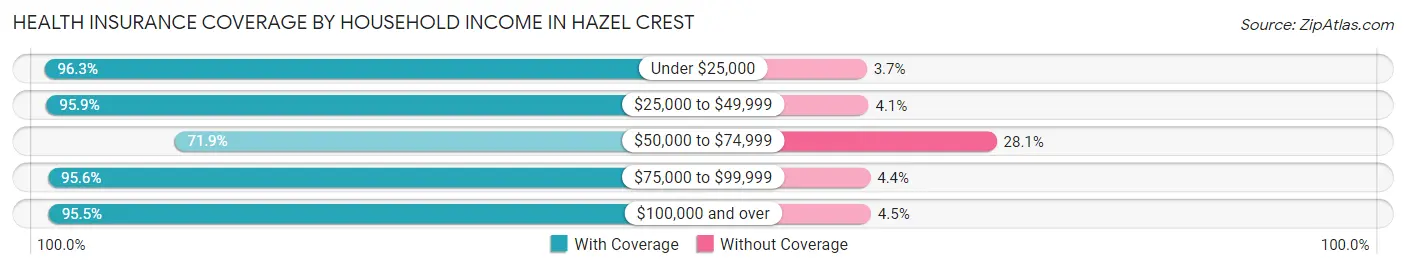
| Household Income | With Coverage | Without Coverage |
| Under $25,000 | 2,607 (96.3%) | 101 (3.7%) |
| $25,000 to $49,999 | 2,354 (95.9%) | 100 (4.1%) |
| $50,000 to $74,999 | 1,422 (71.9%) | 555 (28.1%) |
| $75,000 to $99,999 | 1,305 (95.6%) | 60 (4.4%) |
| $100,000 and over | 4,900 (95.5%) | 232 (4.5%) |
Public vs Private Health Insurance Coverage by Age in Hazel Crest
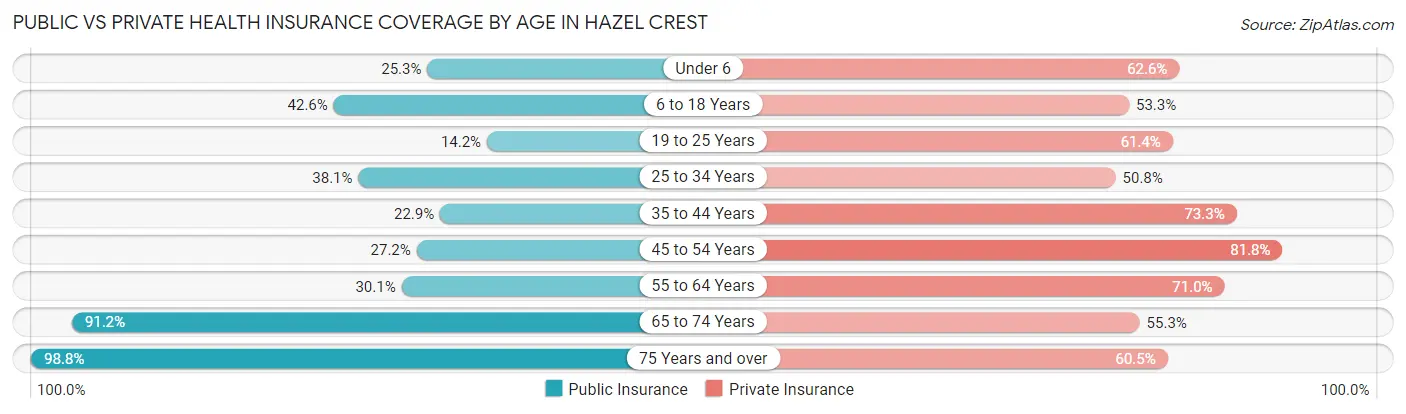
| Age Bracket | Public Insurance | Private Insurance |
| Under 6 | 304 (25.3%) | 754 (62.6%) |
| 6 to 18 Years | 1,413 (42.6%) | 1,767 (53.3%) |
| 19 to 25 Years | 169 (14.2%) | 732 (61.4%) |
| 25 to 34 Years | 664 (38.1%) | 887 (50.8%) |
| 35 to 44 Years | 261 (22.9%) | 835 (73.3%) |
| 45 to 54 Years | 538 (27.2%) | 1,615 (81.8%) |
| 55 to 64 Years | 369 (30.0%) | 872 (71.0%) |
| 65 to 74 Years | 1,018 (91.2%) | 617 (55.3%) |
| 75 Years and over | 732 (98.8%) | 448 (60.5%) |
| Total | 5,468 (40.0%) | 8,527 (62.5%) |
Disability Status by Sex by Age in Hazel Crest
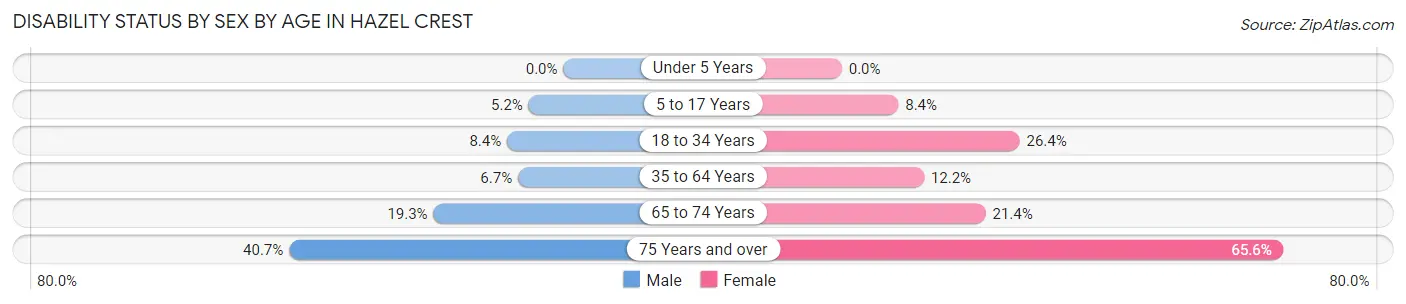
| Age Bracket | Male | Female |
| Under 5 Years | 0 (0.0%) | 0 (0.0%) |
| 5 to 17 Years | 91 (5.1%) | 151 (8.4%) |
| 18 to 34 Years | 120 (8.4%) | 412 (26.4%) |
| 35 to 64 Years | 112 (6.7%) | 327 (12.2%) |
| 65 to 74 Years | 87 (19.3%) | 142 (21.3%) |
| 75 Years and over | 136 (40.7%) | 267 (65.6%) |
Disability Class by Sex by Age in Hazel Crest
Disability Class: Hearing Difficulty
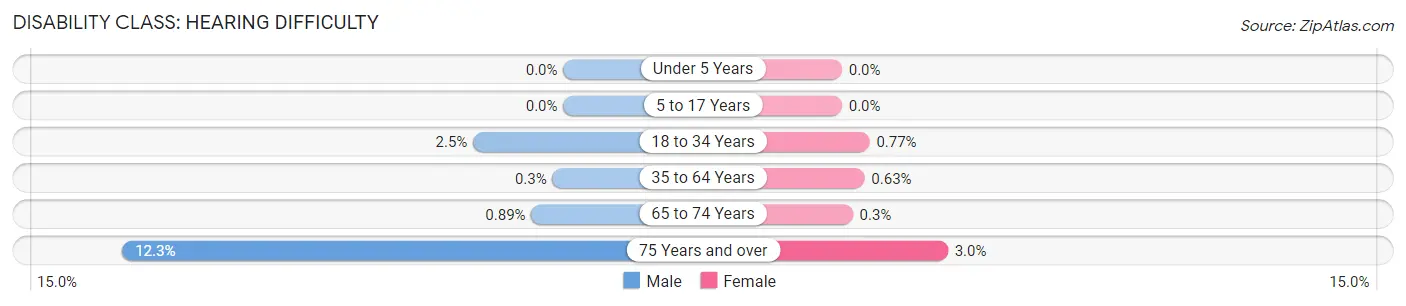
| Age Bracket | Male | Female |
| Under 5 Years | 0 (0.0%) | 0 (0.0%) |
| 5 to 17 Years | 0 (0.0%) | 0 (0.0%) |
| 18 to 34 Years | 36 (2.5%) | 12 (0.8%) |
| 35 to 64 Years | 5 (0.3%) | 17 (0.6%) |
| 65 to 74 Years | 4 (0.9%) | 2 (0.3%) |
| 75 Years and over | 41 (12.3%) | 12 (2.9%) |
Disability Class: Vision Difficulty
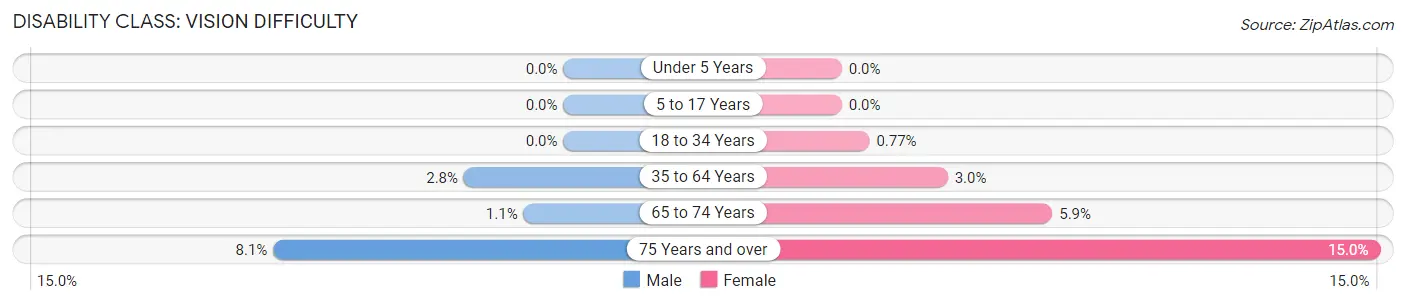
| Age Bracket | Male | Female |
| Under 5 Years | 0 (0.0%) | 0 (0.0%) |
| 5 to 17 Years | 0 (0.0%) | 0 (0.0%) |
| 18 to 34 Years | 0 (0.0%) | 12 (0.8%) |
| 35 to 64 Years | 46 (2.8%) | 79 (2.9%) |
| 65 to 74 Years | 5 (1.1%) | 39 (5.9%) |
| 75 Years and over | 27 (8.1%) | 61 (15.0%) |
Disability Class: Cognitive Difficulty
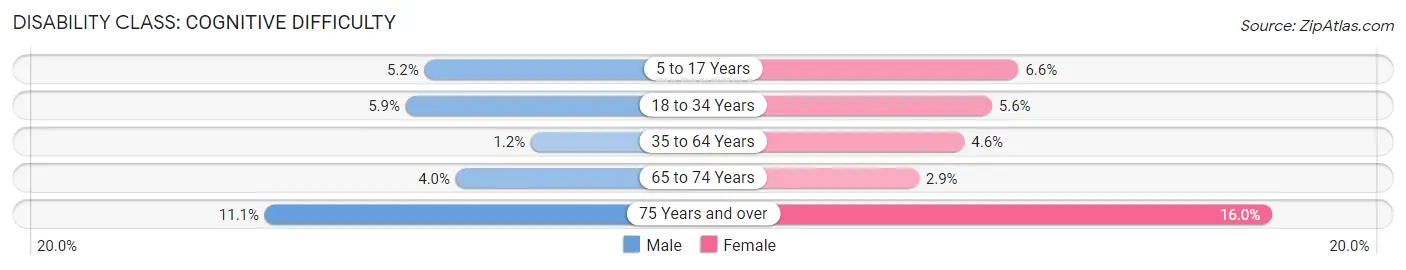
| Age Bracket | Male | Female |
| 5 to 17 Years | 91 (5.1%) | 118 (6.6%) |
| 18 to 34 Years | 84 (5.9%) | 87 (5.6%) |
| 35 to 64 Years | 20 (1.2%) | 122 (4.5%) |
| 65 to 74 Years | 18 (4.0%) | 19 (2.9%) |
| 75 Years and over | 37 (11.1%) | 65 (16.0%) |
Disability Class: Ambulatory Difficulty
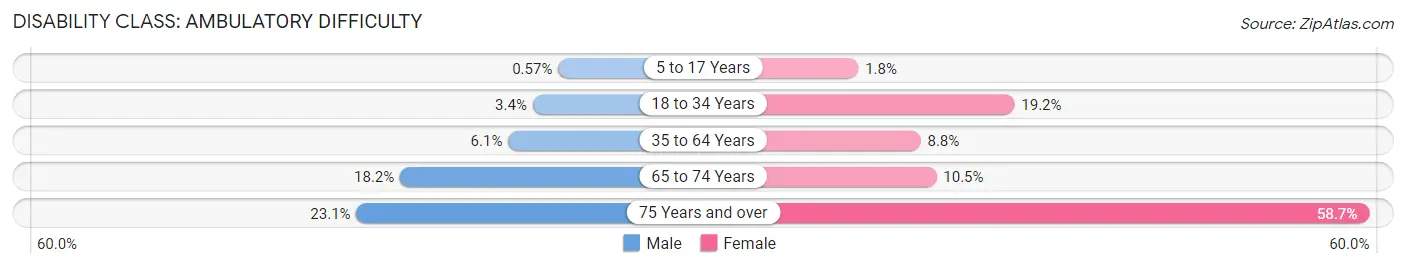
| Age Bracket | Male | Female |
| 5 to 17 Years | 10 (0.6%) | 33 (1.8%) |
| 18 to 34 Years | 49 (3.4%) | 300 (19.2%) |
| 35 to 64 Years | 102 (6.1%) | 235 (8.8%) |
| 65 to 74 Years | 82 (18.2%) | 70 (10.5%) |
| 75 Years and over | 77 (23.1%) | 239 (58.7%) |
Disability Class: Self-Care Difficulty
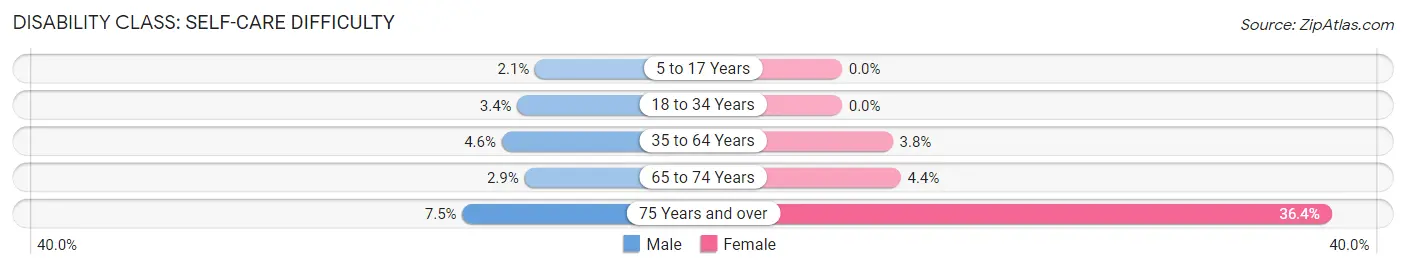
| Age Bracket | Male | Female |
| 5 to 17 Years | 37 (2.1%) | 0 (0.0%) |
| 18 to 34 Years | 49 (3.4%) | 0 (0.0%) |
| 35 to 64 Years | 76 (4.6%) | 101 (3.8%) |
| 65 to 74 Years | 13 (2.9%) | 29 (4.4%) |
| 75 Years and over | 25 (7.5%) | 148 (36.4%) |
Technology Access in Hazel Crest
Computing Device Access in Hazel Crest
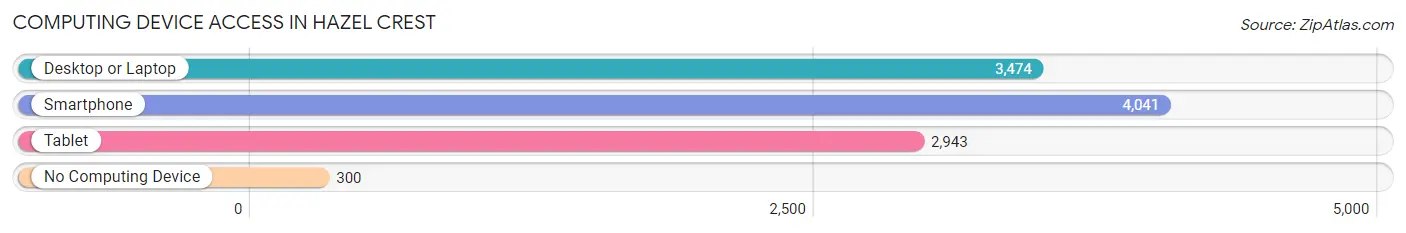
| Device Type | # Households | % Households |
| Desktop or Laptop | 3,474 | 74.4% |
| Smartphone | 4,041 | 86.5% |
| Tablet | 2,943 | 63.0% |
| No Computing Device | 300 | 6.4% |
| Total | 4,670 | 100.0% |
Internet Access in Hazel Crest
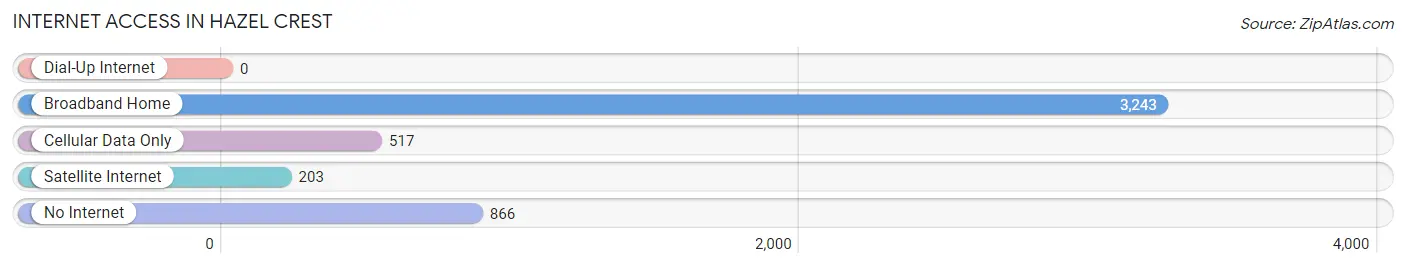
| Internet Type | # Households | % Households |
| Dial-Up Internet | 0 | 0.0% |
| Broadband Home | 3,243 | 69.4% |
| Cellular Data Only | 517 | 11.1% |
| Satellite Internet | 203 | 4.3% |
| No Internet | 866 | 18.5% |
| Total | 4,670 | 100.0% |
Hazel Crest Summary
Hazel Crest is a village located in Cook County, Illinois, United States. It is a suburb of Chicago, located approximately 25 miles south of the city. The population was 14,100 at the 2010 census.
History
Hazel Crest was first settled in the late 1800s by German and Irish immigrants. The village was originally known as "Hazelcrest" and was incorporated in 1911. The name was changed to Hazel Crest in 1924.
The village was primarily a farming community until the 1950s, when it began to experience rapid growth due to its proximity to Chicago. The population increased from 1,000 in 1950 to 14,100 in 2010.
Geography
Hazel Crest is located at 41°33'25"N 87°41'17"W (41.556944, -87.688056). According to the 2010 census, the village has a total area of 4.2 square miles, all of it land.
The village is bordered by Markham to the north, Country Club Hills to the east, Homewood to the south, and Flossmoor to the west.
Economy
Hazel Crest is primarily a residential community, with most of its residents commuting to jobs in Chicago and the surrounding suburbs. The village does have some light industry, including a manufacturing plant for the John Deere Company.
Demographics
As of the 2010 census, the population of Hazel Crest was 14,100. The racial makeup of the village was 57.3% African American, 33.2% White, 4.2% Asian, and 5.3% other.
The median household income was $50,945, and the median family income was $60,945. The per capita income was $25,945. About 11.3% of the population was below the poverty line.
Education
Hazel Crest is served by two school districts: Homewood-Flossmoor Community High School District 233 and Bremen Community High School District 228. The village also has several private schools, including St. Anne Catholic School and St. John Lutheran School.
Conclusion
Hazel Crest is a small village located in Cook County, Illinois, approximately 25 miles south of Chicago. It was first settled in the late 1800s and was primarily a farming community until the 1950s, when it began to experience rapid growth due to its proximity to Chicago. The population was 14,100 at the 2010 census. The village is primarily a residential community, with most of its residents commuting to jobs in Chicago and the surrounding suburbs. The racial makeup of the village was 57.3% African American, 33.2% White, 4.2% Asian, and 5.3% other. The median household income was $50,945, and the median family income was $60,945. The village is served by two school districts and several private schools.
Common Questions
What is Per Capita Income in Hazel Crest?
Per Capita income in Hazel Crest is $27,288.
What is the Median Family Income in Hazel Crest?
Median Family Income in Hazel Crest is $64,349.
What is the Median Household income in Hazel Crest?
Median Household Income in Hazel Crest is $57,247.
What is Income or Wage Gap in Hazel Crest?
Income or Wage Gap in Hazel Crest is 5.3%.
Women in Hazel Crest earn 94.7 cents for every dollar earned by a man.
What is Inequality or Gini Index in Hazel Crest?
Inequality or Gini Index in Hazel Crest is 0.47.
What is the Total Population of Hazel Crest?
Total Population of Hazel Crest is 13,737.
What is the Total Male Population of Hazel Crest?
Total Male Population of Hazel Crest is 5,916.
What is the Total Female Population of Hazel Crest?
Total Female Population of Hazel Crest is 7,821.
What is the Ratio of Males per 100 Females in Hazel Crest?
There are 75.64 Males per 100 Females in Hazel Crest.
What is the Ratio of Females per 100 Males in Hazel Crest?
There are 132.20 Females per 100 Males in Hazel Crest.
What is the Median Population Age in Hazel Crest?
Median Population Age in Hazel Crest is 33.0 Years.
What is the Average Family Size in Hazel Crest
Average Family Size in Hazel Crest is 3.5 People.
What is the Average Household Size in Hazel Crest
Average Household Size in Hazel Crest is 2.9 People.
How Large is the Labor Force in Hazel Crest?
There are 6,511 People in the Labor Forcein in Hazel Crest.
What is the Percentage of People in the Labor Force in Hazel Crest?
66.2% of People are in the Labor Force in Hazel Crest.
What is the Unemployment Rate in Hazel Crest?
Unemployment Rate in Hazel Crest is 13.7%.