Elizabeth, IL Map & Demographics
Elizabeth Map
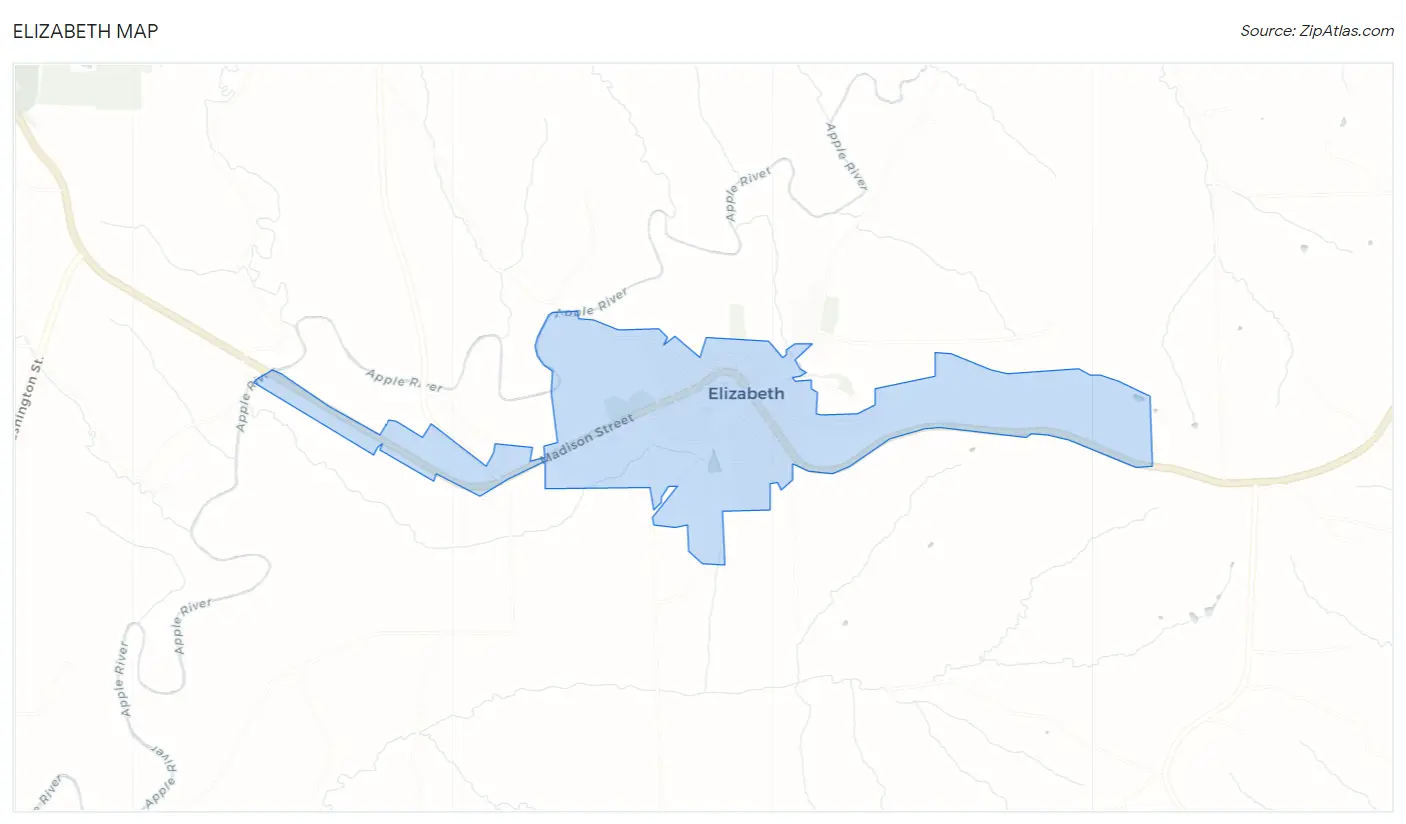
Elizabeth Overview
$38,276
PER CAPITA INCOME
$87,778
AVG FAMILY INCOME
$50,357
AVG HOUSEHOLD INCOME
23.9%
WAGE / INCOME GAP [ % ]
76.1¢/ $1
WAGE / INCOME GAP [ $ ]
0.54
INEQUALITY / GINI INDEX
816
TOTAL POPULATION
366
MALE POPULATION
450
FEMALE POPULATION
81.33
MALES / 100 FEMALES
122.95
FEMALES / 100 MALES
43.1
MEDIAN AGE
2.9
AVG FAMILY SIZE
2.0
AVG HOUSEHOLD SIZE
421
LABOR FORCE [ PEOPLE ]
60.8%
PERCENT IN LABOR FORCE
0.5%
UNEMPLOYMENT RATE
Elizabeth Zip Codes
Elizabeth Area Codes
Income in Elizabeth
Income Overview in Elizabeth
Per Capita Income in Elizabeth is $38,276, while median incomes of families and households are $87,778 and $50,357 respectively.
| Characteristic | Number | Measure |
| Per Capita Income | 816 | $38,276 |
| Median Family Income | 182 | $87,778 |
| Mean Family Income | 182 | $102,889 |
| Median Household Income | 402 | $50,357 |
| Mean Household Income | 402 | $77,410 |
| Income Deficit | 182 | $0 |
| Wage / Income Gap (%) | 816 | 23.90% |
| Wage / Income Gap ($) | 816 | 76.10¢ per $1 |
| Gini / Inequality Index | 816 | 0.54 |
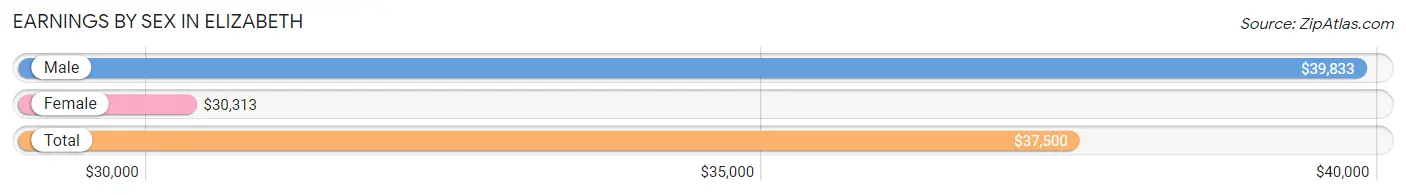
Earnings by Sex in Elizabeth
Average Earnings in Elizabeth are $37,500, $39,833 for men and $30,313 for women, a difference of 23.9%.
| Sex | Number | Average Earnings |
| Male | 246 (53.9%) | $39,833 |
| Female | 210 (46.1%) | $30,313 |
| Total | 456 (100.0%) | $37,500 |
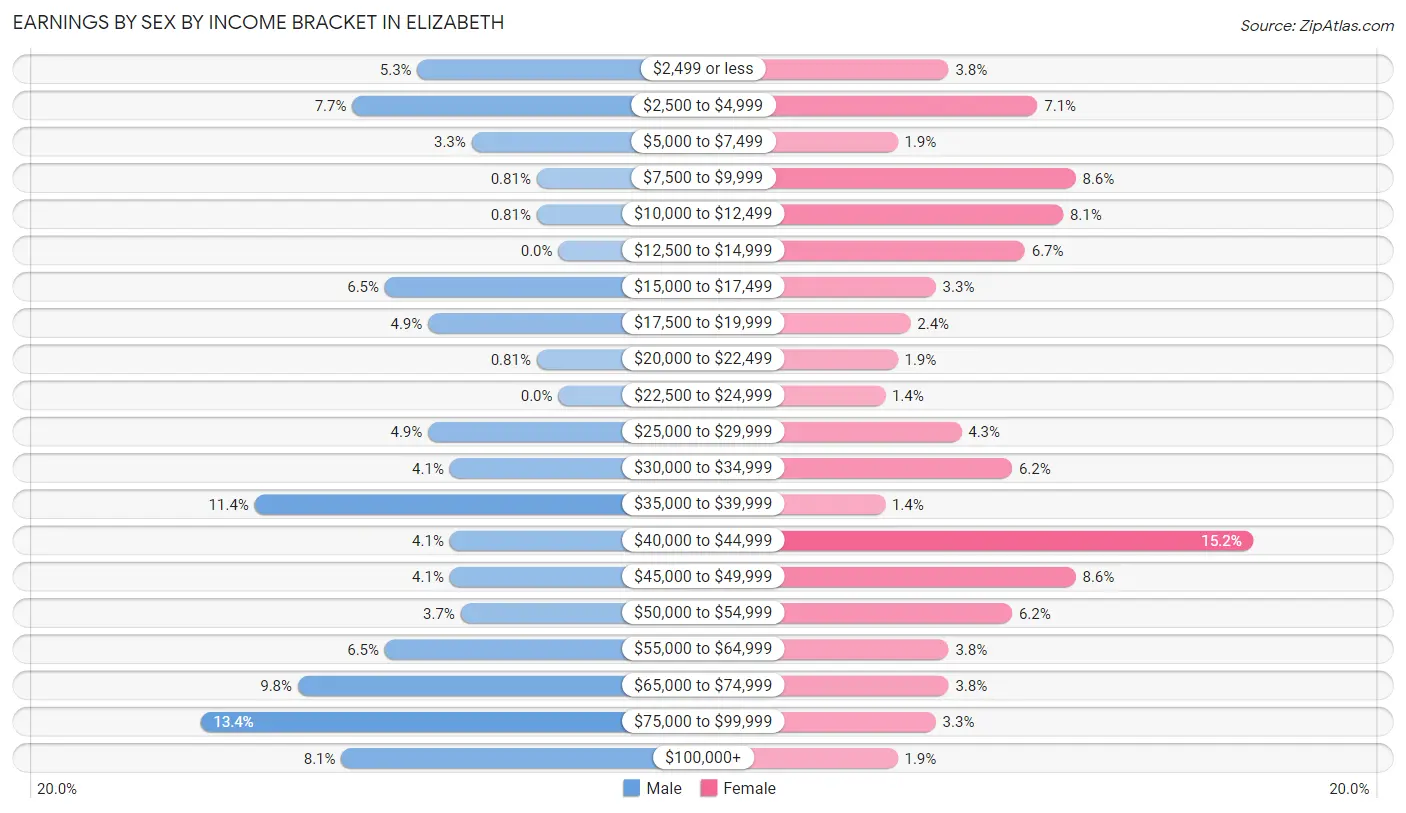
Earnings by Sex by Income Bracket in Elizabeth
The most common earnings brackets in Elizabeth are $75,000 to $99,999 for men (33 | 13.4%) and $40,000 to $44,999 for women (32 | 15.2%).
| Income | Male | Female |
| $2,499 or less | 13 (5.3%) | 8 (3.8%) |
| $2,500 to $4,999 | 19 (7.7%) | 15 (7.1%) |
| $5,000 to $7,499 | 8 (3.3%) | 4 (1.9%) |
| $7,500 to $9,999 | 2 (0.8%) | 18 (8.6%) |
| $10,000 to $12,499 | 2 (0.8%) | 17 (8.1%) |
| $12,500 to $14,999 | 0 (0.0%) | 14 (6.7%) |
| $15,000 to $17,499 | 16 (6.5%) | 7 (3.3%) |
| $17,500 to $19,999 | 12 (4.9%) | 5 (2.4%) |
| $20,000 to $22,499 | 2 (0.8%) | 4 (1.9%) |
| $22,500 to $24,999 | 0 (0.0%) | 3 (1.4%) |
| $25,000 to $29,999 | 12 (4.9%) | 9 (4.3%) |
| $30,000 to $34,999 | 10 (4.1%) | 13 (6.2%) |
| $35,000 to $39,999 | 28 (11.4%) | 3 (1.4%) |
| $40,000 to $44,999 | 10 (4.1%) | 32 (15.2%) |
| $45,000 to $49,999 | 10 (4.1%) | 18 (8.6%) |
| $50,000 to $54,999 | 9 (3.7%) | 13 (6.2%) |
| $55,000 to $64,999 | 16 (6.5%) | 8 (3.8%) |
| $65,000 to $74,999 | 24 (9.8%) | 8 (3.8%) |
| $75,000 to $99,999 | 33 (13.4%) | 7 (3.3%) |
| $100,000+ | 20 (8.1%) | 4 (1.9%) |
| Total | 246 (100.0%) | 210 (100.0%) |
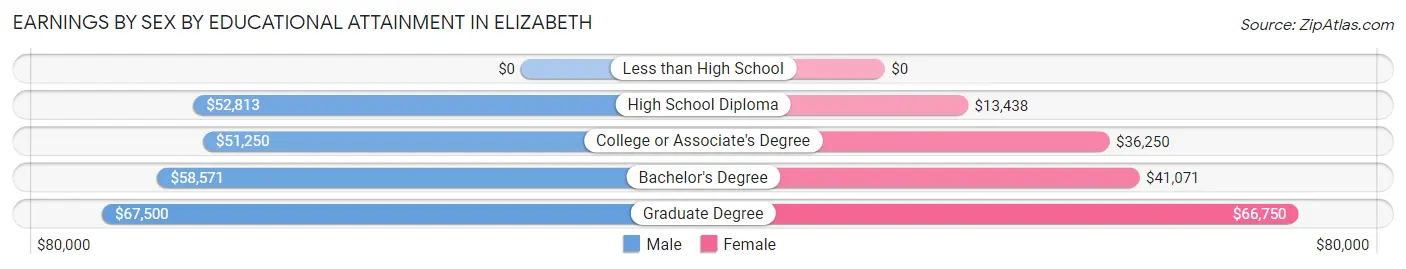
Earnings by Sex by Educational Attainment in Elizabeth
Average earnings in Elizabeth are $53,750 for men and $35,625 for women, a difference of 33.7%. Men with an educational attainment of graduate degree enjoy the highest average annual earnings of $67,500, while those with college or associate's degree education earn the least with $51,250. Women with an educational attainment of graduate degree earn the most with the average annual earnings of $66,750, while those with high school diploma education have the smallest earnings of $13,438.
| Educational Attainment | Male Income | Female Income |
| Less than High School | - | - |
| High School Diploma | $52,813 | $13,438 |
| College or Associate's Degree | $51,250 | $36,250 |
| Bachelor's Degree | $58,571 | $41,071 |
| Graduate Degree | $67,500 | $66,750 |
| Total | $53,750 | $35,625 |
Family Income in Elizabeth
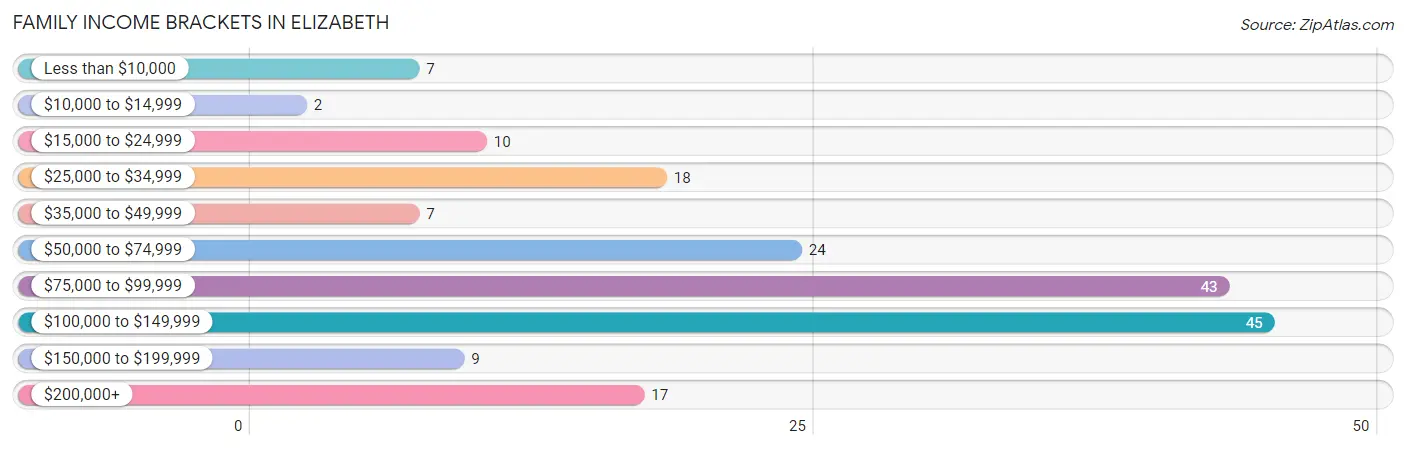
Family Income Brackets in Elizabeth
According to the Elizabeth family income data, there are 45 families falling into the $100,000 to $149,999 income range, which is the most common income bracket and makes up 24.7% of all families. Conversely, the $10,000 to $14,999 income bracket is the least frequent group with only 2 families (1.1%) belonging to this category.
| Income Bracket | # Families | % Families |
| Less than $10,000 | 7 | 3.8% |
| $10,000 to $14,999 | 2 | 1.1% |
| $15,000 to $24,999 | 10 | 5.5% |
| $25,000 to $34,999 | 18 | 9.9% |
| $35,000 to $49,999 | 7 | 3.8% |
| $50,000 to $74,999 | 24 | 13.2% |
| $75,000 to $99,999 | 43 | 23.6% |
| $100,000 to $149,999 | 45 | 24.7% |
| $150,000 to $199,999 | 9 | 4.9% |
| $200,000+ | 17 | 9.3% |
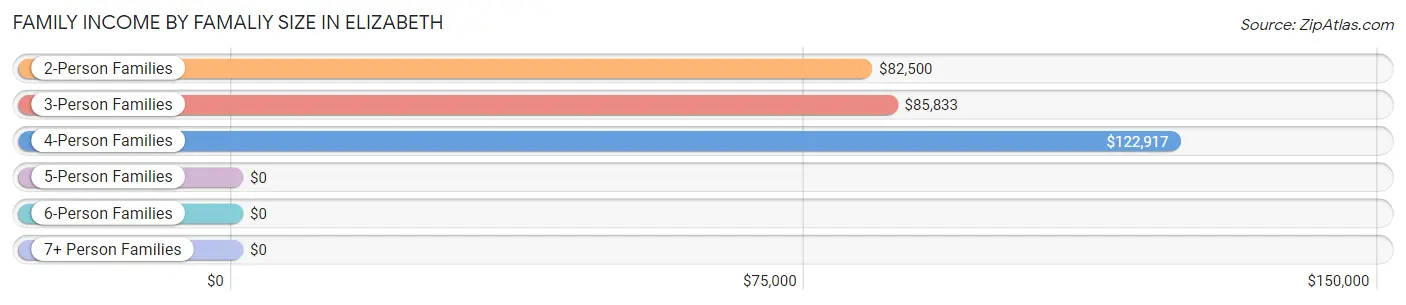
Family Income by Famaliy Size in Elizabeth
4-person families (37 | 20.3%) account for the highest median family income in Elizabeth with $122,917 per family, while 2-person families (88 | 48.3%) have the highest median income of $41,250 per family member.
| Income Bracket | # Families | Median Income |
| 2-Person Families | 88 (48.3%) | $82,500 |
| 3-Person Families | 52 (28.6%) | $85,833 |
| 4-Person Families | 37 (20.3%) | $122,917 |
| 5-Person Families | 3 (1.7%) | $0 |
| 6-Person Families | 2 (1.1%) | $0 |
| 7+ Person Families | 0 (0.0%) | $0 |
| Total | 182 (100.0%) | $87,778 |
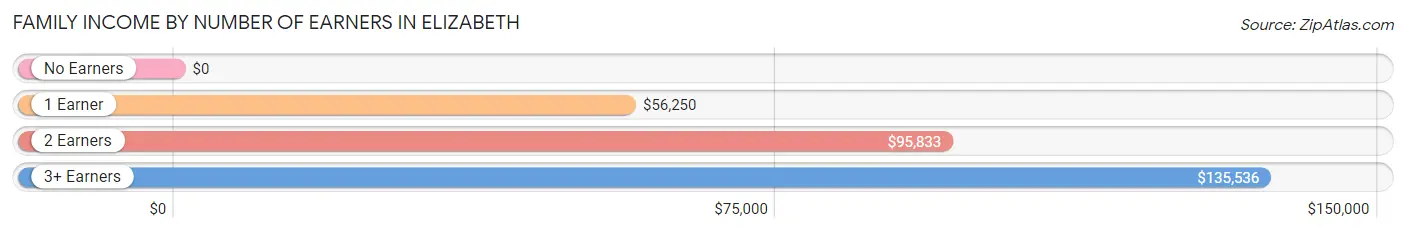
Family Income by Number of Earners in Elizabeth
| Number of Earners | # Families | Median Income |
| No Earners | 11 (6.0%) | $0 |
| 1 Earner | 62 (34.1%) | $56,250 |
| 2 Earners | 80 (44.0%) | $95,833 |
| 3+ Earners | 29 (15.9%) | $135,536 |
| Total | 182 (100.0%) | $87,778 |
Household Income in Elizabeth
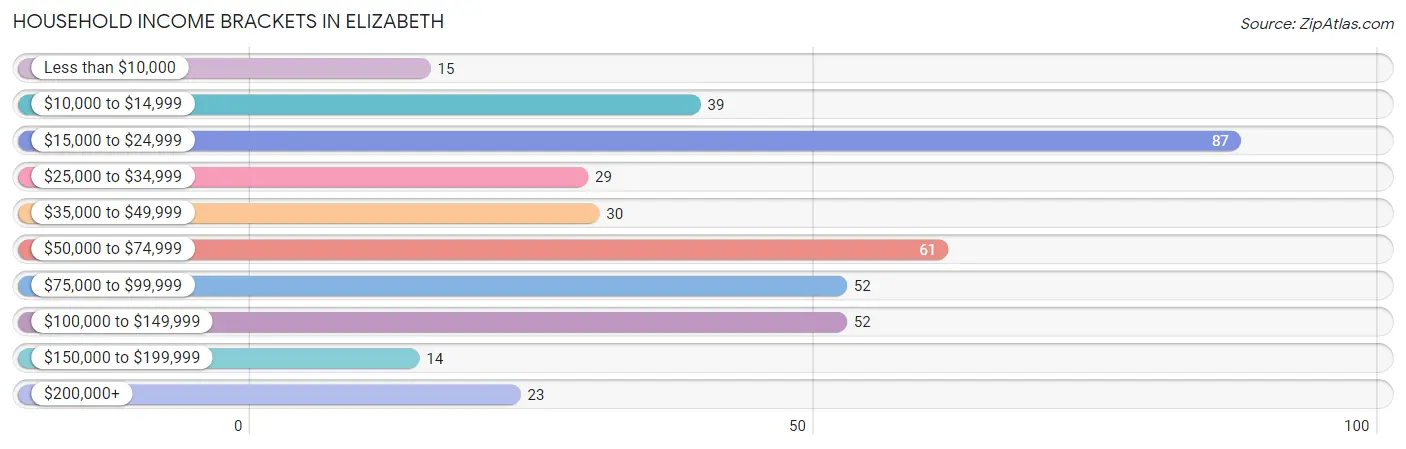
Household Income Brackets in Elizabeth
With 87 households falling in the category, the $15,000 to $24,999 income range is the most frequent in Elizabeth, accounting for 21.6% of all households. In contrast, only 14 households (3.5%) fall into the $150,000 to $199,999 income bracket, making it the least populous group.
| Income Bracket | # Households | % Households |
| Less than $10,000 | 15 | 3.7% |
| $10,000 to $14,999 | 39 | 9.7% |
| $15,000 to $24,999 | 87 | 21.6% |
| $25,000 to $34,999 | 29 | 7.2% |
| $35,000 to $49,999 | 30 | 7.5% |
| $50,000 to $74,999 | 61 | 15.2% |
| $75,000 to $99,999 | 52 | 12.9% |
| $100,000 to $149,999 | 52 | 12.9% |
| $150,000 to $199,999 | 14 | 3.5% |
| $200,000+ | 23 | 5.7% |
Household Income by Householder Age in Elizabeth
The median household income in Elizabeth is $50,357, with the highest median household income of $75,000 found in the 25 to 44 years age bracket for the primary householder. A total of 106 households (26.4%) fall into this category. Meanwhile, the 45 to 64 years age bracket for the primary householder has the lowest median household income of $0, with 88 households (21.9%) in this group.
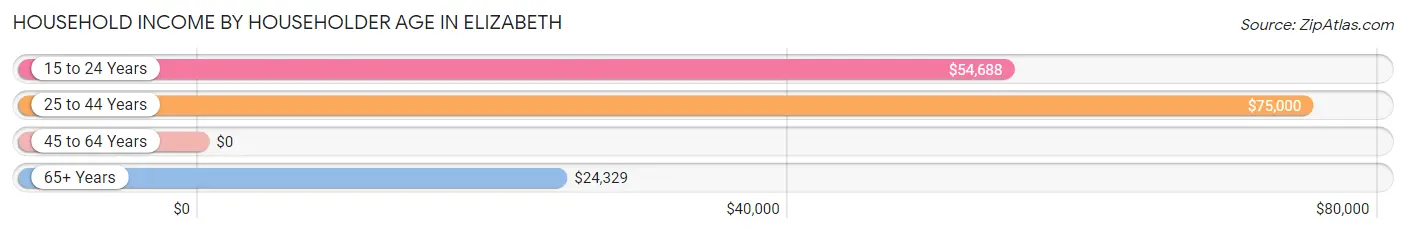
| Income Bracket | # Households | Median Income |
| 15 to 24 Years | 31 (7.7%) | $54,688 |
| 25 to 44 Years | 106 (26.4%) | $75,000 |
| 45 to 64 Years | 88 (21.9%) | $0 |
| 65+ Years | 177 (44.0%) | $24,329 |
| Total | 402 (100.0%) | $50,357 |
Poverty in Elizabeth
Income Below Poverty by Sex and Age in Elizabeth
With 6.7% poverty level for males and 17.0% for females among the residents of Elizabeth, 6 to 11 year old males and 18 to 24 year old females are the most vulnerable to poverty, with 6 males (21.4%) and 14 females (60.9%) in their respective age groups living below the poverty level.
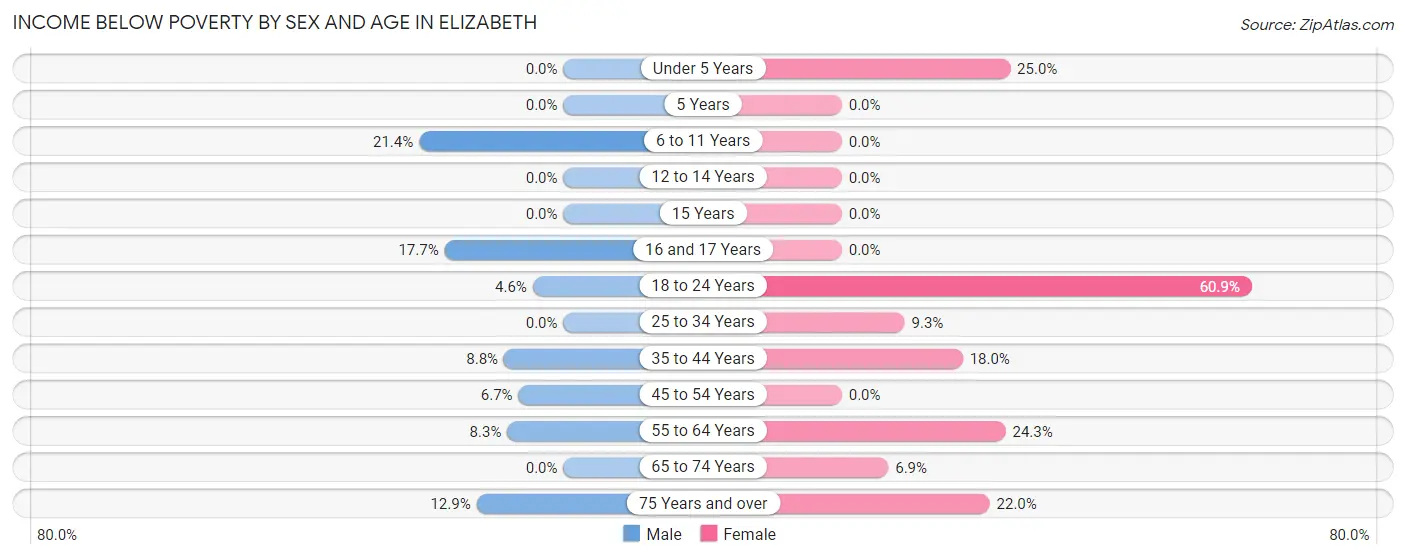
| Age Bracket | Male | Female |
| Under 5 Years | 0 (0.0%) | 7 (25.0%) |
| 5 Years | 0 (0.0%) | 0 (0.0%) |
| 6 to 11 Years | 6 (21.4%) | 0 (0.0%) |
| 12 to 14 Years | 0 (0.0%) | 0 (0.0%) |
| 15 Years | 0 (0.0%) | 0 (0.0%) |
| 16 and 17 Years | 3 (17.6%) | 0 (0.0%) |
| 18 to 24 Years | 2 (4.5%) | 14 (60.9%) |
| 25 to 34 Years | 0 (0.0%) | 7 (9.3%) |
| 35 to 44 Years | 3 (8.8%) | 7 (17.9%) |
| 45 to 54 Years | 3 (6.7%) | 0 (0.0%) |
| 55 to 64 Years | 3 (8.3%) | 9 (24.3%) |
| 65 to 74 Years | 0 (0.0%) | 2 (6.9%) |
| 75 Years and over | 4 (12.9%) | 27 (22.0%) |
| Total | 24 (6.7%) | 73 (17.0%) |
Income Above Poverty by Sex and Age in Elizabeth
According to the poverty statistics in Elizabeth, males aged under 5 years and females aged 6 to 11 years are the age groups that are most secure financially, with 100.0% of males and 100.0% of females in these age groups living above the poverty line.
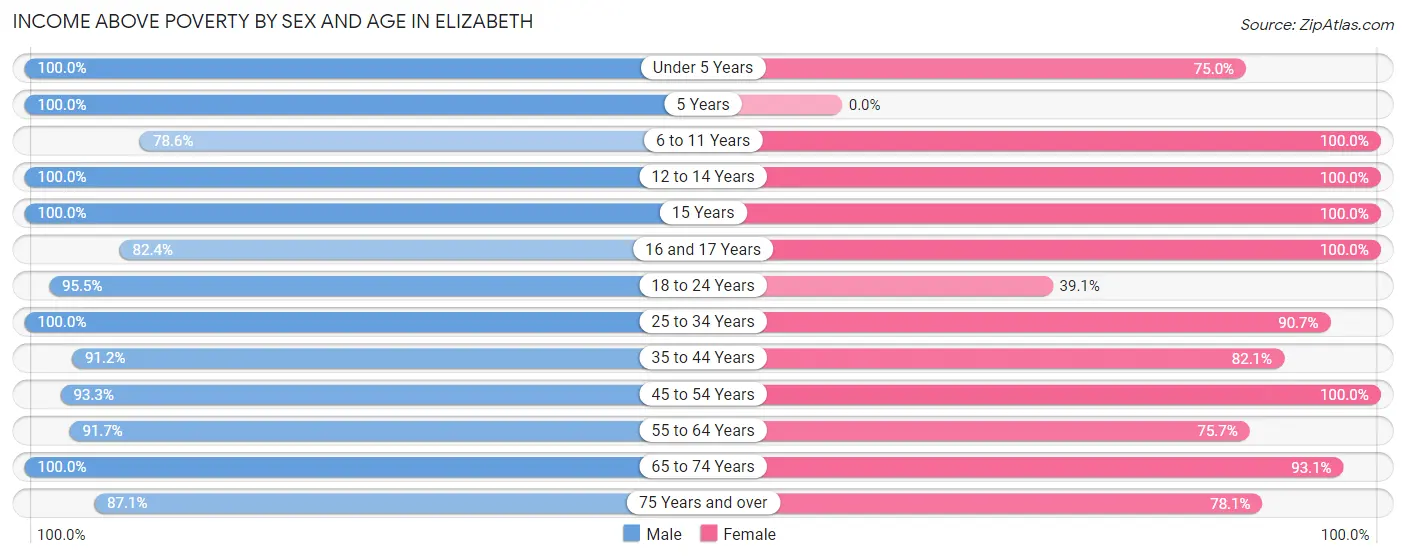
| Age Bracket | Male | Female |
| Under 5 Years | 14 (100.0%) | 21 (75.0%) |
| 5 Years | 3 (100.0%) | 0 (0.0%) |
| 6 to 11 Years | 22 (78.6%) | 14 (100.0%) |
| 12 to 14 Years | 15 (100.0%) | 17 (100.0%) |
| 15 Years | 3 (100.0%) | 2 (100.0%) |
| 16 and 17 Years | 14 (82.4%) | 7 (100.0%) |
| 18 to 24 Years | 42 (95.5%) | 9 (39.1%) |
| 25 to 34 Years | 59 (100.0%) | 68 (90.7%) |
| 35 to 44 Years | 31 (91.2%) | 32 (82.1%) |
| 45 to 54 Years | 42 (93.3%) | 36 (100.0%) |
| 55 to 64 Years | 33 (91.7%) | 28 (75.7%) |
| 65 to 74 Years | 31 (100.0%) | 27 (93.1%) |
| 75 Years and over | 27 (87.1%) | 96 (78.0%) |
| Total | 336 (93.3%) | 357 (83.0%) |
Income Below Poverty Among Married-Couple Families in Elizabeth
The poverty statistics for married-couple families in Elizabeth show that 1.4% or 2 of the total 145 families live below the poverty line. Families with no children have the highest poverty rate of 2.1%, comprising of 2 families. On the other hand, families with 1 or 2 children have the lowest poverty rate of 0.0%, which includes 0 families.
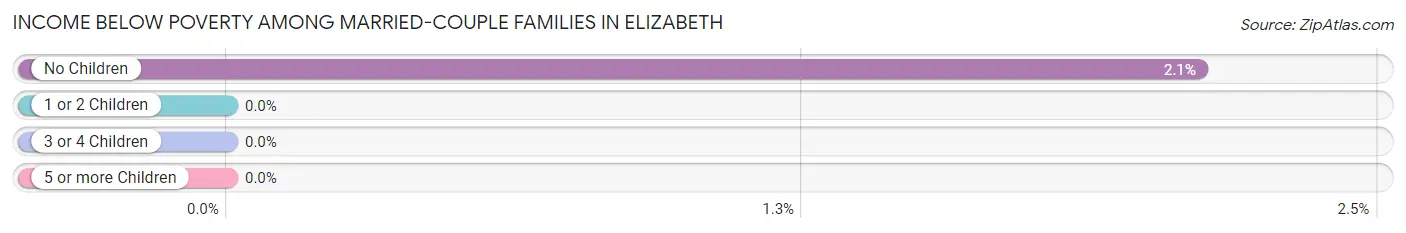
| Children | Above Poverty | Below Poverty |
| No Children | 93 (97.9%) | 2 (2.1%) |
| 1 or 2 Children | 46 (100.0%) | 0 (0.0%) |
| 3 or 4 Children | 4 (100.0%) | 0 (0.0%) |
| 5 or more Children | 0 (0.0%) | 0 (0.0%) |
| Total | 143 (98.6%) | 2 (1.4%) |
Income Below Poverty Among Single-Parent Households in Elizabeth
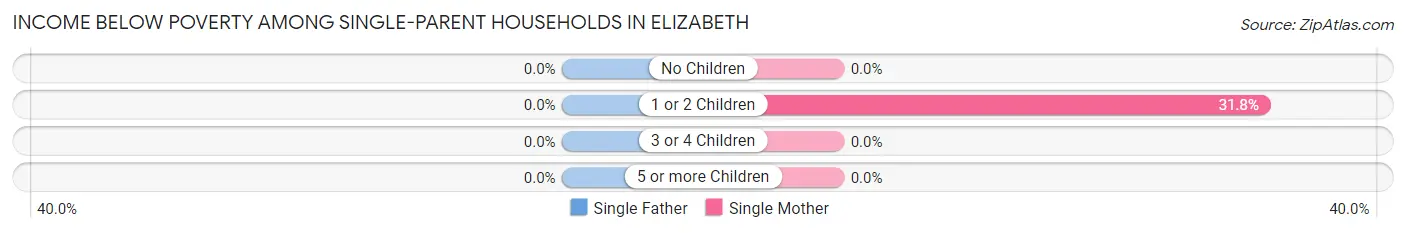
| Children | Single Father | Single Mother |
| No Children | 0 (0.0%) | 0 (0.0%) |
| 1 or 2 Children | 0 (0.0%) | 7 (31.8%) |
| 3 or 4 Children | 0 (0.0%) | 0 (0.0%) |
| 5 or more Children | 0 (0.0%) | 0 (0.0%) |
| Total | 0 (0.0%) | 7 (23.3%) |
Income Below Poverty Among Married-Couple vs Single-Parent Households in Elizabeth
The poverty data for Elizabeth shows that 2 of the married-couple family households (1.4%) and 7 of the single-parent households (18.9%) are living below the poverty level. Within the married-couple family households, those with no children have the highest poverty rate, with 2 households (2.1%) falling below the poverty line. Among the single-parent households, those with 1 or 2 children have the highest poverty rate, with 7 household (24.1%) living below poverty.
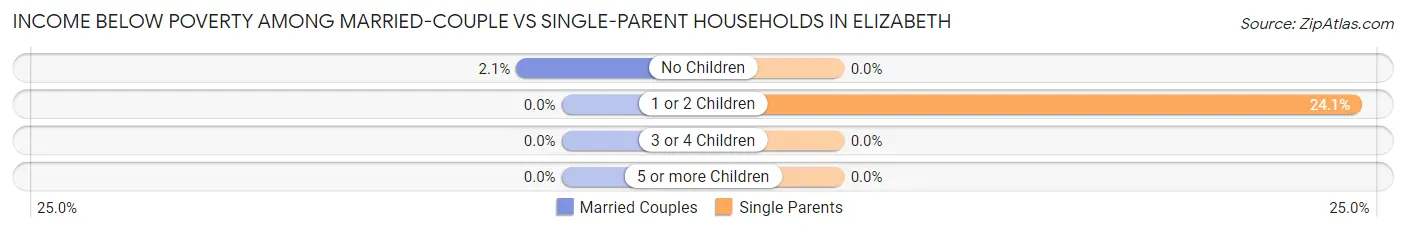
| Children | Married-Couple Families | Single-Parent Households |
| No Children | 2 (2.1%) | 0 (0.0%) |
| 1 or 2 Children | 0 (0.0%) | 7 (24.1%) |
| 3 or 4 Children | 0 (0.0%) | 0 (0.0%) |
| 5 or more Children | 0 (0.0%) | 0 (0.0%) |
| Total | 2 (1.4%) | 7 (18.9%) |
Race in Elizabeth
The most populous races in Elizabeth are White / Caucasian (787 | 96.5%), Hispanic or Latino (39 | 4.8%), and Two or more Races (11 | 1.3%).
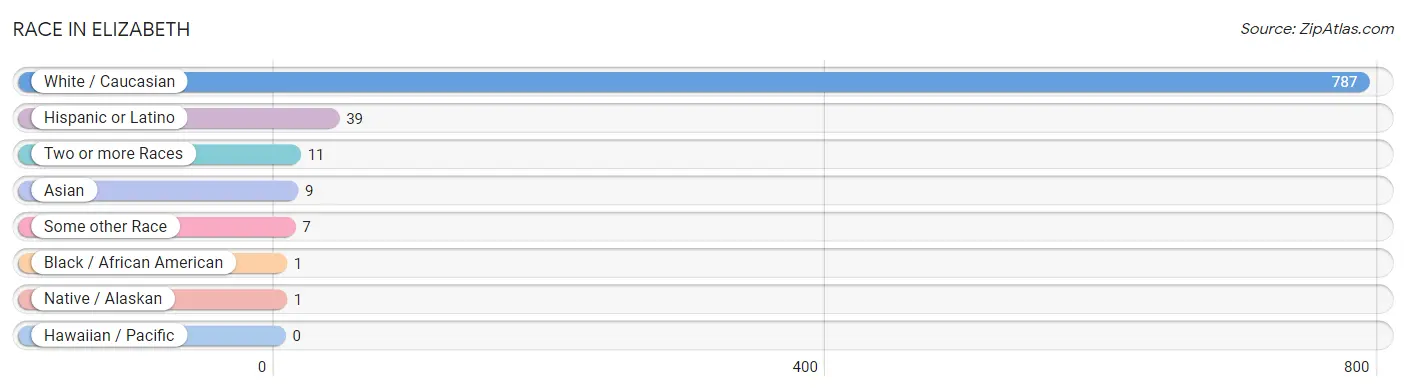
| Race | # Population | % Population |
| Asian | 9 | 1.1% |
| Black / African American | 1 | 0.1% |
| Hawaiian / Pacific | 0 | 0.0% |
| Hispanic or Latino | 39 | 4.8% |
| Native / Alaskan | 1 | 0.1% |
| White / Caucasian | 787 | 96.5% |
| Two or more Races | 11 | 1.3% |
| Some other Race | 7 | 0.9% |
| Total | 816 | 100.0% |
Ancestry in Elizabeth
The most populous ancestries reported in Elizabeth are German (339 | 41.5%), Irish (112 | 13.7%), English (66 | 8.1%), American (41 | 5.0%), and Mexican (39 | 4.8%), together accounting for 73.2% of all Elizabeth residents.
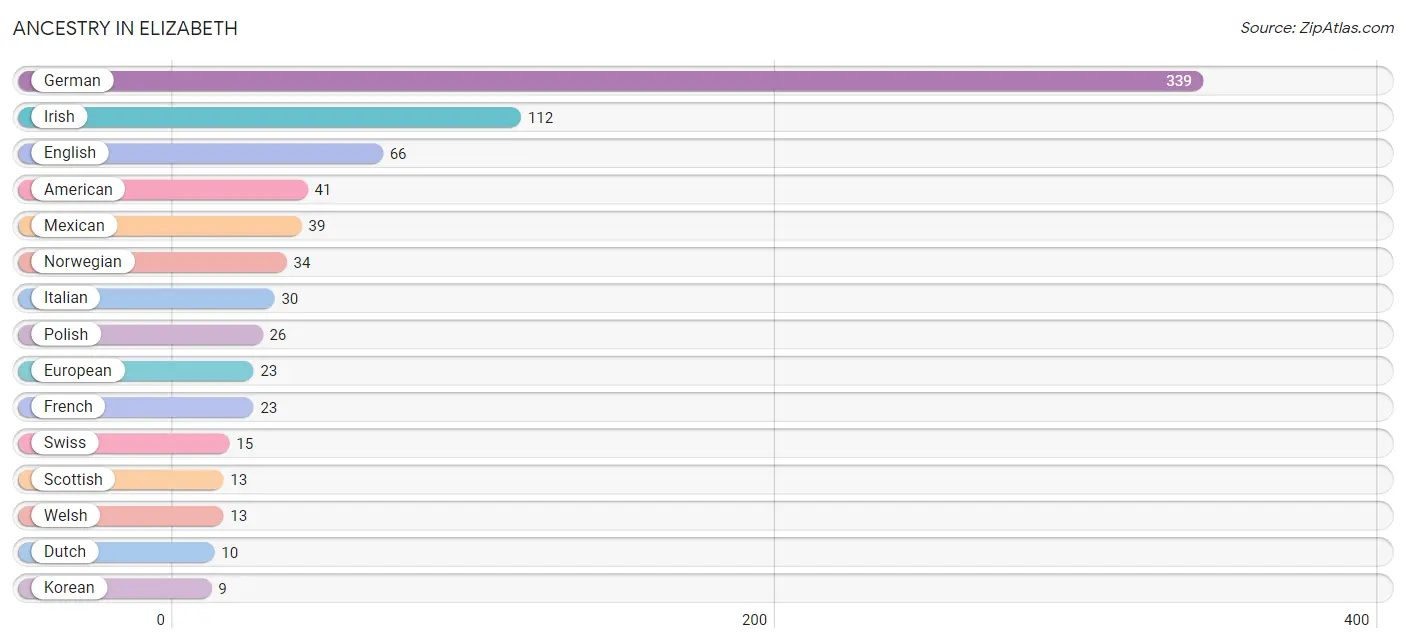
| Ancestry | # Population | % Population |
| American | 41 | 5.0% |
| Austrian | 1 | 0.1% |
| Chippewa | 1 | 0.1% |
| Czech | 5 | 0.6% |
| Danish | 8 | 1.0% |
| Dutch | 10 | 1.2% |
| English | 66 | 8.1% |
| European | 23 | 2.8% |
| French | 23 | 2.8% |
| German | 339 | 41.5% |
| Greek | 2 | 0.3% |
| Irish | 112 | 13.7% |
| Italian | 30 | 3.7% |
| Korean | 9 | 1.1% |
| Mexican | 39 | 4.8% |
| Norwegian | 34 | 4.2% |
| Polish | 26 | 3.2% |
| Scotch-Irish | 1 | 0.1% |
| Scottish | 13 | 1.6% |
| Swedish | 7 | 0.9% |
| Swiss | 15 | 1.8% |
| Ukrainian | 5 | 0.6% |
| Welsh | 13 | 1.6% | View All 23 Rows |
Immigrants in Elizabeth
The most numerous immigrant groups reported in Elizabeth came from Europe (11 | 1.3%), Northern Europe (6 | 0.7%), Eastern Europe (5 | 0.6%), England (4 | 0.5%), and Central America (3 | 0.4%), together accounting for 3.6% of all Elizabeth residents.
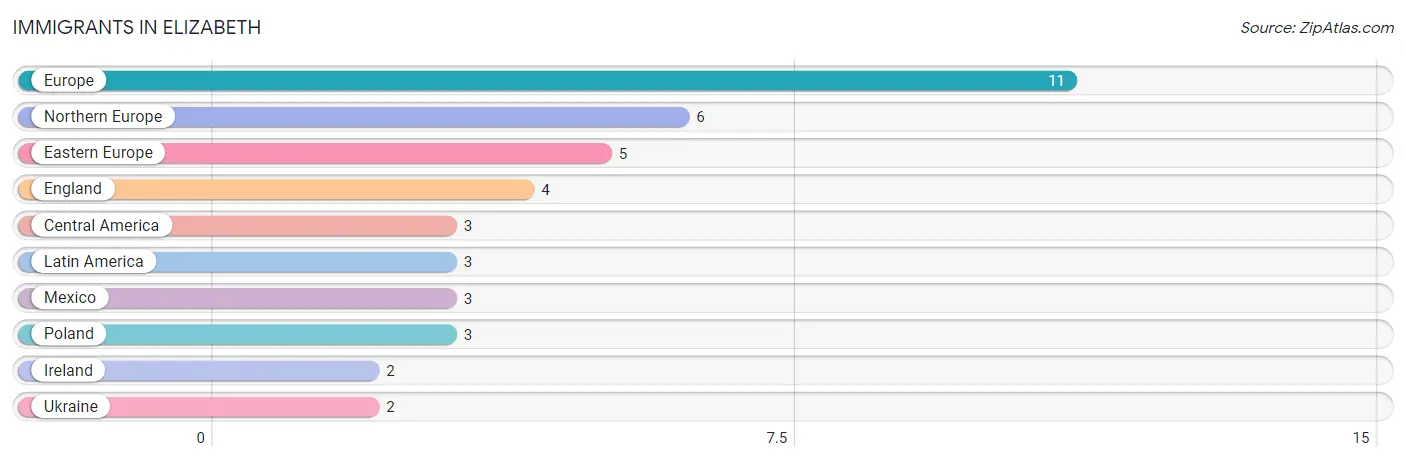
| Immigration Origin | # Population | % Population |
| Central America | 3 | 0.4% |
| Eastern Europe | 5 | 0.6% |
| England | 4 | 0.5% |
| Europe | 11 | 1.3% |
| Ireland | 2 | 0.3% |
| Latin America | 3 | 0.4% |
| Mexico | 3 | 0.4% |
| Northern Europe | 6 | 0.7% |
| Poland | 3 | 0.4% |
| Ukraine | 2 | 0.3% | View All 10 Rows |
Sex and Age in Elizabeth
Sex and Age in Elizabeth
The most populous age groups in Elizabeth are 15 to 19 Years (37 | 10.1%) for men and 85 Years and over (76 | 16.9%) for women.
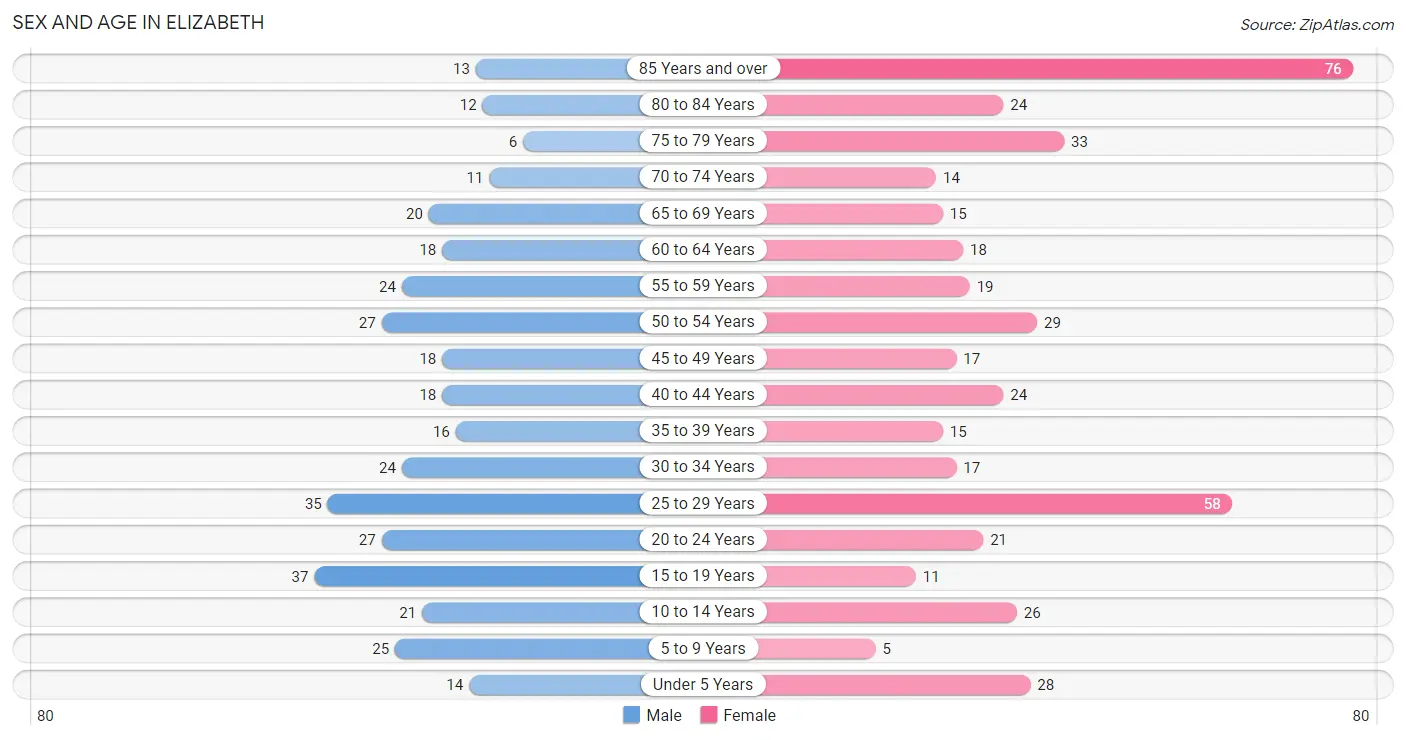
| Age Bracket | Male | Female |
| Under 5 Years | 14 (3.8%) | 28 (6.2%) |
| 5 to 9 Years | 25 (6.8%) | 5 (1.1%) |
| 10 to 14 Years | 21 (5.7%) | 26 (5.8%) |
| 15 to 19 Years | 37 (10.1%) | 11 (2.4%) |
| 20 to 24 Years | 27 (7.4%) | 21 (4.7%) |
| 25 to 29 Years | 35 (9.6%) | 58 (12.9%) |
| 30 to 34 Years | 24 (6.6%) | 17 (3.8%) |
| 35 to 39 Years | 16 (4.4%) | 15 (3.3%) |
| 40 to 44 Years | 18 (4.9%) | 24 (5.3%) |
| 45 to 49 Years | 18 (4.9%) | 17 (3.8%) |
| 50 to 54 Years | 27 (7.4%) | 29 (6.4%) |
| 55 to 59 Years | 24 (6.6%) | 19 (4.2%) |
| 60 to 64 Years | 18 (4.9%) | 18 (4.0%) |
| 65 to 69 Years | 20 (5.5%) | 15 (3.3%) |
| 70 to 74 Years | 11 (3.0%) | 14 (3.1%) |
| 75 to 79 Years | 6 (1.6%) | 33 (7.3%) |
| 80 to 84 Years | 12 (3.3%) | 24 (5.3%) |
| 85 Years and over | 13 (3.5%) | 76 (16.9%) |
| Total | 366 (100.0%) | 450 (100.0%) |
Families and Households in Elizabeth
Median Family Size in Elizabeth
The median family size in Elizabeth is 2.86 persons per family, with married-couple families (145 | 79.7%) accounting for the largest median family size of 2.94 persons per family. On the other hand, single female/mother families (30 | 16.5%) represent the smallest median family size with 2.53 persons per family.
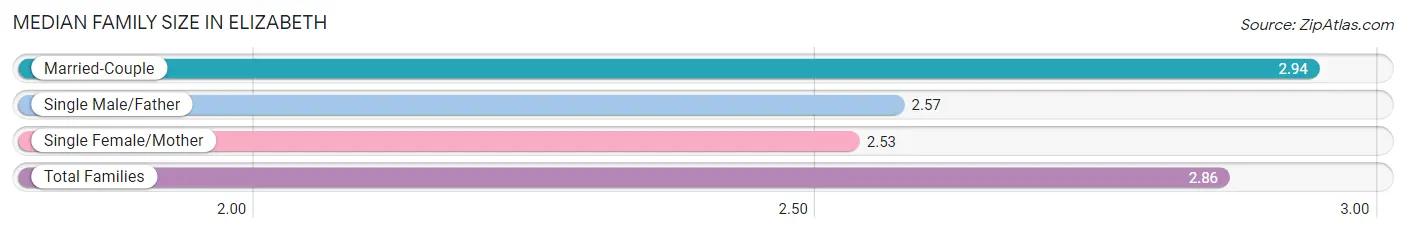
| Family Type | # Families | Family Size |
| Married-Couple | 145 (79.7%) | 2.94 |
| Single Male/Father | 7 (3.8%) | 2.57 |
| Single Female/Mother | 30 (16.5%) | 2.53 |
| Total Families | 182 (100.0%) | 2.86 |
Median Household Size in Elizabeth
The median household size in Elizabeth is 1.97 persons per household, with single male/father households (7 | 1.7%) accounting for the largest median household size of 3.14 persons per household. non-family households (220 | 54.7%) represent the smallest median household size with 1.14 persons per household.
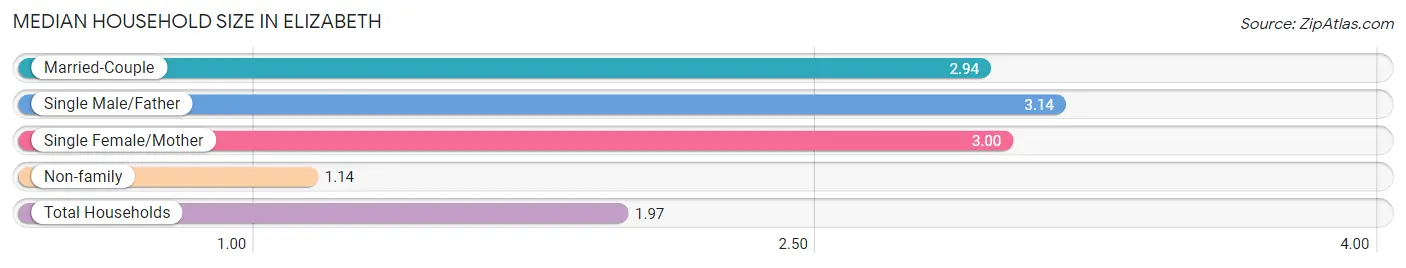
| Household Type | # Households | Household Size |
| Married-Couple | 145 (36.1%) | 2.94 |
| Single Male/Father | 7 (1.7%) | 3.14 |
| Single Female/Mother | 30 (7.5%) | 3.00 |
| Non-family | 220 (54.7%) | 1.14 |
| Total Households | 402 (100.0%) | 1.97 |
Household Size by Marriage Status in Elizabeth
Out of a total of 402 households in Elizabeth, 182 (45.3%) are family households, while 220 (54.7%) are nonfamily households. The most numerous type of family households are 2-person households, comprising 83, and the most common type of nonfamily households are 1-person households, comprising 197.
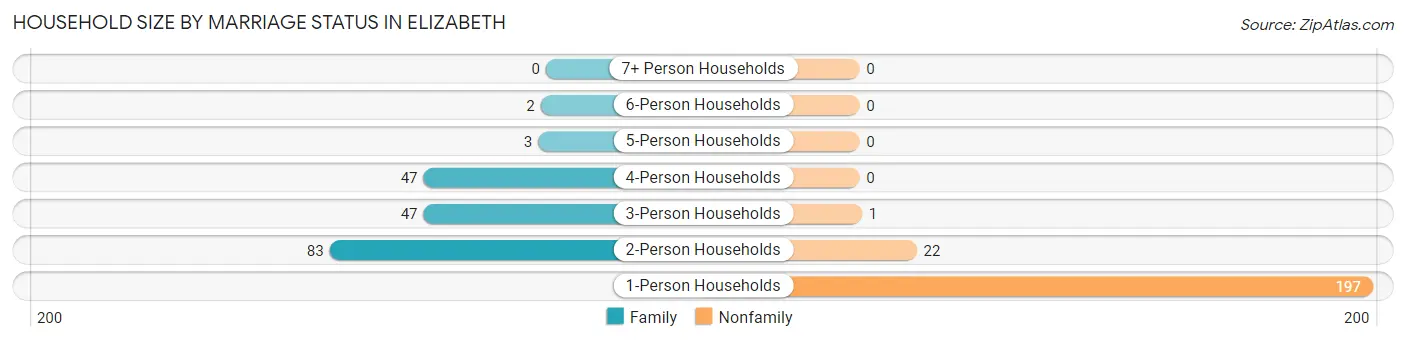
| Household Size | Family Households | Nonfamily Households |
| 1-Person Households | - | 197 (49.0%) |
| 2-Person Households | 83 (20.6%) | 22 (5.5%) |
| 3-Person Households | 47 (11.7%) | 1 (0.3%) |
| 4-Person Households | 47 (11.7%) | 0 (0.0%) |
| 5-Person Households | 3 (0.7%) | 0 (0.0%) |
| 6-Person Households | 2 (0.5%) | 0 (0.0%) |
| 7+ Person Households | 0 (0.0%) | 0 (0.0%) |
| Total | 182 (45.3%) | 220 (54.7%) |
Female Fertility in Elizabeth
Fertility by Age in Elizabeth
Average fertility rate in Elizabeth is 36.0 births per 1,000 women. Women in the age bracket of 20 to 34 years have the highest fertility rate with 63.0 births per 1,000 women. Women in the age bracket of 20 to 34 years acount for 100.0% of all women with births.
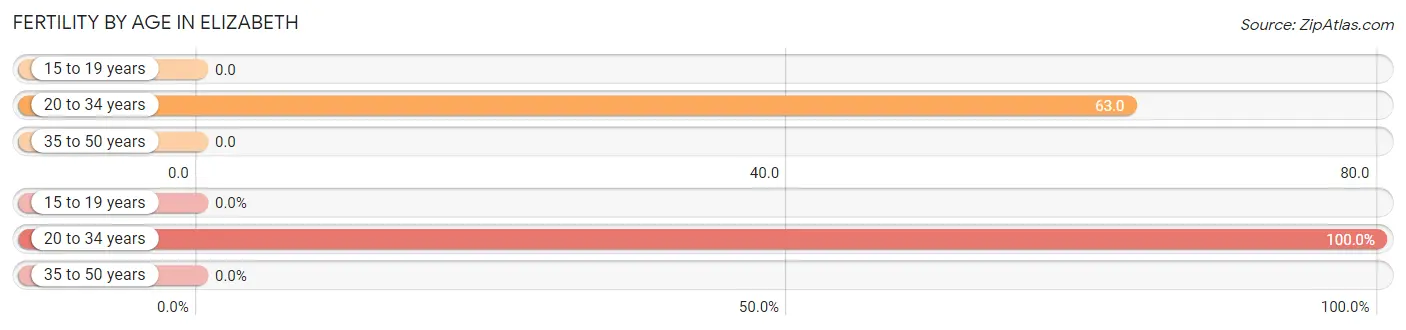
| Age Bracket | Women with Births | Births / 1,000 Women |
| 15 to 19 years | 0 (0.0%) | 0.0 |
| 20 to 34 years | 6 (100.0%) | 63.0 |
| 35 to 50 years | 0 (0.0%) | 0.0 |
| Total | 6 (100.0%) | 36.0 |
Fertility by Age by Marriage Status in Elizabeth
66.7% of women with births (6) in Elizabeth are married. The highest percentage of unmarried women with births falls into 20 to 34 years age bracket with 33.3% of them unmarried at the time of birth, while the lowest percentage of unmarried women with births belong to 20 to 34 years age bracket with 33.3% of them unmarried.
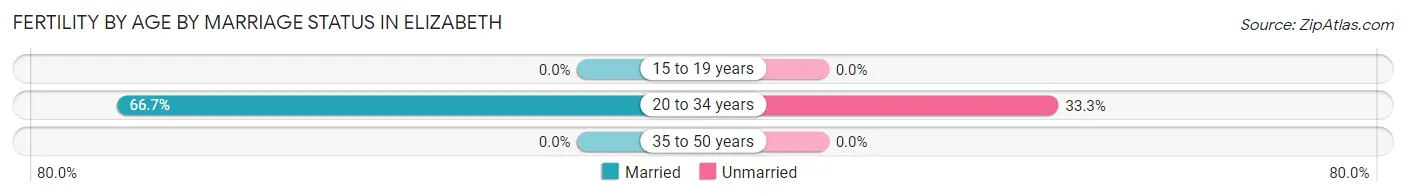
| Age Bracket | Married | Unmarried |
| 15 to 19 years | 0 (0.0%) | 0 (0.0%) |
| 20 to 34 years | 4 (66.7%) | 2 (33.3%) |
| 35 to 50 years | 0 (0.0%) | 0 (0.0%) |
| Total | 4 (66.7%) | 2 (33.3%) |
Fertility by Education in Elizabeth
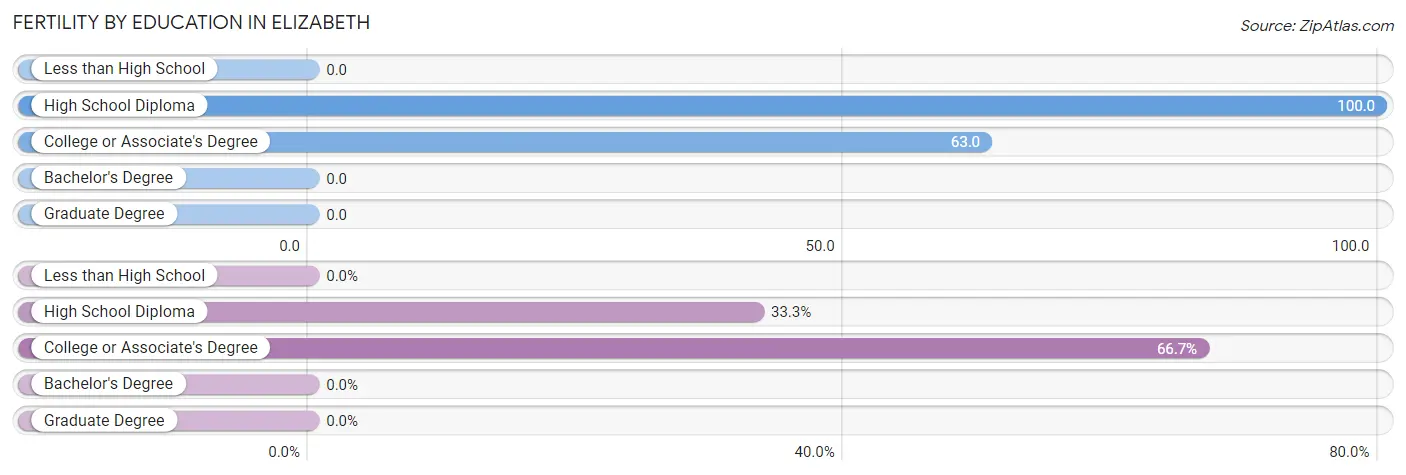
| Educational Attainment | Women with Births | Births / 1,000 Women |
| Less than High School | 0 (0.0%) | 0.0 |
| High School Diploma | 2 (33.3%) | 100.0 |
| College or Associate's Degree | 4 (66.7%) | 63.0 |
| Bachelor's Degree | 0 (0.0%) | 0.0 |
| Graduate Degree | 0 (0.0%) | 0.0 |
| Total | 6 (100.0%) | 36.0 |
Fertility by Education by Marriage Status in Elizabeth
33.3% of women with births in Elizabeth are unmarried. Women with the educational attainment of college or associate's degree are most likely to be married with 100.0% of them married at childbirth, while women with the educational attainment of high school diploma are least likely to be married with 100.0% of them unmarried at childbirth.
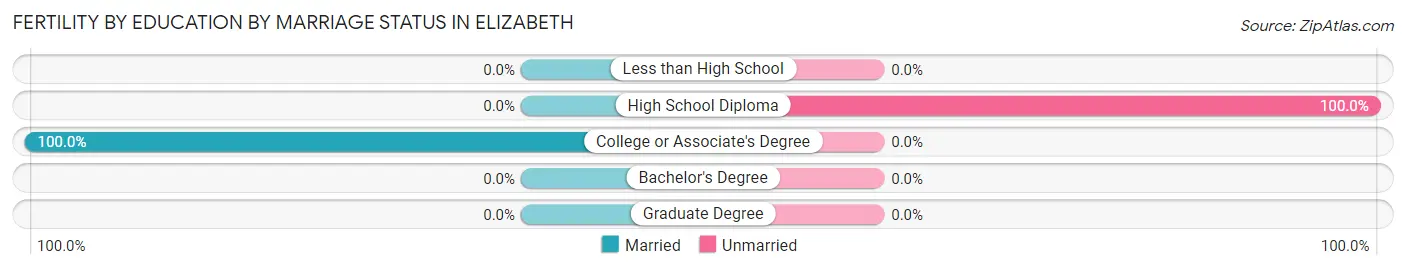
| Educational Attainment | Married | Unmarried |
| Less than High School | 0 (0.0%) | 0 (0.0%) |
| High School Diploma | 0 (0.0%) | 2 (100.0%) |
| College or Associate's Degree | 4 (100.0%) | 0 (0.0%) |
| Bachelor's Degree | 0 (0.0%) | 0 (0.0%) |
| Graduate Degree | 0 (0.0%) | 0 (0.0%) |
| Total | 4 (66.7%) | 2 (33.3%) |
Employment Characteristics in Elizabeth
Employment by Class of Employer in Elizabeth
Among the 412 employed individuals in Elizabeth, private company employees (224 | 54.4%), not-for-profit organizations (66 | 16.0%), and local government employees (49 | 11.9%) make up the most common classes of employment.
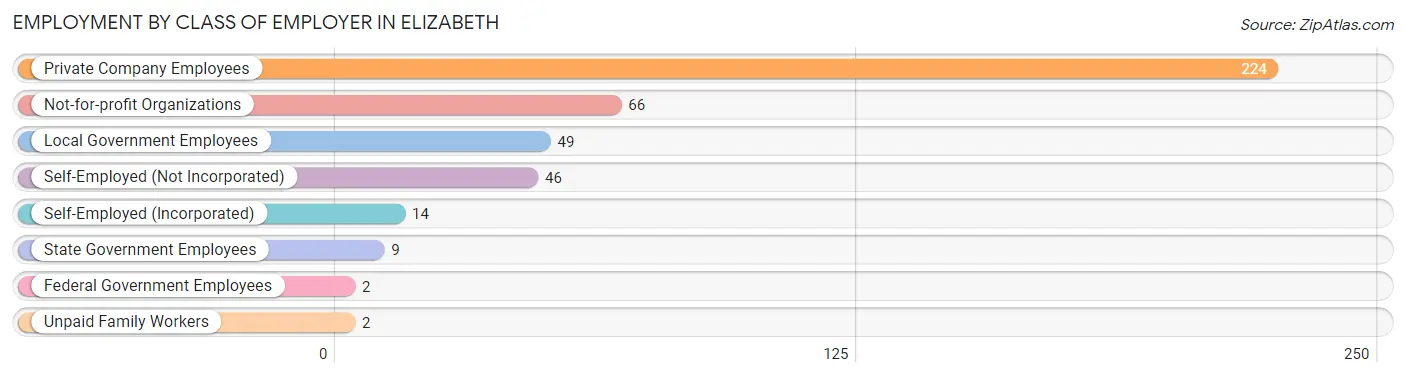
| Employer Class | # Employees | % Employees |
| Private Company Employees | 224 | 54.4% |
| Self-Employed (Incorporated) | 14 | 3.4% |
| Self-Employed (Not Incorporated) | 46 | 11.2% |
| Not-for-profit Organizations | 66 | 16.0% |
| Local Government Employees | 49 | 11.9% |
| State Government Employees | 9 | 2.2% |
| Federal Government Employees | 2 | 0.5% |
| Unpaid Family Workers | 2 | 0.5% |
| Total | 412 | 100.0% |
Employment Status by Age in Elizabeth
According to the labor force statistics for Elizabeth, out of the total population over 16 years of age (692), 60.8% or 421 individuals are in the labor force, with 0.5% or 2 of them unemployed. The age group with the highest labor force participation rate is 25 to 29 years, with 100.0% or 93 individuals in the labor force. Within the labor force, the 60 to 64 years age range has the highest percentage of unemployed individuals, with 8.3% or 2 of them being unemployed.
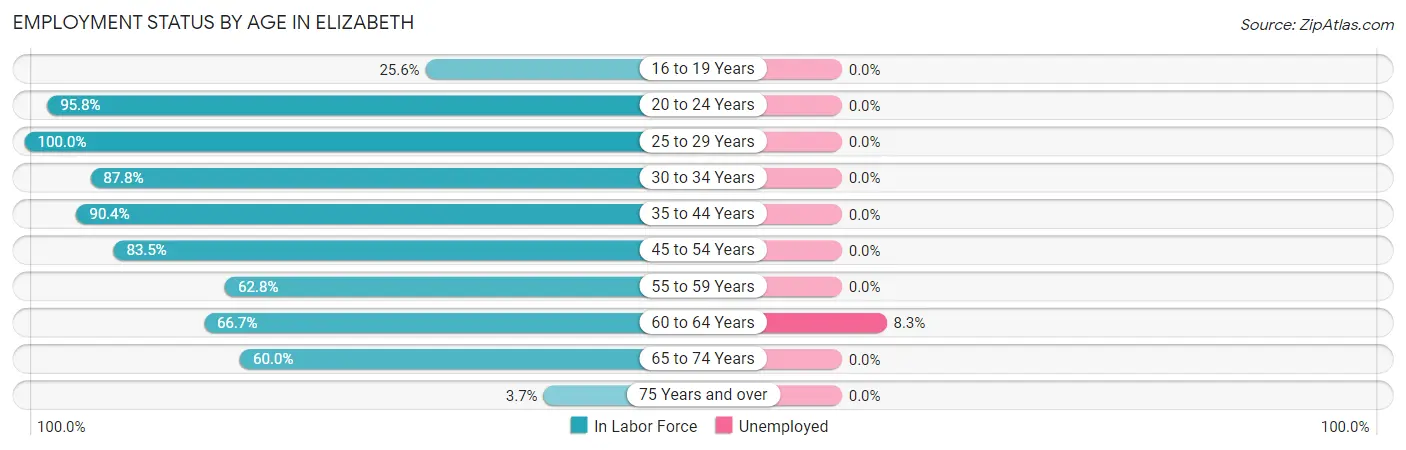
| Age Bracket | In Labor Force | Unemployed |
| 16 to 19 Years | 11 (25.6%) | 0 (0.0%) |
| 20 to 24 Years | 46 (95.8%) | 0 (0.0%) |
| 25 to 29 Years | 93 (100.0%) | 0 (0.0%) |
| 30 to 34 Years | 36 (87.8%) | 0 (0.0%) |
| 35 to 44 Years | 66 (90.4%) | 0 (0.0%) |
| 45 to 54 Years | 76 (83.5%) | 0 (0.0%) |
| 55 to 59 Years | 27 (62.8%) | 0 (0.0%) |
| 60 to 64 Years | 24 (66.7%) | 2 (8.3%) |
| 65 to 74 Years | 36 (60.0%) | 0 (0.0%) |
| 75 Years and over | 6 (3.7%) | 0 (0.0%) |
| Total | 421 (60.8%) | 2 (0.5%) |
Employment Status by Educational Attainment in Elizabeth
According to labor force statistics for Elizabeth, 85.4% of individuals (322) out of the total population between 25 and 64 years of age (377) are in the labor force, with 0.6% or 2 of them being unemployed. The group with the highest labor force participation rate are those with the educational attainment of college / associate degree, with 90.3% or 121 individuals in the labor force. Within the labor force, individuals with less than high school education have the highest percentage of unemployment, with 25.0% or 2 of them being unemployed.
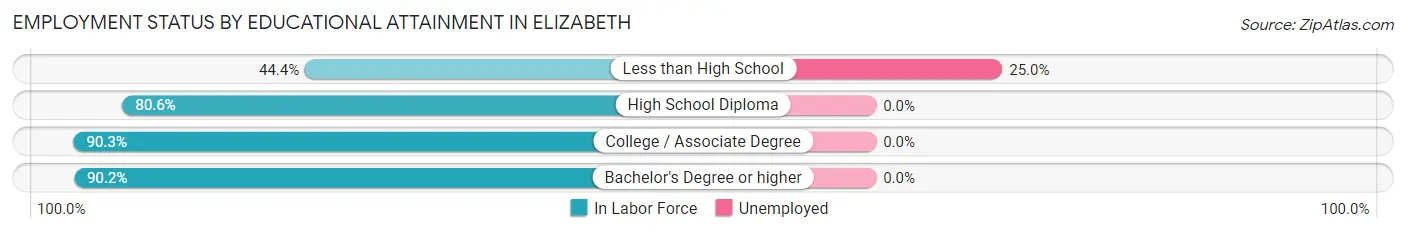
| Educational Attainment | In Labor Force | Unemployed |
| Less than High School | 8 (44.4%) | 4 (25.0%) |
| High School Diploma | 83 (80.6%) | 0 (0.0%) |
| College / Associate Degree | 121 (90.3%) | 0 (0.0%) |
| Bachelor's Degree or higher | 110 (90.2%) | 0 (0.0%) |
| Total | 322 (85.4%) | 2 (0.6%) |
Employment Occupations by Sex in Elizabeth
Management, Business, Science and Arts Occupations
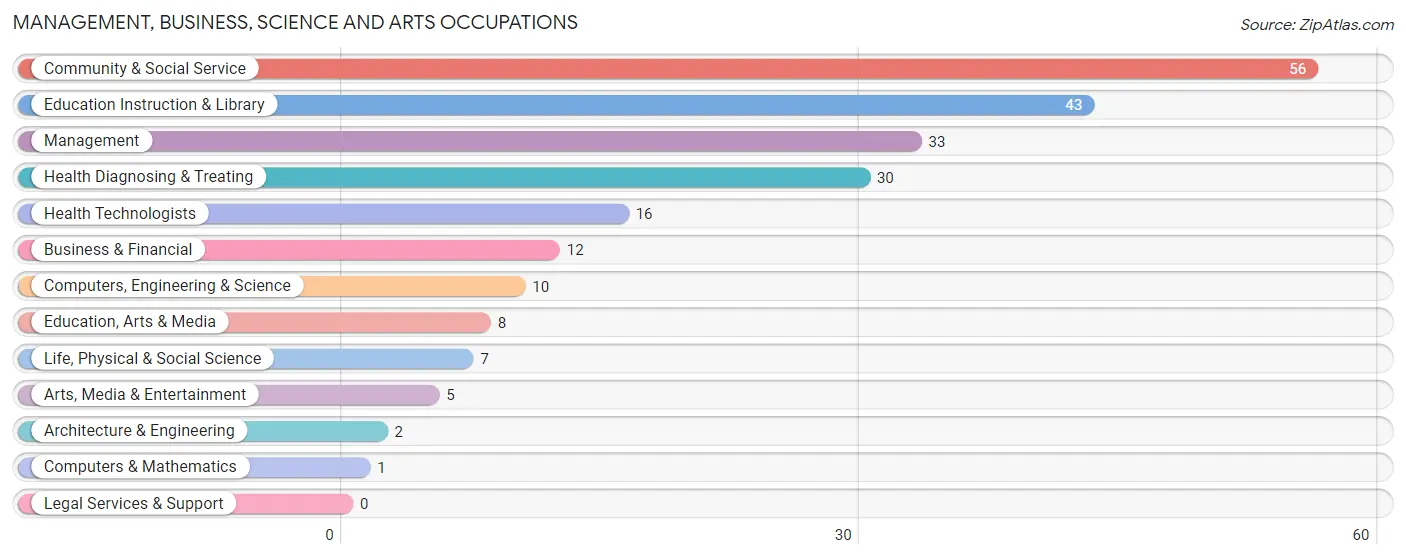
The most common Management, Business, Science and Arts occupations in Elizabeth are Community & Social Service (56 | 13.4%), Education Instruction & Library (43 | 10.3%), Management (33 | 7.9%), Health Diagnosing & Treating (30 | 7.2%), and Health Technologists (16 | 3.8%).
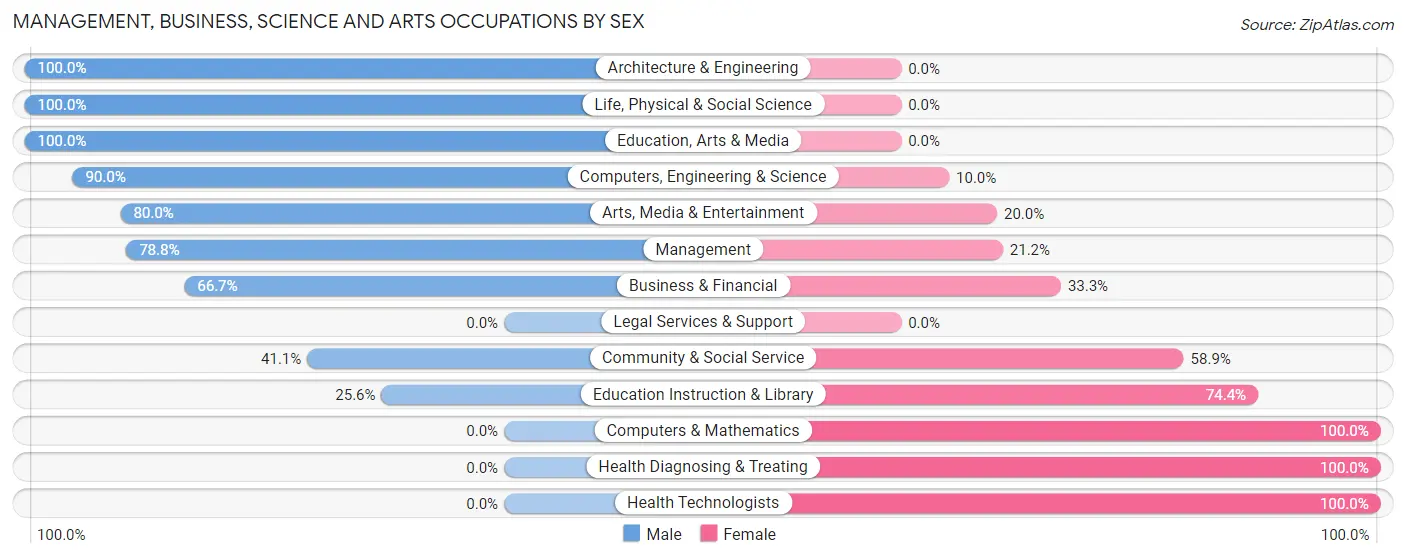
Management, Business, Science and Arts Occupations by Sex
Within the Management, Business, Science and Arts occupations in Elizabeth, the most male-oriented occupations are Architecture & Engineering (100.0%), Life, Physical & Social Science (100.0%), and Education, Arts & Media (100.0%), while the most female-oriented occupations are Computers & Mathematics (100.0%), Health Diagnosing & Treating (100.0%), and Health Technologists (100.0%).
| Occupation | Male | Female |
| Management | 26 (78.8%) | 7 (21.2%) |
| Business & Financial | 8 (66.7%) | 4 (33.3%) |
| Computers, Engineering & Science | 9 (90.0%) | 1 (10.0%) |
| Computers & Mathematics | 0 (0.0%) | 1 (100.0%) |
| Architecture & Engineering | 2 (100.0%) | 0 (0.0%) |
| Life, Physical & Social Science | 7 (100.0%) | 0 (0.0%) |
| Community & Social Service | 23 (41.1%) | 33 (58.9%) |
| Education, Arts & Media | 8 (100.0%) | 0 (0.0%) |
| Legal Services & Support | 0 (0.0%) | 0 (0.0%) |
| Education Instruction & Library | 11 (25.6%) | 32 (74.4%) |
| Arts, Media & Entertainment | 4 (80.0%) | 1 (20.0%) |
| Health Diagnosing & Treating | 0 (0.0%) | 30 (100.0%) |
| Health Technologists | 0 (0.0%) | 16 (100.0%) |
| Total (Category) | 66 (46.8%) | 75 (53.2%) |
| Total (Overall) | 221 (52.7%) | 198 (47.3%) |
Services Occupations
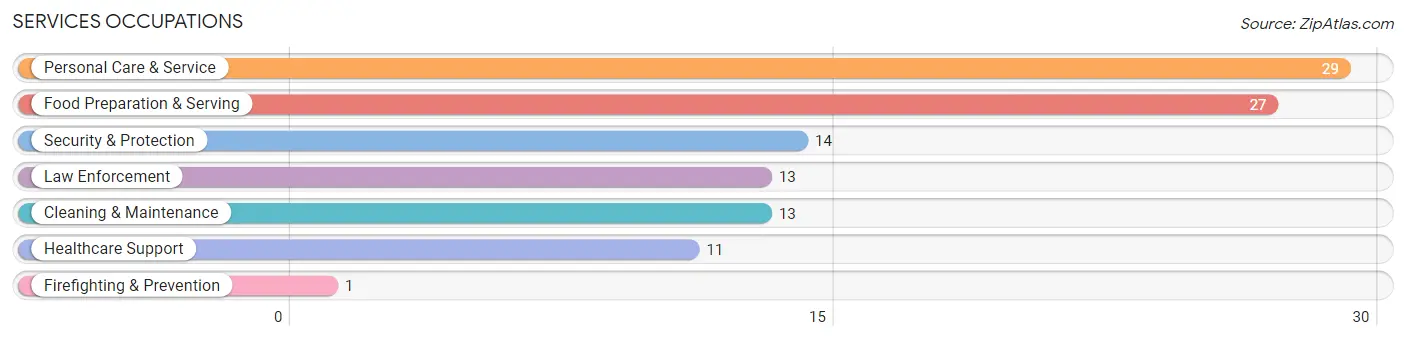
The most common Services occupations in Elizabeth are Personal Care & Service (29 | 6.9%), Food Preparation & Serving (27 | 6.4%), Security & Protection (14 | 3.3%), Law Enforcement (13 | 3.1%), and Cleaning & Maintenance (13 | 3.1%).
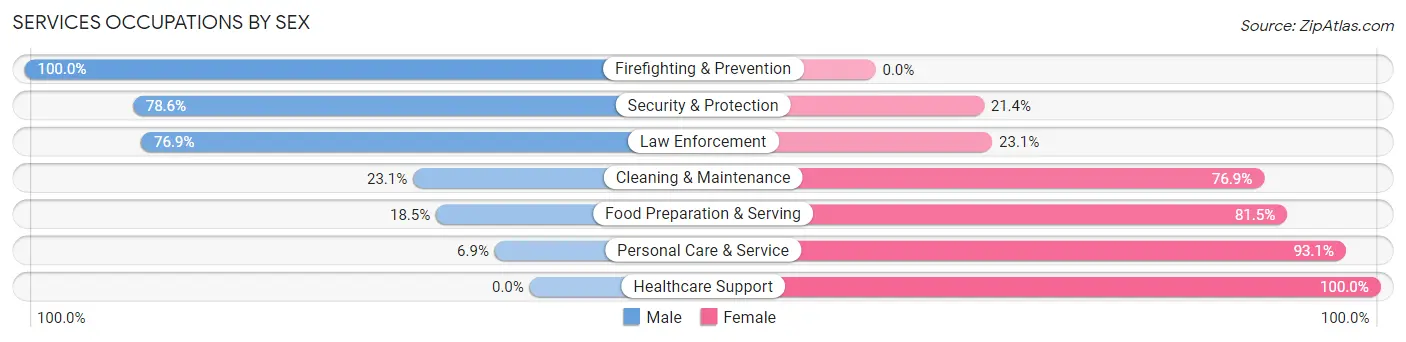
Services Occupations by Sex
Within the Services occupations in Elizabeth, the most male-oriented occupations are Firefighting & Prevention (100.0%), Security & Protection (78.6%), and Law Enforcement (76.9%), while the most female-oriented occupations are Healthcare Support (100.0%), Personal Care & Service (93.1%), and Food Preparation & Serving (81.5%).
| Occupation | Male | Female |
| Healthcare Support | 0 (0.0%) | 11 (100.0%) |
| Security & Protection | 11 (78.6%) | 3 (21.4%) |
| Firefighting & Prevention | 1 (100.0%) | 0 (0.0%) |
| Law Enforcement | 10 (76.9%) | 3 (23.1%) |
| Food Preparation & Serving | 5 (18.5%) | 22 (81.5%) |
| Cleaning & Maintenance | 3 (23.1%) | 10 (76.9%) |
| Personal Care & Service | 2 (6.9%) | 27 (93.1%) |
| Total (Category) | 21 (22.3%) | 73 (77.7%) |
| Total (Overall) | 221 (52.7%) | 198 (47.3%) |
Sales and Office Occupations
The most common Sales and Office occupations in Elizabeth are Sales & Related (35 | 8.4%), and Office & Administration (35 | 8.4%).
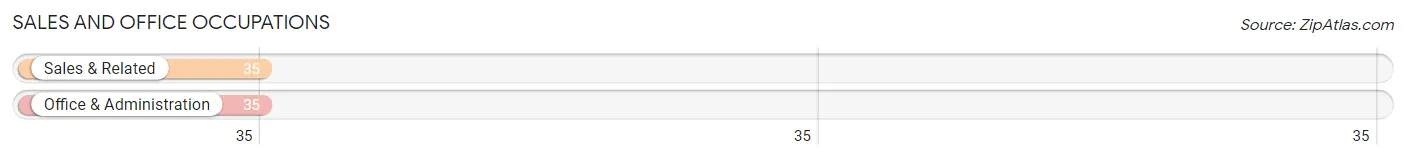
Sales and Office Occupations by Sex
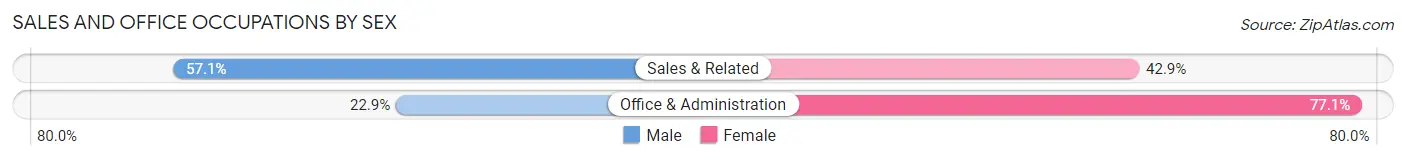
| Occupation | Male | Female |
| Sales & Related | 20 (57.1%) | 15 (42.9%) |
| Office & Administration | 8 (22.9%) | 27 (77.1%) |
| Total (Category) | 28 (40.0%) | 42 (60.0%) |
| Total (Overall) | 221 (52.7%) | 198 (47.3%) |
Natural Resources, Construction and Maintenance Occupations
The most common Natural Resources, Construction and Maintenance occupations in Elizabeth are Construction & Extraction (29 | 6.9%), Installation, Maintenance & Repair (15 | 3.6%), and Farming, Fishing & Forestry (2 | 0.5%).
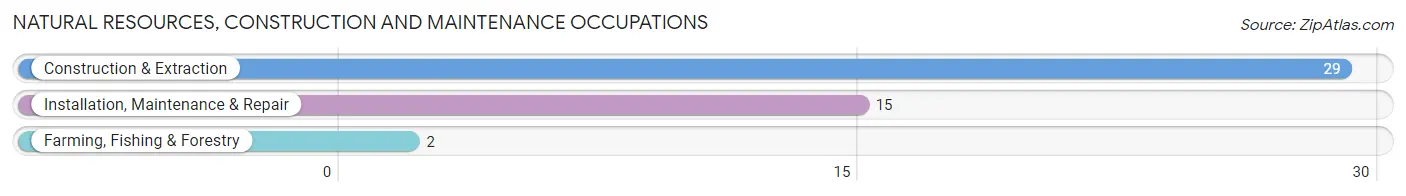
Natural Resources, Construction and Maintenance Occupations by Sex
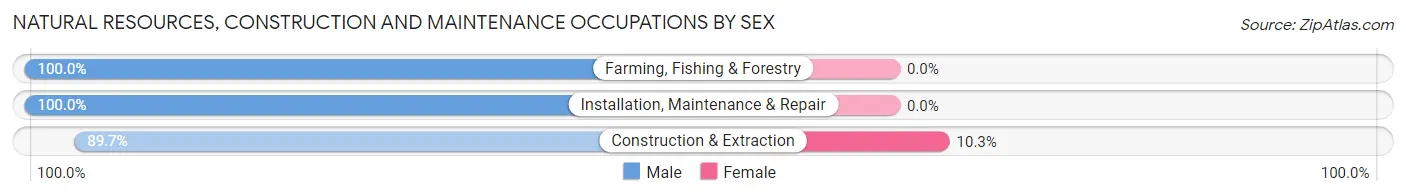
| Occupation | Male | Female |
| Farming, Fishing & Forestry | 2 (100.0%) | 0 (0.0%) |
| Construction & Extraction | 26 (89.7%) | 3 (10.3%) |
| Installation, Maintenance & Repair | 15 (100.0%) | 0 (0.0%) |
| Total (Category) | 43 (93.5%) | 3 (6.5%) |
| Total (Overall) | 221 (52.7%) | 198 (47.3%) |
Production, Transportation and Moving Occupations
The most common Production, Transportation and Moving occupations in Elizabeth are Transportation (30 | 7.2%), Production (20 | 4.8%), and Material Moving (18 | 4.3%).
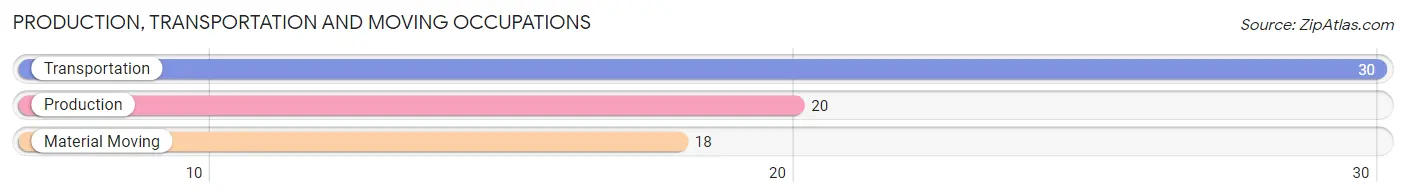
Production, Transportation and Moving Occupations by Sex
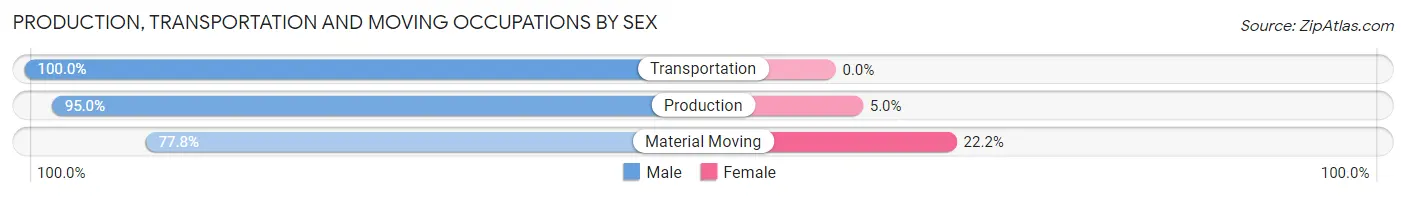
| Occupation | Male | Female |
| Production | 19 (95.0%) | 1 (5.0%) |
| Transportation | 30 (100.0%) | 0 (0.0%) |
| Material Moving | 14 (77.8%) | 4 (22.2%) |
| Total (Category) | 63 (92.6%) | 5 (7.3%) |
| Total (Overall) | 221 (52.7%) | 198 (47.3%) |
Employment Industries by Sex in Elizabeth
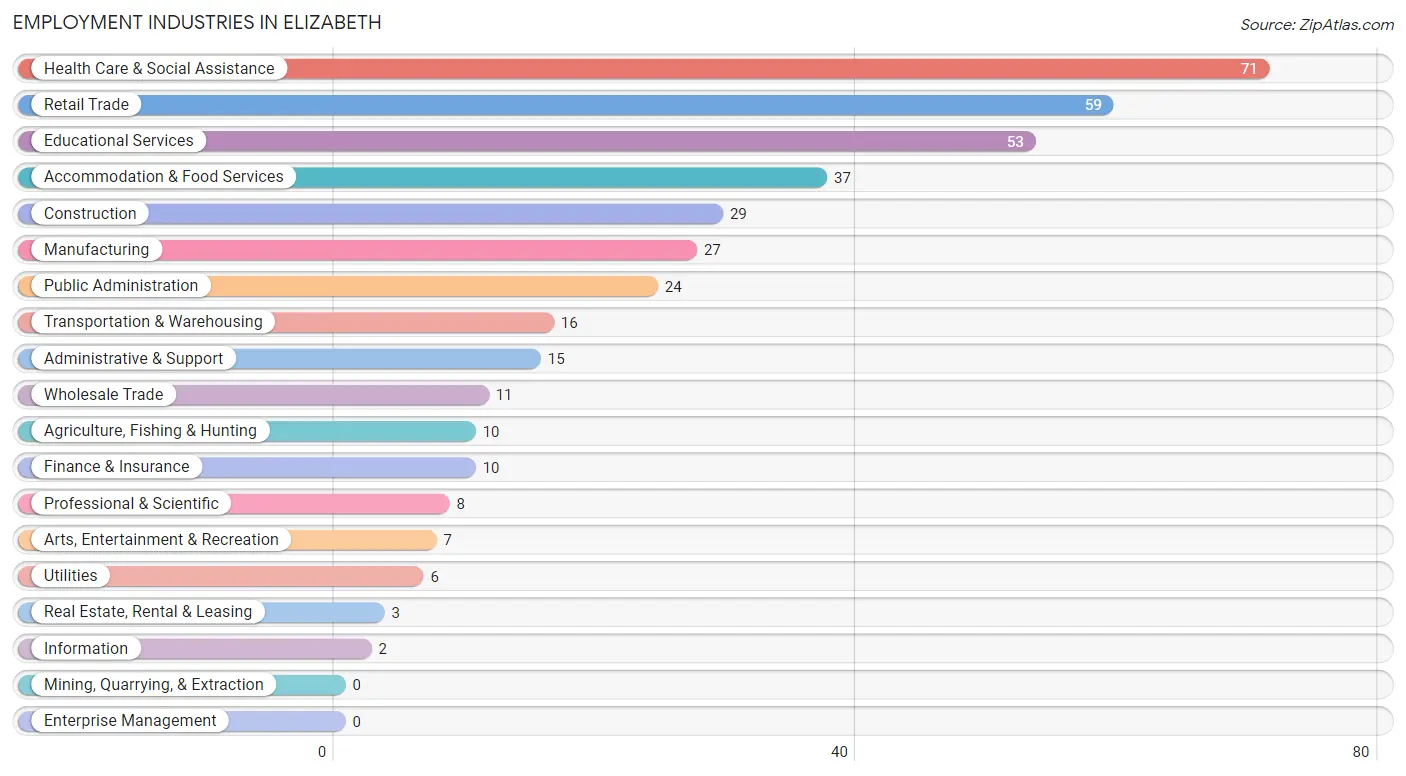
Employment Industries in Elizabeth
The major employment industries in Elizabeth include Health Care & Social Assistance (71 | 17.0%), Retail Trade (59 | 14.1%), Educational Services (53 | 12.7%), Accommodation & Food Services (37 | 8.8%), and Construction (29 | 6.9%).
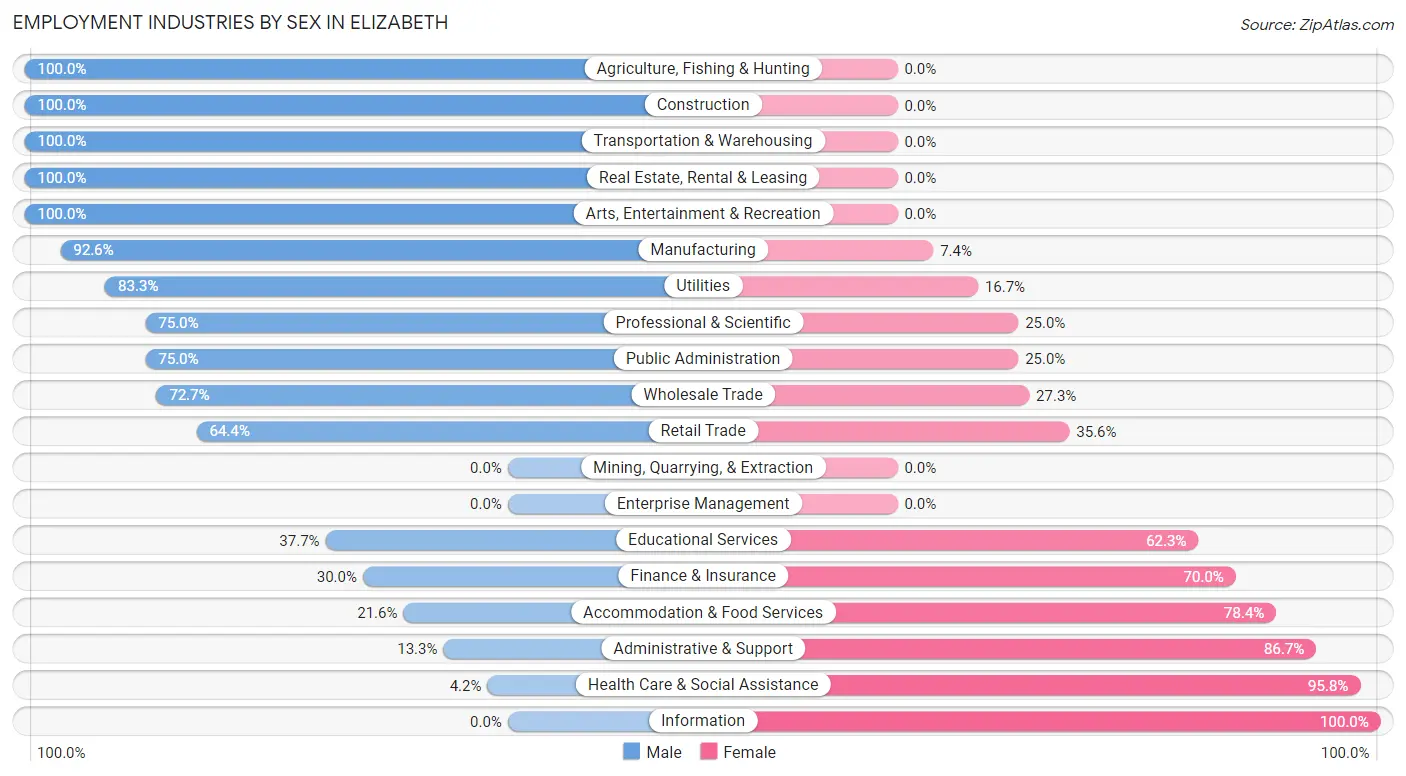
Employment Industries by Sex in Elizabeth
The Elizabeth industries that see more men than women are Agriculture, Fishing & Hunting (100.0%), Construction (100.0%), and Transportation & Warehousing (100.0%), whereas the industries that tend to have a higher number of women are Information (100.0%), Health Care & Social Assistance (95.8%), and Administrative & Support (86.7%).
| Industry | Male | Female |
| Agriculture, Fishing & Hunting | 10 (100.0%) | 0 (0.0%) |
| Mining, Quarrying, & Extraction | 0 (0.0%) | 0 (0.0%) |
| Construction | 29 (100.0%) | 0 (0.0%) |
| Manufacturing | 25 (92.6%) | 2 (7.4%) |
| Wholesale Trade | 8 (72.7%) | 3 (27.3%) |
| Retail Trade | 38 (64.4%) | 21 (35.6%) |
| Transportation & Warehousing | 16 (100.0%) | 0 (0.0%) |
| Utilities | 5 (83.3%) | 1 (16.7%) |
| Information | 0 (0.0%) | 2 (100.0%) |
| Finance & Insurance | 3 (30.0%) | 7 (70.0%) |
| Real Estate, Rental & Leasing | 3 (100.0%) | 0 (0.0%) |
| Professional & Scientific | 6 (75.0%) | 2 (25.0%) |
| Enterprise Management | 0 (0.0%) | 0 (0.0%) |
| Administrative & Support | 2 (13.3%) | 13 (86.7%) |
| Educational Services | 20 (37.7%) | 33 (62.3%) |
| Health Care & Social Assistance | 3 (4.2%) | 68 (95.8%) |
| Arts, Entertainment & Recreation | 7 (100.0%) | 0 (0.0%) |
| Accommodation & Food Services | 8 (21.6%) | 29 (78.4%) |
| Public Administration | 18 (75.0%) | 6 (25.0%) |
| Total | 221 (52.7%) | 198 (47.3%) |
Education in Elizabeth
School Enrollment in Elizabeth
The most common levels of schooling among the 140 students in Elizabeth are middle school (37 | 26.4%), high school (37 | 26.4%), and elementary school (30 | 21.4%).
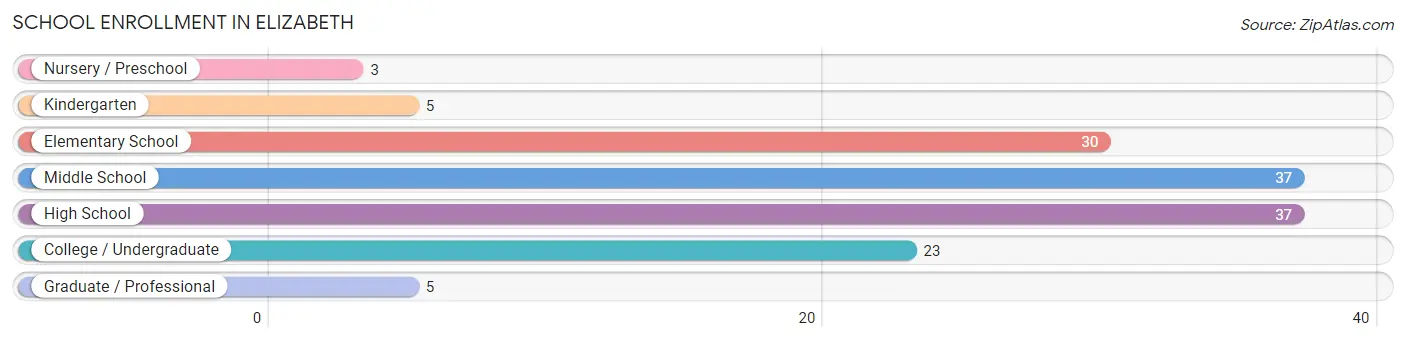
| School Level | # Students | % Students |
| Nursery / Preschool | 3 | 2.1% |
| Kindergarten | 5 | 3.6% |
| Elementary School | 30 | 21.4% |
| Middle School | 37 | 26.4% |
| High School | 37 | 26.4% |
| College / Undergraduate | 23 | 16.4% |
| Graduate / Professional | 5 | 3.6% |
| Total | 140 | 100.0% |
School Enrollment by Age by Funding Source in Elizabeth
Out of a total of 140 students who are enrolled in schools in Elizabeth, 16 (11.4%) attend a private institution, while the remaining 124 (88.6%) are enrolled in public schools. The age group of 3 to 4 year olds has the highest likelihood of being enrolled in private schools, with 2 (66.7% in the age bracket) enrolled. Conversely, the age group of 18 to 19 year olds has the lowest likelihood of being enrolled in a private school, with 5 (100.0% in the age bracket) attending a public institution.
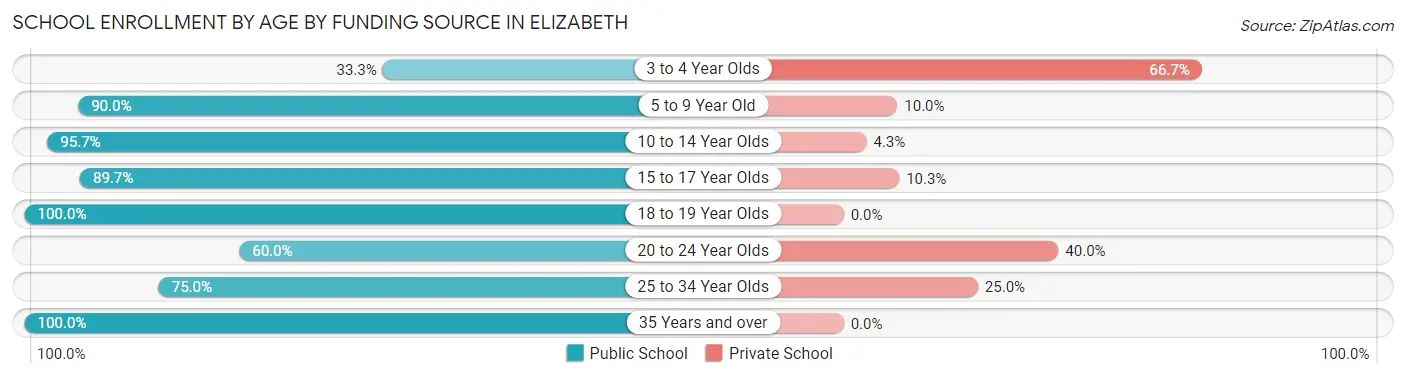
| Age Bracket | Public School | Private School |
| 3 to 4 Year Olds | 1 (33.3%) | 2 (66.7%) |
| 5 to 9 Year Old | 27 (90.0%) | 3 (10.0%) |
| 10 to 14 Year Olds | 45 (95.7%) | 2 (4.3%) |
| 15 to 17 Year Olds | 26 (89.7%) | 3 (10.3%) |
| 18 to 19 Year Olds | 5 (100.0%) | 0 (0.0%) |
| 20 to 24 Year Olds | 6 (60.0%) | 4 (40.0%) |
| 25 to 34 Year Olds | 6 (75.0%) | 2 (25.0%) |
| 35 Years and over | 8 (100.0%) | 0 (0.0%) |
| Total | 124 (88.6%) | 16 (11.4%) |
Educational Attainment by Field of Study in Elizabeth
Education (51 | 33.3%), business (23 | 15.0%), science & technology (17 | 11.1%), arts & humanities (15 | 9.8%), and bio, nature & agricultural (13 | 8.5%) are the most common fields of study among 153 individuals in Elizabeth who have obtained a bachelor's degree or higher.
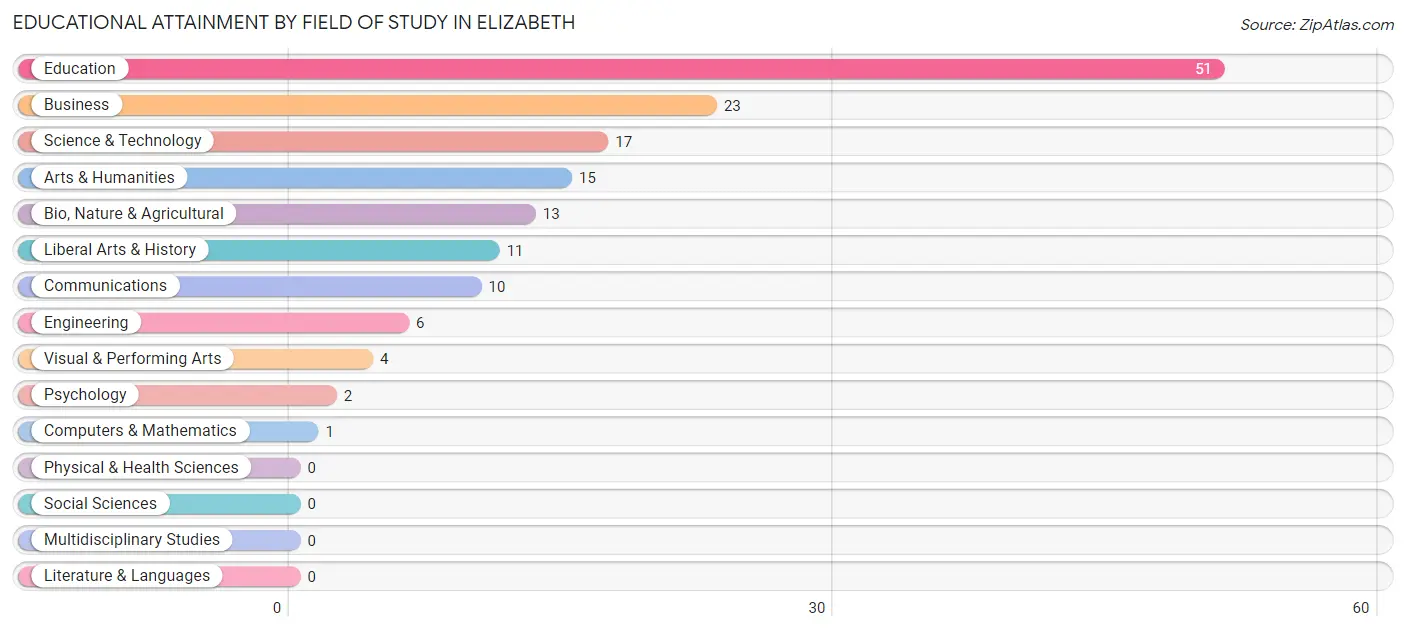
| Field of Study | # Graduates | % Graduates |
| Computers & Mathematics | 1 | 0.6% |
| Bio, Nature & Agricultural | 13 | 8.5% |
| Physical & Health Sciences | 0 | 0.0% |
| Psychology | 2 | 1.3% |
| Social Sciences | 0 | 0.0% |
| Engineering | 6 | 3.9% |
| Multidisciplinary Studies | 0 | 0.0% |
| Science & Technology | 17 | 11.1% |
| Business | 23 | 15.0% |
| Education | 51 | 33.3% |
| Literature & Languages | 0 | 0.0% |
| Liberal Arts & History | 11 | 7.2% |
| Visual & Performing Arts | 4 | 2.6% |
| Communications | 10 | 6.5% |
| Arts & Humanities | 15 | 9.8% |
| Total | 153 | 100.0% |
Transportation & Commute in Elizabeth
Vehicle Availability by Sex in Elizabeth
The most prevalent vehicle ownership categories in Elizabeth are males with 2 vehicles (99, accounting for 45.6%) and females with 2 vehicles (84, making up 50.8%).
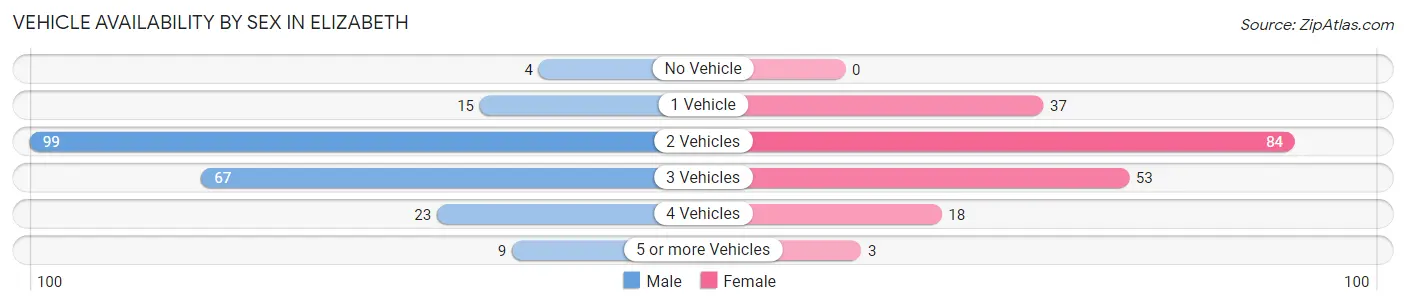
| Vehicles Available | Male | Female |
| No Vehicle | 4 (1.8%) | 0 (0.0%) |
| 1 Vehicle | 15 (6.9%) | 37 (19.0%) |
| 2 Vehicles | 99 (45.6%) | 84 (43.1%) |
| 3 Vehicles | 67 (30.9%) | 53 (27.2%) |
| 4 Vehicles | 23 (10.6%) | 18 (9.2%) |
| 5 or more Vehicles | 9 (4.2%) | 3 (1.5%) |
| Total | 217 (100.0%) | 195 (100.0%) |
Commute Time in Elizabeth
The most frequently occuring commute durations in Elizabeth are less than 5 minutes (94 commuters, 25.2%), 20 to 24 minutes (67 commuters, 18.0%), and 45 to 59 minutes (35 commuters, 9.4%).
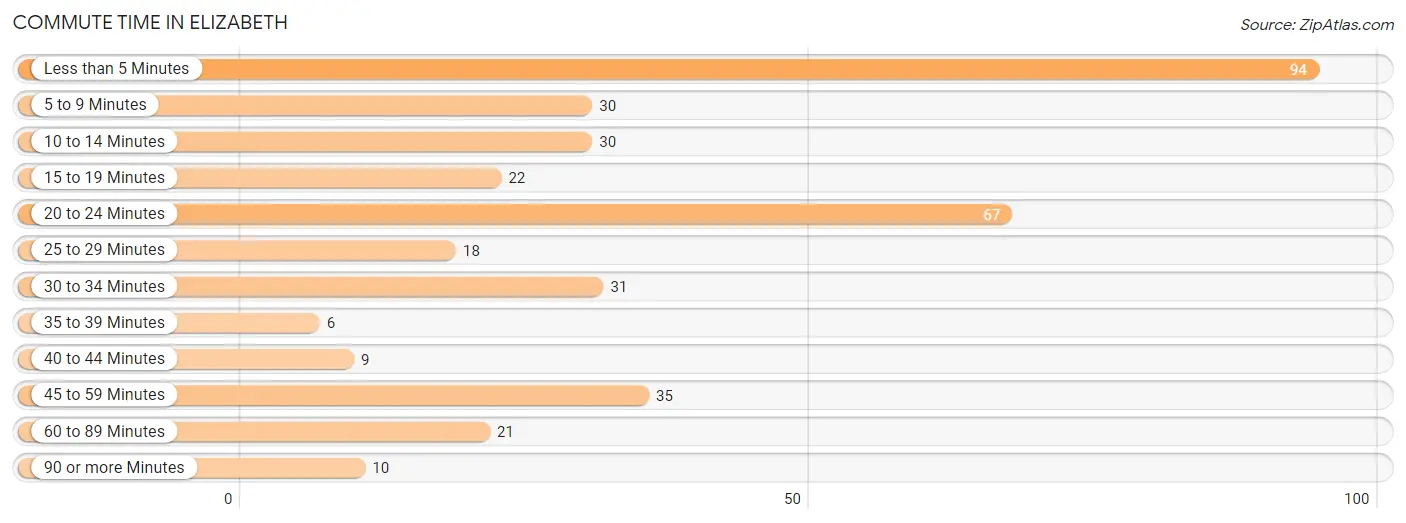
| Commute Time | # Commuters | % Commuters |
| Less than 5 Minutes | 94 | 25.2% |
| 5 to 9 Minutes | 30 | 8.0% |
| 10 to 14 Minutes | 30 | 8.0% |
| 15 to 19 Minutes | 22 | 5.9% |
| 20 to 24 Minutes | 67 | 18.0% |
| 25 to 29 Minutes | 18 | 4.8% |
| 30 to 34 Minutes | 31 | 8.3% |
| 35 to 39 Minutes | 6 | 1.6% |
| 40 to 44 Minutes | 9 | 2.4% |
| 45 to 59 Minutes | 35 | 9.4% |
| 60 to 89 Minutes | 21 | 5.6% |
| 90 or more Minutes | 10 | 2.7% |
Commute Time by Sex in Elizabeth
The most common commute times in Elizabeth are less than 5 minutes (54 commuters, 27.7%) for males and 20 to 24 minutes (44 commuters, 24.7%) for females.
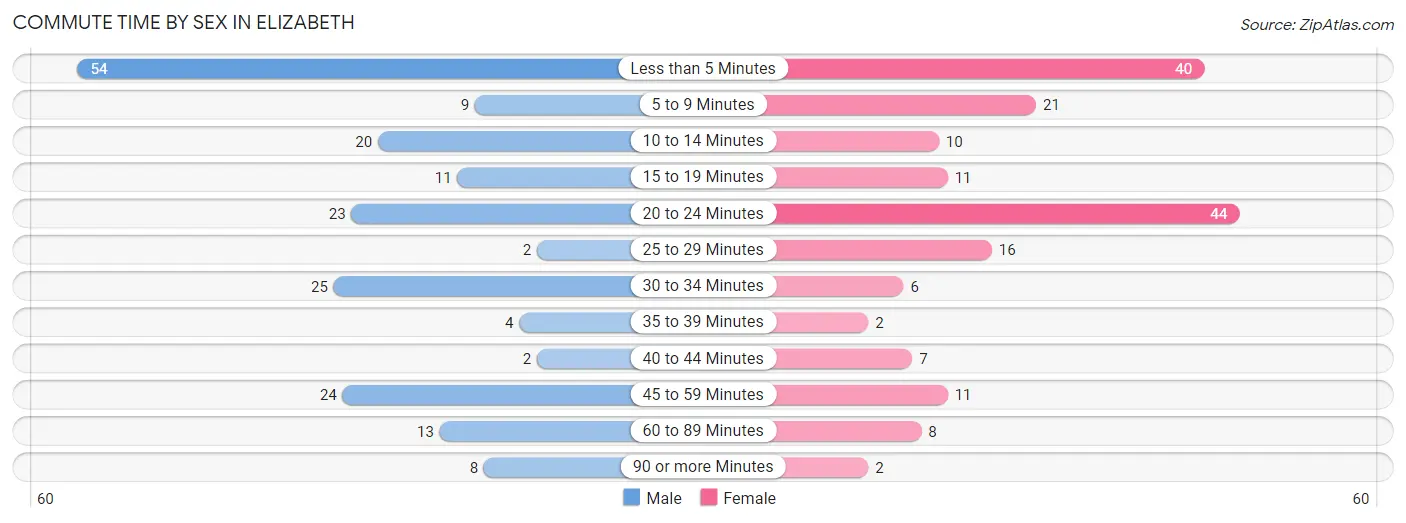
| Commute Time | Male | Female |
| Less than 5 Minutes | 54 (27.7%) | 40 (22.5%) |
| 5 to 9 Minutes | 9 (4.6%) | 21 (11.8%) |
| 10 to 14 Minutes | 20 (10.3%) | 10 (5.6%) |
| 15 to 19 Minutes | 11 (5.6%) | 11 (6.2%) |
| 20 to 24 Minutes | 23 (11.8%) | 44 (24.7%) |
| 25 to 29 Minutes | 2 (1.0%) | 16 (9.0%) |
| 30 to 34 Minutes | 25 (12.8%) | 6 (3.4%) |
| 35 to 39 Minutes | 4 (2.1%) | 2 (1.1%) |
| 40 to 44 Minutes | 2 (1.0%) | 7 (3.9%) |
| 45 to 59 Minutes | 24 (12.3%) | 11 (6.2%) |
| 60 to 89 Minutes | 13 (6.7%) | 8 (4.5%) |
| 90 or more Minutes | 8 (4.1%) | 2 (1.1%) |
Time of Departure to Work by Sex in Elizabeth
The most frequent times of departure to work in Elizabeth are 7:00 AM to 7:29 AM (36, 18.5%) for males and 7:30 AM to 7:59 AM (37, 20.8%) for females.
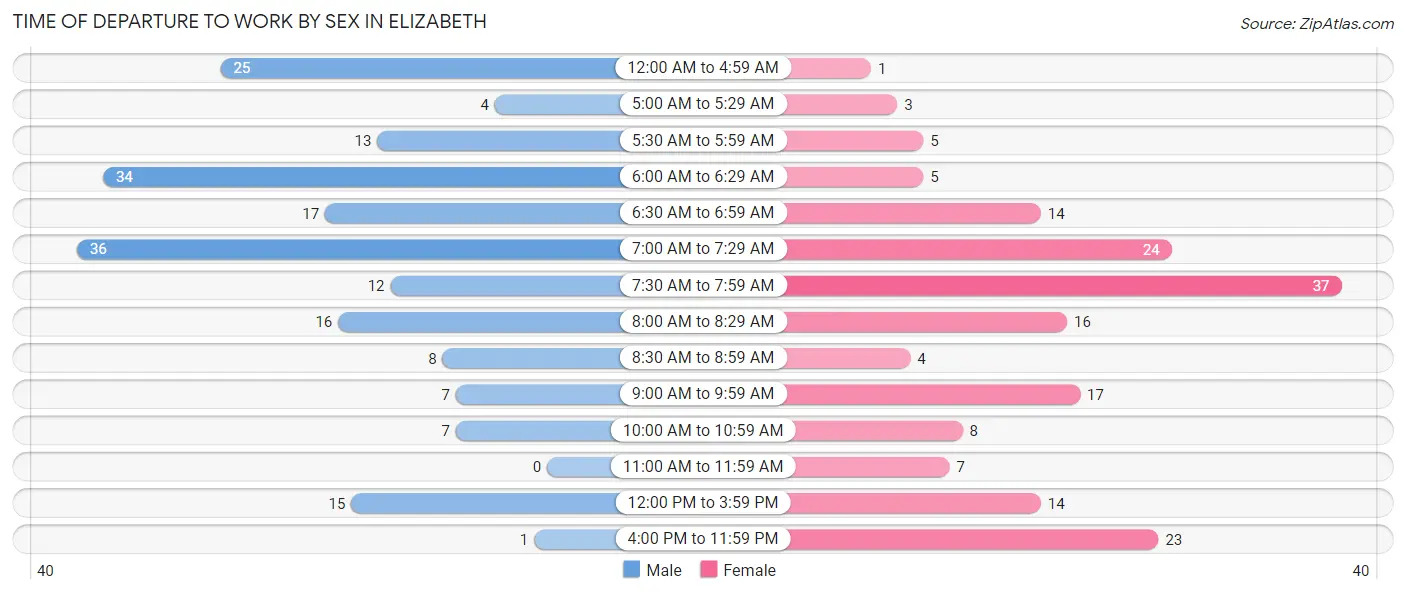
| Time of Departure | Male | Female |
| 12:00 AM to 4:59 AM | 25 (12.8%) | 1 (0.6%) |
| 5:00 AM to 5:29 AM | 4 (2.1%) | 3 (1.7%) |
| 5:30 AM to 5:59 AM | 13 (6.7%) | 5 (2.8%) |
| 6:00 AM to 6:29 AM | 34 (17.4%) | 5 (2.8%) |
| 6:30 AM to 6:59 AM | 17 (8.7%) | 14 (7.9%) |
| 7:00 AM to 7:29 AM | 36 (18.5%) | 24 (13.5%) |
| 7:30 AM to 7:59 AM | 12 (6.1%) | 37 (20.8%) |
| 8:00 AM to 8:29 AM | 16 (8.2%) | 16 (9.0%) |
| 8:30 AM to 8:59 AM | 8 (4.1%) | 4 (2.2%) |
| 9:00 AM to 9:59 AM | 7 (3.6%) | 17 (9.6%) |
| 10:00 AM to 10:59 AM | 7 (3.6%) | 8 (4.5%) |
| 11:00 AM to 11:59 AM | 0 (0.0%) | 7 (3.9%) |
| 12:00 PM to 3:59 PM | 15 (7.7%) | 14 (7.9%) |
| 4:00 PM to 11:59 PM | 1 (0.5%) | 23 (12.9%) |
| Total | 195 (100.0%) | 178 (100.0%) |
Housing Occupancy in Elizabeth
Occupancy by Ownership in Elizabeth
Of the total 402 dwellings in Elizabeth, owner-occupied units account for 280 (69.7%), while renter-occupied units make up 122 (30.3%).
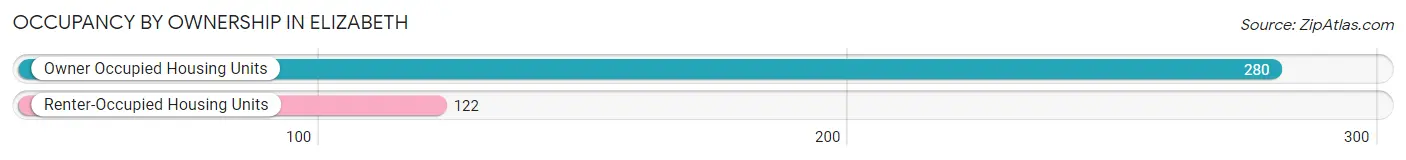
| Occupancy | # Housing Units | % Housing Units |
| Owner Occupied Housing Units | 280 | 69.7% |
| Renter-Occupied Housing Units | 122 | 30.3% |
| Total Occupied Housing Units | 402 | 100.0% |
Occupancy by Household Size in Elizabeth
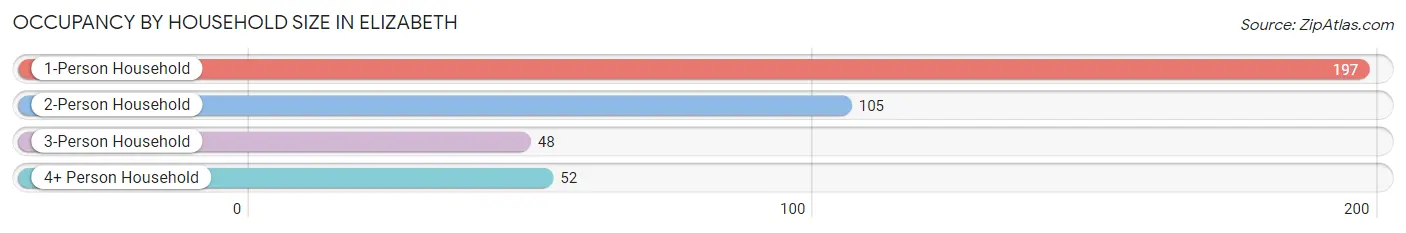
| Household Size | # Housing Units | % Housing Units |
| 1-Person Household | 197 | 49.0% |
| 2-Person Household | 105 | 26.1% |
| 3-Person Household | 48 | 11.9% |
| 4+ Person Household | 52 | 12.9% |
| Total Housing Units | 402 | 100.0% |
Occupancy by Ownership by Household Size in Elizabeth
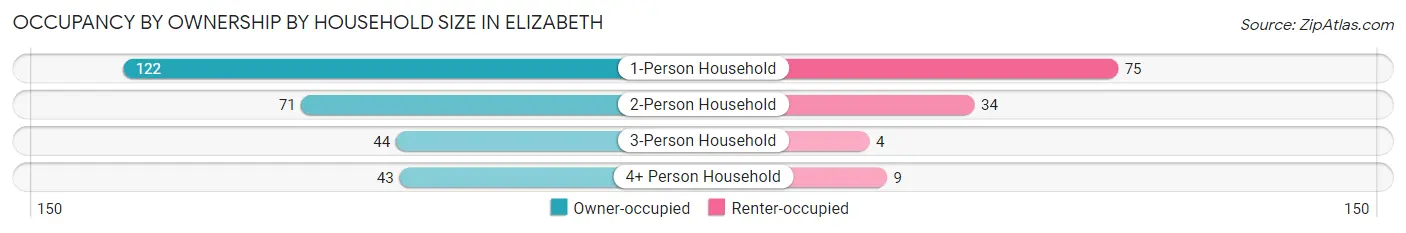
| Household Size | Owner-occupied | Renter-occupied |
| 1-Person Household | 122 (61.9%) | 75 (38.1%) |
| 2-Person Household | 71 (67.6%) | 34 (32.4%) |
| 3-Person Household | 44 (91.7%) | 4 (8.3%) |
| 4+ Person Household | 43 (82.7%) | 9 (17.3%) |
| Total Housing Units | 280 (69.7%) | 122 (30.3%) |
Occupancy by Educational Attainment in Elizabeth
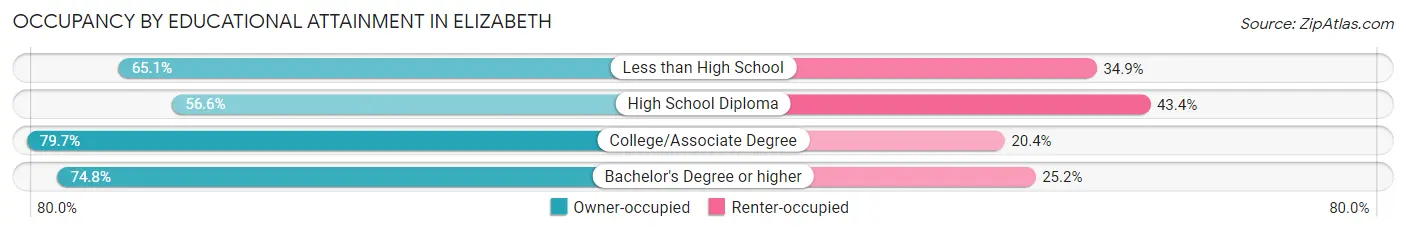
| Household Size | Owner-occupied | Renter-occupied |
| Less than High School | 54 (65.1%) | 29 (34.9%) |
| High School Diploma | 56 (56.6%) | 43 (43.4%) |
| College/Associate Degree | 90 (79.6%) | 23 (20.3%) |
| Bachelor's Degree or higher | 80 (74.8%) | 27 (25.2%) |
Occupancy by Age of Householder in Elizabeth
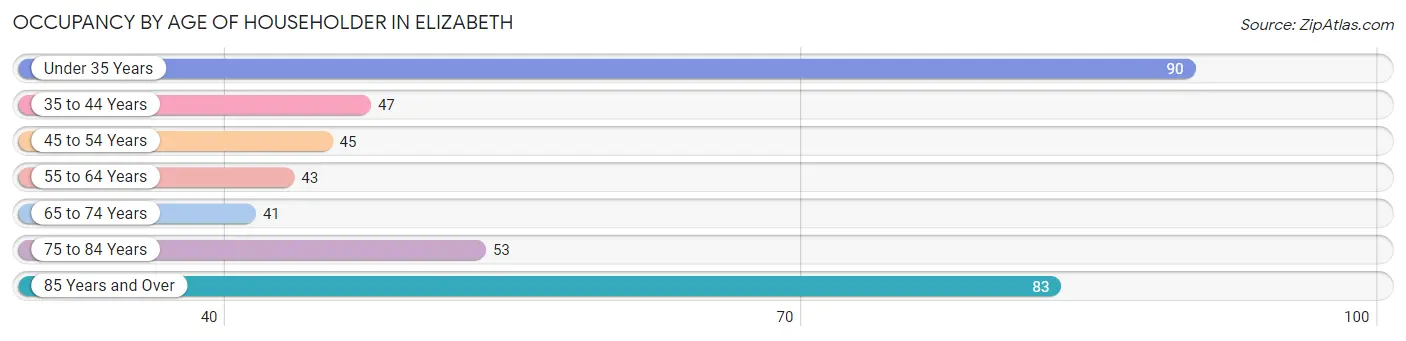
| Age Bracket | # Households | % Households |
| Under 35 Years | 90 | 22.4% |
| 35 to 44 Years | 47 | 11.7% |
| 45 to 54 Years | 45 | 11.2% |
| 55 to 64 Years | 43 | 10.7% |
| 65 to 74 Years | 41 | 10.2% |
| 75 to 84 Years | 53 | 13.2% |
| 85 Years and Over | 83 | 20.6% |
| Total | 402 | 100.0% |
Housing Finances in Elizabeth
Median Income by Occupancy in Elizabeth
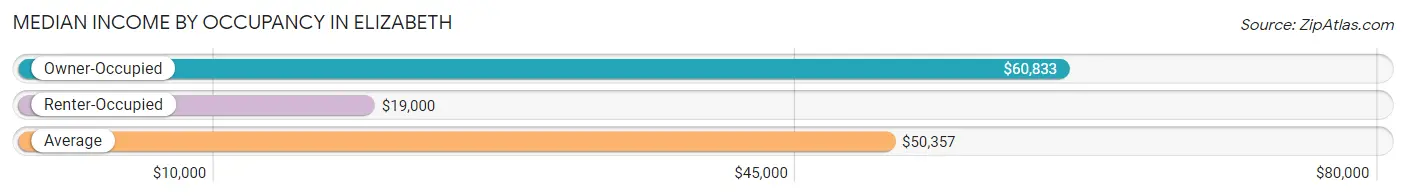
| Occupancy Type | # Households | Median Income |
| Owner-Occupied | 280 (69.7%) | $60,833 |
| Renter-Occupied | 122 (30.3%) | $19,000 |
| Average | 402 (100.0%) | $50,357 |
Occupancy by Householder Income Bracket in Elizabeth
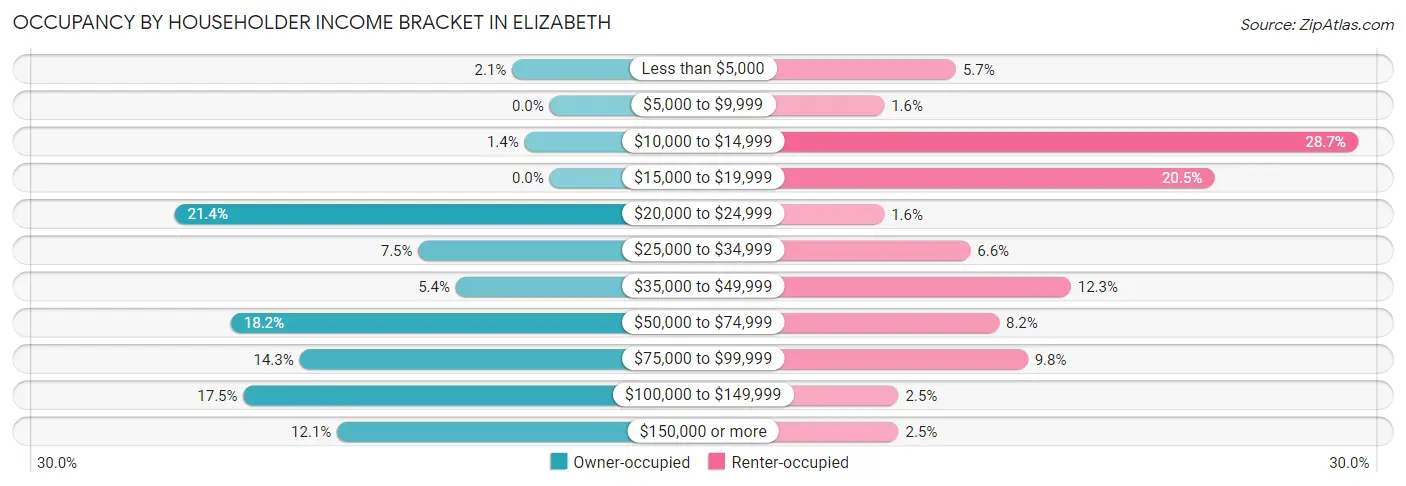
| Income Bracket | Owner-occupied | Renter-occupied |
| Less than $5,000 | 6 (2.1%) | 7 (5.7%) |
| $5,000 to $9,999 | 0 (0.0%) | 2 (1.6%) |
| $10,000 to $14,999 | 4 (1.4%) | 35 (28.7%) |
| $15,000 to $19,999 | 0 (0.0%) | 25 (20.5%) |
| $20,000 to $24,999 | 60 (21.4%) | 2 (1.6%) |
| $25,000 to $34,999 | 21 (7.5%) | 8 (6.6%) |
| $35,000 to $49,999 | 15 (5.4%) | 15 (12.3%) |
| $50,000 to $74,999 | 51 (18.2%) | 10 (8.2%) |
| $75,000 to $99,999 | 40 (14.3%) | 12 (9.8%) |
| $100,000 to $149,999 | 49 (17.5%) | 3 (2.5%) |
| $150,000 or more | 34 (12.1%) | 3 (2.5%) |
| Total | 280 (100.0%) | 122 (100.0%) |
Monthly Housing Cost Tiers in Elizabeth
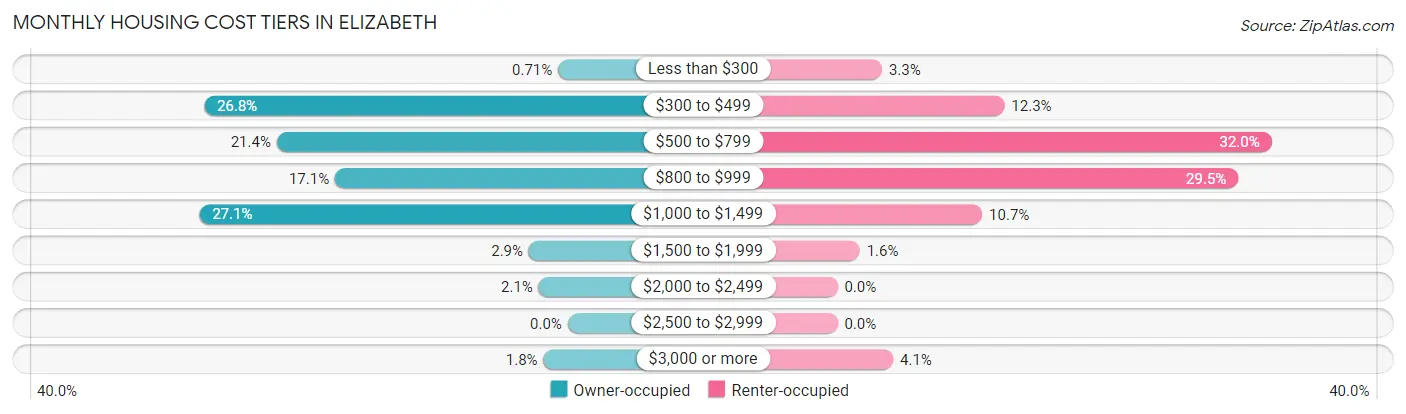
| Monthly Cost | Owner-occupied | Renter-occupied |
| Less than $300 | 2 (0.7%) | 4 (3.3%) |
| $300 to $499 | 75 (26.8%) | 15 (12.3%) |
| $500 to $799 | 60 (21.4%) | 39 (32.0%) |
| $800 to $999 | 48 (17.1%) | 36 (29.5%) |
| $1,000 to $1,499 | 76 (27.1%) | 13 (10.7%) |
| $1,500 to $1,999 | 8 (2.9%) | 2 (1.6%) |
| $2,000 to $2,499 | 6 (2.1%) | 0 (0.0%) |
| $2,500 to $2,999 | 0 (0.0%) | 0 (0.0%) |
| $3,000 or more | 5 (1.8%) | 5 (4.1%) |
| Total | 280 (100.0%) | 122 (100.0%) |
Physical Housing Characteristics in Elizabeth
Housing Structures in Elizabeth
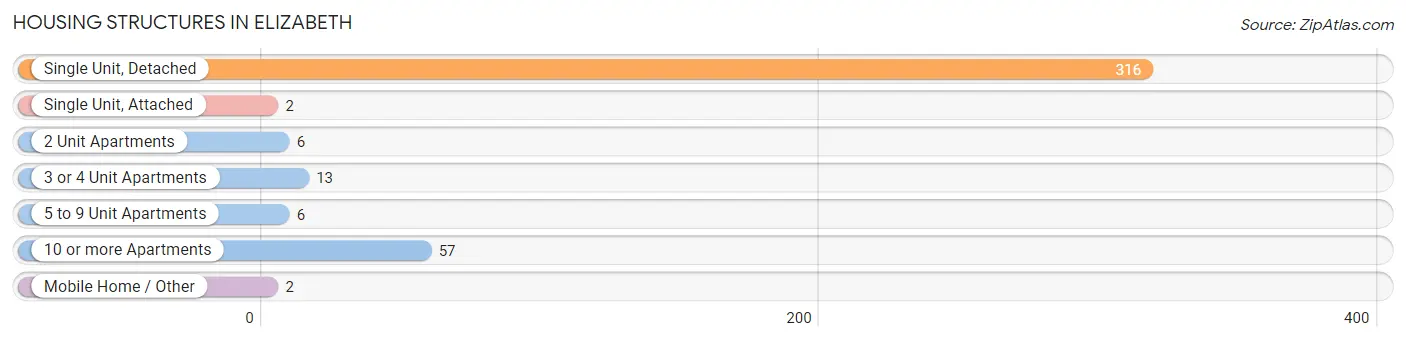
| Structure Type | # Housing Units | % Housing Units |
| Single Unit, Detached | 316 | 78.6% |
| Single Unit, Attached | 2 | 0.5% |
| 2 Unit Apartments | 6 | 1.5% |
| 3 or 4 Unit Apartments | 13 | 3.2% |
| 5 to 9 Unit Apartments | 6 | 1.5% |
| 10 or more Apartments | 57 | 14.2% |
| Mobile Home / Other | 2 | 0.5% |
| Total | 402 | 100.0% |
Housing Structures by Occupancy in Elizabeth
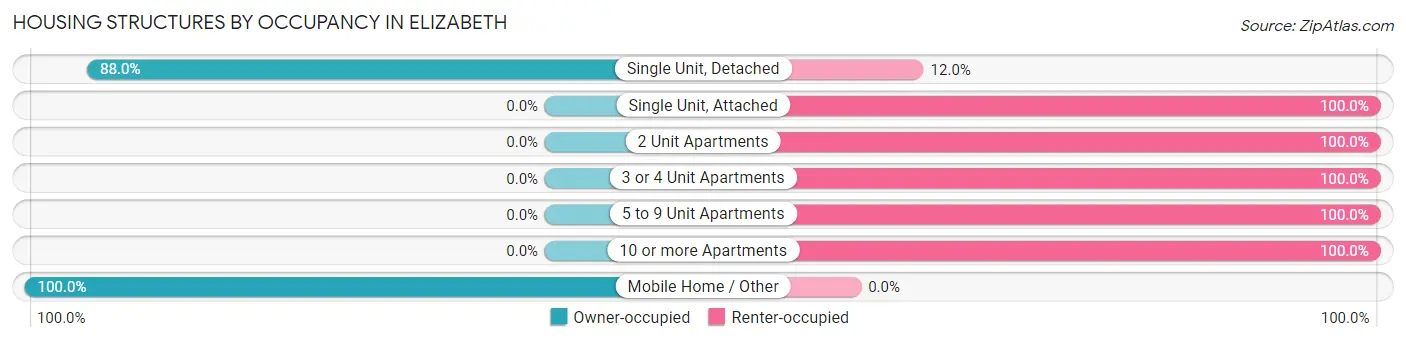
| Structure Type | Owner-occupied | Renter-occupied |
| Single Unit, Detached | 278 (88.0%) | 38 (12.0%) |
| Single Unit, Attached | 0 (0.0%) | 2 (100.0%) |
| 2 Unit Apartments | 0 (0.0%) | 6 (100.0%) |
| 3 or 4 Unit Apartments | 0 (0.0%) | 13 (100.0%) |
| 5 to 9 Unit Apartments | 0 (0.0%) | 6 (100.0%) |
| 10 or more Apartments | 0 (0.0%) | 57 (100.0%) |
| Mobile Home / Other | 2 (100.0%) | 0 (0.0%) |
| Total | 280 (69.7%) | 122 (30.3%) |
Housing Structures by Number of Rooms in Elizabeth
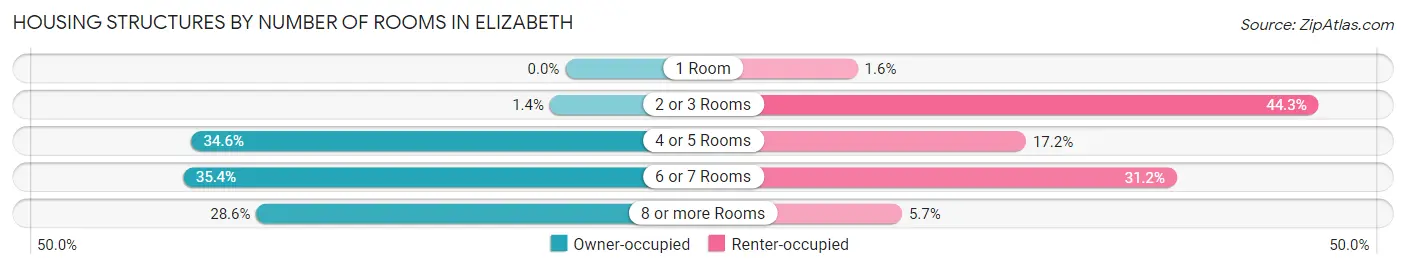
| Number of Rooms | Owner-occupied | Renter-occupied |
| 1 Room | 0 (0.0%) | 2 (1.6%) |
| 2 or 3 Rooms | 4 (1.4%) | 54 (44.3%) |
| 4 or 5 Rooms | 97 (34.6%) | 21 (17.2%) |
| 6 or 7 Rooms | 99 (35.4%) | 38 (31.1%) |
| 8 or more Rooms | 80 (28.6%) | 7 (5.7%) |
| Total | 280 (100.0%) | 122 (100.0%) |
Housing Structure by Heating Type in Elizabeth
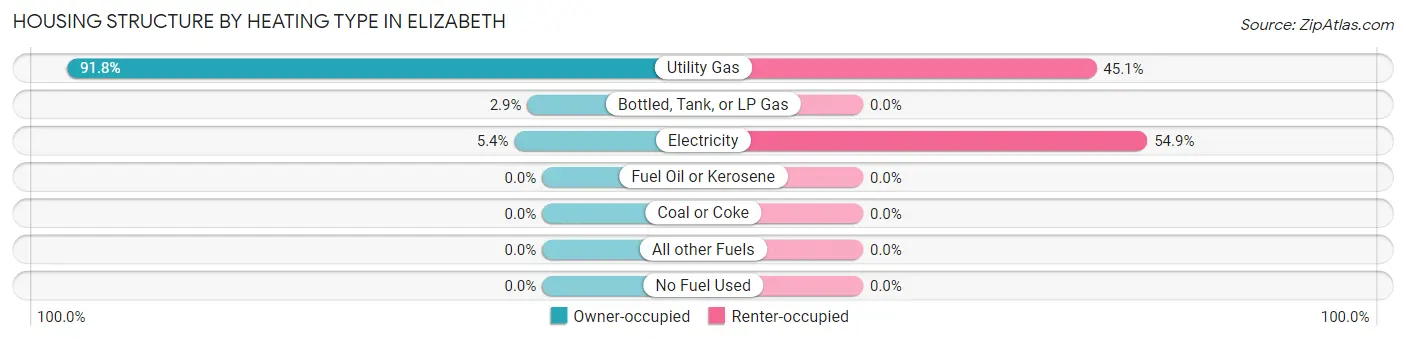
| Heating Type | Owner-occupied | Renter-occupied |
| Utility Gas | 257 (91.8%) | 55 (45.1%) |
| Bottled, Tank, or LP Gas | 8 (2.9%) | 0 (0.0%) |
| Electricity | 15 (5.4%) | 67 (54.9%) |
| Fuel Oil or Kerosene | 0 (0.0%) | 0 (0.0%) |
| Coal or Coke | 0 (0.0%) | 0 (0.0%) |
| All other Fuels | 0 (0.0%) | 0 (0.0%) |
| No Fuel Used | 0 (0.0%) | 0 (0.0%) |
| Total | 280 (100.0%) | 122 (100.0%) |
Household Vehicle Usage in Elizabeth
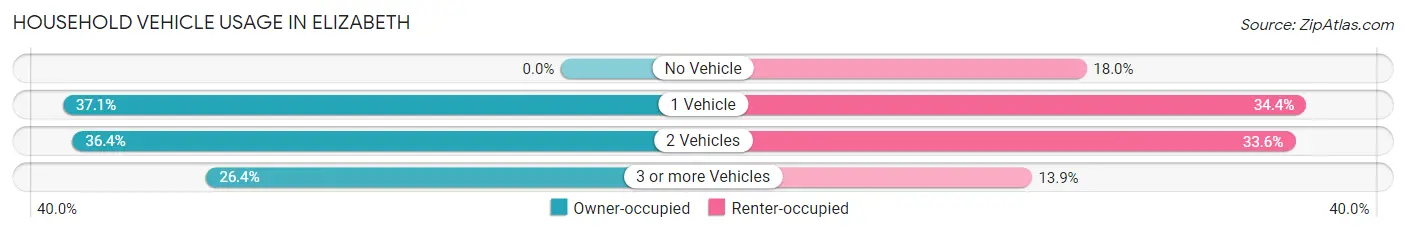
| Vehicles per Household | Owner-occupied | Renter-occupied |
| No Vehicle | 0 (0.0%) | 22 (18.0%) |
| 1 Vehicle | 104 (37.1%) | 42 (34.4%) |
| 2 Vehicles | 102 (36.4%) | 41 (33.6%) |
| 3 or more Vehicles | 74 (26.4%) | 17 (13.9%) |
| Total | 280 (100.0%) | 122 (100.0%) |
Real Estate & Mortgages in Elizabeth
Real Estate and Mortgage Overview in Elizabeth
| Characteristic | Without Mortgage | With Mortgage |
| Housing Units | 128 | 152 |
| Median Property Value | $97,000 | $123,200 |
| Median Household Income | - | - |
| Monthly Housing Costs | $461 | $5 |
| Real Estate Taxes | $1,865 | $2 |
Property Value by Mortgage Status in Elizabeth
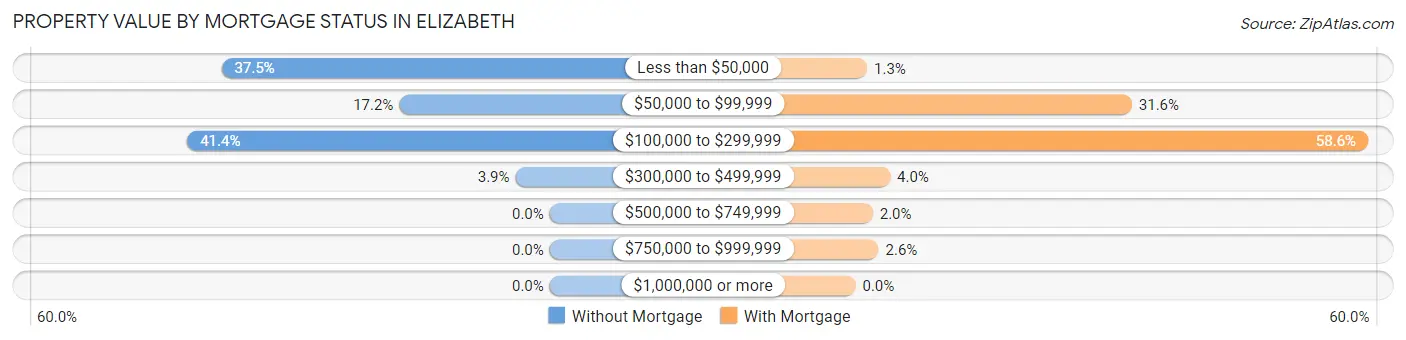
| Property Value | Without Mortgage | With Mortgage |
| Less than $50,000 | 48 (37.5%) | 2 (1.3%) |
| $50,000 to $99,999 | 22 (17.2%) | 48 (31.6%) |
| $100,000 to $299,999 | 53 (41.4%) | 89 (58.6%) |
| $300,000 to $499,999 | 5 (3.9%) | 6 (4.0%) |
| $500,000 to $749,999 | 0 (0.0%) | 3 (2.0%) |
| $750,000 to $999,999 | 0 (0.0%) | 4 (2.6%) |
| $1,000,000 or more | 0 (0.0%) | 0 (0.0%) |
| Total | 128 (100.0%) | 152 (100.0%) |
Household Income by Mortgage Status in Elizabeth
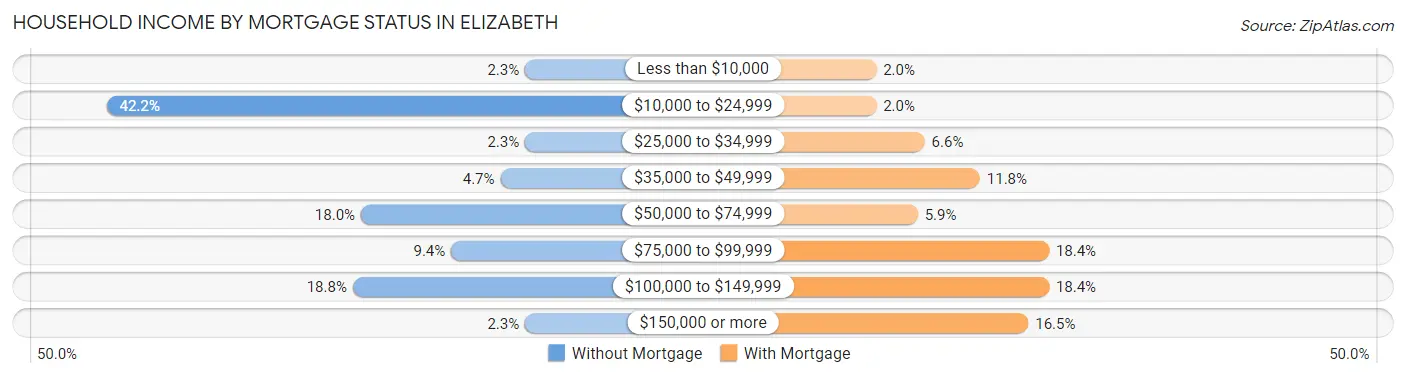
| Household Income | Without Mortgage | With Mortgage |
| Less than $10,000 | 3 (2.3%) | 3 (2.0%) |
| $10,000 to $24,999 | 54 (42.2%) | 3 (2.0%) |
| $25,000 to $34,999 | 3 (2.3%) | 10 (6.6%) |
| $35,000 to $49,999 | 6 (4.7%) | 18 (11.8%) |
| $50,000 to $74,999 | 23 (18.0%) | 9 (5.9%) |
| $75,000 to $99,999 | 12 (9.4%) | 28 (18.4%) |
| $100,000 to $149,999 | 24 (18.8%) | 28 (18.4%) |
| $150,000 or more | 3 (2.3%) | 25 (16.5%) |
| Total | 128 (100.0%) | 152 (100.0%) |
Property Value to Household Income Ratio in Elizabeth
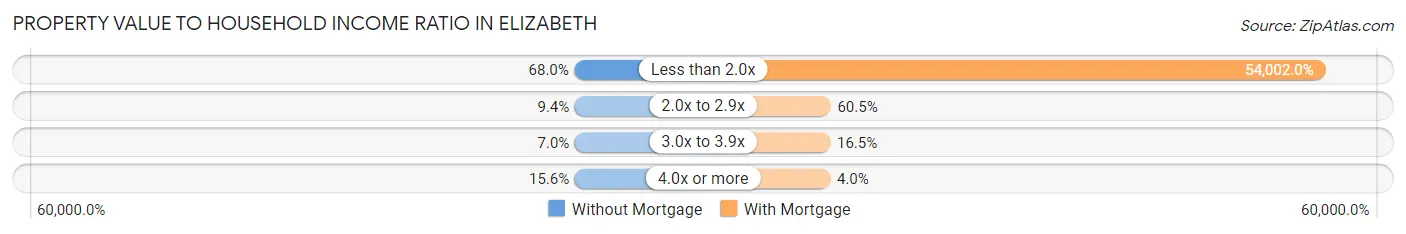
| Value-to-Income Ratio | Without Mortgage | With Mortgage |
| Less than 2.0x | 87 (68.0%) | 82,083 (54,002.0%) |
| 2.0x to 2.9x | 12 (9.4%) | 92 (60.5%) |
| 3.0x to 3.9x | 9 (7.0%) | 25 (16.5%) |
| 4.0x or more | 20 (15.6%) | 6 (4.0%) |
| Total | 128 (100.0%) | 152 (100.0%) |
Real Estate Taxes by Mortgage Status in Elizabeth
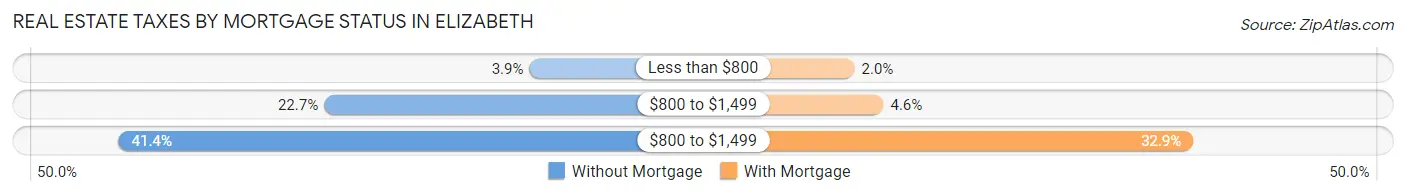
| Property Taxes | Without Mortgage | With Mortgage |
| Less than $800 | 5 (3.9%) | 3 (2.0%) |
| $800 to $1,499 | 29 (22.7%) | 7 (4.6%) |
| $800 to $1,499 | 53 (41.4%) | 50 (32.9%) |
| Total | 128 (100.0%) | 152 (100.0%) |
Health & Disability in Elizabeth
Health Insurance Coverage by Age in Elizabeth
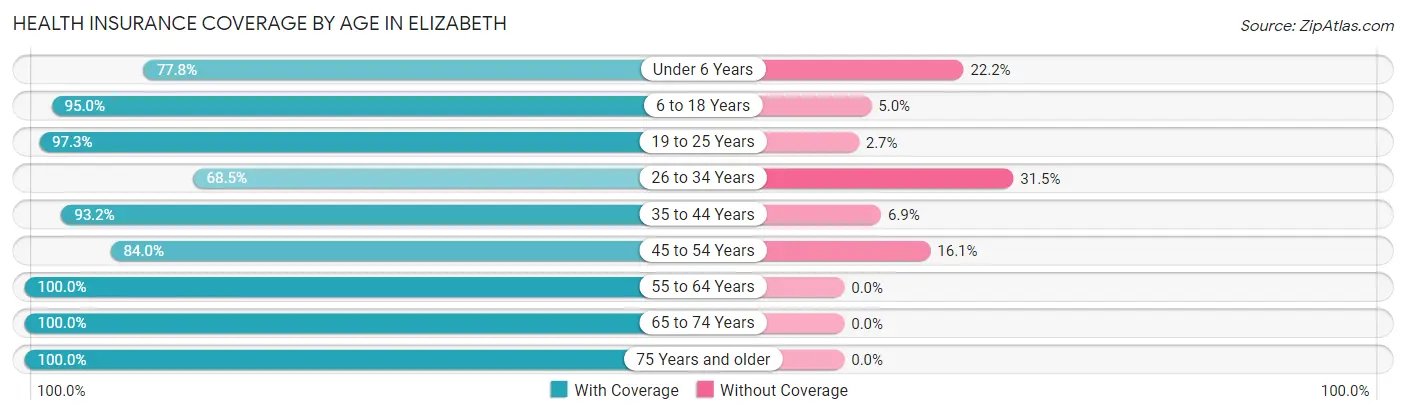
| Age Bracket | With Coverage | Without Coverage |
| Under 6 Years | 35 (77.8%) | 10 (22.2%) |
| 6 to 18 Years | 113 (95.0%) | 6 (5.0%) |
| 19 to 25 Years | 72 (97.3%) | 2 (2.7%) |
| 26 to 34 Years | 76 (68.5%) | 35 (31.5%) |
| 35 to 44 Years | 68 (93.1%) | 5 (6.9%) |
| 45 to 54 Years | 68 (84.0%) | 13 (16.1%) |
| 55 to 64 Years | 73 (100.0%) | 0 (0.0%) |
| 65 to 74 Years | 60 (100.0%) | 0 (0.0%) |
| 75 Years and older | 154 (100.0%) | 0 (0.0%) |
| Total | 719 (91.0%) | 71 (9.0%) |
Health Insurance Coverage by Citizenship Status in Elizabeth
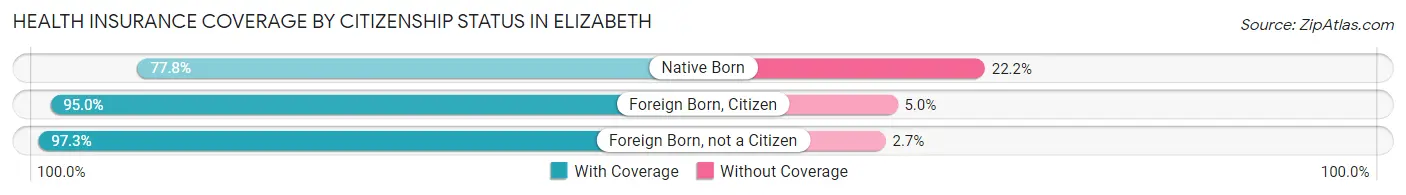
| Citizenship Status | With Coverage | Without Coverage |
| Native Born | 35 (77.8%) | 10 (22.2%) |
| Foreign Born, Citizen | 113 (95.0%) | 6 (5.0%) |
| Foreign Born, not a Citizen | 72 (97.3%) | 2 (2.7%) |
Health Insurance Coverage by Household Income in Elizabeth
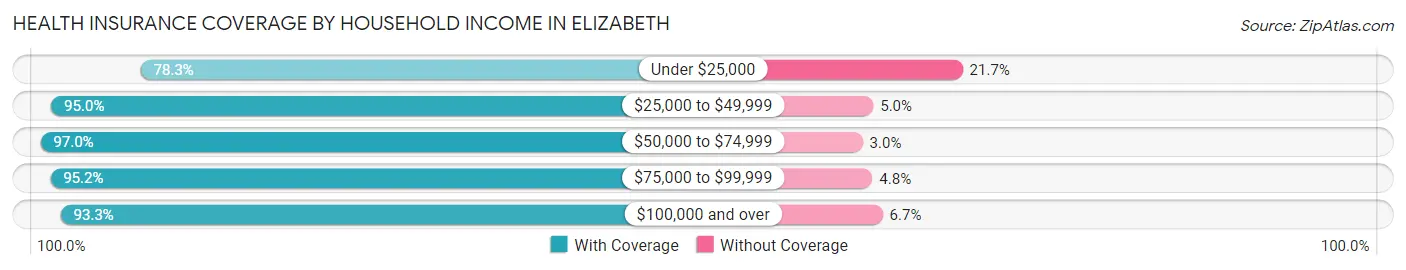
| Household Income | With Coverage | Without Coverage |
| Under $25,000 | 137 (78.3%) | 38 (21.7%) |
| $25,000 to $49,999 | 115 (95.0%) | 6 (5.0%) |
| $50,000 to $74,999 | 98 (97.0%) | 3 (3.0%) |
| $75,000 to $99,999 | 119 (95.2%) | 6 (4.8%) |
| $100,000 and over | 250 (93.3%) | 18 (6.7%) |
Public vs Private Health Insurance Coverage by Age in Elizabeth
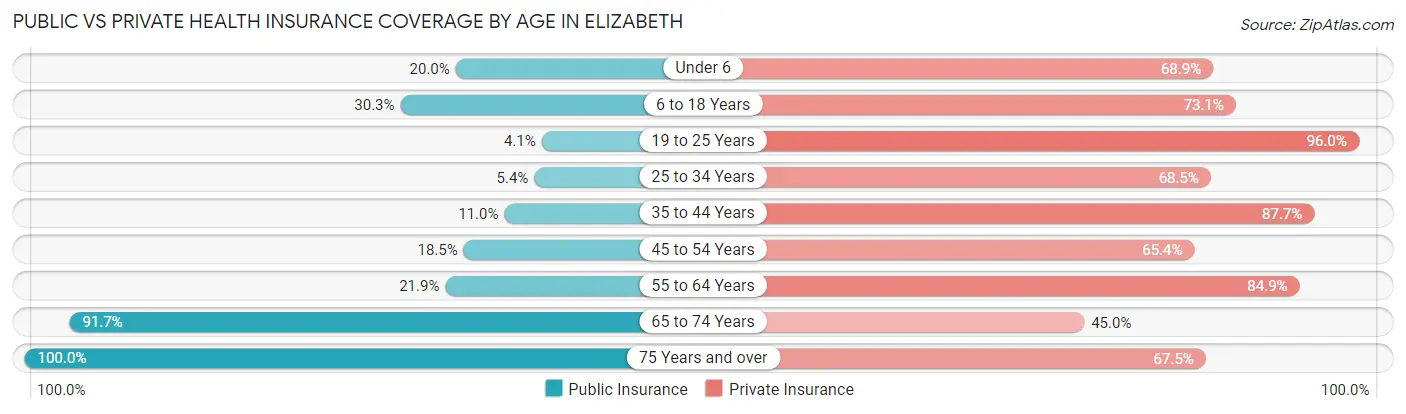
| Age Bracket | Public Insurance | Private Insurance |
| Under 6 | 9 (20.0%) | 31 (68.9%) |
| 6 to 18 Years | 36 (30.2%) | 87 (73.1%) |
| 19 to 25 Years | 3 (4.1%) | 71 (96.0%) |
| 25 to 34 Years | 6 (5.4%) | 76 (68.5%) |
| 35 to 44 Years | 8 (11.0%) | 64 (87.7%) |
| 45 to 54 Years | 15 (18.5%) | 53 (65.4%) |
| 55 to 64 Years | 16 (21.9%) | 62 (84.9%) |
| 65 to 74 Years | 55 (91.7%) | 27 (45.0%) |
| 75 Years and over | 154 (100.0%) | 104 (67.5%) |
| Total | 302 (38.2%) | 575 (72.8%) |
Disability Status by Sex by Age in Elizabeth
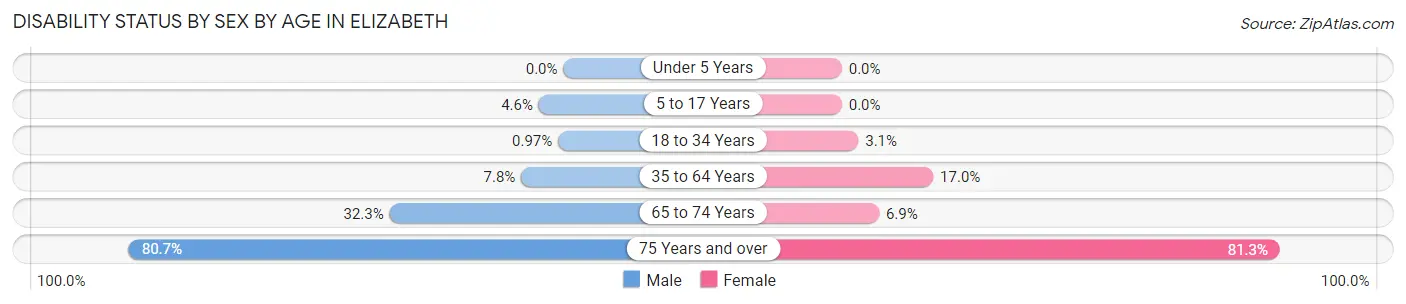
| Age Bracket | Male | Female |
| Under 5 Years | 0 (0.0%) | 0 (0.0%) |
| 5 to 17 Years | 3 (4.5%) | 0 (0.0%) |
| 18 to 34 Years | 1 (1.0%) | 3 (3.1%) |
| 35 to 64 Years | 9 (7.8%) | 19 (17.0%) |
| 65 to 74 Years | 10 (32.3%) | 2 (6.9%) |
| 75 Years and over | 25 (80.6%) | 100 (81.3%) |
Disability Class by Sex by Age in Elizabeth
Disability Class: Hearing Difficulty
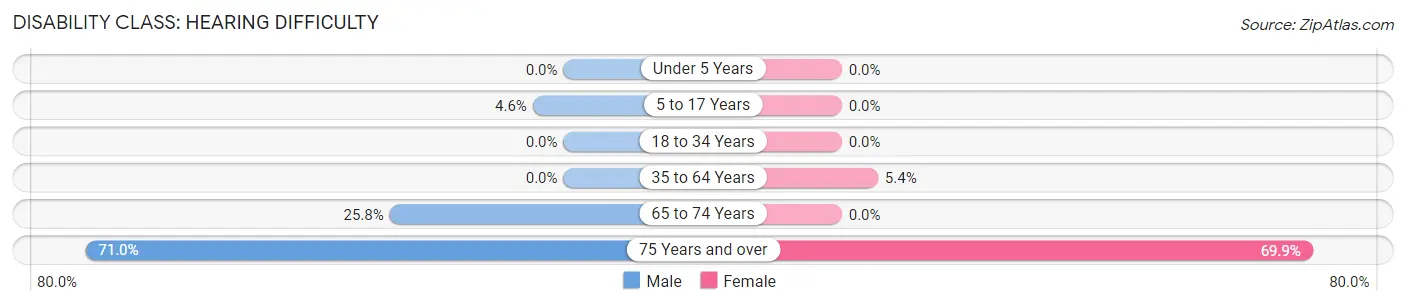
| Age Bracket | Male | Female |
| Under 5 Years | 0 (0.0%) | 0 (0.0%) |
| 5 to 17 Years | 3 (4.5%) | 0 (0.0%) |
| 18 to 34 Years | 0 (0.0%) | 0 (0.0%) |
| 35 to 64 Years | 0 (0.0%) | 6 (5.4%) |
| 65 to 74 Years | 8 (25.8%) | 0 (0.0%) |
| 75 Years and over | 22 (71.0%) | 86 (69.9%) |
Disability Class: Vision Difficulty
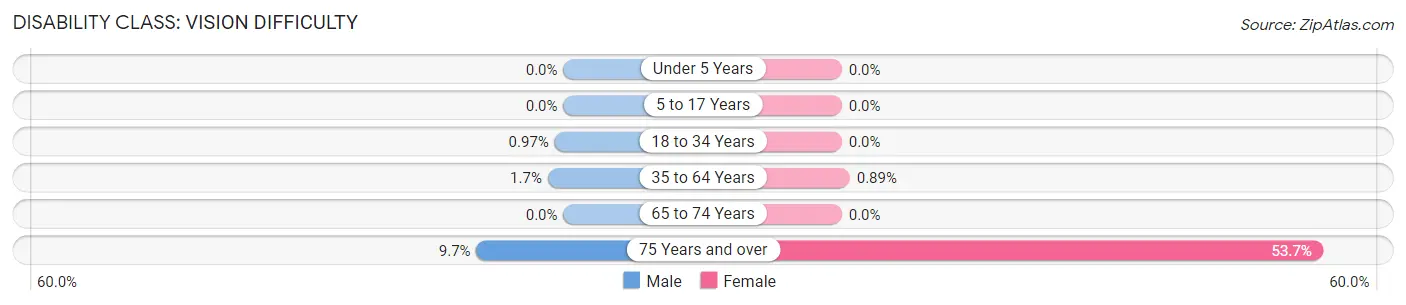
| Age Bracket | Male | Female |
| Under 5 Years | 0 (0.0%) | 0 (0.0%) |
| 5 to 17 Years | 0 (0.0%) | 0 (0.0%) |
| 18 to 34 Years | 1 (1.0%) | 0 (0.0%) |
| 35 to 64 Years | 2 (1.7%) | 1 (0.9%) |
| 65 to 74 Years | 0 (0.0%) | 0 (0.0%) |
| 75 Years and over | 3 (9.7%) | 66 (53.7%) |
Disability Class: Cognitive Difficulty
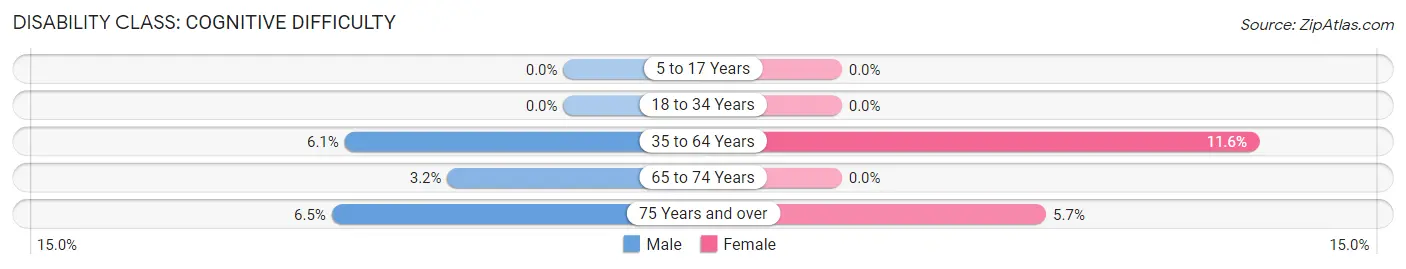
| Age Bracket | Male | Female |
| 5 to 17 Years | 0 (0.0%) | 0 (0.0%) |
| 18 to 34 Years | 0 (0.0%) | 0 (0.0%) |
| 35 to 64 Years | 7 (6.1%) | 13 (11.6%) |
| 65 to 74 Years | 1 (3.2%) | 0 (0.0%) |
| 75 Years and over | 2 (6.5%) | 7 (5.7%) |
Disability Class: Ambulatory Difficulty
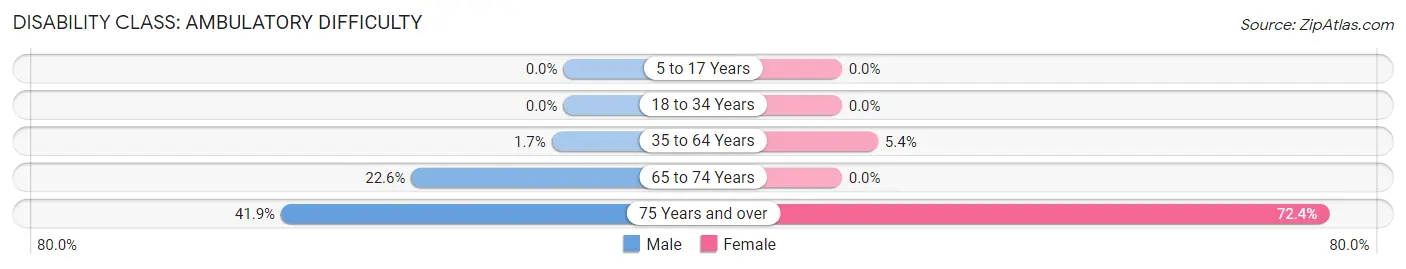
| Age Bracket | Male | Female |
| 5 to 17 Years | 0 (0.0%) | 0 (0.0%) |
| 18 to 34 Years | 0 (0.0%) | 0 (0.0%) |
| 35 to 64 Years | 2 (1.7%) | 6 (5.4%) |
| 65 to 74 Years | 7 (22.6%) | 0 (0.0%) |
| 75 Years and over | 13 (41.9%) | 89 (72.4%) |
Disability Class: Self-Care Difficulty
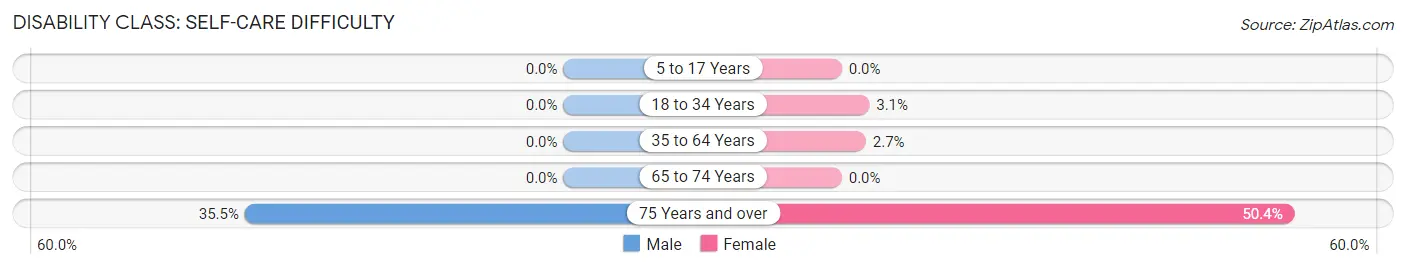
| Age Bracket | Male | Female |
| 5 to 17 Years | 0 (0.0%) | 0 (0.0%) |
| 18 to 34 Years | 0 (0.0%) | 3 (3.1%) |
| 35 to 64 Years | 0 (0.0%) | 3 (2.7%) |
| 65 to 74 Years | 0 (0.0%) | 0 (0.0%) |
| 75 Years and over | 11 (35.5%) | 62 (50.4%) |
Technology Access in Elizabeth
Computing Device Access in Elizabeth
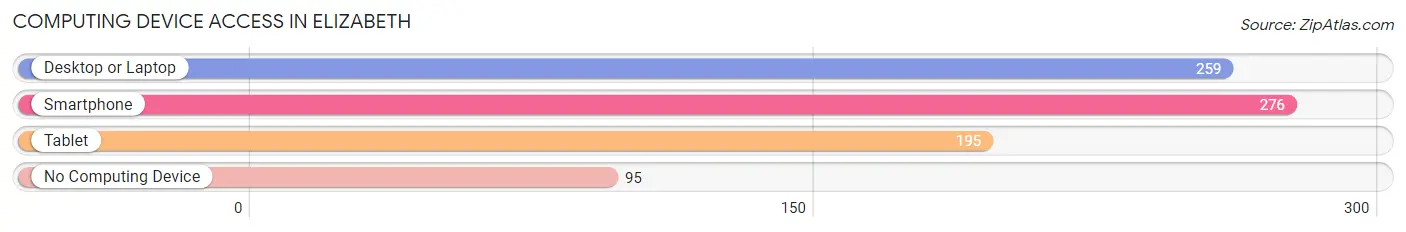
| Device Type | # Households | % Households |
| Desktop or Laptop | 259 | 64.4% |
| Smartphone | 276 | 68.7% |
| Tablet | 195 | 48.5% |
| No Computing Device | 95 | 23.6% |
| Total | 402 | 100.0% |
Internet Access in Elizabeth
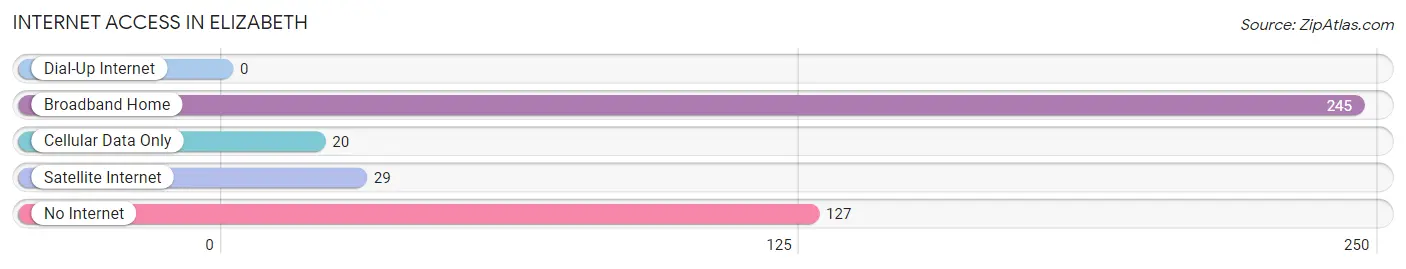
| Internet Type | # Households | % Households |
| Dial-Up Internet | 0 | 0.0% |
| Broadband Home | 245 | 61.0% |
| Cellular Data Only | 20 | 5.0% |
| Satellite Internet | 29 | 7.2% |
| No Internet | 127 | 31.6% |
| Total | 402 | 100.0% |
Elizabeth Summary
Elizabeth, Illinois is a small village located in Jo Daviess County, Illinois. It is situated on the banks of the Galena River, about 25 miles east of Dubuque, Iowa. The village has a population of about 1,000 people and is part of the Galena-Southeast Illinois region.
History
Elizabeth was founded in 1827 by a group of settlers from Pennsylvania. The village was named after Elizabeth, the wife of one of the settlers. The settlers were attracted to the area due to its rich soil and abundant natural resources. The village quickly grew and by 1837, it had a population of over 500 people.
In 1845, the Galena and Chicago Union Railroad was built through Elizabeth, connecting the village to the larger cities of Galena and Chicago. This allowed for the transportation of goods and people, and helped to spur the growth of the village.
In 1858, the village was incorporated and the first mayor was elected. The village continued to grow and by the turn of the century, it had a population of over 1,000 people.
Geography
Elizabeth is located in Jo Daviess County, Illinois. It is situated on the banks of the Galena River, about 25 miles east of Dubuque, Iowa. The village is surrounded by rolling hills and is part of the Galena-Southeast Illinois region.
The climate in Elizabeth is typical of the Midwest, with hot summers and cold winters. The average temperature in the summer is around 75 degrees Fahrenheit, while the average temperature in the winter is around 25 degrees Fahrenheit.
Economy
The economy of Elizabeth is largely based on agriculture and tourism. The village is home to several farms, which produce a variety of crops, including corn, soybeans, and wheat. The village also has several wineries, which attract tourists from all over the region.
In addition to agriculture and tourism, Elizabeth is home to several small businesses, including restaurants, shops, and other services. The village also has a small industrial park, which houses several manufacturing companies.
Demographics
As of the 2010 census, the population of Elizabeth was 1,000 people. The racial makeup of the village was 97.2% White, 0.7% African American, 0.2% Native American, 0.2% Asian, 0.2% from other races, and 1.7% from two or more races.
The median household income in Elizabeth was $45,000, and the median family income was $50,000. The per capita income was $20,000. About 8.7% of the population was below the poverty line.
Elizabeth is a small village with a rich history and a vibrant economy. The village is home to several farms, wineries, and small businesses, and is a popular tourist destination. The village has a diverse population and a strong sense of community.
Common Questions
What is Per Capita Income in Elizabeth?
Per Capita income in Elizabeth is $38,276.
What is the Median Family Income in Elizabeth?
Median Family Income in Elizabeth is $87,778.
What is the Median Household income in Elizabeth?
Median Household Income in Elizabeth is $50,357.
What is Income or Wage Gap in Elizabeth?
Income or Wage Gap in Elizabeth is 23.9%.
Women in Elizabeth earn 76.1 cents for every dollar earned by a man.
What is Inequality or Gini Index in Elizabeth?
Inequality or Gini Index in Elizabeth is 0.54.
What is the Total Population of Elizabeth?
Total Population of Elizabeth is 816.
What is the Total Male Population of Elizabeth?
Total Male Population of Elizabeth is 366.
What is the Total Female Population of Elizabeth?
Total Female Population of Elizabeth is 450.
What is the Ratio of Males per 100 Females in Elizabeth?
There are 81.33 Males per 100 Females in Elizabeth.
What is the Ratio of Females per 100 Males in Elizabeth?
There are 122.95 Females per 100 Males in Elizabeth.
What is the Median Population Age in Elizabeth?
Median Population Age in Elizabeth is 43.1 Years.
What is the Average Family Size in Elizabeth
Average Family Size in Elizabeth is 2.9 People.
What is the Average Household Size in Elizabeth
Average Household Size in Elizabeth is 2.0 People.
How Large is the Labor Force in Elizabeth?
There are 421 People in the Labor Forcein in Elizabeth.
What is the Percentage of People in the Labor Force in Elizabeth?
60.8% of People are in the Labor Force in Elizabeth.
What is the Unemployment Rate in Elizabeth?
Unemployment Rate in Elizabeth is 0.5%.