Marengo, IL Map & Demographics
Marengo Map
Marengo Overview
$35,338
PER CAPITA INCOME
$108,043
AVG FAMILY INCOME
$71,196
AVG HOUSEHOLD INCOME
42.0%
WAGE / INCOME GAP [ % ]
58.0¢/ $1
WAGE / INCOME GAP [ $ ]
0.45
INEQUALITY / GINI INDEX
7,471
TOTAL POPULATION
3,786
MALE POPULATION
3,685
FEMALE POPULATION
102.74
MALES / 100 FEMALES
97.33
FEMALES / 100 MALES
31.1
MEDIAN AGE
3.1
AVG FAMILY SIZE
2.5
AVG HOUSEHOLD SIZE
3,967
LABOR FORCE [ PEOPLE ]
68.4%
PERCENT IN LABOR FORCE
7.1%
UNEMPLOYMENT RATE
Marengo Zip Codes
Income in Marengo
Income Overview in Marengo
Per Capita Income in Marengo is $35,338, while median incomes of families and households are $108,043 and $71,196 respectively.
| Characteristic | Number | Measure |
| Per Capita Income | 7,471 | $35,338 |
| Median Family Income | 1,894 | $108,043 |
| Mean Family Income | 1,894 | $104,586 |
| Median Household Income | 2,918 | $71,196 |
| Mean Household Income | 2,918 | $87,595 |
| Income Deficit | 1,894 | $0 |
| Wage / Income Gap (%) | 7,471 | 41.95% |
| Wage / Income Gap ($) | 7,471 | 58.05¢ per $1 |
| Gini / Inequality Index | 7,471 | 0.45 |
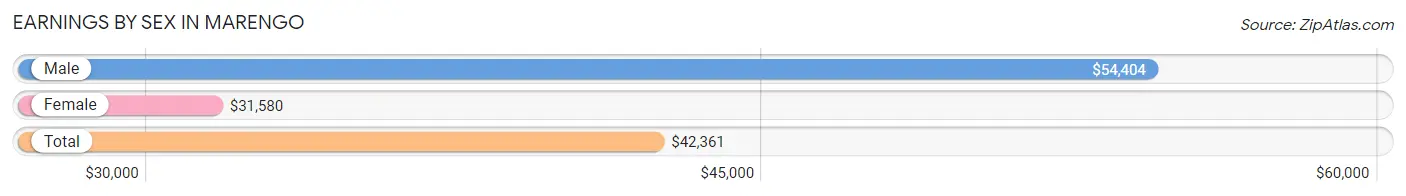
Earnings by Sex in Marengo
Average Earnings in Marengo are $42,361, $54,404 for men and $31,580 for women, a difference of 41.9%.
| Sex | Number | Average Earnings |
| Male | 2,318 (56.3%) | $54,404 |
| Female | 1,796 (43.7%) | $31,580 |
| Total | 4,114 (100.0%) | $42,361 |
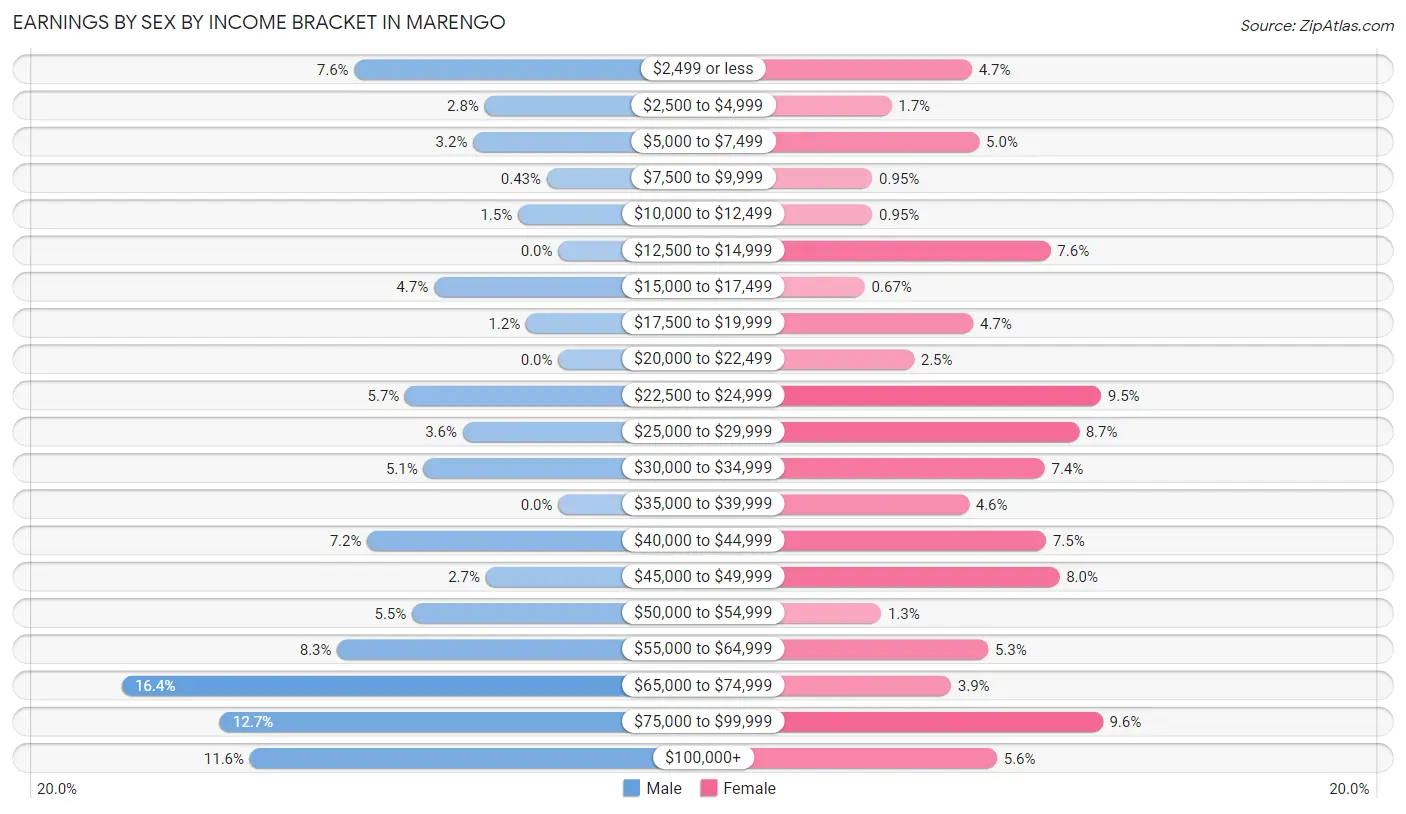
Earnings by Sex by Income Bracket in Marengo
The most common earnings brackets in Marengo are $65,000 to $74,999 for men (379 | 16.4%) and $75,000 to $99,999 for women (172 | 9.6%).
| Income | Male | Female |
| $2,499 or less | 177 (7.6%) | 84 (4.7%) |
| $2,500 to $4,999 | 64 (2.8%) | 30 (1.7%) |
| $5,000 to $7,499 | 74 (3.2%) | 89 (5.0%) |
| $7,500 to $9,999 | 10 (0.4%) | 17 (0.9%) |
| $10,000 to $12,499 | 35 (1.5%) | 17 (0.9%) |
| $12,500 to $14,999 | 0 (0.0%) | 137 (7.6%) |
| $15,000 to $17,499 | 108 (4.7%) | 12 (0.7%) |
| $17,500 to $19,999 | 28 (1.2%) | 85 (4.7%) |
| $20,000 to $22,499 | 0 (0.0%) | 45 (2.5%) |
| $22,500 to $24,999 | 133 (5.7%) | 171 (9.5%) |
| $25,000 to $29,999 | 83 (3.6%) | 156 (8.7%) |
| $30,000 to $34,999 | 117 (5.1%) | 133 (7.4%) |
| $35,000 to $39,999 | 0 (0.0%) | 82 (4.6%) |
| $40,000 to $44,999 | 166 (7.2%) | 134 (7.5%) |
| $45,000 to $49,999 | 63 (2.7%) | 143 (8.0%) |
| $50,000 to $54,999 | 127 (5.5%) | 23 (1.3%) |
| $55,000 to $64,999 | 192 (8.3%) | 95 (5.3%) |
| $65,000 to $74,999 | 379 (16.4%) | 70 (3.9%) |
| $75,000 to $99,999 | 294 (12.7%) | 172 (9.6%) |
| $100,000+ | 268 (11.6%) | 101 (5.6%) |
| Total | 2,318 (100.0%) | 1,796 (100.0%) |
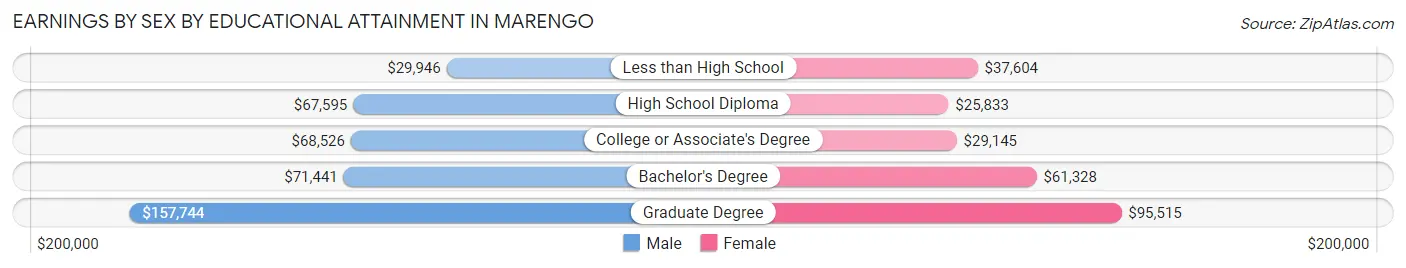
Earnings by Sex by Educational Attainment in Marengo
Average earnings in Marengo are $67,118 for men and $32,356 for women, a difference of 51.8%. Men with an educational attainment of graduate degree enjoy the highest average annual earnings of $157,744, while those with less than high school education earn the least with $29,946. Women with an educational attainment of graduate degree earn the most with the average annual earnings of $95,515, while those with high school diploma education have the smallest earnings of $25,833.
| Educational Attainment | Male Income | Female Income |
| Less than High School | $29,946 | $37,604 |
| High School Diploma | $67,595 | $25,833 |
| College or Associate's Degree | $68,526 | $29,145 |
| Bachelor's Degree | $71,441 | $61,328 |
| Graduate Degree | $157,744 | $95,515 |
| Total | $67,118 | $32,356 |
Family Income in Marengo
Family Income Brackets in Marengo
According to the Marengo family income data, there are 564 families falling into the $100,000 to $149,999 income range, which is the most common income bracket and makes up 29.8% of all families. Conversely, the $15,000 to $24,999 income bracket is the least frequent group with only 44 families (2.3%) belonging to this category.
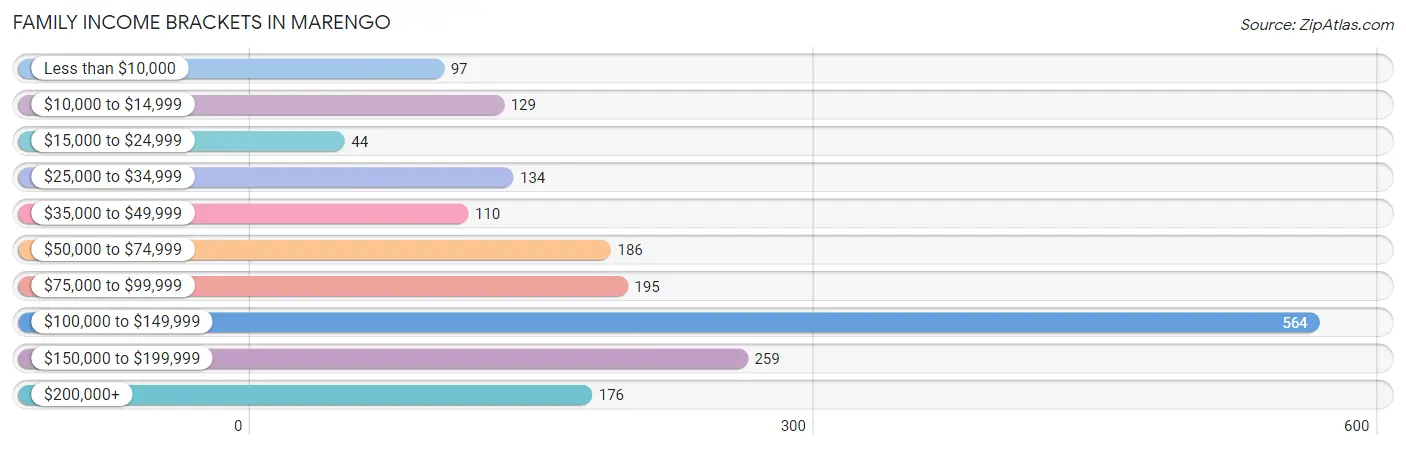
| Income Bracket | # Families | % Families |
| Less than $10,000 | 97 | 5.1% |
| $10,000 to $14,999 | 129 | 6.8% |
| $15,000 to $24,999 | 44 | 2.3% |
| $25,000 to $34,999 | 134 | 7.1% |
| $35,000 to $49,999 | 110 | 5.8% |
| $50,000 to $74,999 | 186 | 9.8% |
| $75,000 to $99,999 | 195 | 10.3% |
| $100,000 to $149,999 | 564 | 29.8% |
| $150,000 to $199,999 | 259 | 13.7% |
| $200,000+ | 176 | 9.3% |
Family Income by Famaliy Size in Marengo
5-person families (139 | 7.3%) account for the highest median family income in Marengo with $128,549 per family, while 3-person families (391 | 20.6%) have the highest median income of $36,528 per family member.
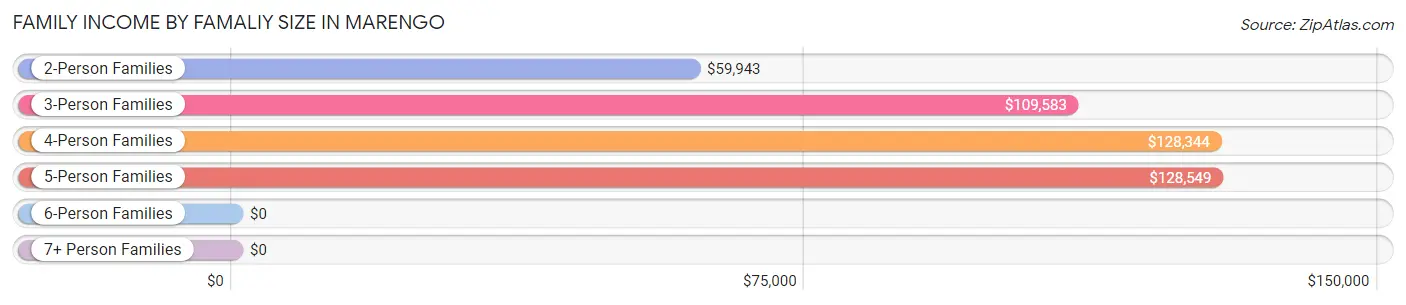
| Income Bracket | # Families | Median Income |
| 2-Person Families | 750 (39.6%) | $59,943 |
| 3-Person Families | 391 (20.6%) | $109,583 |
| 4-Person Families | 497 (26.2%) | $128,344 |
| 5-Person Families | 139 (7.3%) | $128,549 |
| 6-Person Families | 117 (6.2%) | $0 |
| 7+ Person Families | 0 (0.0%) | $0 |
| Total | 1,894 (100.0%) | $108,043 |
Family Income by Number of Earners in Marengo
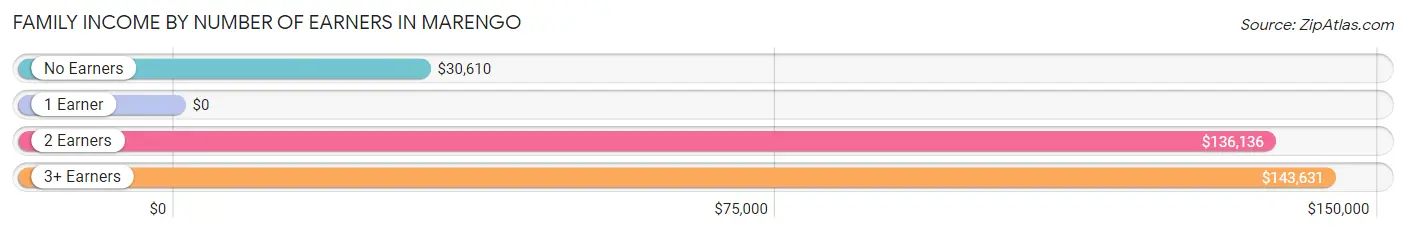
| Number of Earners | # Families | Median Income |
| No Earners | 176 (9.3%) | $30,610 |
| 1 Earner | 723 (38.2%) | $0 |
| 2 Earners | 702 (37.1%) | $136,136 |
| 3+ Earners | 293 (15.5%) | $143,631 |
| Total | 1,894 (100.0%) | $108,043 |
Household Income in Marengo
Household Income Brackets in Marengo
With 496 households falling in the category, the $100,000 to $149,999 income range is the most frequent in Marengo, accounting for 17.0% of all households. In contrast, only 160 households (5.5%) fall into the $10,000 to $14,999 income bracket, making it the least populous group.
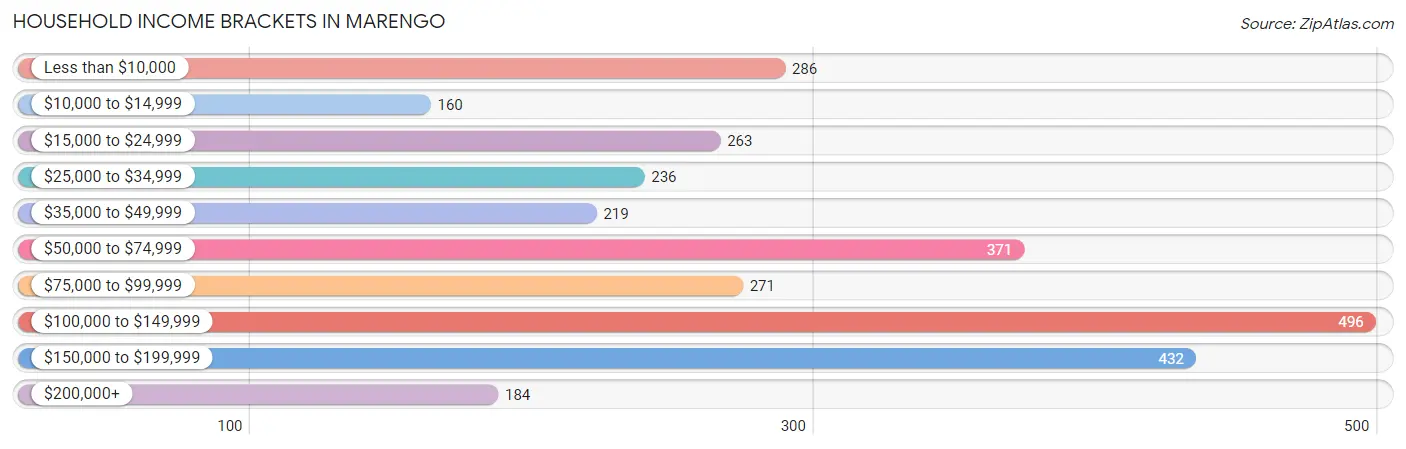
| Income Bracket | # Households | % Households |
| Less than $10,000 | 286 | 9.8% |
| $10,000 to $14,999 | 160 | 5.5% |
| $15,000 to $24,999 | 263 | 9.0% |
| $25,000 to $34,999 | 236 | 8.1% |
| $35,000 to $49,999 | 219 | 7.5% |
| $50,000 to $74,999 | 371 | 12.7% |
| $75,000 to $99,999 | 271 | 9.3% |
| $100,000 to $149,999 | 496 | 17.0% |
| $150,000 to $199,999 | 432 | 14.8% |
| $200,000+ | 184 | 6.3% |
Household Income by Householder Age in Marengo
The median household income in Marengo is $71,196, with the highest median household income of $107,647 found in the 45 to 64 years age bracket for the primary householder. A total of 1,028 households (35.2%) fall into this category. Meanwhile, the 15 to 24 years age bracket for the primary householder has the lowest median household income of $0, with 109 households (3.7%) in this group.
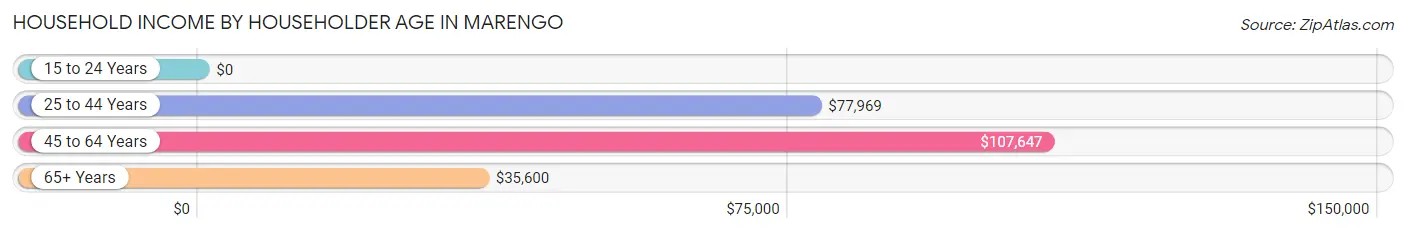
| Income Bracket | # Households | Median Income |
| 15 to 24 Years | 109 (3.7%) | $0 |
| 25 to 44 Years | 1,009 (34.6%) | $77,969 |
| 45 to 64 Years | 1,028 (35.2%) | $107,647 |
| 65+ Years | 772 (26.5%) | $35,600 |
| Total | 2,918 (100.0%) | $71,196 |
Poverty in Marengo
Income Below Poverty by Sex and Age in Marengo
With 10.1% poverty level for males and 21.6% for females among the residents of Marengo, 16 and 17 year old males and 15 year old females are the most vulnerable to poverty, with 77 males (64.7%) and 21 females (100.0%) in their respective age groups living below the poverty level.
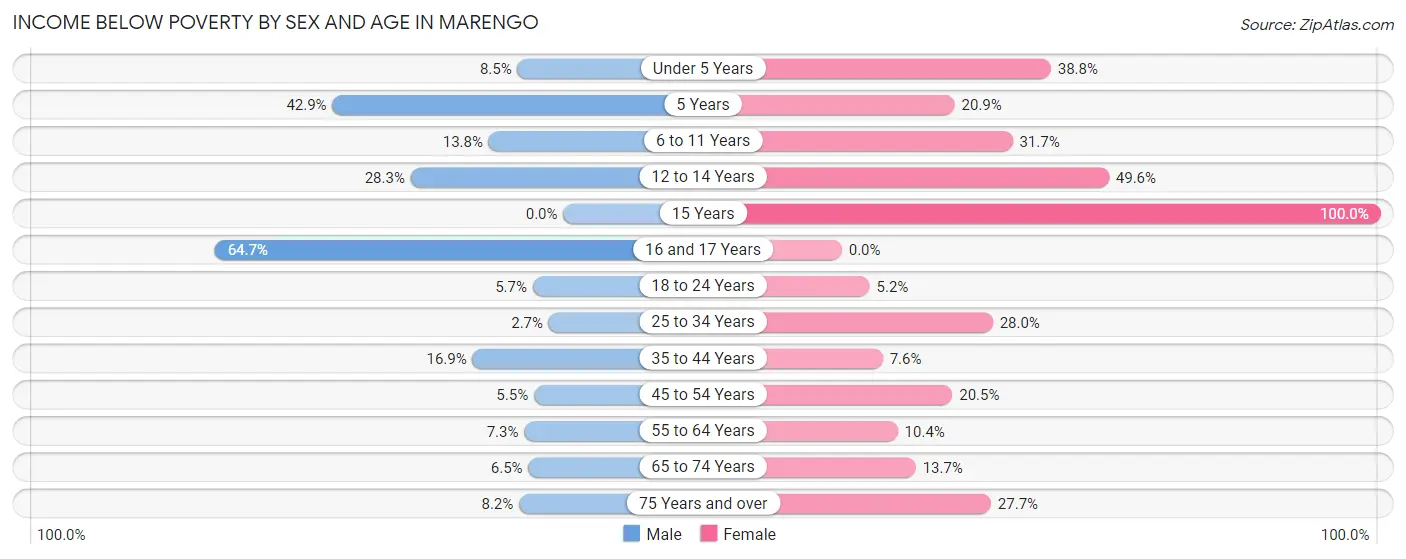
| Age Bracket | Male | Female |
| Under 5 Years | 30 (8.5%) | 109 (38.8%) |
| 5 Years | 18 (42.9%) | 27 (20.9%) |
| 6 to 11 Years | 44 (13.8%) | 83 (31.7%) |
| 12 to 14 Years | 17 (28.3%) | 57 (49.6%) |
| 15 Years | 0 (0.0%) | 21 (100.0%) |
| 16 and 17 Years | 77 (64.7%) | 0 (0.0%) |
| 18 to 24 Years | 27 (5.7%) | 19 (5.2%) |
| 25 to 34 Years | 17 (2.7%) | 205 (28.0%) |
| 35 to 44 Years | 57 (16.9%) | 18 (7.6%) |
| 45 to 54 Years | 20 (5.4%) | 80 (20.5%) |
| 55 to 64 Years | 40 (7.2%) | 50 (10.4%) |
| 65 to 74 Years | 16 (6.5%) | 38 (13.7%) |
| 75 Years and over | 16 (8.2%) | 80 (27.7%) |
| Total | 379 (10.1%) | 787 (21.6%) |
Income Above Poverty by Sex and Age in Marengo
According to the poverty statistics in Marengo, males aged 15 years and females aged 16 and 17 years are the age groups that are most secure financially, with 100.0% of males and 100.0% of females in these age groups living above the poverty line.
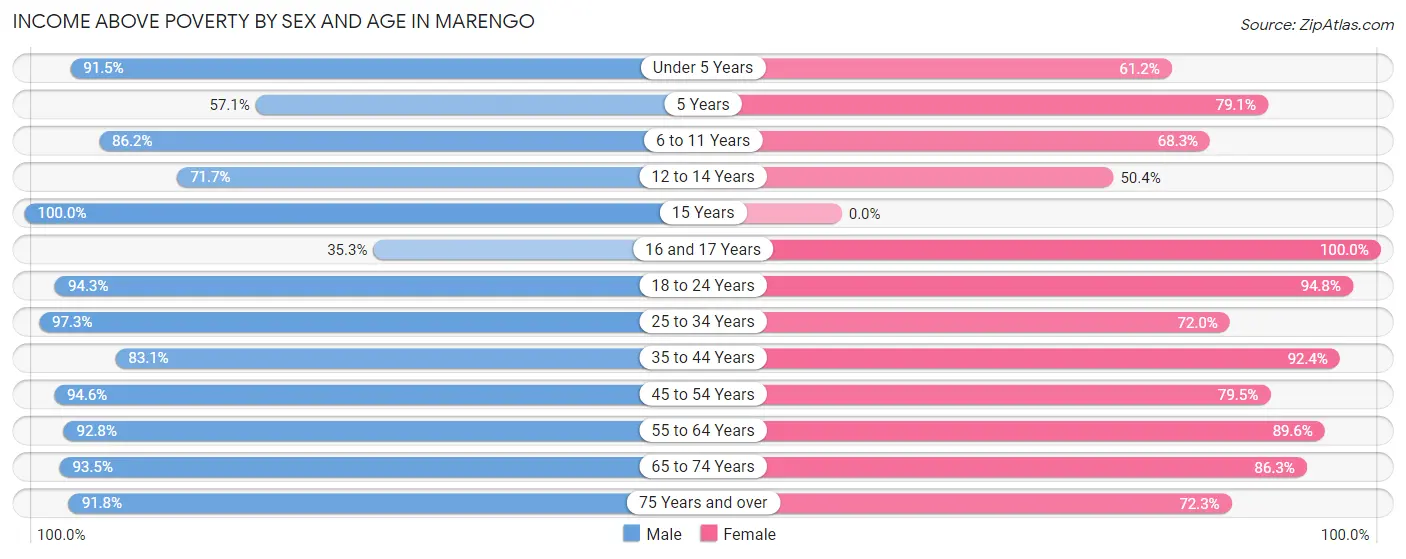
| Age Bracket | Male | Female |
| Under 5 Years | 323 (91.5%) | 172 (61.2%) |
| 5 Years | 24 (57.1%) | 102 (79.1%) |
| 6 to 11 Years | 274 (86.2%) | 179 (68.3%) |
| 12 to 14 Years | 43 (71.7%) | 58 (50.4%) |
| 15 Years | 74 (100.0%) | 0 (0.0%) |
| 16 and 17 Years | 42 (35.3%) | 52 (100.0%) |
| 18 to 24 Years | 449 (94.3%) | 349 (94.8%) |
| 25 to 34 Years | 615 (97.3%) | 527 (72.0%) |
| 35 to 44 Years | 281 (83.1%) | 219 (92.4%) |
| 45 to 54 Years | 347 (94.6%) | 310 (79.5%) |
| 55 to 64 Years | 512 (92.7%) | 432 (89.6%) |
| 65 to 74 Years | 231 (93.5%) | 239 (86.3%) |
| 75 Years and over | 179 (91.8%) | 209 (72.3%) |
| Total | 3,394 (89.9%) | 2,848 (78.3%) |
Income Below Poverty Among Married-Couple Families in Marengo
The poverty statistics for married-couple families in Marengo show that 5.8% or 74 of the total 1,286 families live below the poverty line. Families with 3 or 4 children have the highest poverty rate of 54.8%, comprising of 40 families. On the other hand, families with no children have the lowest poverty rate of 0.0%, which includes 0 families.
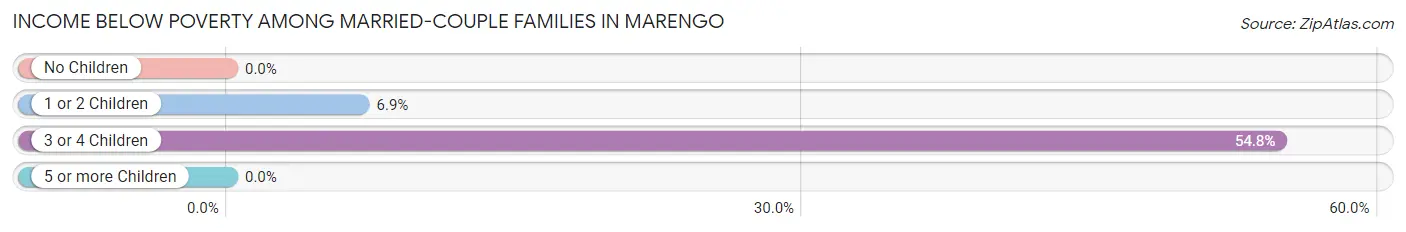
| Children | Above Poverty | Below Poverty |
| No Children | 718 (100.0%) | 0 (0.0%) |
| 1 or 2 Children | 461 (93.1%) | 34 (6.9%) |
| 3 or 4 Children | 33 (45.2%) | 40 (54.8%) |
| 5 or more Children | 0 (0.0%) | 0 (0.0%) |
| Total | 1,212 (94.3%) | 74 (5.8%) |
Income Below Poverty Among Single-Parent Households in Marengo
According to the poverty data in Marengo, 11.0% or 18 single-father households and 52.5% or 233 single-mother households are living below the poverty line. Among single-father households, those with no children have the highest poverty rate, with 18 households (27.7%) experiencing poverty. Likewise, among single-mother households, those with 1 or 2 children have the highest poverty rate, with 215 households (86.7%) falling below the poverty line.
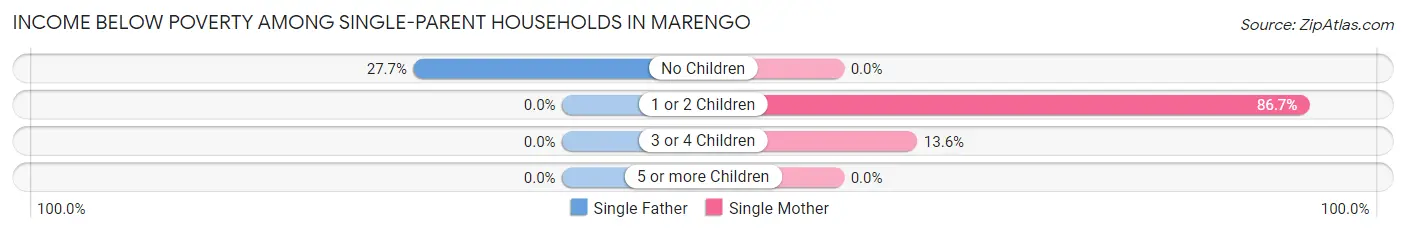
| Children | Single Father | Single Mother |
| No Children | 18 (27.7%) | 0 (0.0%) |
| 1 or 2 Children | 0 (0.0%) | 215 (86.7%) |
| 3 or 4 Children | 0 (0.0%) | 18 (13.6%) |
| 5 or more Children | 0 (0.0%) | 0 (0.0%) |
| Total | 18 (11.0%) | 233 (52.5%) |
Income Below Poverty Among Married-Couple vs Single-Parent Households in Marengo
The poverty data for Marengo shows that 74 of the married-couple family households (5.8%) and 251 of the single-parent households (41.3%) are living below the poverty level. Within the married-couple family households, those with 3 or 4 children have the highest poverty rate, with 40 households (54.8%) falling below the poverty line. Among the single-parent households, those with 1 or 2 children have the highest poverty rate, with 215 household (62.0%) living below poverty.
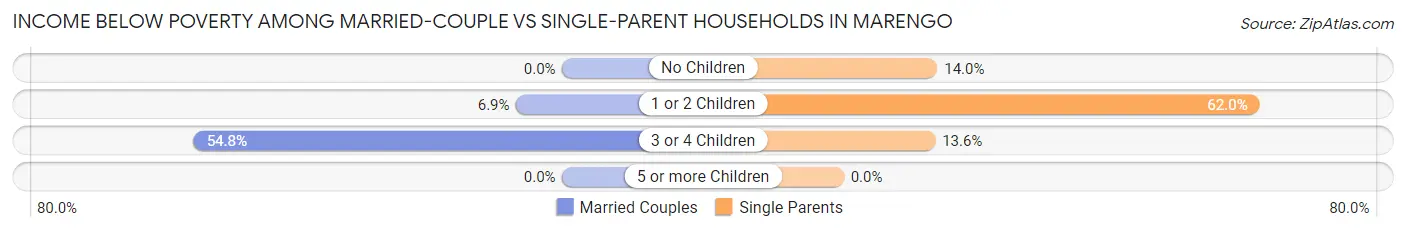
| Children | Married-Couple Families | Single-Parent Households |
| No Children | 0 (0.0%) | 18 (14.0%) |
| 1 or 2 Children | 34 (6.9%) | 215 (62.0%) |
| 3 or 4 Children | 40 (54.8%) | 18 (13.6%) |
| 5 or more Children | 0 (0.0%) | 0 (0.0%) |
| Total | 74 (5.8%) | 251 (41.3%) |
Race in Marengo
The most populous races in Marengo are White / Caucasian (7,122 | 95.3%), Hispanic or Latino (1,179 | 15.8%), and Two or more Races (206 | 2.8%).
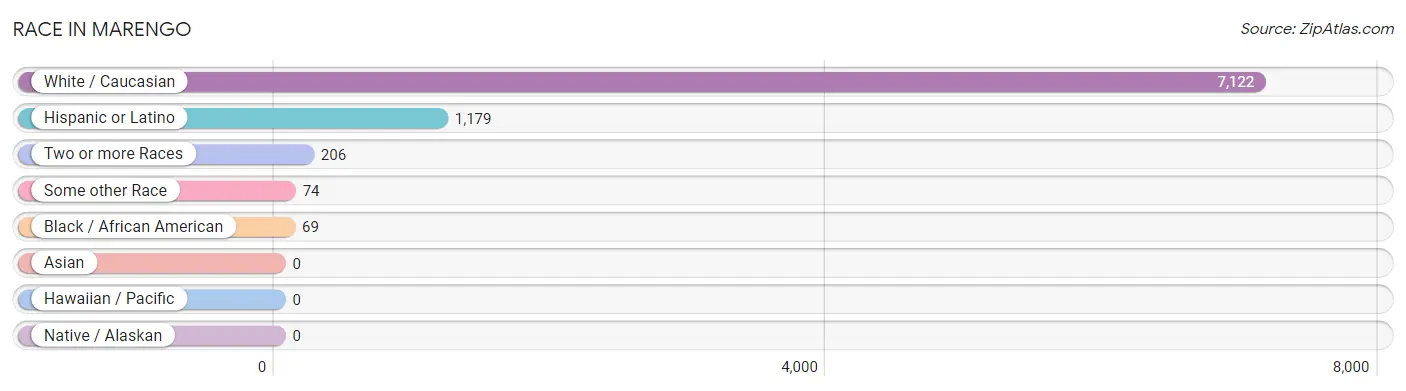
| Race | # Population | % Population |
| Asian | 0 | 0.0% |
| Black / African American | 69 | 0.9% |
| Hawaiian / Pacific | 0 | 0.0% |
| Hispanic or Latino | 1,179 | 15.8% |
| Native / Alaskan | 0 | 0.0% |
| White / Caucasian | 7,122 | 95.3% |
| Two or more Races | 206 | 2.8% |
| Some other Race | 74 | 1.0% |
| Total | 7,471 | 100.0% |
Ancestry in Marengo
The most populous ancestries reported in Marengo are German (1,919 | 25.7%), Irish (1,239 | 16.6%), Mexican (1,012 | 13.6%), Italian (823 | 11.0%), and Polish (703 | 9.4%), together accounting for 76.2% of all Marengo residents.
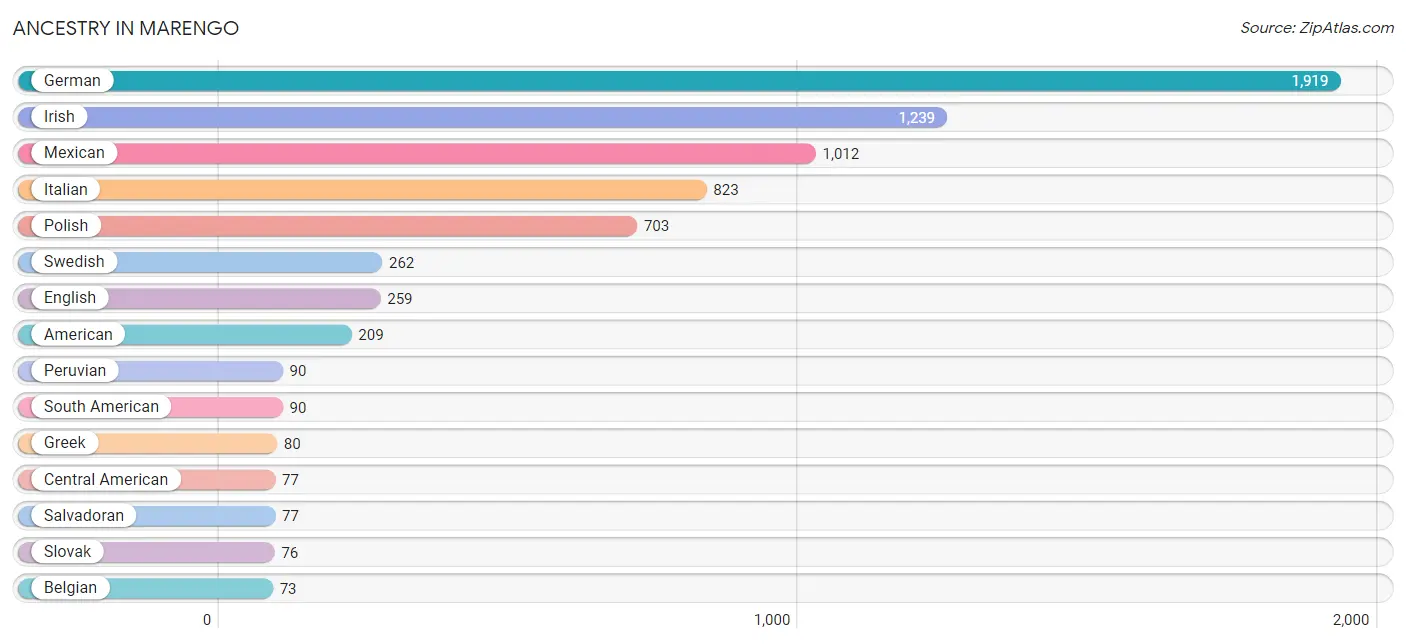
| Ancestry | # Population | % Population |
| American | 209 | 2.8% |
| Arab | 51 | 0.7% |
| Austrian | 9 | 0.1% |
| Belgian | 73 | 1.0% |
| British | 19 | 0.3% |
| Central American | 77 | 1.0% |
| Cherokee | 3 | 0.0% |
| Croatian | 7 | 0.1% |
| Czech | 29 | 0.4% |
| Danish | 41 | 0.5% |
| Dutch | 61 | 0.8% |
| English | 259 | 3.5% |
| European | 72 | 1.0% |
| French | 61 | 0.8% |
| German | 1,919 | 25.7% |
| Greek | 80 | 1.1% |
| Hungarian | 59 | 0.8% |
| Icelander | 9 | 0.1% |
| Irish | 1,239 | 16.6% |
| Italian | 823 | 11.0% |
| Lithuanian | 8 | 0.1% |
| Malaysian | 24 | 0.3% |
| Mexican | 1,012 | 13.6% |
| Norwegian | 63 | 0.8% |
| Peruvian | 90 | 1.2% |
| Polish | 703 | 9.4% |
| Portuguese | 8 | 0.1% |
| Romanian | 18 | 0.2% |
| Russian | 25 | 0.3% |
| Salvadoran | 77 | 1.0% |
| Scandinavian | 22 | 0.3% |
| Scotch-Irish | 73 | 1.0% |
| Scottish | 46 | 0.6% |
| Slovak | 76 | 1.0% |
| South American | 90 | 1.2% |
| Sri Lankan | 24 | 0.3% |
| Swedish | 262 | 3.5% |
| Swiss | 27 | 0.4% |
| Taiwanese | 22 | 0.3% |
| Yugoslavian | 4 | 0.1% | View All 40 Rows |
Immigrants in Marengo
The most numerous immigrant groups reported in Marengo came from Latin America (479 | 6.4%), Central America (429 | 5.7%), Mexico (364 | 4.9%), Europe (147 | 2.0%), and Eastern Europe (116 | 1.5%), together accounting for 20.5% of all Marengo residents.
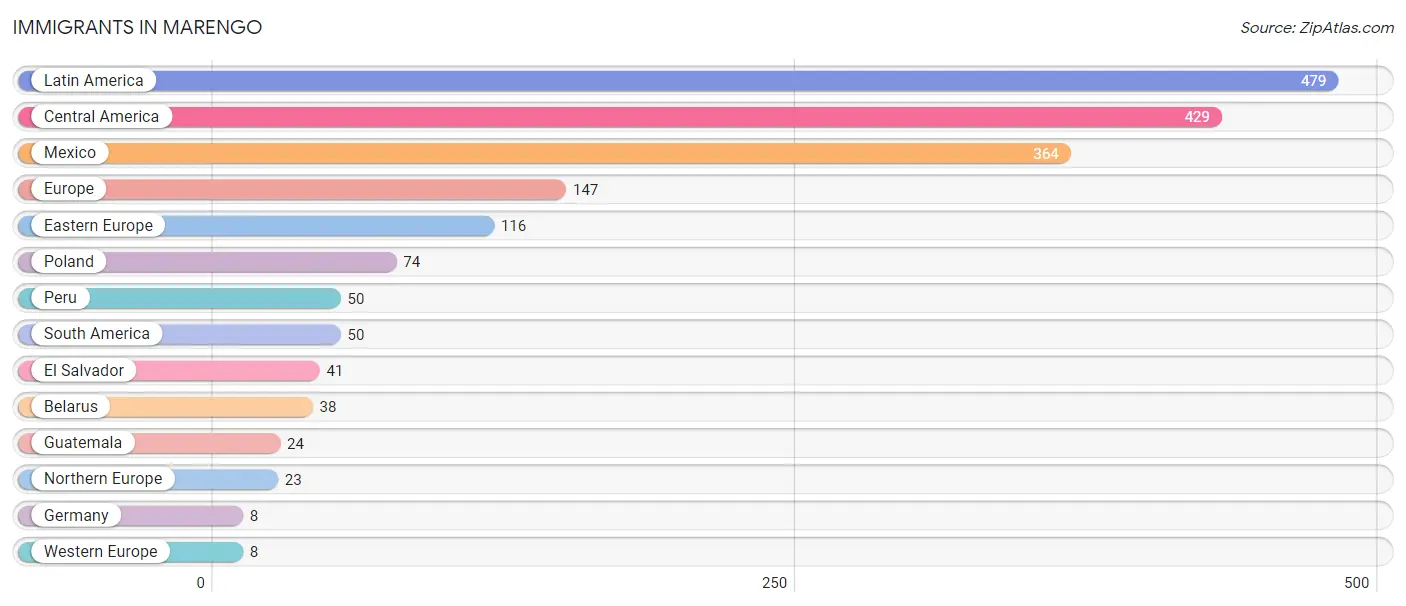
| Immigration Origin | # Population | % Population |
| Belarus | 38 | 0.5% |
| Central America | 429 | 5.7% |
| Eastern Europe | 116 | 1.5% |
| El Salvador | 41 | 0.5% |
| Europe | 147 | 2.0% |
| Germany | 8 | 0.1% |
| Guatemala | 24 | 0.3% |
| Latin America | 479 | 6.4% |
| Mexico | 364 | 4.9% |
| Northern Europe | 23 | 0.3% |
| Peru | 50 | 0.7% |
| Poland | 74 | 1.0% |
| South America | 50 | 0.7% |
| Western Europe | 8 | 0.1% | View All 14 Rows |
Sex and Age in Marengo
Sex and Age in Marengo
The most populous age groups in Marengo are 20 to 24 Years (399 | 10.5%) for men and 25 to 29 Years (570 | 15.5%) for women.
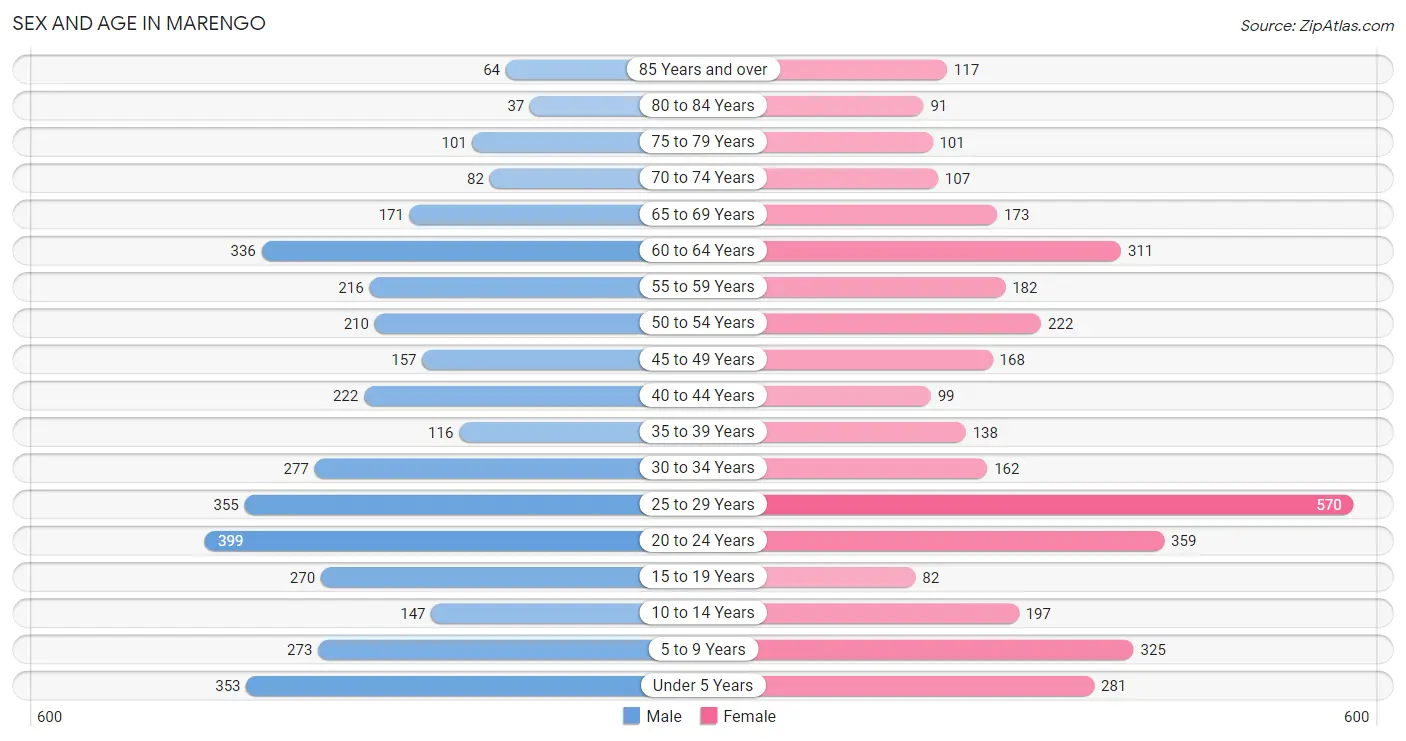
| Age Bracket | Male | Female |
| Under 5 Years | 353 (9.3%) | 281 (7.6%) |
| 5 to 9 Years | 273 (7.2%) | 325 (8.8%) |
| 10 to 14 Years | 147 (3.9%) | 197 (5.3%) |
| 15 to 19 Years | 270 (7.1%) | 82 (2.2%) |
| 20 to 24 Years | 399 (10.5%) | 359 (9.7%) |
| 25 to 29 Years | 355 (9.4%) | 570 (15.5%) |
| 30 to 34 Years | 277 (7.3%) | 162 (4.4%) |
| 35 to 39 Years | 116 (3.1%) | 138 (3.7%) |
| 40 to 44 Years | 222 (5.9%) | 99 (2.7%) |
| 45 to 49 Years | 157 (4.2%) | 168 (4.6%) |
| 50 to 54 Years | 210 (5.6%) | 222 (6.0%) |
| 55 to 59 Years | 216 (5.7%) | 182 (4.9%) |
| 60 to 64 Years | 336 (8.9%) | 311 (8.4%) |
| 65 to 69 Years | 171 (4.5%) | 173 (4.7%) |
| 70 to 74 Years | 82 (2.2%) | 107 (2.9%) |
| 75 to 79 Years | 101 (2.7%) | 101 (2.7%) |
| 80 to 84 Years | 37 (1.0%) | 91 (2.5%) |
| 85 Years and over | 64 (1.7%) | 117 (3.2%) |
| Total | 3,786 (100.0%) | 3,685 (100.0%) |
Families and Households in Marengo
Median Family Size in Marengo
The median family size in Marengo is 3.15 persons per family, with married-couple families (1,286 | 67.9%) accounting for the largest median family size of 3.43 persons per family. On the other hand, single male/father families (164 | 8.7%) represent the smallest median family size with 2.45 persons per family.
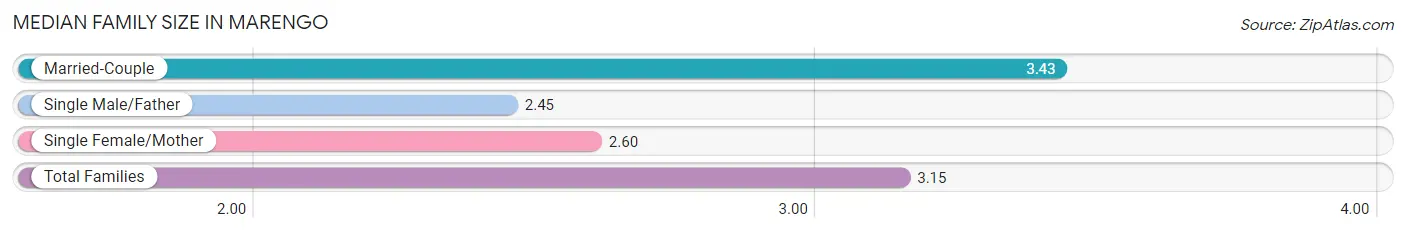
| Family Type | # Families | Family Size |
| Married-Couple | 1,286 (67.9%) | 3.43 |
| Single Male/Father | 164 (8.7%) | 2.45 |
| Single Female/Mother | 444 (23.4%) | 2.60 |
| Total Families | 1,894 (100.0%) | 3.15 |
Median Household Size in Marengo
The median household size in Marengo is 2.54 persons per household, with married-couple households (1,286 | 44.1%) accounting for the largest median household size of 3.46 persons per household. non-family households (1,024 | 35.1%) represent the smallest median household size with 1.08 persons per household.
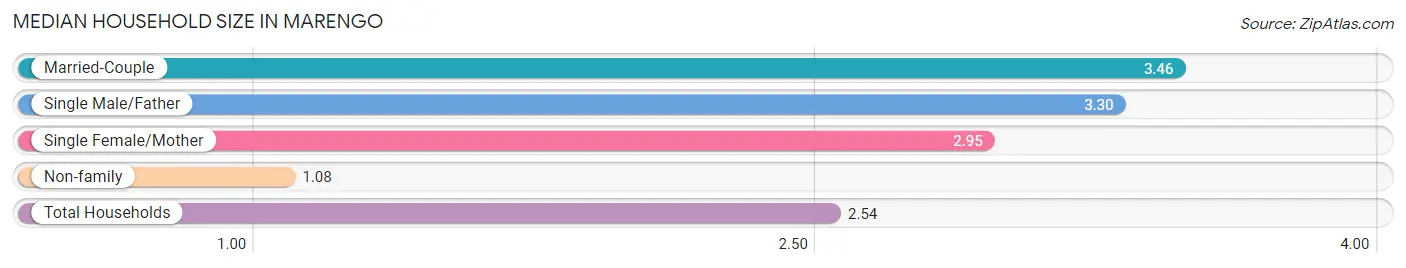
| Household Type | # Households | Household Size |
| Married-Couple | 1,286 (44.1%) | 3.46 |
| Single Male/Father | 164 (5.6%) | 3.30 |
| Single Female/Mother | 444 (15.2%) | 2.95 |
| Non-family | 1,024 (35.1%) | 1.08 |
| Total Households | 2,918 (100.0%) | 2.54 |
Household Size by Marriage Status in Marengo
Out of a total of 2,918 households in Marengo, 1,894 (64.9%) are family households, while 1,024 (35.1%) are nonfamily households. The most numerous type of family households are 2-person households, comprising 636, and the most common type of nonfamily households are 1-person households, comprising 971.
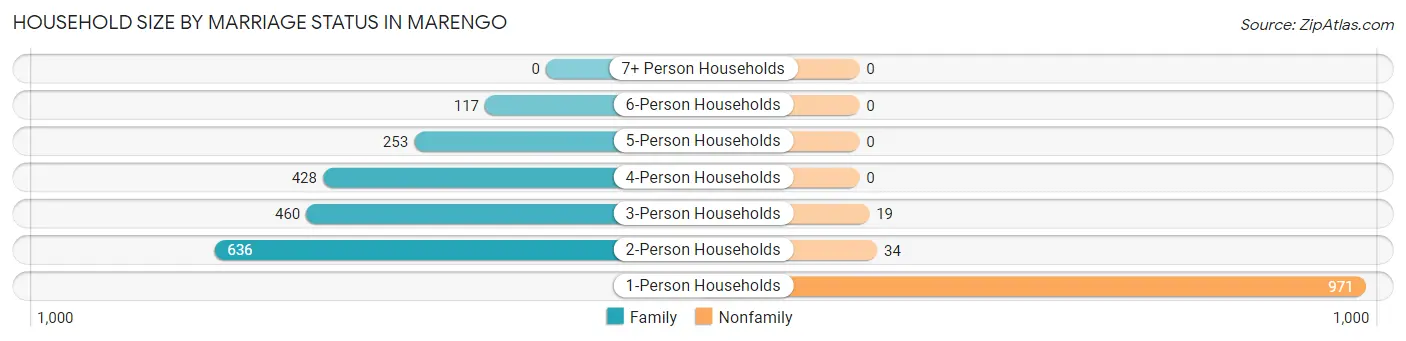
| Household Size | Family Households | Nonfamily Households |
| 1-Person Households | - | 971 (33.3%) |
| 2-Person Households | 636 (21.8%) | 34 (1.2%) |
| 3-Person Households | 460 (15.8%) | 19 (0.6%) |
| 4-Person Households | 428 (14.7%) | 0 (0.0%) |
| 5-Person Households | 253 (8.7%) | 0 (0.0%) |
| 6-Person Households | 117 (4.0%) | 0 (0.0%) |
| 7+ Person Households | 0 (0.0%) | 0 (0.0%) |
| Total | 1,894 (64.9%) | 1,024 (35.1%) |
Female Fertility in Marengo
Fertility by Age in Marengo
Average fertility rate in Marengo is 119.0 births per 1,000 women. Women in the age bracket of 20 to 34 years have the highest fertility rate with 161.0 births per 1,000 women. Women in the age bracket of 20 to 34 years acount for 91.2% of all women with births.
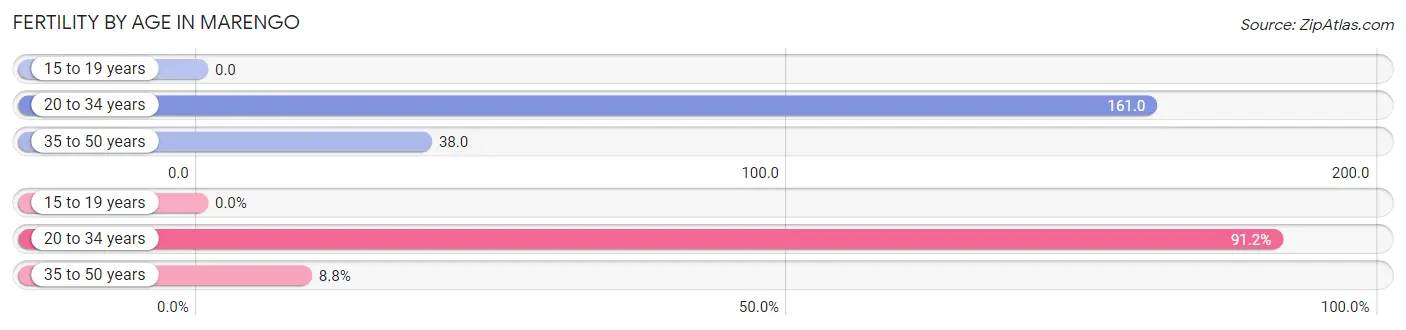
| Age Bracket | Women with Births | Births / 1,000 Women |
| 15 to 19 years | 0 (0.0%) | 0.0 |
| 20 to 34 years | 176 (91.2%) | 161.0 |
| 35 to 50 years | 17 (8.8%) | 38.0 |
| Total | 193 (100.0%) | 119.0 |
Fertility by Age by Marriage Status in Marengo
40.9% of women with births (193) in Marengo are married. The highest percentage of unmarried women with births falls into 20 to 34 years age bracket with 64.8% of them unmarried at the time of birth, while the lowest percentage of unmarried women with births belong to 35 to 50 years age bracket with 0.0% of them unmarried.
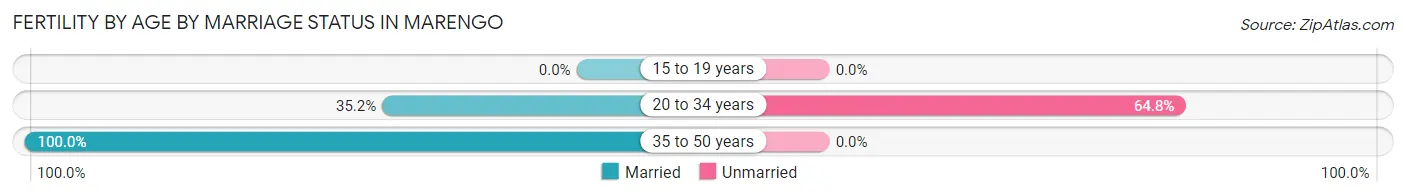
| Age Bracket | Married | Unmarried |
| 15 to 19 years | 0 (0.0%) | 0 (0.0%) |
| 20 to 34 years | 62 (35.2%) | 114 (64.8%) |
| 35 to 50 years | 17 (100.0%) | 0 (0.0%) |
| Total | 79 (40.9%) | 114 (59.1%) |
Fertility by Education in Marengo
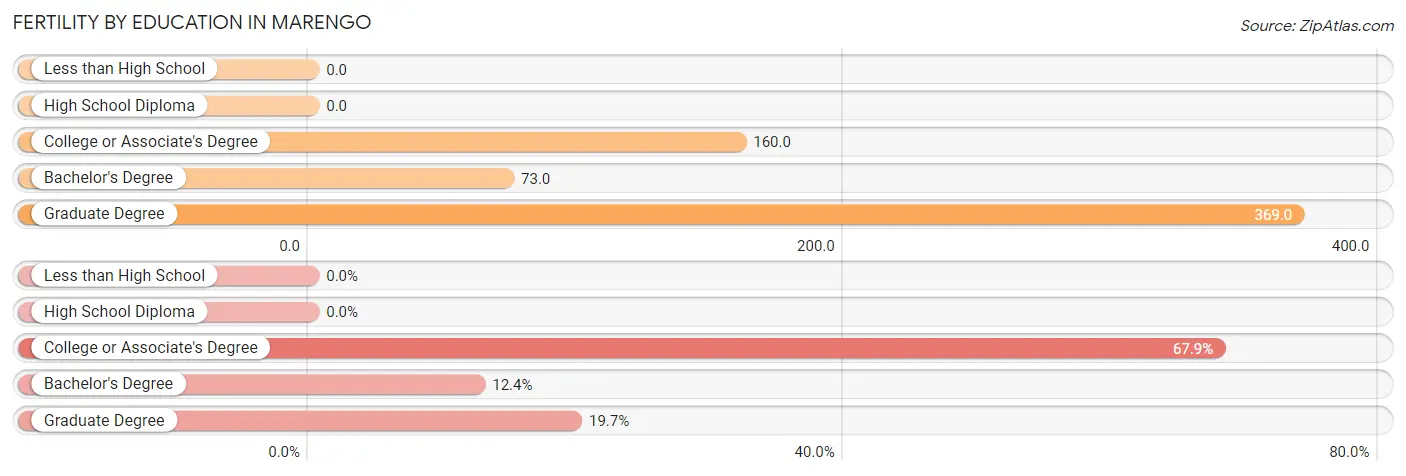
| Educational Attainment | Women with Births | Births / 1,000 Women |
| Less than High School | 0 (0.0%) | 0.0 |
| High School Diploma | 0 (0.0%) | 0.0 |
| College or Associate's Degree | 131 (67.9%) | 160.0 |
| Bachelor's Degree | 24 (12.4%) | 73.0 |
| Graduate Degree | 38 (19.7%) | 369.0 |
| Total | 193 (100.0%) | 119.0 |
Fertility by Education by Marriage Status in Marengo
59.1% of women with births in Marengo are unmarried. Women with the educational attainment of bachelor's degree are most likely to be married with 100.0% of them married at childbirth, while women with the educational attainment of college or associate's degree are least likely to be married with 87.0% of them unmarried at childbirth.
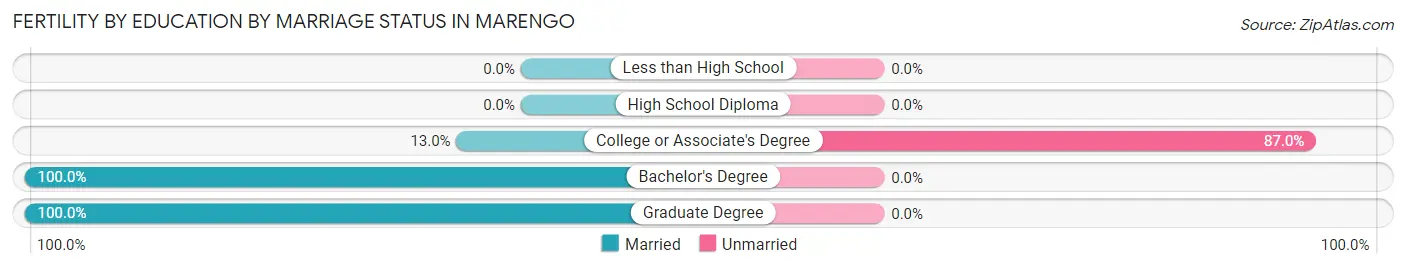
| Educational Attainment | Married | Unmarried |
| Less than High School | 0 (0.0%) | 0 (0.0%) |
| High School Diploma | 0 (0.0%) | 0 (0.0%) |
| College or Associate's Degree | 17 (13.0%) | 114 (87.0%) |
| Bachelor's Degree | 24 (100.0%) | 0 (0.0%) |
| Graduate Degree | 38 (100.0%) | 0 (0.0%) |
| Total | 79 (40.9%) | 114 (59.1%) |
Employment Characteristics in Marengo
Employment by Class of Employer in Marengo
Among the 3,688 employed individuals in Marengo, private company employees (2,798 | 75.9%), local government employees (374 | 10.1%), and not-for-profit organizations (155 | 4.2%) make up the most common classes of employment.
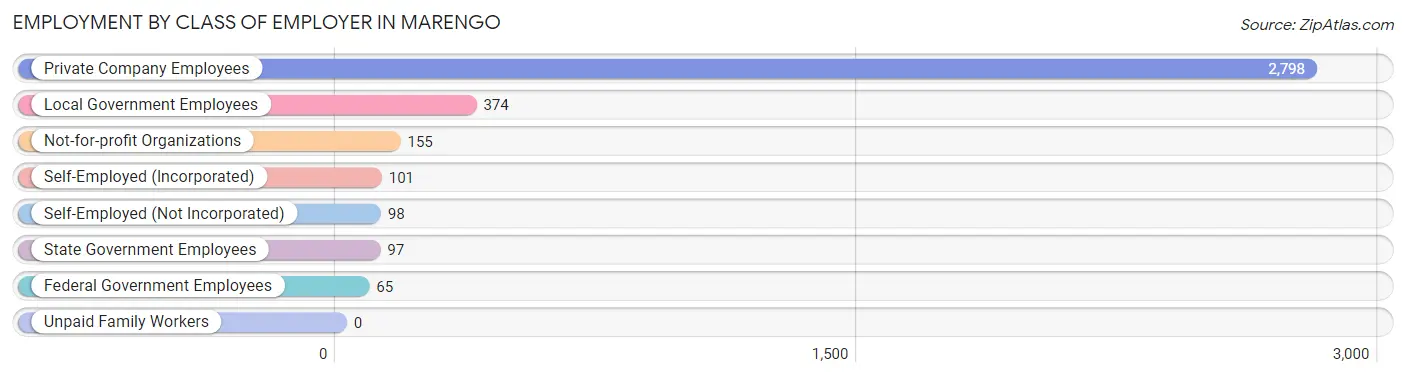
| Employer Class | # Employees | % Employees |
| Private Company Employees | 2,798 | 75.9% |
| Self-Employed (Incorporated) | 101 | 2.7% |
| Self-Employed (Not Incorporated) | 98 | 2.7% |
| Not-for-profit Organizations | 155 | 4.2% |
| Local Government Employees | 374 | 10.1% |
| State Government Employees | 97 | 2.6% |
| Federal Government Employees | 65 | 1.8% |
| Unpaid Family Workers | 0 | 0.0% |
| Total | 3,688 | 100.0% |
Employment Status by Age in Marengo
According to the labor force statistics for Marengo, out of the total population over 16 years of age (5,800), 68.4% or 3,967 individuals are in the labor force, with 7.1% or 282 of them unemployed. The age group with the highest labor force participation rate is 25 to 29 years, with 97.3% or 900 individuals in the labor force. Within the labor force, the 60 to 64 years age range has the highest percentage of unemployed individuals, with 24.8% or 86 of them being unemployed.
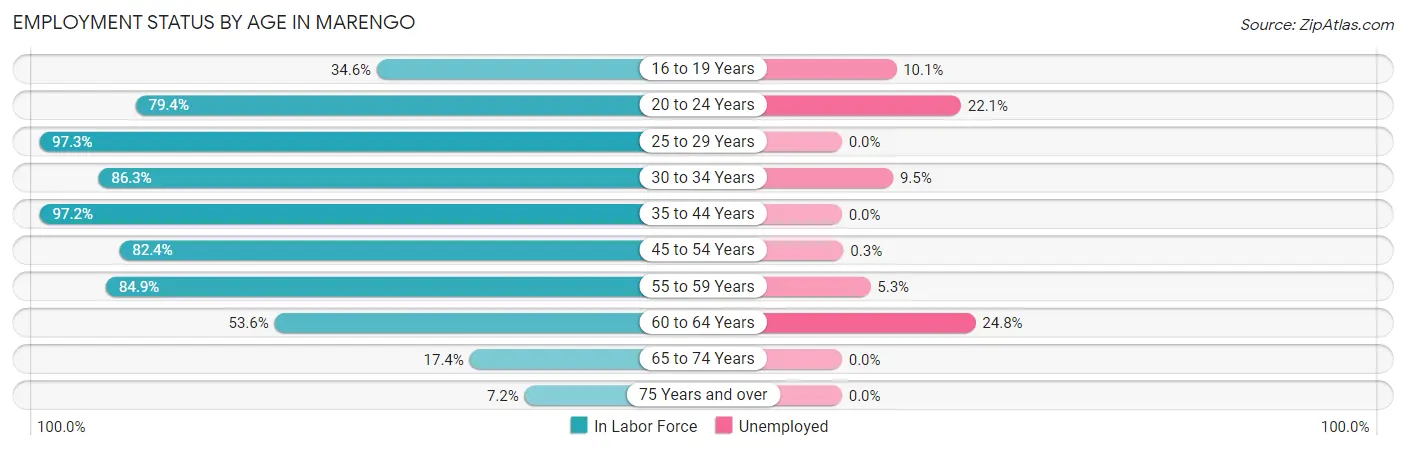
| Age Bracket | In Labor Force | Unemployed |
| 16 to 19 Years | 89 (34.6%) | 9 (10.1%) |
| 20 to 24 Years | 602 (79.4%) | 133 (22.1%) |
| 25 to 29 Years | 900 (97.3%) | 0 (0.0%) |
| 30 to 34 Years | 379 (86.3%) | 36 (9.5%) |
| 35 to 44 Years | 559 (97.2%) | 0 (0.0%) |
| 45 to 54 Years | 624 (82.4%) | 2 (0.3%) |
| 55 to 59 Years | 338 (84.9%) | 18 (5.3%) |
| 60 to 64 Years | 347 (53.6%) | 86 (24.8%) |
| 65 to 74 Years | 93 (17.4%) | 0 (0.0%) |
| 75 Years and over | 37 (7.2%) | 0 (0.0%) |
| Total | 3,967 (68.4%) | 282 (7.1%) |
Employment Status by Educational Attainment in Marengo
According to labor force statistics for Marengo, 84.1% of individuals (3,146) out of the total population between 25 and 64 years of age (3,741) are in the labor force, with 4.5% or 142 of them being unemployed. The group with the highest labor force participation rate are those with the educational attainment of less than high school, with 98.2% or 268 individuals in the labor force. Within the labor force, individuals with less than high school education have the highest percentage of unemployment, with 14.6% or 39 of them being unemployed.
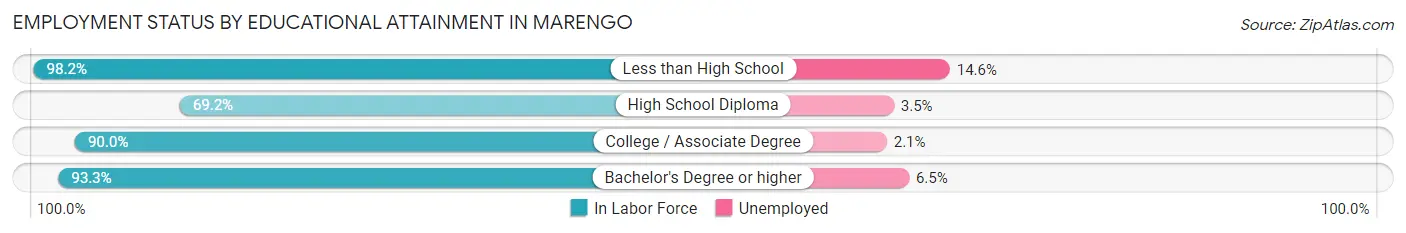
| Educational Attainment | In Labor Force | Unemployed |
| Less than High School | 268 (98.2%) | 40 (14.6%) |
| High School Diploma | 888 (69.2%) | 45 (3.5%) |
| College / Associate Degree | 1,298 (90.0%) | 30 (2.1%) |
| Bachelor's Degree or higher | 693 (93.3%) | 48 (6.5%) |
| Total | 3,146 (84.1%) | 168 (4.5%) |
Employment Occupations by Sex in Marengo
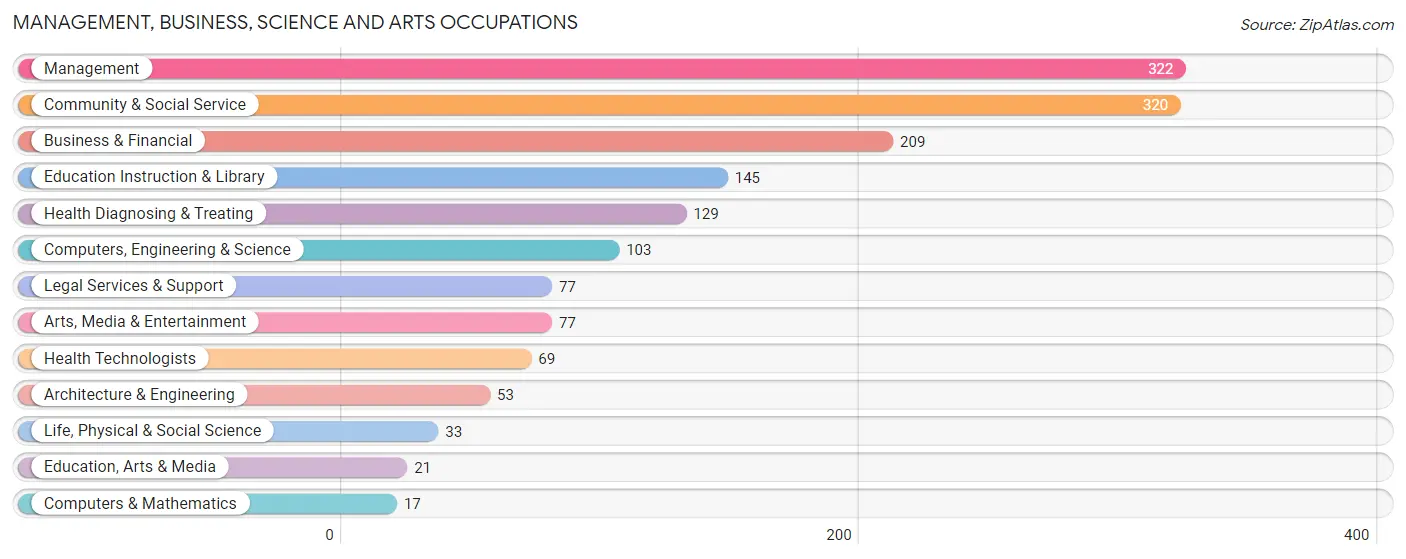
Management, Business, Science and Arts Occupations
The most common Management, Business, Science and Arts occupations in Marengo are Management (322 | 8.8%), Community & Social Service (320 | 8.7%), Business & Financial (209 | 5.7%), Education Instruction & Library (145 | 4.0%), and Health Diagnosing & Treating (129 | 3.5%).
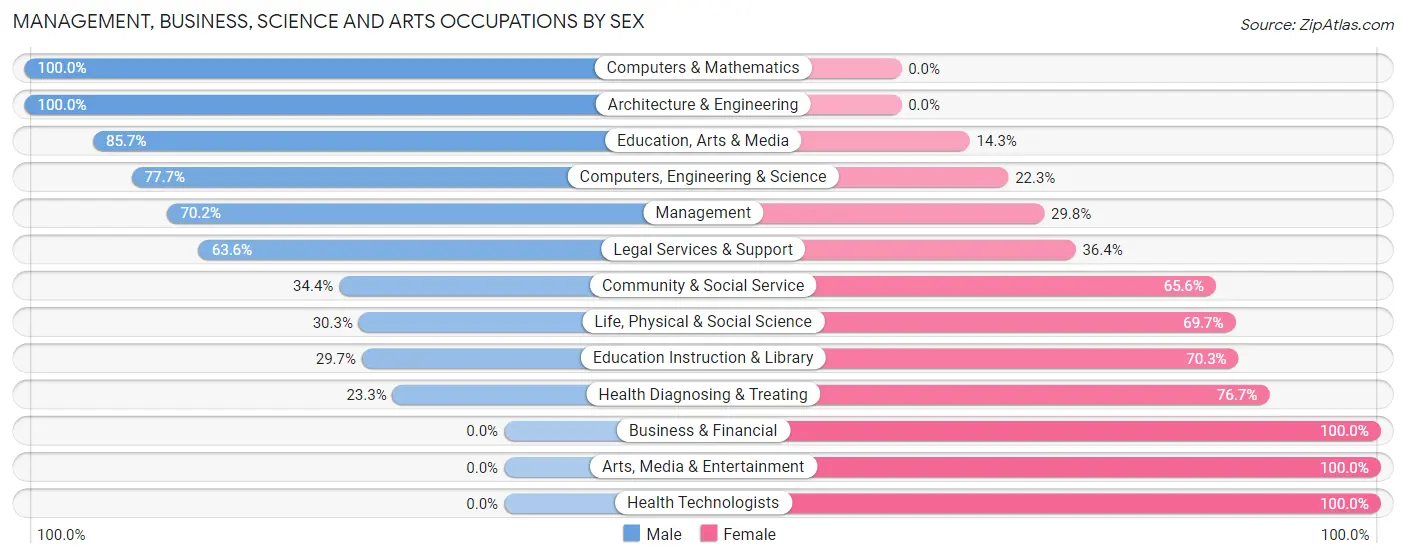
Management, Business, Science and Arts Occupations by Sex
Within the Management, Business, Science and Arts occupations in Marengo, the most male-oriented occupations are Computers & Mathematics (100.0%), Architecture & Engineering (100.0%), and Education, Arts & Media (85.7%), while the most female-oriented occupations are Business & Financial (100.0%), Arts, Media & Entertainment (100.0%), and Health Technologists (100.0%).
| Occupation | Male | Female |
| Management | 226 (70.2%) | 96 (29.8%) |
| Business & Financial | 0 (0.0%) | 209 (100.0%) |
| Computers, Engineering & Science | 80 (77.7%) | 23 (22.3%) |
| Computers & Mathematics | 17 (100.0%) | 0 (0.0%) |
| Architecture & Engineering | 53 (100.0%) | 0 (0.0%) |
| Life, Physical & Social Science | 10 (30.3%) | 23 (69.7%) |
| Community & Social Service | 110 (34.4%) | 210 (65.6%) |
| Education, Arts & Media | 18 (85.7%) | 3 (14.3%) |
| Legal Services & Support | 49 (63.6%) | 28 (36.4%) |
| Education Instruction & Library | 43 (29.7%) | 102 (70.3%) |
| Arts, Media & Entertainment | 0 (0.0%) | 77 (100.0%) |
| Health Diagnosing & Treating | 30 (23.3%) | 99 (76.7%) |
| Health Technologists | 0 (0.0%) | 69 (100.0%) |
| Total (Category) | 446 (41.2%) | 637 (58.8%) |
| Total (Overall) | 2,019 (55.0%) | 1,652 (45.0%) |
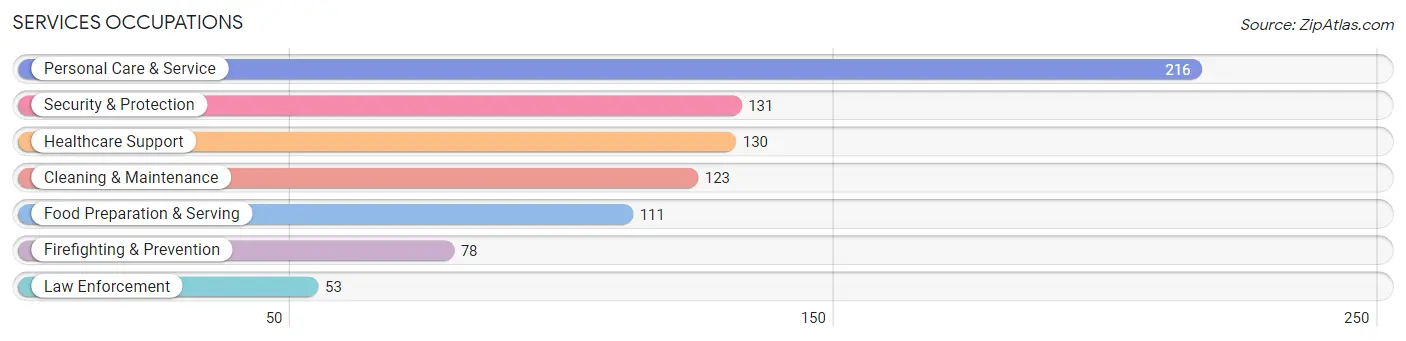
Services Occupations
The most common Services occupations in Marengo are Personal Care & Service (216 | 5.9%), Security & Protection (131 | 3.6%), Healthcare Support (130 | 3.5%), Cleaning & Maintenance (123 | 3.4%), and Food Preparation & Serving (111 | 3.0%).
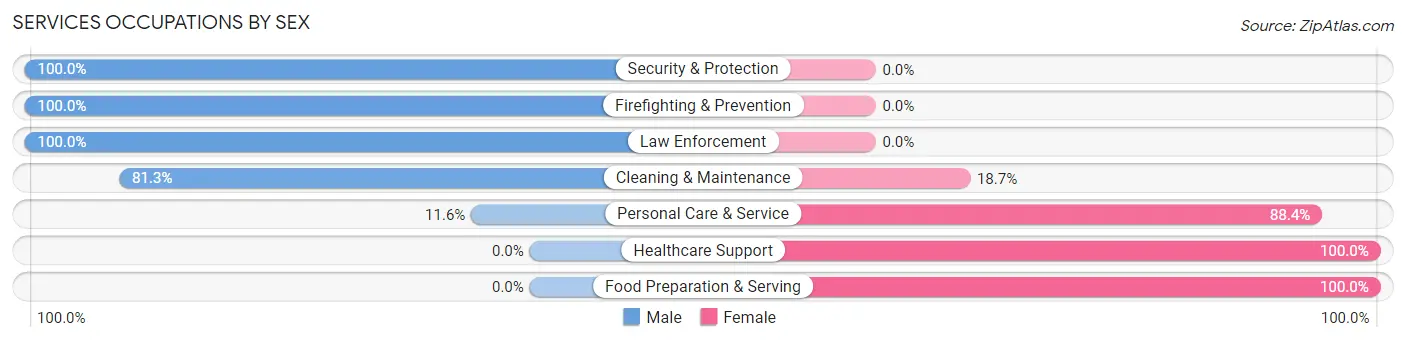
Services Occupations by Sex
Within the Services occupations in Marengo, the most male-oriented occupations are Security & Protection (100.0%), Firefighting & Prevention (100.0%), and Law Enforcement (100.0%), while the most female-oriented occupations are Healthcare Support (100.0%), Food Preparation & Serving (100.0%), and Personal Care & Service (88.4%).
| Occupation | Male | Female |
| Healthcare Support | 0 (0.0%) | 130 (100.0%) |
| Security & Protection | 131 (100.0%) | 0 (0.0%) |
| Firefighting & Prevention | 78 (100.0%) | 0 (0.0%) |
| Law Enforcement | 53 (100.0%) | 0 (0.0%) |
| Food Preparation & Serving | 0 (0.0%) | 111 (100.0%) |
| Cleaning & Maintenance | 100 (81.3%) | 23 (18.7%) |
| Personal Care & Service | 25 (11.6%) | 191 (88.4%) |
| Total (Category) | 256 (36.0%) | 455 (64.0%) |
| Total (Overall) | 2,019 (55.0%) | 1,652 (45.0%) |
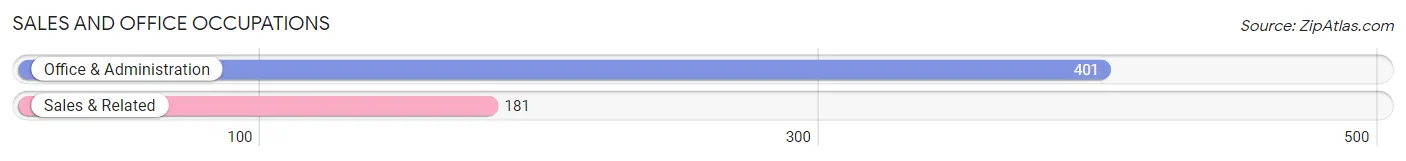
Sales and Office Occupations
The most common Sales and Office occupations in Marengo are Office & Administration (401 | 10.9%), and Sales & Related (181 | 4.9%).
Sales and Office Occupations by Sex
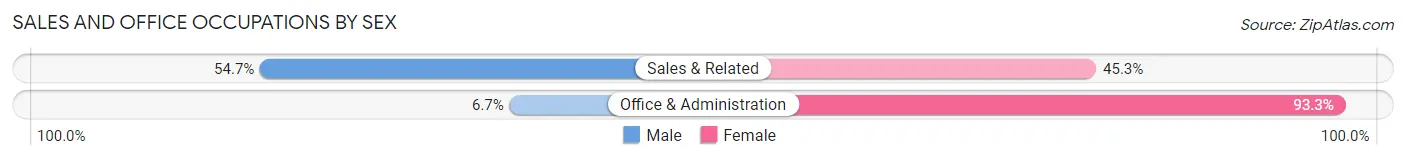
| Occupation | Male | Female |
| Sales & Related | 99 (54.7%) | 82 (45.3%) |
| Office & Administration | 27 (6.7%) | 374 (93.3%) |
| Total (Category) | 126 (21.6%) | 456 (78.3%) |
| Total (Overall) | 2,019 (55.0%) | 1,652 (45.0%) |
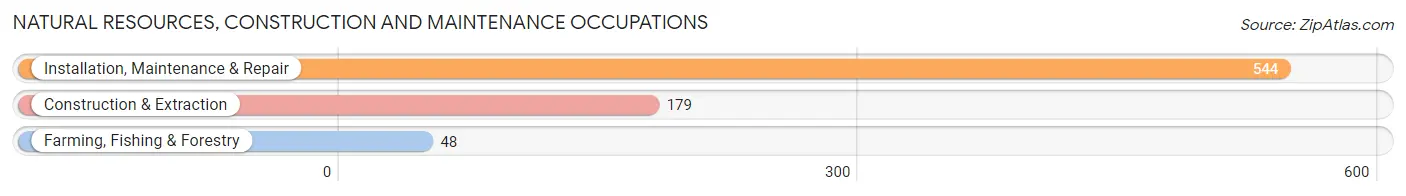
Natural Resources, Construction and Maintenance Occupations
The most common Natural Resources, Construction and Maintenance occupations in Marengo are Installation, Maintenance & Repair (544 | 14.8%), Construction & Extraction (179 | 4.9%), and Farming, Fishing & Forestry (48 | 1.3%).
Natural Resources, Construction and Maintenance Occupations by Sex
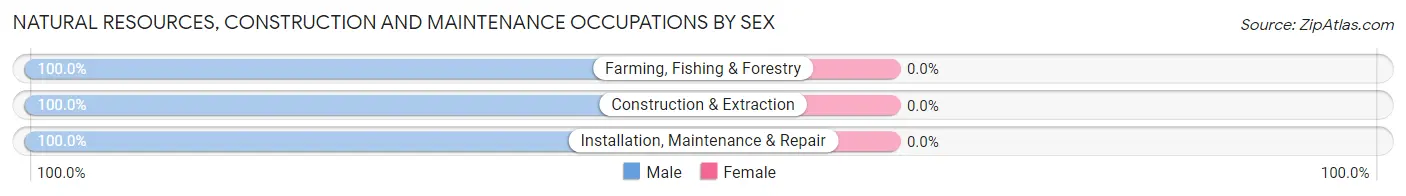
| Occupation | Male | Female |
| Farming, Fishing & Forestry | 48 (100.0%) | 0 (0.0%) |
| Construction & Extraction | 179 (100.0%) | 0 (0.0%) |
| Installation, Maintenance & Repair | 544 (100.0%) | 0 (0.0%) |
| Total (Category) | 771 (100.0%) | 0 (0.0%) |
| Total (Overall) | 2,019 (55.0%) | 1,652 (45.0%) |
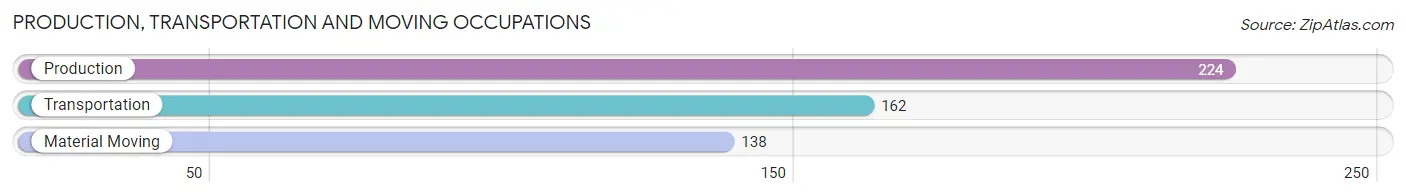
Production, Transportation and Moving Occupations
The most common Production, Transportation and Moving occupations in Marengo are Production (224 | 6.1%), Transportation (162 | 4.4%), and Material Moving (138 | 3.8%).
Production, Transportation and Moving Occupations by Sex
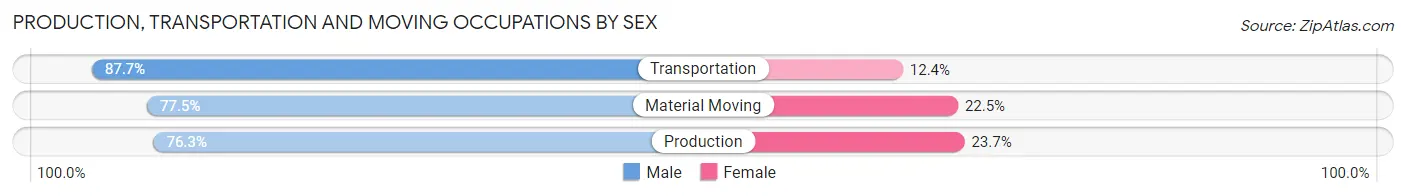
| Occupation | Male | Female |
| Production | 171 (76.3%) | 53 (23.7%) |
| Transportation | 142 (87.6%) | 20 (12.3%) |
| Material Moving | 107 (77.5%) | 31 (22.5%) |
| Total (Category) | 420 (80.1%) | 104 (19.9%) |
| Total (Overall) | 2,019 (55.0%) | 1,652 (45.0%) |
Employment Industries by Sex in Marengo
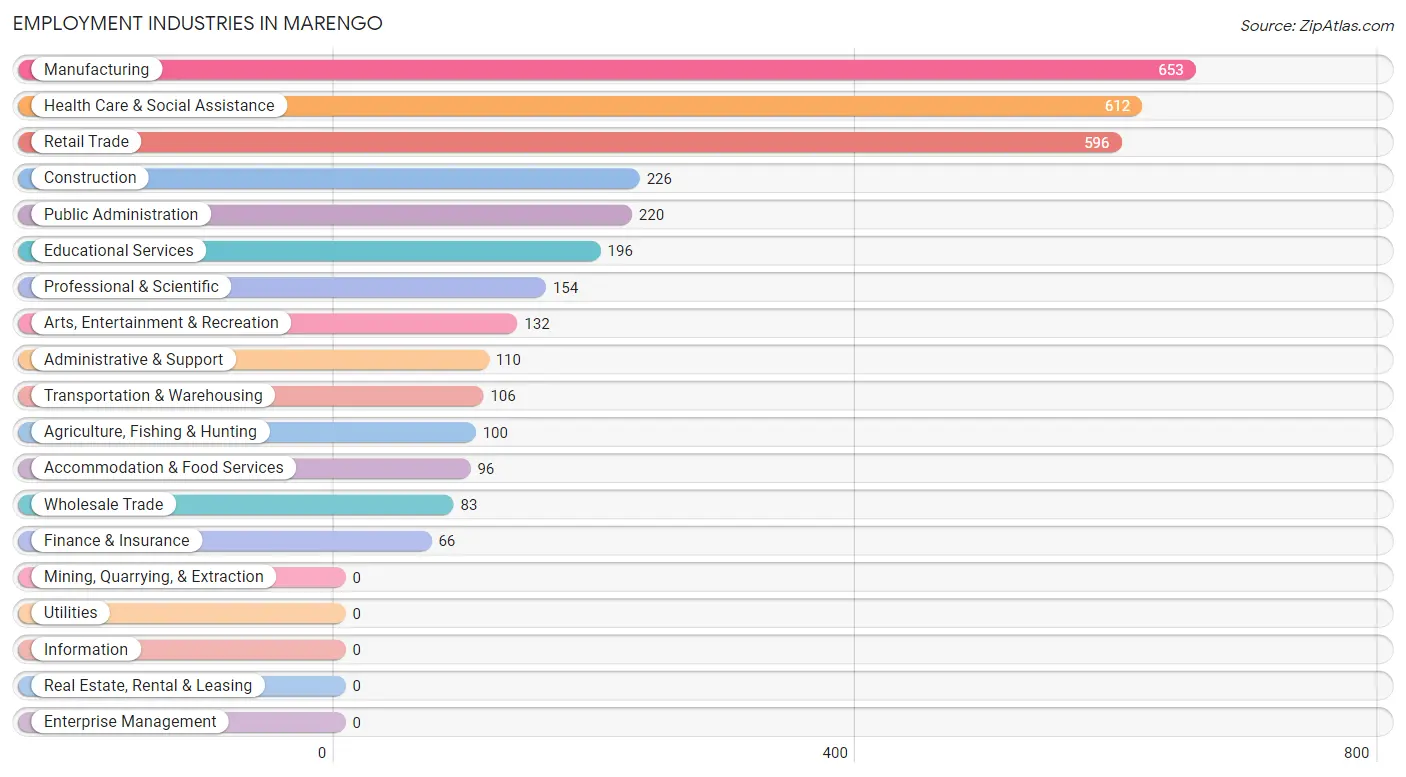
Employment Industries in Marengo
The major employment industries in Marengo include Manufacturing (653 | 17.8%), Health Care & Social Assistance (612 | 16.7%), Retail Trade (596 | 16.2%), Construction (226 | 6.2%), and Public Administration (220 | 6.0%).
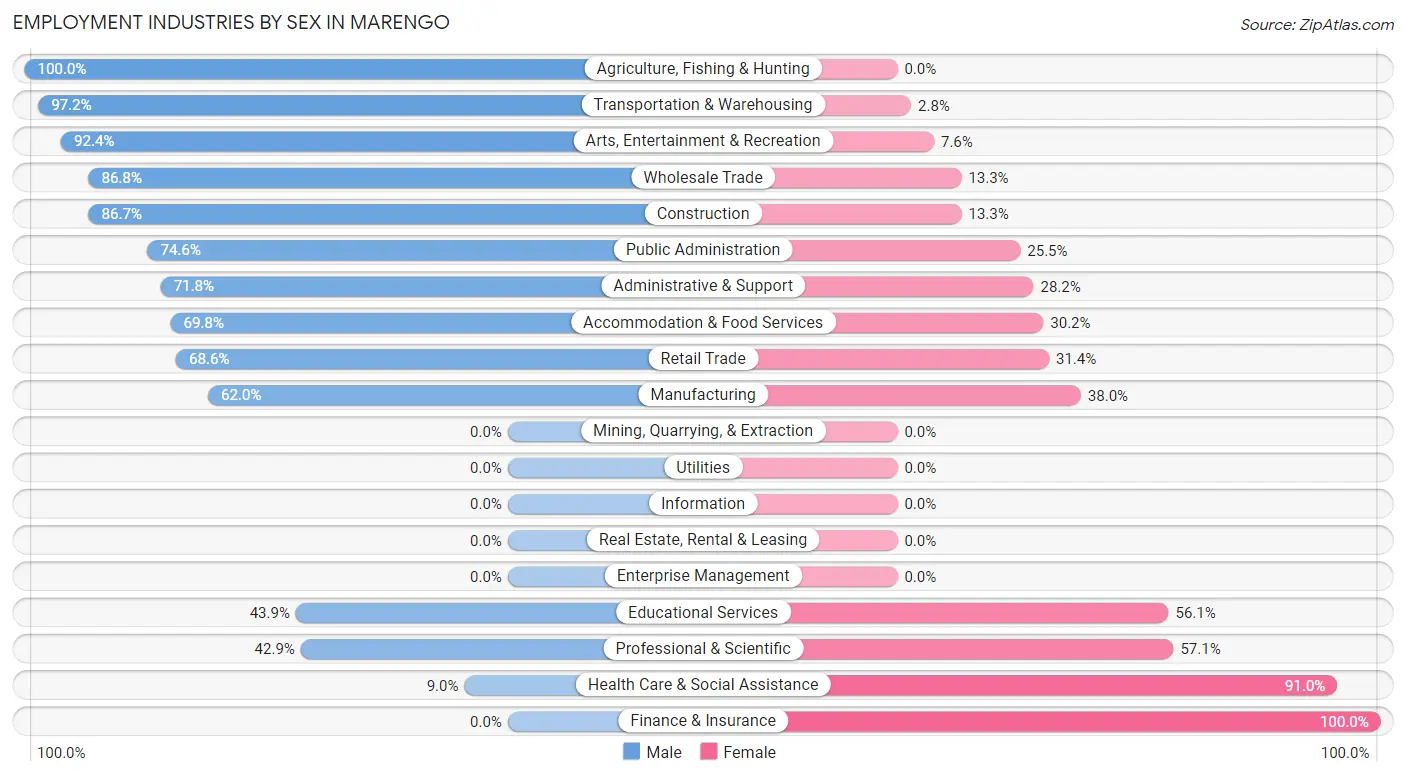
Employment Industries by Sex in Marengo
The Marengo industries that see more men than women are Agriculture, Fishing & Hunting (100.0%), Transportation & Warehousing (97.2%), and Arts, Entertainment & Recreation (92.4%), whereas the industries that tend to have a higher number of women are Finance & Insurance (100.0%), Health Care & Social Assistance (91.0%), and Professional & Scientific (57.1%).
| Industry | Male | Female |
| Agriculture, Fishing & Hunting | 100 (100.0%) | 0 (0.0%) |
| Mining, Quarrying, & Extraction | 0 (0.0%) | 0 (0.0%) |
| Construction | 196 (86.7%) | 30 (13.3%) |
| Manufacturing | 405 (62.0%) | 248 (38.0%) |
| Wholesale Trade | 72 (86.8%) | 11 (13.3%) |
| Retail Trade | 409 (68.6%) | 187 (31.4%) |
| Transportation & Warehousing | 103 (97.2%) | 3 (2.8%) |
| Utilities | 0 (0.0%) | 0 (0.0%) |
| Information | 0 (0.0%) | 0 (0.0%) |
| Finance & Insurance | 0 (0.0%) | 66 (100.0%) |
| Real Estate, Rental & Leasing | 0 (0.0%) | 0 (0.0%) |
| Professional & Scientific | 66 (42.9%) | 88 (57.1%) |
| Enterprise Management | 0 (0.0%) | 0 (0.0%) |
| Administrative & Support | 79 (71.8%) | 31 (28.2%) |
| Educational Services | 86 (43.9%) | 110 (56.1%) |
| Health Care & Social Assistance | 55 (9.0%) | 557 (91.0%) |
| Arts, Entertainment & Recreation | 122 (92.4%) | 10 (7.6%) |
| Accommodation & Food Services | 67 (69.8%) | 29 (30.2%) |
| Public Administration | 164 (74.6%) | 56 (25.5%) |
| Total | 2,019 (55.0%) | 1,652 (45.0%) |
Education in Marengo
School Enrollment in Marengo
The most common levels of schooling among the 1,490 students in Marengo are middle school (329 | 22.1%), kindergarten (309 | 20.7%), and college / undergraduate (285 | 19.1%).
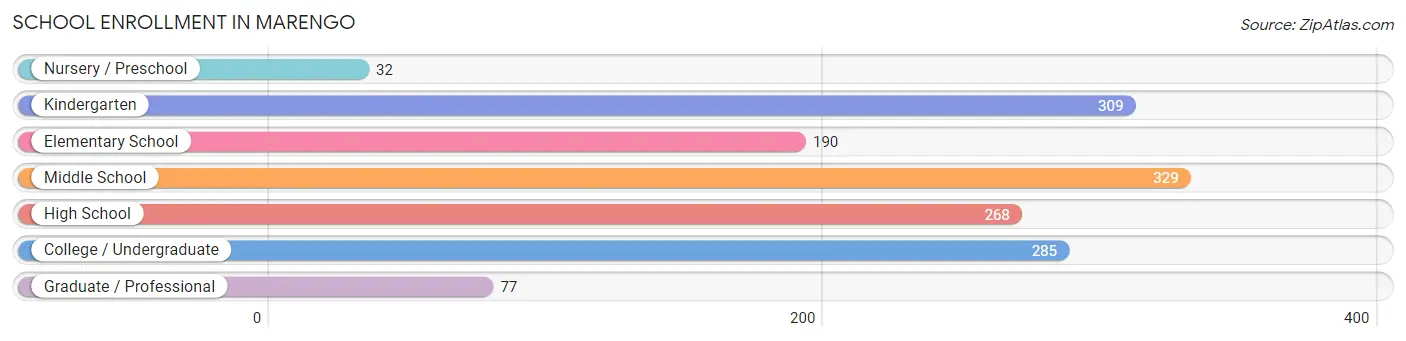
| School Level | # Students | % Students |
| Nursery / Preschool | 32 | 2.1% |
| Kindergarten | 309 | 20.7% |
| Elementary School | 190 | 12.8% |
| Middle School | 329 | 22.1% |
| High School | 268 | 18.0% |
| College / Undergraduate | 285 | 19.1% |
| Graduate / Professional | 77 | 5.2% |
| Total | 1,490 | 100.0% |
School Enrollment by Age by Funding Source in Marengo
Out of a total of 1,490 students who are enrolled in schools in Marengo, 198 (13.3%) attend a private institution, while the remaining 1,292 (86.7%) are enrolled in public schools. The age group of 25 to 34 year olds has the highest likelihood of being enrolled in private schools, with 50 (45.5% in the age bracket) enrolled. Conversely, the age group of 35 years and over has the lowest likelihood of being enrolled in a private school, with 25 (96.2% in the age bracket) attending a public institution.
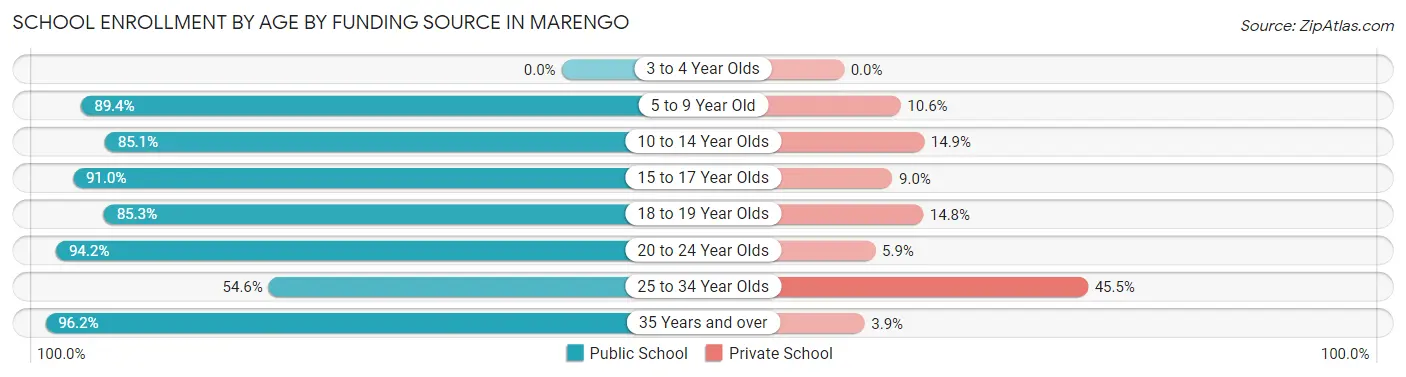
| Age Bracket | Public School | Private School |
| 3 to 4 Year Olds | 0 (0.0%) | 0 (0.0%) |
| 5 to 9 Year Old | 457 (89.4%) | 54 (10.6%) |
| 10 to 14 Year Olds | 279 (85.1%) | 49 (14.9%) |
| 15 to 17 Year Olds | 242 (91.0%) | 24 (9.0%) |
| 18 to 19 Year Olds | 52 (85.3%) | 9 (14.7%) |
| 20 to 24 Year Olds | 177 (94.2%) | 11 (5.9%) |
| 25 to 34 Year Olds | 60 (54.5%) | 50 (45.5%) |
| 35 Years and over | 25 (96.2%) | 1 (3.8%) |
| Total | 1,292 (86.7%) | 198 (13.3%) |
Educational Attainment by Field of Study in Marengo
Business (213 | 23.9%), education (157 | 17.6%), social sciences (108 | 12.1%), science & technology (104 | 11.7%), and bio, nature & agricultural (95 | 10.7%) are the most common fields of study among 891 individuals in Marengo who have obtained a bachelor's degree or higher.
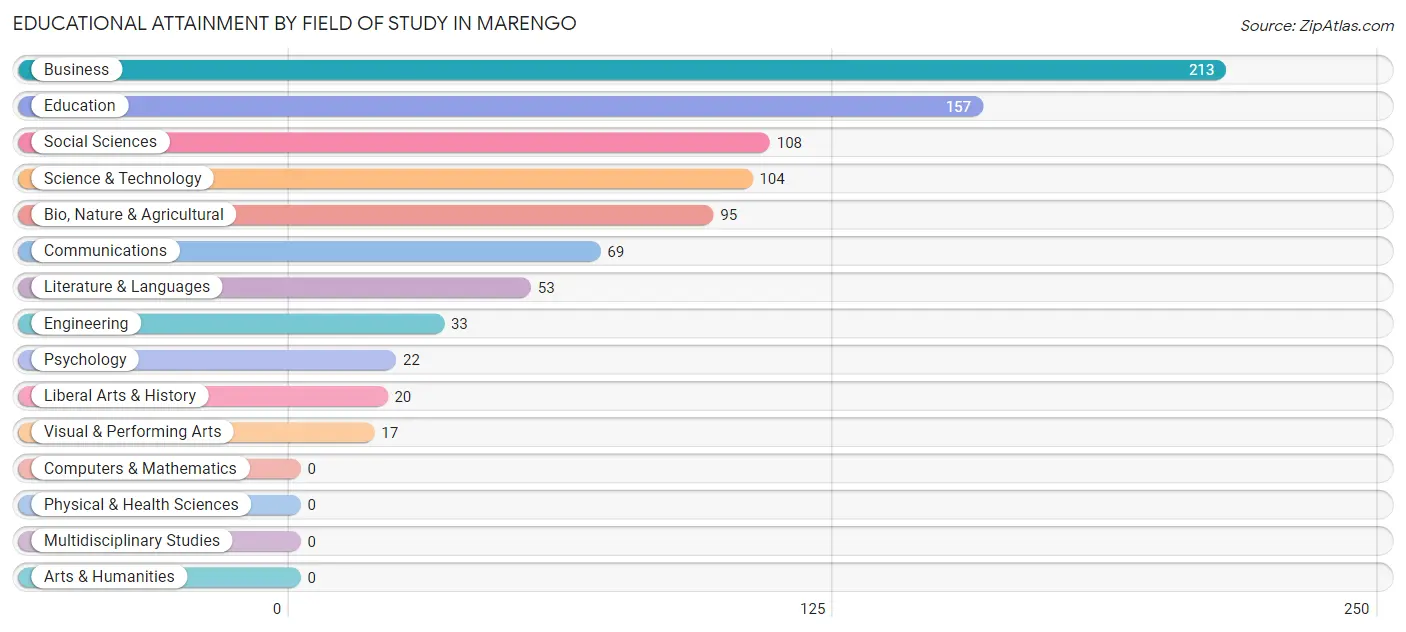
| Field of Study | # Graduates | % Graduates |
| Computers & Mathematics | 0 | 0.0% |
| Bio, Nature & Agricultural | 95 | 10.7% |
| Physical & Health Sciences | 0 | 0.0% |
| Psychology | 22 | 2.5% |
| Social Sciences | 108 | 12.1% |
| Engineering | 33 | 3.7% |
| Multidisciplinary Studies | 0 | 0.0% |
| Science & Technology | 104 | 11.7% |
| Business | 213 | 23.9% |
| Education | 157 | 17.6% |
| Literature & Languages | 53 | 5.9% |
| Liberal Arts & History | 20 | 2.2% |
| Visual & Performing Arts | 17 | 1.9% |
| Communications | 69 | 7.7% |
| Arts & Humanities | 0 | 0.0% |
| Total | 891 | 100.0% |
Transportation & Commute in Marengo
Vehicle Availability by Sex in Marengo
The most prevalent vehicle ownership categories in Marengo are males with 2 vehicles (648, accounting for 32.1%) and females with 2 vehicles (540, making up 38.9%).
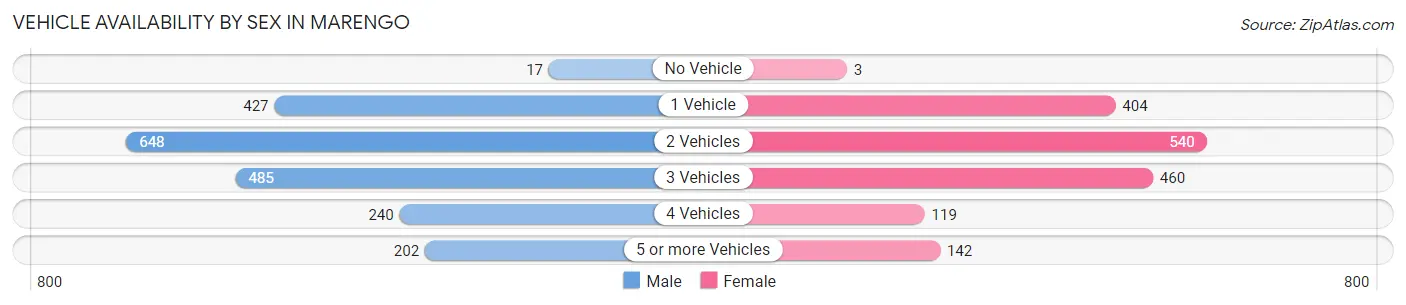
| Vehicles Available | Male | Female |
| No Vehicle | 17 (0.8%) | 3 (0.2%) |
| 1 Vehicle | 427 (21.1%) | 404 (24.2%) |
| 2 Vehicles | 648 (32.1%) | 540 (32.4%) |
| 3 Vehicles | 485 (24.0%) | 460 (27.6%) |
| 4 Vehicles | 240 (11.9%) | 119 (7.1%) |
| 5 or more Vehicles | 202 (10.0%) | 142 (8.5%) |
| Total | 2,019 (100.0%) | 1,668 (100.0%) |
Commute Time in Marengo
The most frequently occuring commute durations in Marengo are 5 to 9 minutes (722 commuters, 19.9%), 25 to 29 minutes (528 commuters, 14.6%), and 30 to 34 minutes (466 commuters, 12.9%).
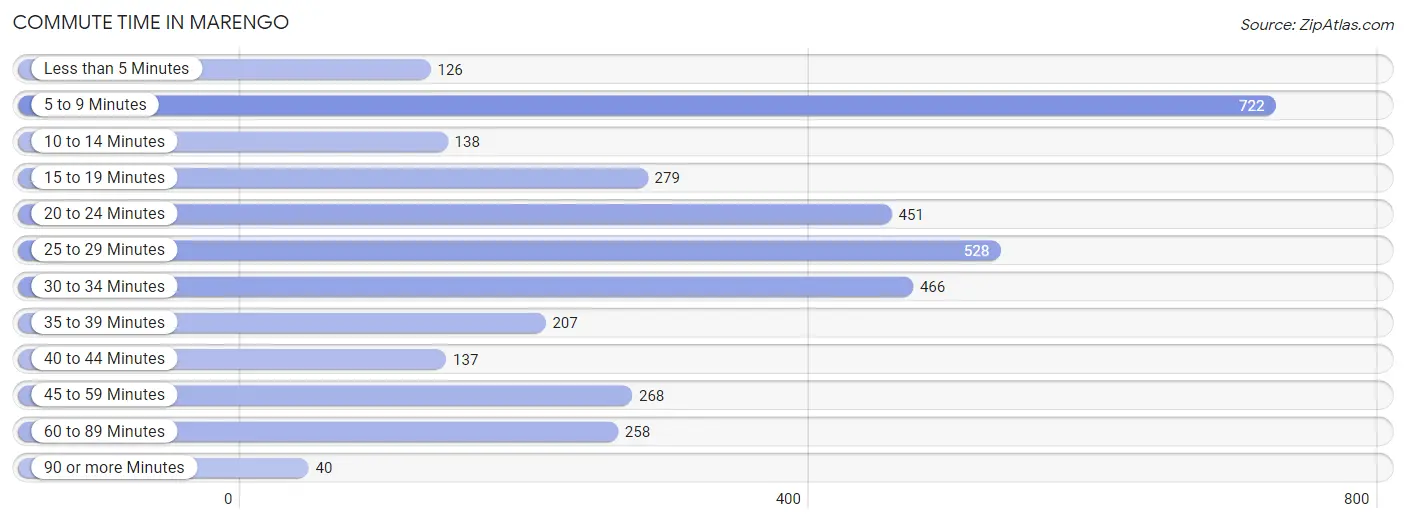
| Commute Time | # Commuters | % Commuters |
| Less than 5 Minutes | 126 | 3.5% |
| 5 to 9 Minutes | 722 | 19.9% |
| 10 to 14 Minutes | 138 | 3.8% |
| 15 to 19 Minutes | 279 | 7.7% |
| 20 to 24 Minutes | 451 | 12.5% |
| 25 to 29 Minutes | 528 | 14.6% |
| 30 to 34 Minutes | 466 | 12.9% |
| 35 to 39 Minutes | 207 | 5.7% |
| 40 to 44 Minutes | 137 | 3.8% |
| 45 to 59 Minutes | 268 | 7.4% |
| 60 to 89 Minutes | 258 | 7.1% |
| 90 or more Minutes | 40 | 1.1% |
Commute Time by Sex in Marengo
The most common commute times in Marengo are 5 to 9 minutes (516 commuters, 25.9%) for males and 25 to 29 minutes (452 commuters, 27.8%) for females.
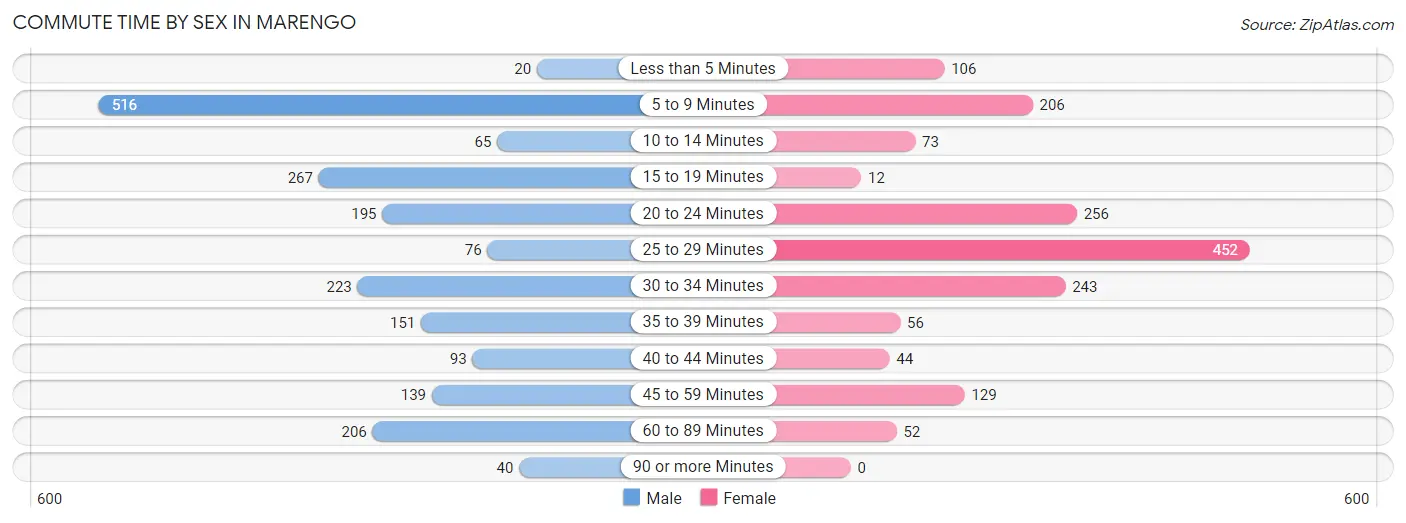
| Commute Time | Male | Female |
| Less than 5 Minutes | 20 (1.0%) | 106 (6.5%) |
| 5 to 9 Minutes | 516 (25.9%) | 206 (12.7%) |
| 10 to 14 Minutes | 65 (3.3%) | 73 (4.5%) |
| 15 to 19 Minutes | 267 (13.4%) | 12 (0.7%) |
| 20 to 24 Minutes | 195 (9.8%) | 256 (15.7%) |
| 25 to 29 Minutes | 76 (3.8%) | 452 (27.8%) |
| 30 to 34 Minutes | 223 (11.2%) | 243 (14.9%) |
| 35 to 39 Minutes | 151 (7.6%) | 56 (3.4%) |
| 40 to 44 Minutes | 93 (4.7%) | 44 (2.7%) |
| 45 to 59 Minutes | 139 (7.0%) | 129 (7.9%) |
| 60 to 89 Minutes | 206 (10.3%) | 52 (3.2%) |
| 90 or more Minutes | 40 (2.0%) | 0 (0.0%) |
Time of Departure to Work by Sex in Marengo
The most frequent times of departure to work in Marengo are 6:00 AM to 6:29 AM (375, 18.8%) for males and 7:00 AM to 7:29 AM (264, 16.2%) for females.
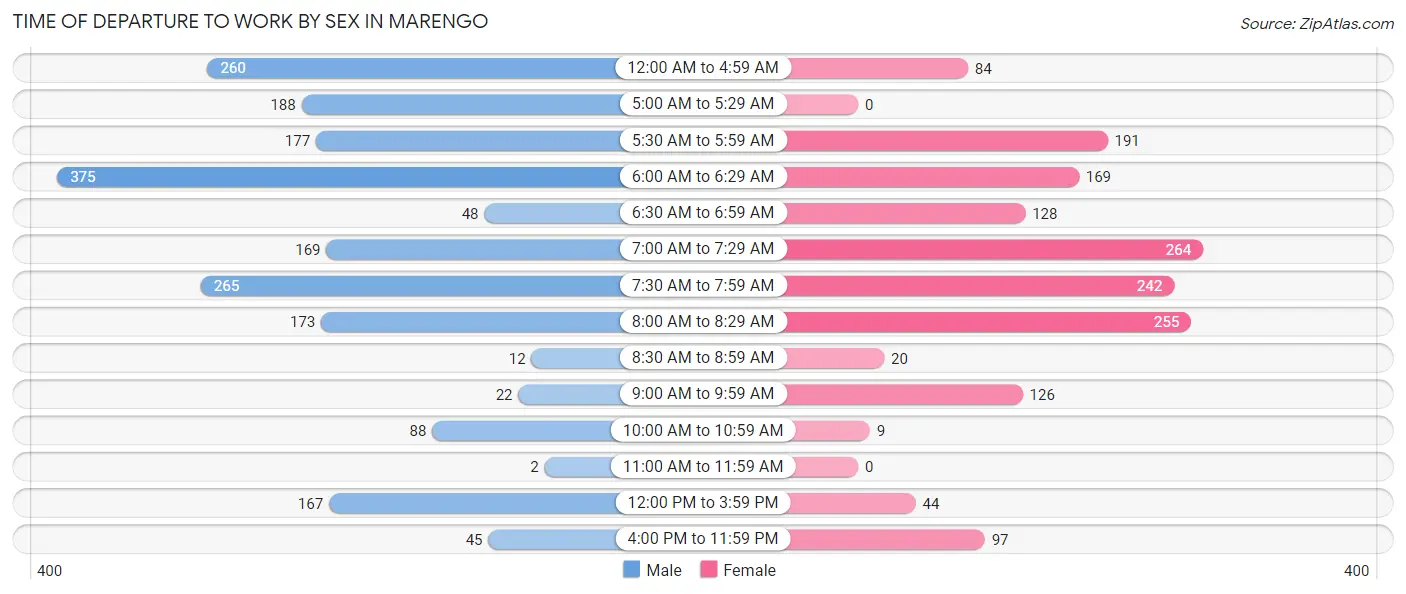
| Time of Departure | Male | Female |
| 12:00 AM to 4:59 AM | 260 (13.1%) | 84 (5.2%) |
| 5:00 AM to 5:29 AM | 188 (9.4%) | 0 (0.0%) |
| 5:30 AM to 5:59 AM | 177 (8.9%) | 191 (11.7%) |
| 6:00 AM to 6:29 AM | 375 (18.8%) | 169 (10.4%) |
| 6:30 AM to 6:59 AM | 48 (2.4%) | 128 (7.9%) |
| 7:00 AM to 7:29 AM | 169 (8.5%) | 264 (16.2%) |
| 7:30 AM to 7:59 AM | 265 (13.3%) | 242 (14.9%) |
| 8:00 AM to 8:29 AM | 173 (8.7%) | 255 (15.7%) |
| 8:30 AM to 8:59 AM | 12 (0.6%) | 20 (1.2%) |
| 9:00 AM to 9:59 AM | 22 (1.1%) | 126 (7.7%) |
| 10:00 AM to 10:59 AM | 88 (4.4%) | 9 (0.5%) |
| 11:00 AM to 11:59 AM | 2 (0.1%) | 0 (0.0%) |
| 12:00 PM to 3:59 PM | 167 (8.4%) | 44 (2.7%) |
| 4:00 PM to 11:59 PM | 45 (2.3%) | 97 (5.9%) |
| Total | 1,991 (100.0%) | 1,629 (100.0%) |
Housing Occupancy in Marengo
Occupancy by Ownership in Marengo
Of the total 2,918 dwellings in Marengo, owner-occupied units account for 1,843 (63.2%), while renter-occupied units make up 1,075 (36.8%).
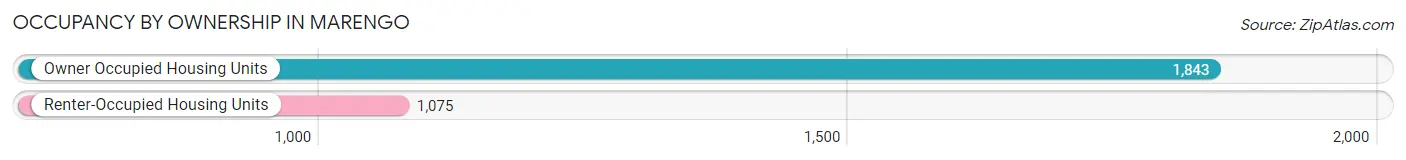
| Occupancy | # Housing Units | % Housing Units |
| Owner Occupied Housing Units | 1,843 | 63.2% |
| Renter-Occupied Housing Units | 1,075 | 36.8% |
| Total Occupied Housing Units | 2,918 | 100.0% |
Occupancy by Household Size in Marengo
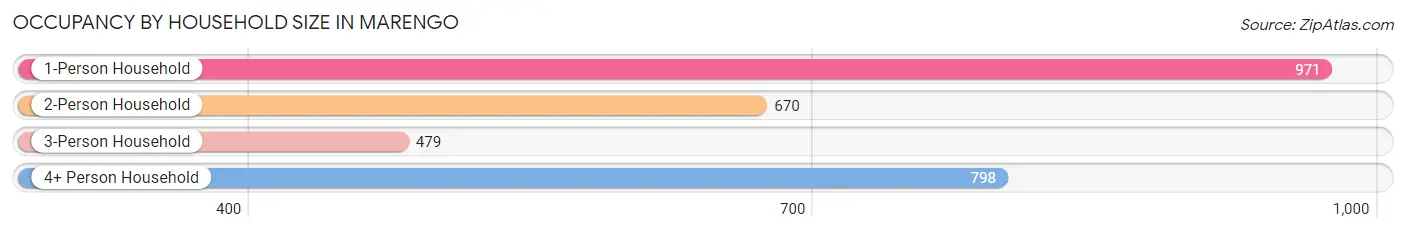
| Household Size | # Housing Units | % Housing Units |
| 1-Person Household | 971 | 33.3% |
| 2-Person Household | 670 | 23.0% |
| 3-Person Household | 479 | 16.4% |
| 4+ Person Household | 798 | 27.4% |
| Total Housing Units | 2,918 | 100.0% |
Occupancy by Ownership by Household Size in Marengo
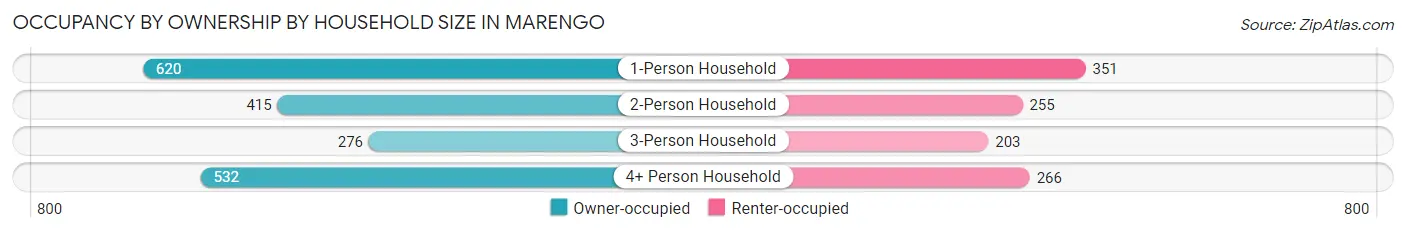
| Household Size | Owner-occupied | Renter-occupied |
| 1-Person Household | 620 (63.8%) | 351 (36.1%) |
| 2-Person Household | 415 (61.9%) | 255 (38.1%) |
| 3-Person Household | 276 (57.6%) | 203 (42.4%) |
| 4+ Person Household | 532 (66.7%) | 266 (33.3%) |
| Total Housing Units | 1,843 (63.2%) | 1,075 (36.8%) |
Occupancy by Educational Attainment in Marengo
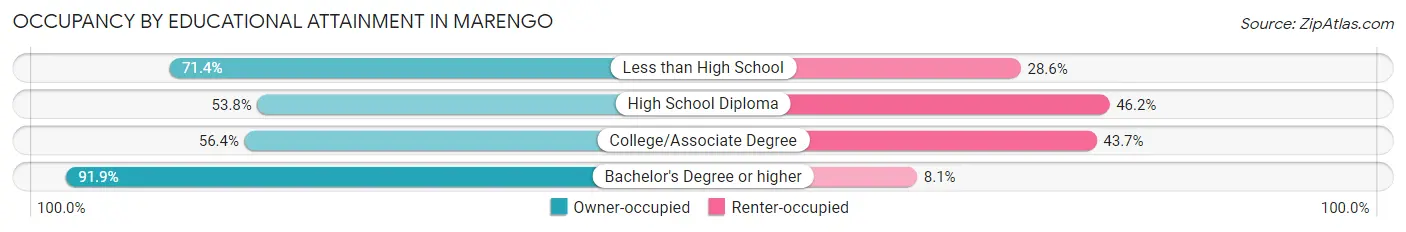
| Household Size | Owner-occupied | Renter-occupied |
| Less than High School | 172 (71.4%) | 69 (28.6%) |
| High School Diploma | 573 (53.8%) | 492 (46.2%) |
| College/Associate Degree | 608 (56.4%) | 471 (43.6%) |
| Bachelor's Degree or higher | 490 (91.9%) | 43 (8.1%) |
Occupancy by Age of Householder in Marengo
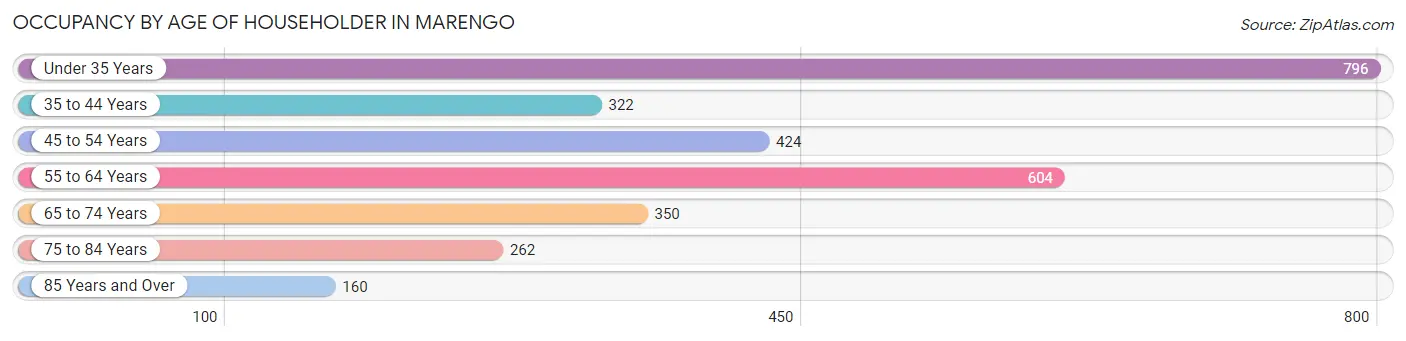
| Age Bracket | # Households | % Households |
| Under 35 Years | 796 | 27.3% |
| 35 to 44 Years | 322 | 11.0% |
| 45 to 54 Years | 424 | 14.5% |
| 55 to 64 Years | 604 | 20.7% |
| 65 to 74 Years | 350 | 12.0% |
| 75 to 84 Years | 262 | 9.0% |
| 85 Years and Over | 160 | 5.5% |
| Total | 2,918 | 100.0% |
Housing Finances in Marengo
Median Income by Occupancy in Marengo
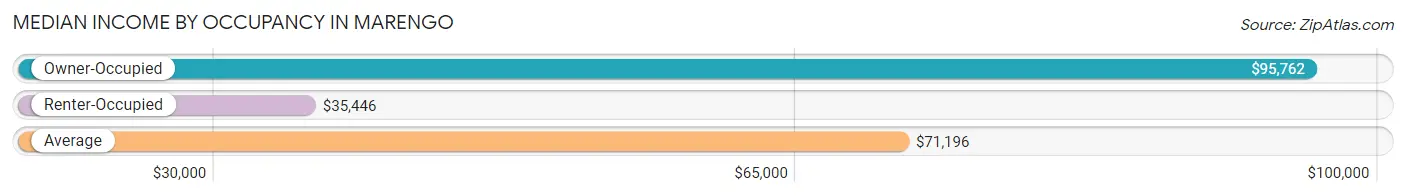
| Occupancy Type | # Households | Median Income |
| Owner-Occupied | 1,843 (63.2%) | $95,762 |
| Renter-Occupied | 1,075 (36.8%) | $35,446 |
| Average | 2,918 (100.0%) | $71,196 |
Occupancy by Householder Income Bracket in Marengo
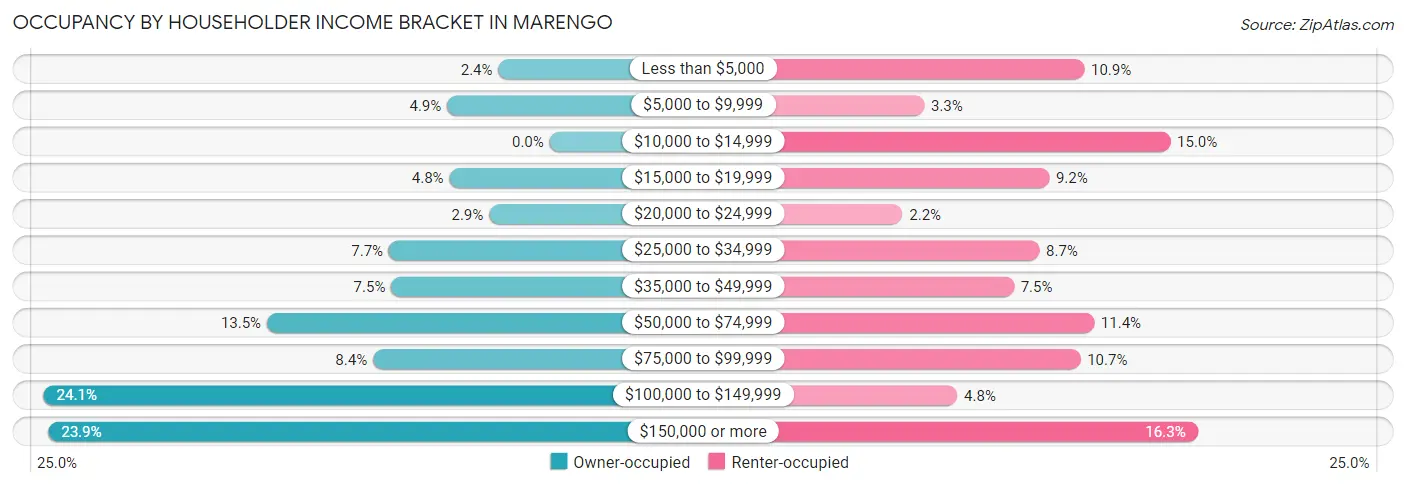
| Income Bracket | Owner-occupied | Renter-occupied |
| Less than $5,000 | 45 (2.4%) | 117 (10.9%) |
| $5,000 to $9,999 | 90 (4.9%) | 35 (3.3%) |
| $10,000 to $14,999 | 0 (0.0%) | 161 (15.0%) |
| $15,000 to $19,999 | 88 (4.8%) | 99 (9.2%) |
| $20,000 to $24,999 | 53 (2.9%) | 24 (2.2%) |
| $25,000 to $34,999 | 141 (7.6%) | 94 (8.7%) |
| $35,000 to $49,999 | 139 (7.5%) | 81 (7.5%) |
| $50,000 to $74,999 | 248 (13.5%) | 122 (11.4%) |
| $75,000 to $99,999 | 155 (8.4%) | 115 (10.7%) |
| $100,000 to $149,999 | 444 (24.1%) | 52 (4.8%) |
| $150,000 or more | 440 (23.9%) | 175 (16.3%) |
| Total | 1,843 (100.0%) | 1,075 (100.0%) |
Monthly Housing Cost Tiers in Marengo
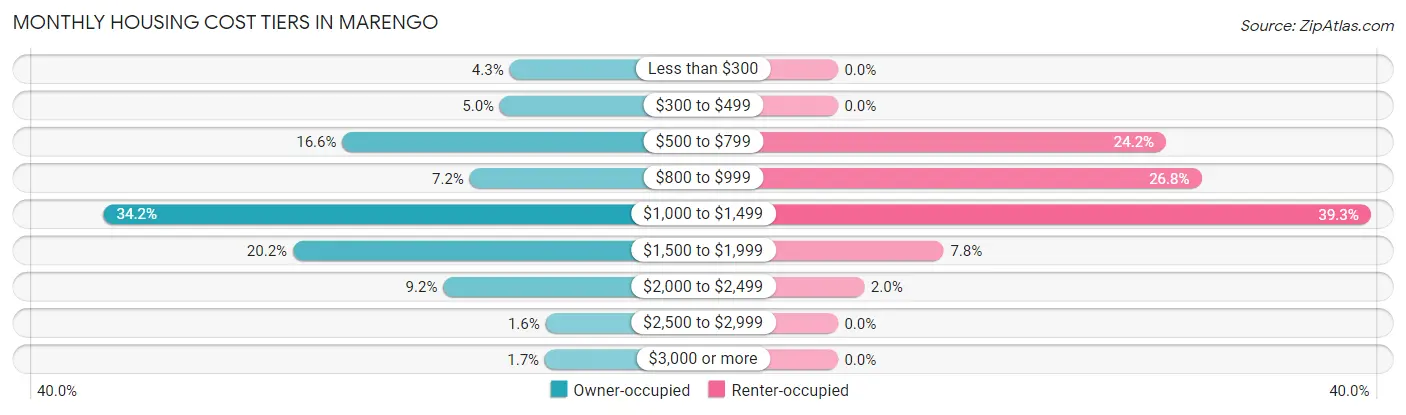
| Monthly Cost | Owner-occupied | Renter-occupied |
| Less than $300 | 79 (4.3%) | 0 (0.0%) |
| $300 to $499 | 92 (5.0%) | 0 (0.0%) |
| $500 to $799 | 306 (16.6%) | 260 (24.2%) |
| $800 to $999 | 133 (7.2%) | 288 (26.8%) |
| $1,000 to $1,499 | 630 (34.2%) | 422 (39.3%) |
| $1,500 to $1,999 | 373 (20.2%) | 84 (7.8%) |
| $2,000 to $2,499 | 169 (9.2%) | 21 (1.9%) |
| $2,500 to $2,999 | 30 (1.6%) | 0 (0.0%) |
| $3,000 or more | 31 (1.7%) | 0 (0.0%) |
| Total | 1,843 (100.0%) | 1,075 (100.0%) |
Physical Housing Characteristics in Marengo
Housing Structures in Marengo
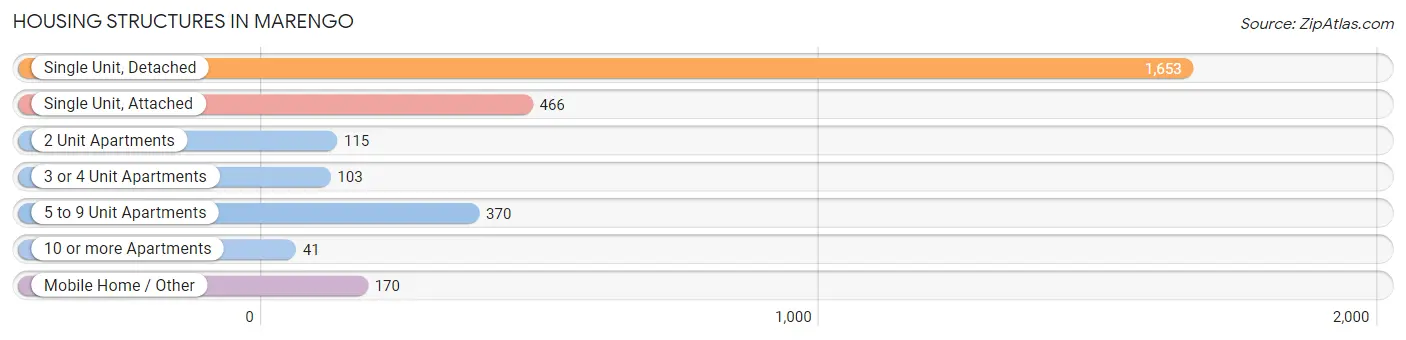
| Structure Type | # Housing Units | % Housing Units |
| Single Unit, Detached | 1,653 | 56.7% |
| Single Unit, Attached | 466 | 16.0% |
| 2 Unit Apartments | 115 | 3.9% |
| 3 or 4 Unit Apartments | 103 | 3.5% |
| 5 to 9 Unit Apartments | 370 | 12.7% |
| 10 or more Apartments | 41 | 1.4% |
| Mobile Home / Other | 170 | 5.8% |
| Total | 2,918 | 100.0% |
Housing Structures by Occupancy in Marengo
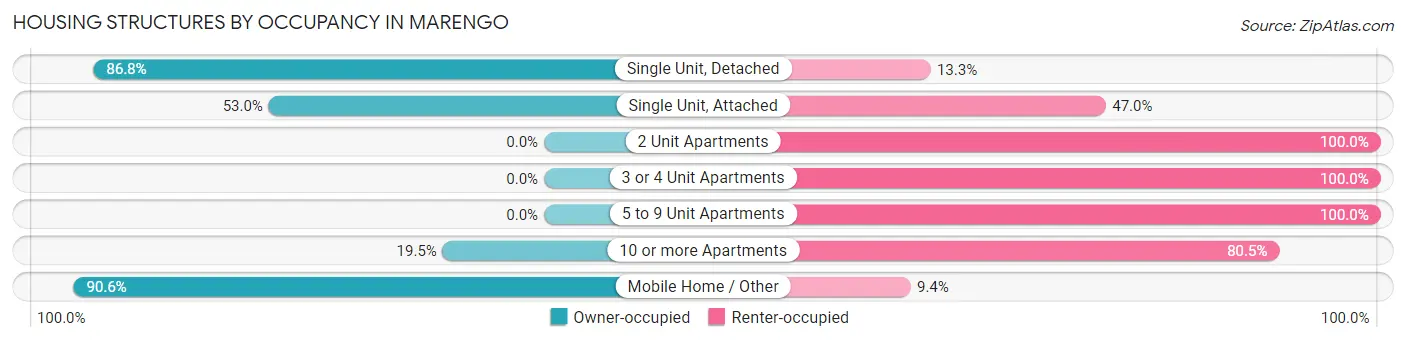
| Structure Type | Owner-occupied | Renter-occupied |
| Single Unit, Detached | 1,434 (86.8%) | 219 (13.3%) |
| Single Unit, Attached | 247 (53.0%) | 219 (47.0%) |
| 2 Unit Apartments | 0 (0.0%) | 115 (100.0%) |
| 3 or 4 Unit Apartments | 0 (0.0%) | 103 (100.0%) |
| 5 to 9 Unit Apartments | 0 (0.0%) | 370 (100.0%) |
| 10 or more Apartments | 8 (19.5%) | 33 (80.5%) |
| Mobile Home / Other | 154 (90.6%) | 16 (9.4%) |
| Total | 1,843 (63.2%) | 1,075 (36.8%) |
Housing Structures by Number of Rooms in Marengo
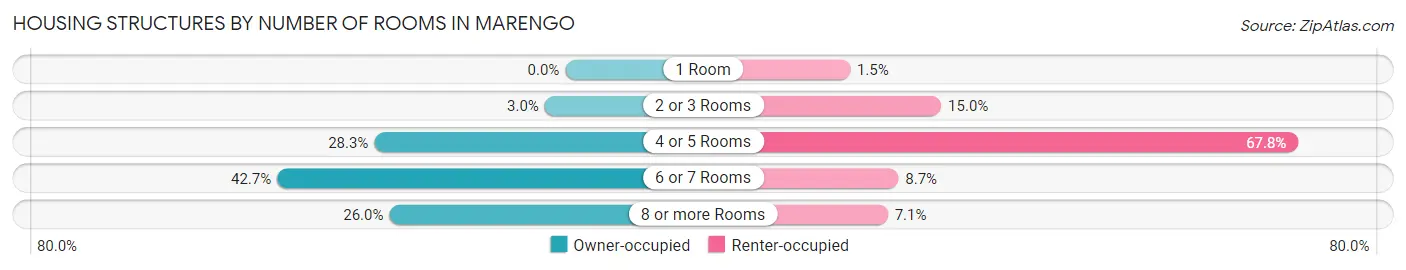
| Number of Rooms | Owner-occupied | Renter-occupied |
| 1 Room | 0 (0.0%) | 16 (1.5%) |
| 2 or 3 Rooms | 56 (3.0%) | 161 (15.0%) |
| 4 or 5 Rooms | 521 (28.3%) | 729 (67.8%) |
| 6 or 7 Rooms | 786 (42.6%) | 93 (8.6%) |
| 8 or more Rooms | 480 (26.0%) | 76 (7.1%) |
| Total | 1,843 (100.0%) | 1,075 (100.0%) |
Housing Structure by Heating Type in Marengo
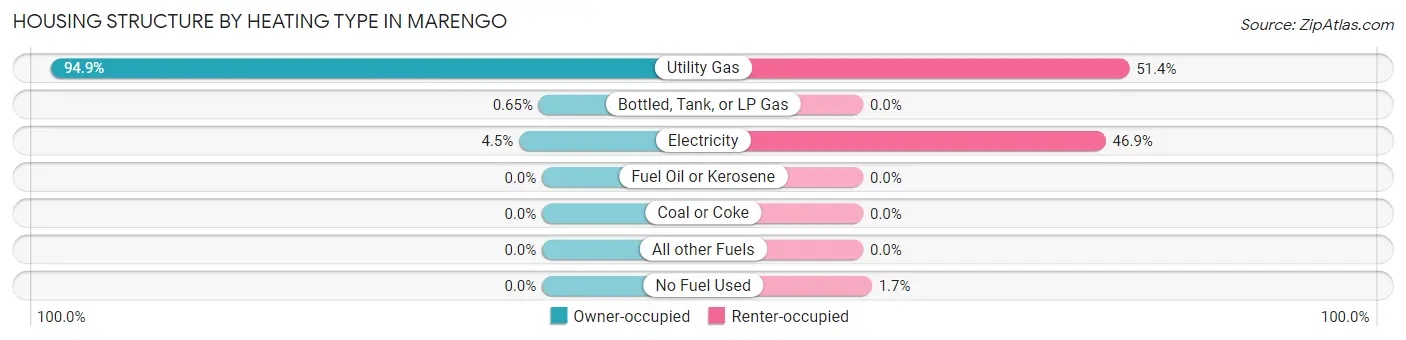
| Heating Type | Owner-occupied | Renter-occupied |
| Utility Gas | 1,749 (94.9%) | 553 (51.4%) |
| Bottled, Tank, or LP Gas | 12 (0.6%) | 0 (0.0%) |
| Electricity | 82 (4.4%) | 504 (46.9%) |
| Fuel Oil or Kerosene | 0 (0.0%) | 0 (0.0%) |
| Coal or Coke | 0 (0.0%) | 0 (0.0%) |
| All other Fuels | 0 (0.0%) | 0 (0.0%) |
| No Fuel Used | 0 (0.0%) | 18 (1.7%) |
| Total | 1,843 (100.0%) | 1,075 (100.0%) |
Household Vehicle Usage in Marengo
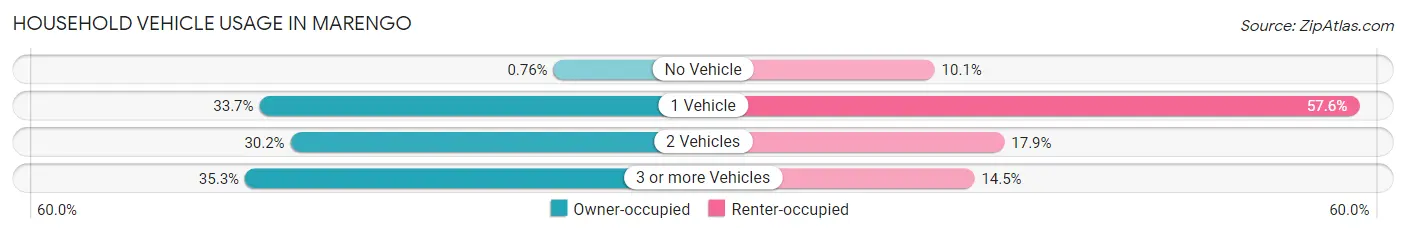
| Vehicles per Household | Owner-occupied | Renter-occupied |
| No Vehicle | 14 (0.8%) | 108 (10.1%) |
| 1 Vehicle | 621 (33.7%) | 619 (57.6%) |
| 2 Vehicles | 557 (30.2%) | 192 (17.9%) |
| 3 or more Vehicles | 651 (35.3%) | 156 (14.5%) |
| Total | 1,843 (100.0%) | 1,075 (100.0%) |
Real Estate & Mortgages in Marengo
Real Estate and Mortgage Overview in Marengo
| Characteristic | Without Mortgage | With Mortgage |
| Housing Units | 675 | 1,168 |
| Median Property Value | $186,500 | $189,100 |
| Median Household Income | - | - |
| Monthly Housing Costs | $730 | $23 |
| Real Estate Taxes | $4,340 | $0 |
Property Value by Mortgage Status in Marengo
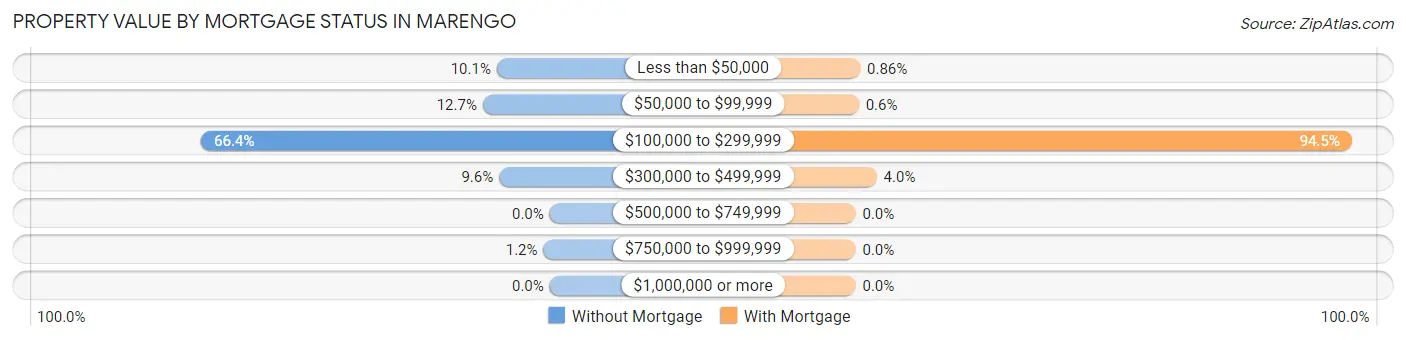
| Property Value | Without Mortgage | With Mortgage |
| Less than $50,000 | 68 (10.1%) | 10 (0.9%) |
| $50,000 to $99,999 | 86 (12.7%) | 7 (0.6%) |
| $100,000 to $299,999 | 448 (66.4%) | 1,104 (94.5%) |
| $300,000 to $499,999 | 65 (9.6%) | 47 (4.0%) |
| $500,000 to $749,999 | 0 (0.0%) | 0 (0.0%) |
| $750,000 to $999,999 | 8 (1.2%) | 0 (0.0%) |
| $1,000,000 or more | 0 (0.0%) | 0 (0.0%) |
| Total | 675 (100.0%) | 1,168 (100.0%) |
Household Income by Mortgage Status in Marengo
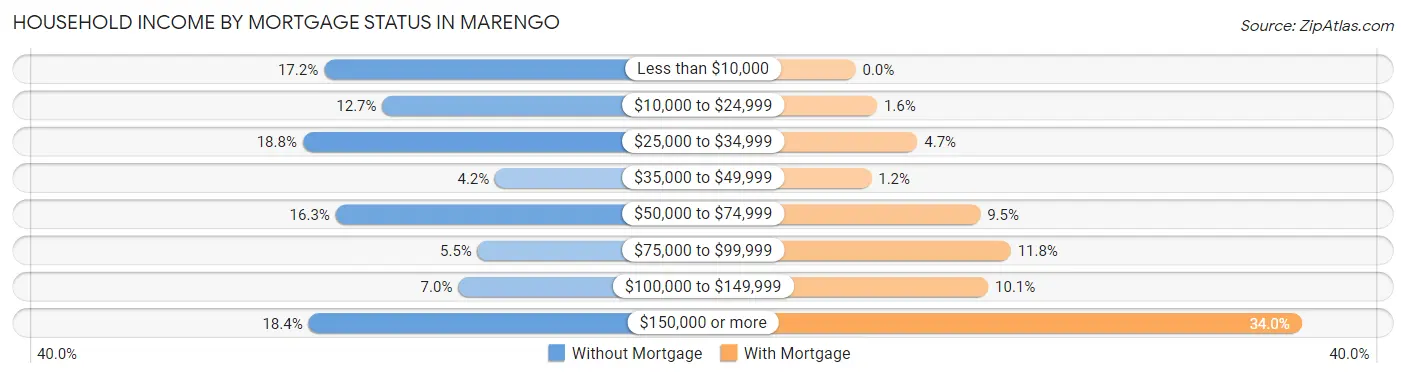
| Household Income | Without Mortgage | With Mortgage |
| Less than $10,000 | 116 (17.2%) | 0 (0.0%) |
| $10,000 to $24,999 | 86 (12.7%) | 19 (1.6%) |
| $25,000 to $34,999 | 127 (18.8%) | 55 (4.7%) |
| $35,000 to $49,999 | 28 (4.2%) | 14 (1.2%) |
| $50,000 to $74,999 | 110 (16.3%) | 111 (9.5%) |
| $75,000 to $99,999 | 37 (5.5%) | 138 (11.8%) |
| $100,000 to $149,999 | 47 (7.0%) | 118 (10.1%) |
| $150,000 or more | 124 (18.4%) | 397 (34.0%) |
| Total | 675 (100.0%) | 1,168 (100.0%) |
Property Value to Household Income Ratio in Marengo
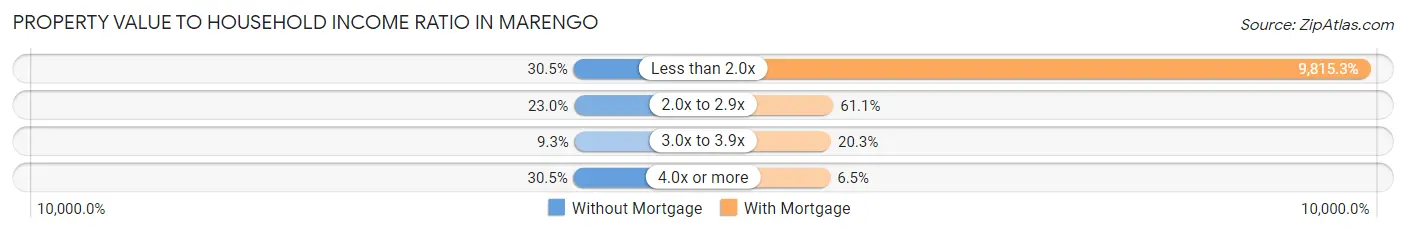
| Value-to-Income Ratio | Without Mortgage | With Mortgage |
| Less than 2.0x | 206 (30.5%) | 114,643 (9,815.3%) |
| 2.0x to 2.9x | 155 (23.0%) | 714 (61.1%) |
| 3.0x to 3.9x | 63 (9.3%) | 237 (20.3%) |
| 4.0x or more | 206 (30.5%) | 76 (6.5%) |
| Total | 675 (100.0%) | 1,168 (100.0%) |
Real Estate Taxes by Mortgage Status in Marengo
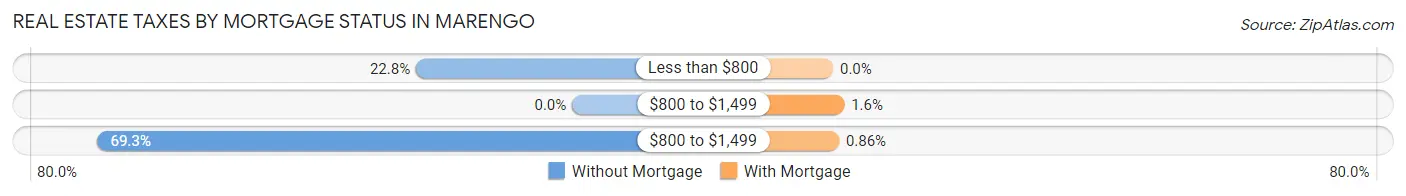
| Property Taxes | Without Mortgage | With Mortgage |
| Less than $800 | 154 (22.8%) | 0 (0.0%) |
| $800 to $1,499 | 0 (0.0%) | 19 (1.6%) |
| $800 to $1,499 | 468 (69.3%) | 10 (0.9%) |
| Total | 675 (100.0%) | 1,168 (100.0%) |
Health & Disability in Marengo
Health Insurance Coverage by Age in Marengo
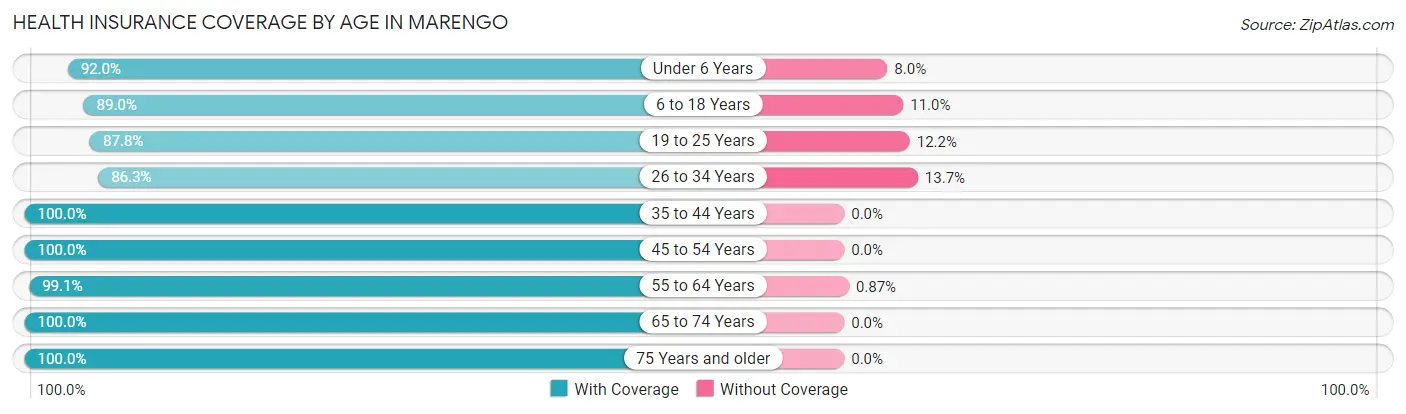
| Age Bracket | With Coverage | Without Coverage |
| Under 6 Years | 755 (92.0%) | 66 (8.0%) |
| 6 to 18 Years | 962 (89.0%) | 119 (11.0%) |
| 19 to 25 Years | 963 (87.8%) | 134 (12.2%) |
| 26 to 34 Years | 892 (86.3%) | 142 (13.7%) |
| 35 to 44 Years | 575 (100.0%) | 0 (0.0%) |
| 45 to 54 Years | 757 (100.0%) | 0 (0.0%) |
| 55 to 64 Years | 1,025 (99.1%) | 9 (0.9%) |
| 65 to 74 Years | 524 (100.0%) | 0 (0.0%) |
| 75 Years and older | 484 (100.0%) | 0 (0.0%) |
| Total | 6,937 (93.6%) | 470 (6.4%) |
Health Insurance Coverage by Citizenship Status in Marengo
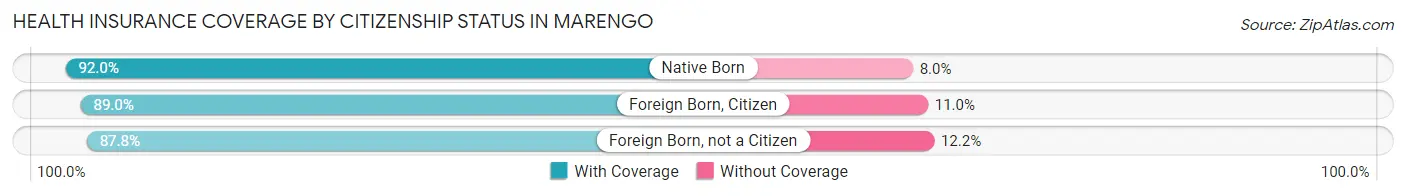
| Citizenship Status | With Coverage | Without Coverage |
| Native Born | 755 (92.0%) | 66 (8.0%) |
| Foreign Born, Citizen | 962 (89.0%) | 119 (11.0%) |
| Foreign Born, not a Citizen | 963 (87.8%) | 134 (12.2%) |
Health Insurance Coverage by Household Income in Marengo
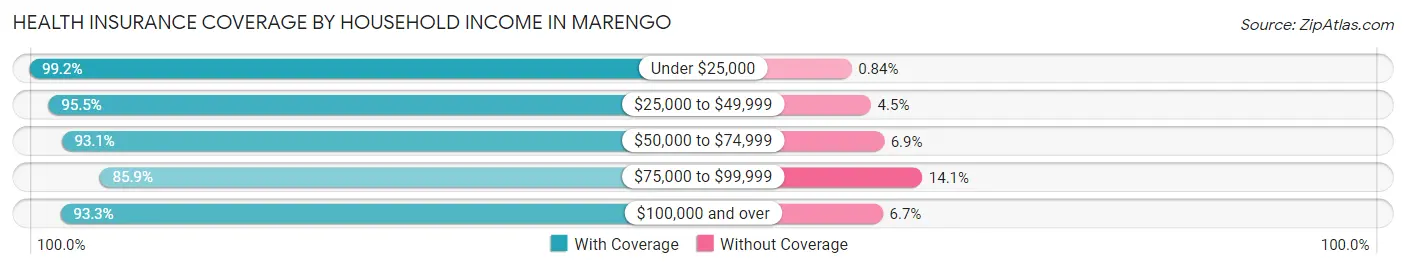
| Household Income | With Coverage | Without Coverage |
| Under $25,000 | 1,067 (99.2%) | 9 (0.8%) |
| $25,000 to $49,999 | 854 (95.5%) | 40 (4.5%) |
| $50,000 to $74,999 | 647 (93.1%) | 48 (6.9%) |
| $75,000 to $99,999 | 654 (85.9%) | 107 (14.1%) |
| $100,000 and over | 3,701 (93.3%) | 266 (6.7%) |
Public vs Private Health Insurance Coverage by Age in Marengo
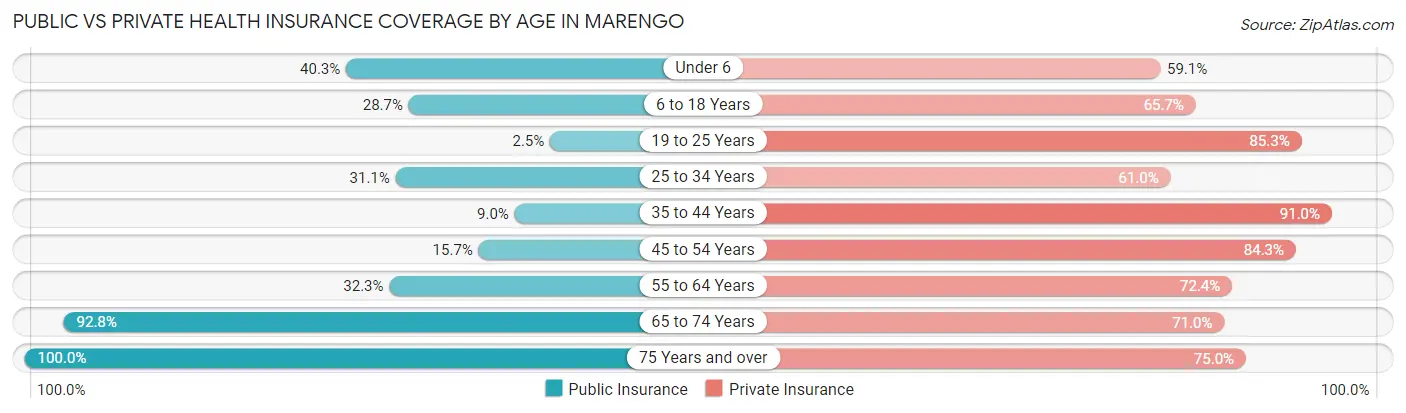
| Age Bracket | Public Insurance | Private Insurance |
| Under 6 | 331 (40.3%) | 485 (59.1%) |
| 6 to 18 Years | 310 (28.7%) | 710 (65.7%) |
| 19 to 25 Years | 27 (2.5%) | 936 (85.3%) |
| 25 to 34 Years | 322 (31.1%) | 631 (61.0%) |
| 35 to 44 Years | 52 (9.0%) | 523 (91.0%) |
| 45 to 54 Years | 119 (15.7%) | 638 (84.3%) |
| 55 to 64 Years | 334 (32.3%) | 749 (72.4%) |
| 65 to 74 Years | 486 (92.7%) | 372 (71.0%) |
| 75 Years and over | 484 (100.0%) | 363 (75.0%) |
| Total | 2,465 (33.3%) | 5,407 (73.0%) |
Disability Status by Sex by Age in Marengo
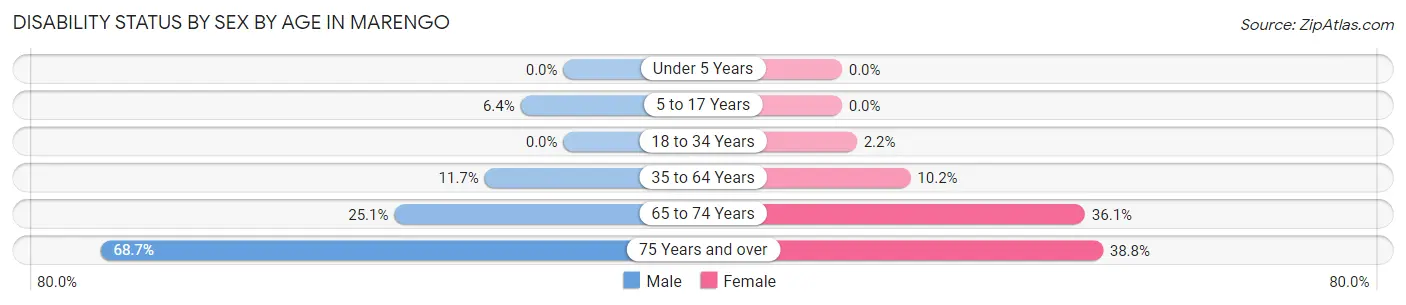
| Age Bracket | Male | Female |
| Under 5 Years | 0 (0.0%) | 0 (0.0%) |
| 5 to 17 Years | 39 (6.4%) | 0 (0.0%) |
| 18 to 34 Years | 0 (0.0%) | 24 (2.2%) |
| 35 to 64 Years | 147 (11.7%) | 113 (10.2%) |
| 65 to 74 Years | 62 (25.1%) | 100 (36.1%) |
| 75 Years and over | 134 (68.7%) | 112 (38.8%) |
Disability Class by Sex by Age in Marengo
Disability Class: Hearing Difficulty
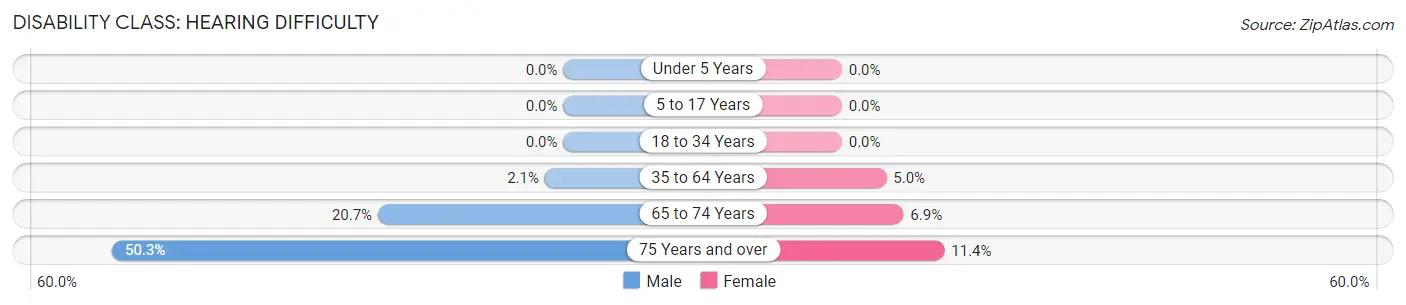
| Age Bracket | Male | Female |
| Under 5 Years | 0 (0.0%) | 0 (0.0%) |
| 5 to 17 Years | 0 (0.0%) | 0 (0.0%) |
| 18 to 34 Years | 0 (0.0%) | 0 (0.0%) |
| 35 to 64 Years | 26 (2.1%) | 55 (5.0%) |
| 65 to 74 Years | 51 (20.6%) | 19 (6.9%) |
| 75 Years and over | 98 (50.3%) | 33 (11.4%) |
Disability Class: Vision Difficulty
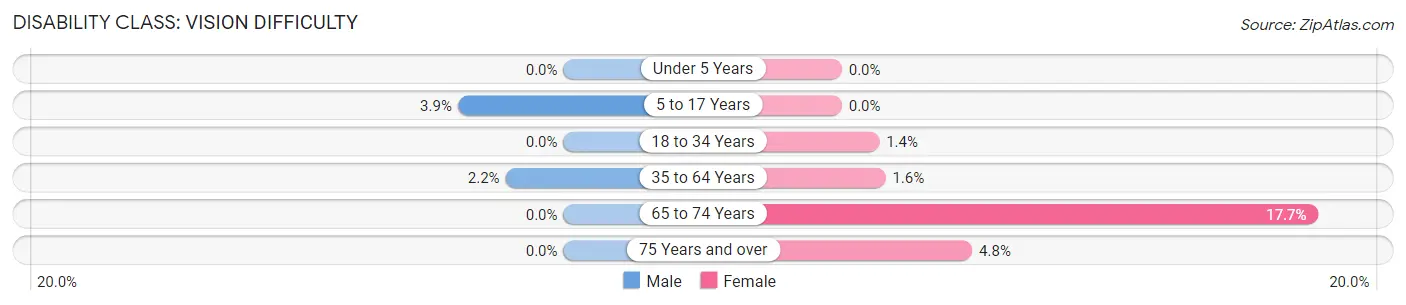
| Age Bracket | Male | Female |
| Under 5 Years | 0 (0.0%) | 0 (0.0%) |
| 5 to 17 Years | 24 (3.9%) | 0 (0.0%) |
| 18 to 34 Years | 0 (0.0%) | 15 (1.4%) |
| 35 to 64 Years | 27 (2.1%) | 18 (1.6%) |
| 65 to 74 Years | 0 (0.0%) | 49 (17.7%) |
| 75 Years and over | 0 (0.0%) | 14 (4.8%) |
Disability Class: Cognitive Difficulty
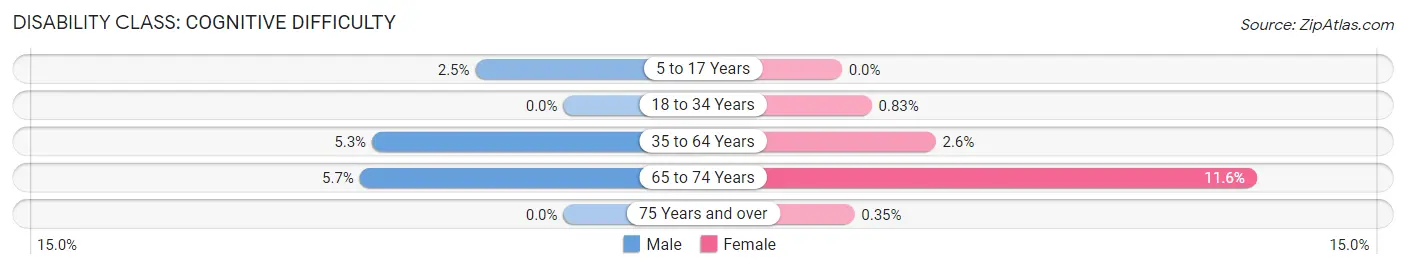
| Age Bracket | Male | Female |
| 5 to 17 Years | 15 (2.5%) | 0 (0.0%) |
| 18 to 34 Years | 0 (0.0%) | 9 (0.8%) |
| 35 to 64 Years | 67 (5.3%) | 29 (2.6%) |
| 65 to 74 Years | 14 (5.7%) | 32 (11.6%) |
| 75 Years and over | 0 (0.0%) | 1 (0.4%) |
Disability Class: Ambulatory Difficulty
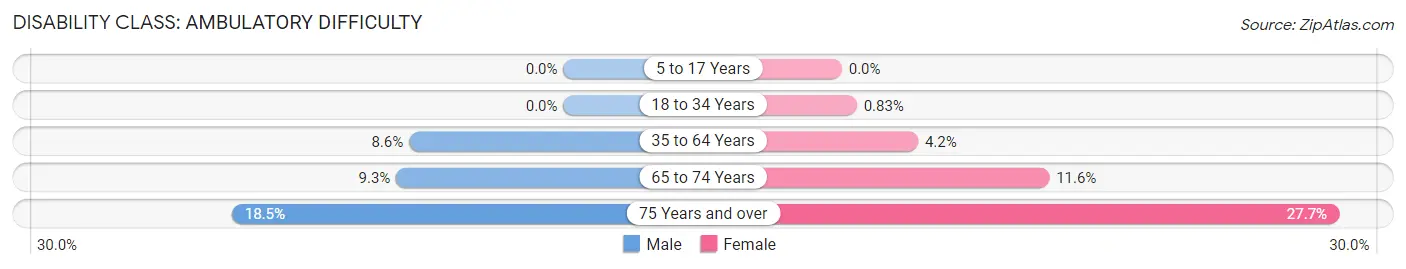
| Age Bracket | Male | Female |
| 5 to 17 Years | 0 (0.0%) | 0 (0.0%) |
| 18 to 34 Years | 0 (0.0%) | 9 (0.8%) |
| 35 to 64 Years | 108 (8.6%) | 47 (4.2%) |
| 65 to 74 Years | 23 (9.3%) | 32 (11.6%) |
| 75 Years and over | 36 (18.5%) | 80 (27.7%) |
Disability Class: Self-Care Difficulty
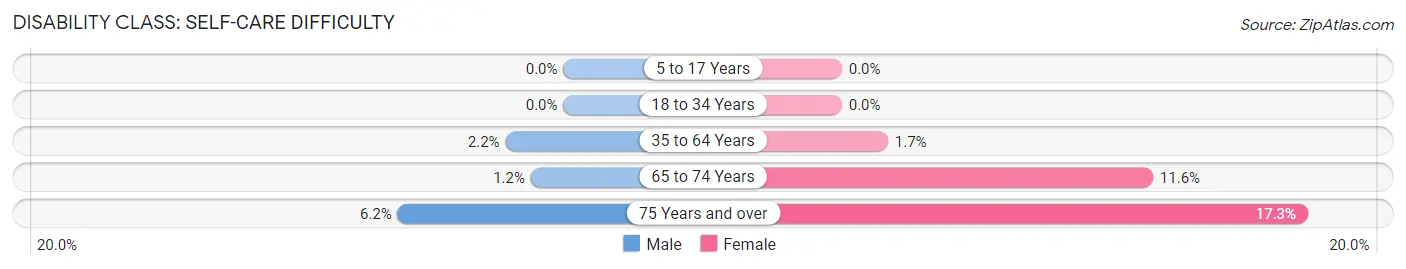
| Age Bracket | Male | Female |
| 5 to 17 Years | 0 (0.0%) | 0 (0.0%) |
| 18 to 34 Years | 0 (0.0%) | 0 (0.0%) |
| 35 to 64 Years | 27 (2.1%) | 19 (1.7%) |
| 65 to 74 Years | 3 (1.2%) | 32 (11.6%) |
| 75 Years and over | 12 (6.1%) | 50 (17.3%) |
Technology Access in Marengo
Computing Device Access in Marengo
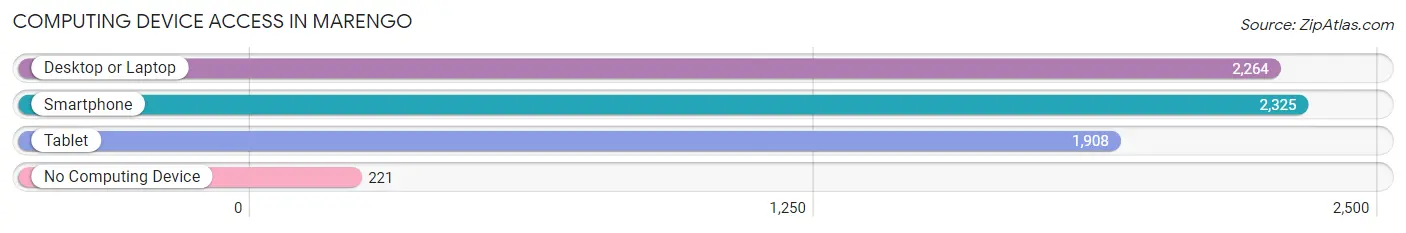
| Device Type | # Households | % Households |
| Desktop or Laptop | 2,264 | 77.6% |
| Smartphone | 2,325 | 79.7% |
| Tablet | 1,908 | 65.4% |
| No Computing Device | 221 | 7.6% |
| Total | 2,918 | 100.0% |
Internet Access in Marengo
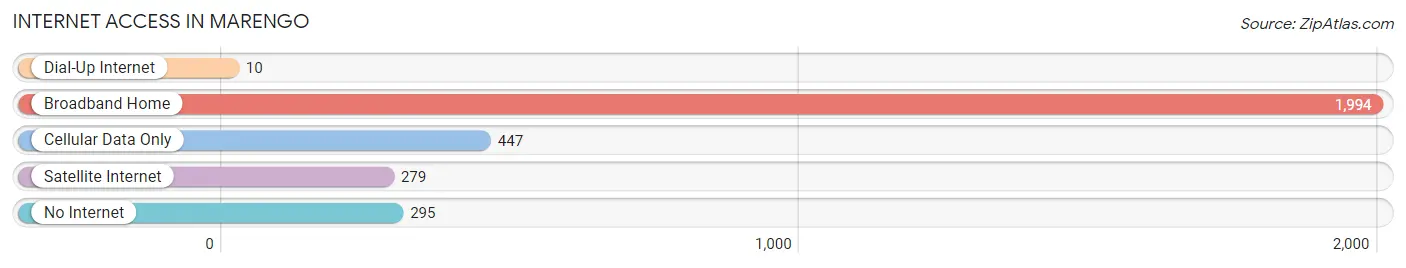
| Internet Type | # Households | % Households |
| Dial-Up Internet | 10 | 0.3% |
| Broadband Home | 1,994 | 68.3% |
| Cellular Data Only | 447 | 15.3% |
| Satellite Internet | 279 | 9.6% |
| No Internet | 295 | 10.1% |
| Total | 2,918 | 100.0% |
Marengo Summary
Marengo, Illinois is a small city located in McHenry County, approximately 50 miles northwest of Chicago. The city is situated on the banks of the Kishwaukee River and is home to a population of around 8,000 people. Marengo is known for its historic downtown area, which features a variety of shops, restaurants, and other businesses.
History
Marengo was first settled in 1835 by a group of settlers from New York. The city was named after the Battle of Marengo, which was fought in 1800 during the Napoleonic Wars. The city was officially incorporated in 1853.
In the late 19th century, Marengo was a thriving agricultural community. The city was home to several grain elevators, a creamery, and a canning factory. The city also had a large number of dairy farms, which supplied milk to the Chicago area.
In the early 20th century, Marengo began to experience a period of growth and development. The city was home to several factories, including a shoe factory, a furniture factory, and a brickyard. The city also had a number of retail stores, including a department store, a grocery store, and a drug store.
Geography
Marengo is located in McHenry County, approximately 50 miles northwest of Chicago. The city is situated on the banks of the Kishwaukee River and is surrounded by rolling hills and farmland. The city has a total area of 4.2 square miles, all of which is land.
Economy
Marengo’s economy is largely based on agriculture and manufacturing. The city is home to several grain elevators, a creamery, and a canning factory. The city also has a number of retail stores, including a department store, a grocery store, and a drug store.
Demographics
As of the 2010 census, Marengo had a population of 8,104 people. The racial makeup of the city was 94.2% White, 0.7% African American, 0.2% Native American, 0.7% Asian, 0.1% Pacific Islander, 2.3% from other races, and 1.9% from two or more races. Hispanic or Latino of any race were 5.2% of the population.
The median household income in Marengo was $50,945, and the median family income was $60,917. The per capita income for the city was $23,945. About 8.2% of families and 10.2% of the population were below the poverty line, including 14.2% of those under age 18 and 5.2% of those age 65 or over.
Common Questions
What is Per Capita Income in Marengo?
Per Capita income in Marengo is $35,338.
What is the Median Family Income in Marengo?
Median Family Income in Marengo is $108,043.
What is the Median Household income in Marengo?
Median Household Income in Marengo is $71,196.
What is Income or Wage Gap in Marengo?
Income or Wage Gap in Marengo is 42.0%.
Women in Marengo earn 58.0 cents for every dollar earned by a man.
What is Inequality or Gini Index in Marengo?
Inequality or Gini Index in Marengo is 0.45.
What is the Total Population of Marengo?
Total Population of Marengo is 7,471.
What is the Total Male Population of Marengo?
Total Male Population of Marengo is 3,786.
What is the Total Female Population of Marengo?
Total Female Population of Marengo is 3,685.
What is the Ratio of Males per 100 Females in Marengo?
There are 102.74 Males per 100 Females in Marengo.
What is the Ratio of Females per 100 Males in Marengo?
There are 97.33 Females per 100 Males in Marengo.
What is the Median Population Age in Marengo?
Median Population Age in Marengo is 31.1 Years.
What is the Average Family Size in Marengo
Average Family Size in Marengo is 3.1 People.
What is the Average Household Size in Marengo
Average Household Size in Marengo is 2.5 People.
How Large is the Labor Force in Marengo?
There are 3,967 People in the Labor Forcein in Marengo.
What is the Percentage of People in the Labor Force in Marengo?
68.4% of People are in the Labor Force in Marengo.
What is the Unemployment Rate in Marengo?
Unemployment Rate in Marengo is 7.1%.