Dolton, IL Map & Demographics
Dolton Map
Dolton Overview
$27,905
PER CAPITA INCOME
$70,231
AVG FAMILY INCOME
$54,748
AVG HOUSEHOLD INCOME
4.6%
WAGE / INCOME GAP [ % ]
95.4¢/ $1
WAGE / INCOME GAP [ $ ]
$16,134
FAMILY INCOME DEFICIT
0.44
INEQUALITY / GINI INDEX
21,283
TOTAL POPULATION
10,392
MALE POPULATION
10,891
FEMALE POPULATION
95.42
MALES / 100 FEMALES
104.80
FEMALES / 100 MALES
39.1
MEDIAN AGE
3.3
AVG FAMILY SIZE
2.6
AVG HOUSEHOLD SIZE
9,753
LABOR FORCE [ PEOPLE ]
57.6%
PERCENT IN LABOR FORCE
12.7%
UNEMPLOYMENT RATE
Dolton Zip Codes
Dolton Area Codes
Income in Dolton
Income Overview in Dolton
Per Capita Income in Dolton is $27,905, while median incomes of families and households are $70,231 and $54,748 respectively.
| Characteristic | Number | Measure |
| Per Capita Income | 21,283 | $27,905 |
| Median Family Income | 5,169 | $70,231 |
| Mean Family Income | 5,169 | $81,190 |
| Median Household Income | 8,110 | $54,748 |
| Mean Household Income | 8,110 | $70,026 |
| Income Deficit | 5,169 | $16,134 |
| Wage / Income Gap (%) | 21,283 | 4.60% |
| Wage / Income Gap ($) | 21,283 | 95.40¢ per $1 |
| Gini / Inequality Index | 21,283 | 0.44 |
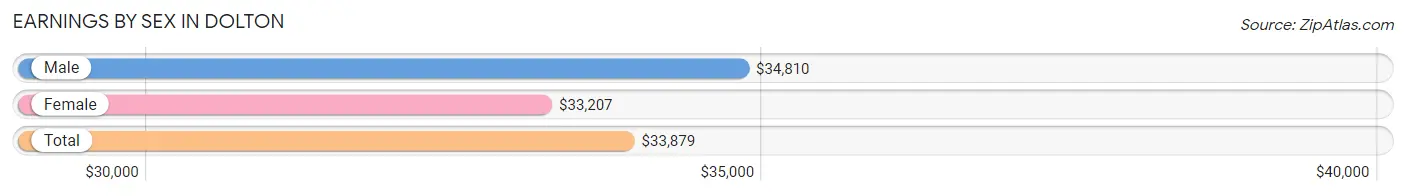
Earnings by Sex in Dolton
Average Earnings in Dolton are $33,879, $34,810 for men and $33,207 for women, a difference of 4.6%.
| Sex | Number | Average Earnings |
| Male | 4,290 (43.4%) | $34,810 |
| Female | 5,600 (56.6%) | $33,207 |
| Total | 9,890 (100.0%) | $33,879 |
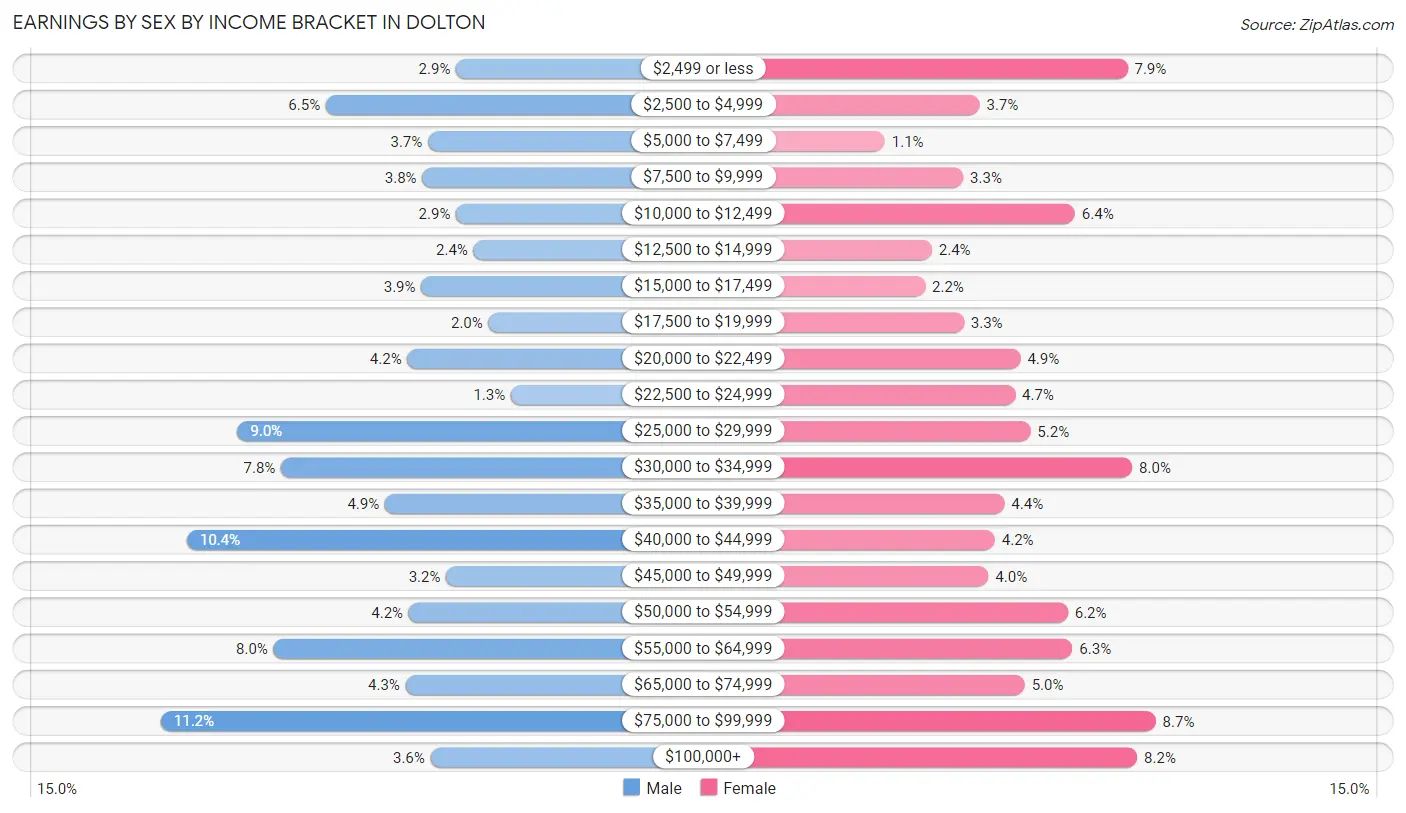
Earnings by Sex by Income Bracket in Dolton
The most common earnings brackets in Dolton are $75,000 to $99,999 for men (479 | 11.2%) and $75,000 to $99,999 for women (486 | 8.7%).
| Income | Male | Female |
| $2,499 or less | 123 (2.9%) | 442 (7.9%) |
| $2,500 to $4,999 | 280 (6.5%) | 209 (3.7%) |
| $5,000 to $7,499 | 157 (3.7%) | 60 (1.1%) |
| $7,500 to $9,999 | 164 (3.8%) | 183 (3.3%) |
| $10,000 to $12,499 | 123 (2.9%) | 359 (6.4%) |
| $12,500 to $14,999 | 102 (2.4%) | 134 (2.4%) |
| $15,000 to $17,499 | 165 (3.8%) | 123 (2.2%) |
| $17,500 to $19,999 | 84 (2.0%) | 184 (3.3%) |
| $20,000 to $22,499 | 182 (4.2%) | 273 (4.9%) |
| $22,500 to $24,999 | 57 (1.3%) | 265 (4.7%) |
| $25,000 to $29,999 | 387 (9.0%) | 289 (5.2%) |
| $30,000 to $34,999 | 334 (7.8%) | 449 (8.0%) |
| $35,000 to $39,999 | 209 (4.9%) | 248 (4.4%) |
| $40,000 to $44,999 | 448 (10.4%) | 233 (4.2%) |
| $45,000 to $49,999 | 135 (3.2%) | 223 (4.0%) |
| $50,000 to $54,999 | 180 (4.2%) | 348 (6.2%) |
| $55,000 to $64,999 | 343 (8.0%) | 355 (6.3%) |
| $65,000 to $74,999 | 184 (4.3%) | 280 (5.0%) |
| $75,000 to $99,999 | 479 (11.2%) | 486 (8.7%) |
| $100,000+ | 154 (3.6%) | 457 (8.2%) |
| Total | 4,290 (100.0%) | 5,600 (100.0%) |
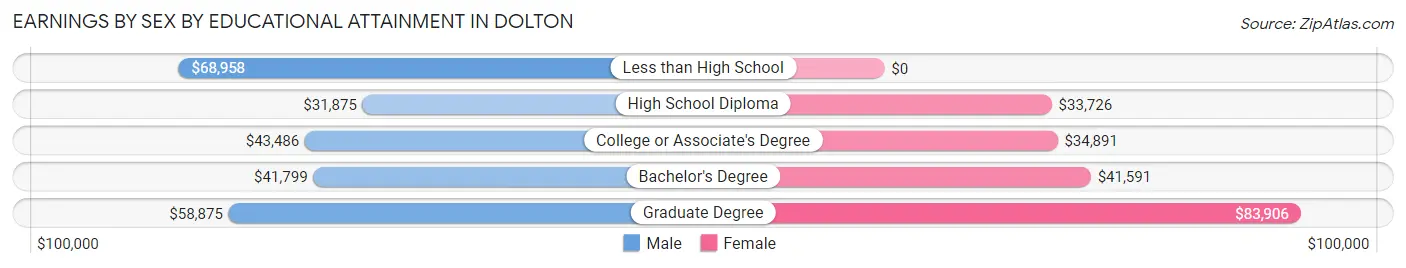
Earnings by Sex by Educational Attainment in Dolton
Average earnings in Dolton are $41,523 for men and $36,704 for women, a difference of 11.6%. Men with an educational attainment of less than high school enjoy the highest average annual earnings of $68,958, while those with high school diploma education earn the least with $31,875. Women with an educational attainment of graduate degree earn the most with the average annual earnings of $83,906, while those with high school diploma education have the smallest earnings of $33,726.
| Educational Attainment | Male Income | Female Income |
| Less than High School | $68,958 | $0 |
| High School Diploma | $31,875 | $33,726 |
| College or Associate's Degree | $43,486 | $34,891 |
| Bachelor's Degree | $41,799 | $41,591 |
| Graduate Degree | $58,875 | $83,906 |
| Total | $41,523 | $36,704 |
Family Income in Dolton
Family Income Brackets in Dolton
According to the Dolton family income data, there are 951 families falling into the $50,000 to $74,999 income range, which is the most common income bracket and makes up 18.4% of all families. Conversely, the $10,000 to $14,999 income bracket is the least frequent group with only 62 families (1.2%) belonging to this category.
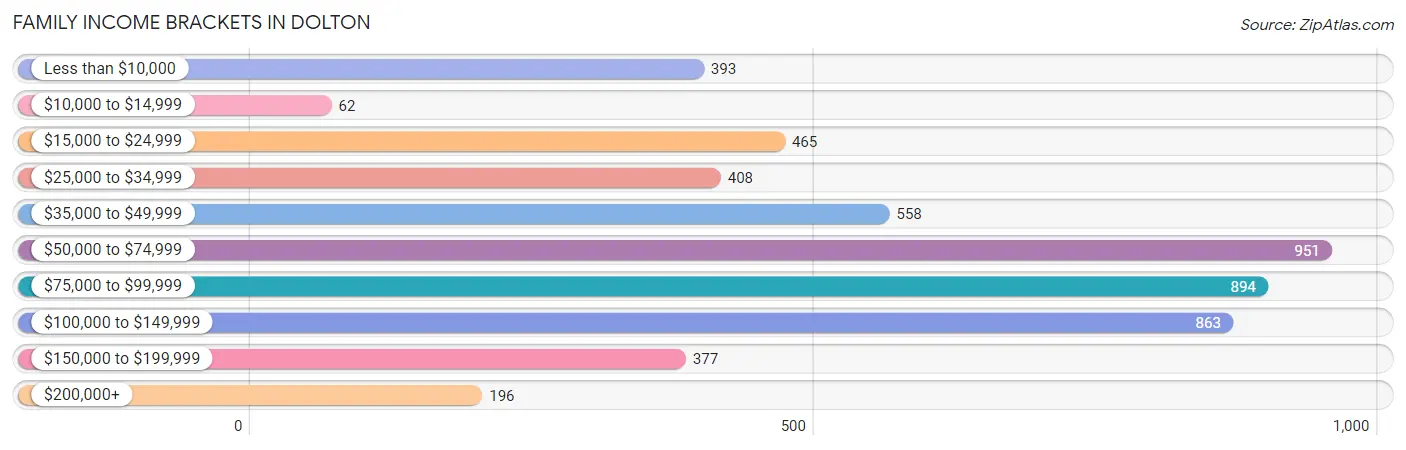
| Income Bracket | # Families | % Families |
| Less than $10,000 | 393 | 7.6% |
| $10,000 to $14,999 | 62 | 1.2% |
| $15,000 to $24,999 | 465 | 9.0% |
| $25,000 to $34,999 | 408 | 7.9% |
| $35,000 to $49,999 | 558 | 10.8% |
| $50,000 to $74,999 | 951 | 18.4% |
| $75,000 to $99,999 | 894 | 17.3% |
| $100,000 to $149,999 | 863 | 16.7% |
| $150,000 to $199,999 | 377 | 7.3% |
| $200,000+ | 196 | 3.8% |
Family Income by Famaliy Size in Dolton
3-person families (1,425 | 27.6%) account for the highest median family income in Dolton with $74,955 per family, while 2-person families (2,473 | 47.8%) have the highest median income of $34,082 per family member.
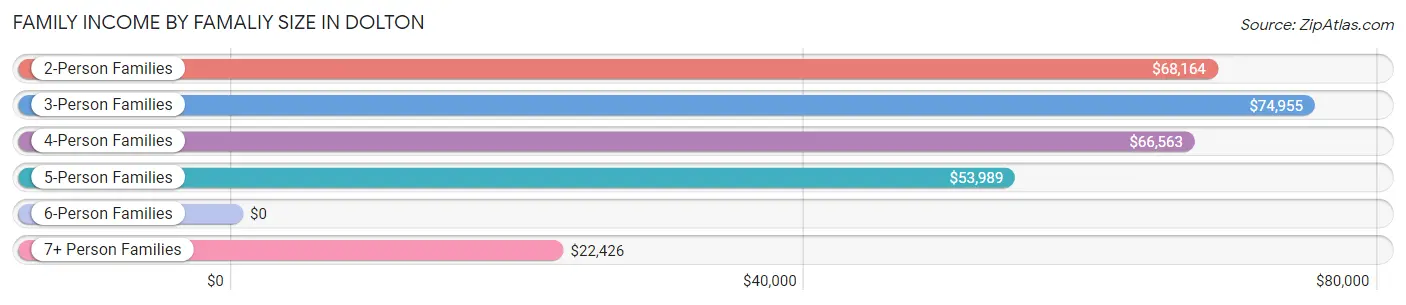
| Income Bracket | # Families | Median Income |
| 2-Person Families | 2,473 (47.8%) | $68,164 |
| 3-Person Families | 1,425 (27.6%) | $74,955 |
| 4-Person Families | 540 (10.4%) | $66,563 |
| 5-Person Families | 426 (8.2%) | $53,989 |
| 6-Person Families | 197 (3.8%) | $0 |
| 7+ Person Families | 108 (2.1%) | $22,426 |
| Total | 5,169 (100.0%) | $70,231 |
Family Income by Number of Earners in Dolton
The median family income in Dolton is $70,231, with families comprising 3+ earners (558) having the highest median family income of $108,017, while families with no earners (939) have the lowest median family income of $24,385, accounting for 10.8% and 18.2% of families, respectively.
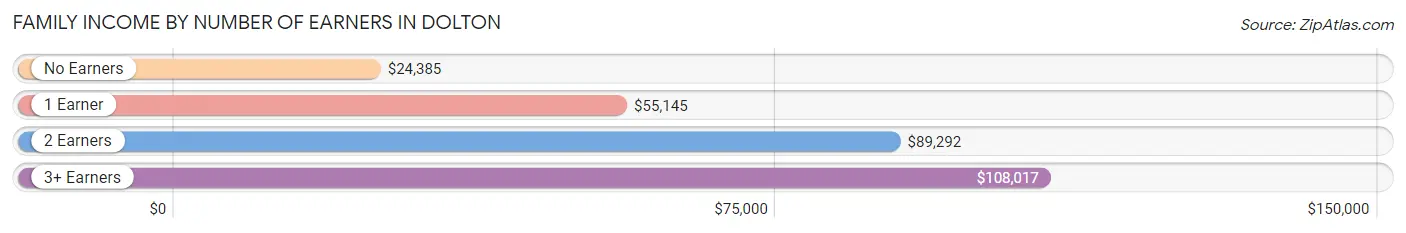
| Number of Earners | # Families | Median Income |
| No Earners | 939 (18.2%) | $24,385 |
| 1 Earner | 1,959 (37.9%) | $55,145 |
| 2 Earners | 1,713 (33.1%) | $89,292 |
| 3+ Earners | 558 (10.8%) | $108,017 |
| Total | 5,169 (100.0%) | $70,231 |
Household Income in Dolton
Household Income Brackets in Dolton
With 1,362 households falling in the category, the $75,000 to $99,999 income range is the most frequent in Dolton, accounting for 16.8% of all households. In contrast, only 211 households (2.6%) fall into the $200,000+ income bracket, making it the least populous group.
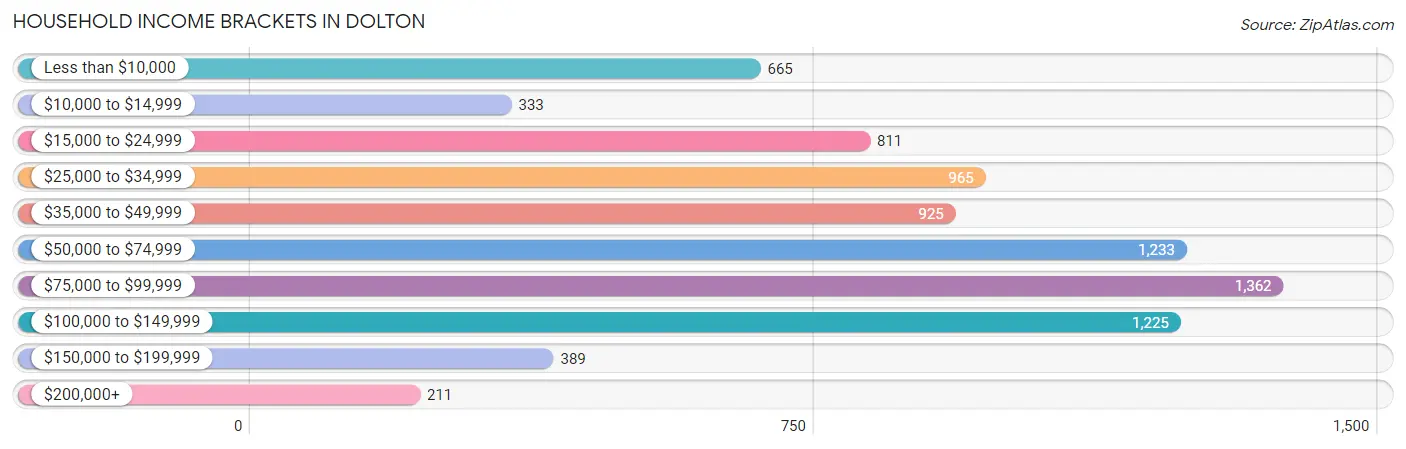
| Income Bracket | # Households | % Households |
| Less than $10,000 | 665 | 8.2% |
| $10,000 to $14,999 | 333 | 4.1% |
| $15,000 to $24,999 | 811 | 10.0% |
| $25,000 to $34,999 | 965 | 11.9% |
| $35,000 to $49,999 | 925 | 11.4% |
| $50,000 to $74,999 | 1,233 | 15.2% |
| $75,000 to $99,999 | 1,362 | 16.8% |
| $100,000 to $149,999 | 1,225 | 15.1% |
| $150,000 to $199,999 | 389 | 4.8% |
| $200,000+ | 211 | 2.6% |
Household Income by Householder Age in Dolton
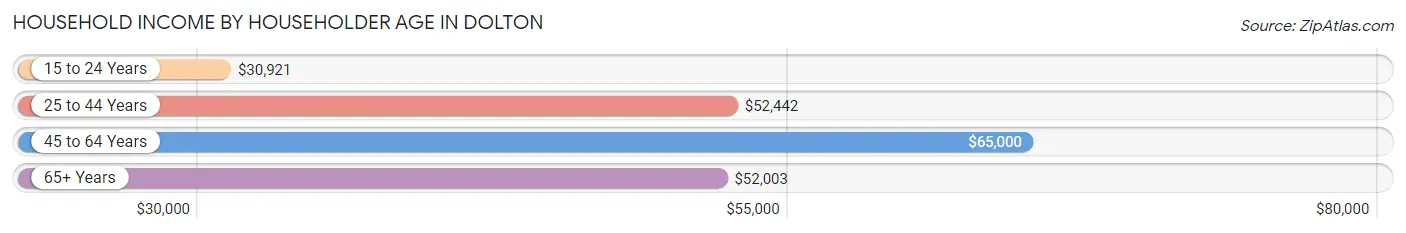
The median household income in Dolton is $54,748, with the highest median household income of $65,000 found in the 45 to 64 years age bracket for the primary householder. A total of 3,606 households (44.5%) fall into this category. Meanwhile, the 15 to 24 years age bracket for the primary householder has the lowest median household income of $30,921, with 162 households (2.0%) in this group.
| Income Bracket | # Households | Median Income |
| 15 to 24 Years | 162 (2.0%) | $30,921 |
| 25 to 44 Years | 1,861 (23.0%) | $52,442 |
| 45 to 64 Years | 3,606 (44.5%) | $65,000 |
| 65+ Years | 2,481 (30.6%) | $52,003 |
| Total | 8,110 (100.0%) | $54,748 |
Poverty in Dolton
Income Below Poverty by Sex and Age in Dolton
With 23.3% poverty level for males and 17.2% for females among the residents of Dolton, 15 year old males and 5 year old females are the most vulnerable to poverty, with 116 males (86.6%) and 9 females (47.4%) in their respective age groups living below the poverty level.
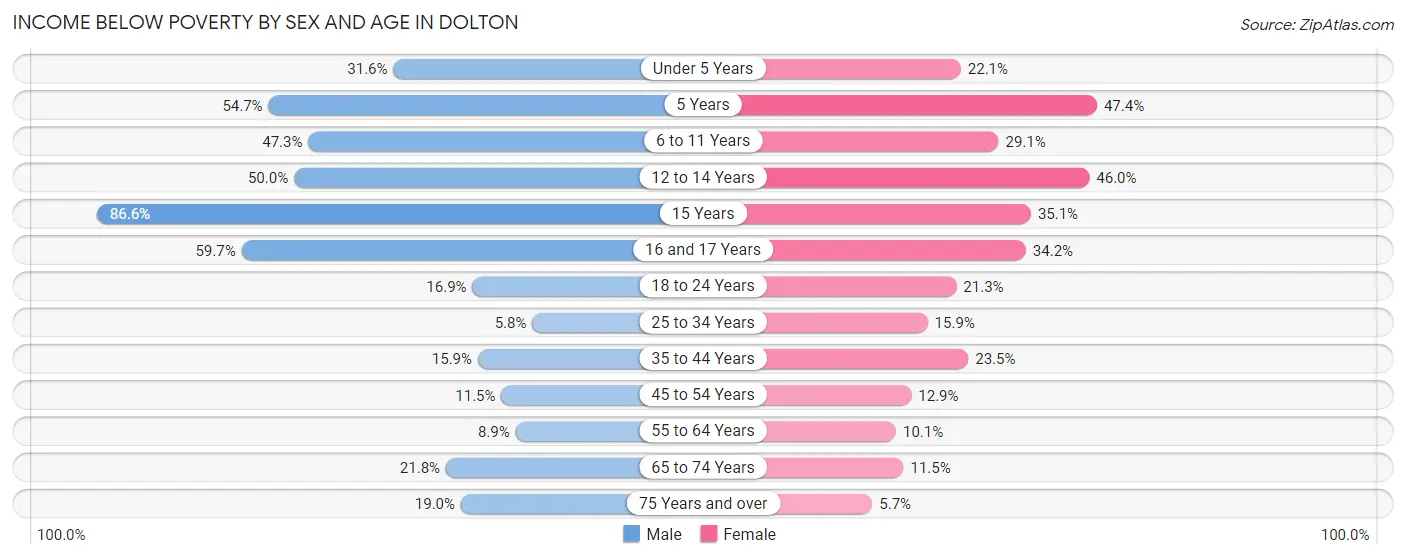
| Age Bracket | Male | Female |
| Under 5 Years | 247 (31.6%) | 80 (22.1%) |
| 5 Years | 52 (54.7%) | 9 (47.4%) |
| 6 to 11 Years | 526 (47.3%) | 211 (29.1%) |
| 12 to 14 Years | 213 (50.0%) | 142 (46.0%) |
| 15 Years | 116 (86.6%) | 33 (35.1%) |
| 16 and 17 Years | 230 (59.7%) | 95 (34.2%) |
| 18 to 24 Years | 195 (16.9%) | 167 (21.3%) |
| 25 to 34 Years | 64 (5.8%) | 256 (15.9%) |
| 35 to 44 Years | 147 (15.9%) | 289 (23.5%) |
| 45 to 54 Years | 124 (11.5%) | 193 (12.9%) |
| 55 to 64 Years | 122 (8.9%) | 169 (10.1%) |
| 65 to 74 Years | 203 (21.8%) | 159 (11.5%) |
| 75 Years and over | 89 (19.0%) | 43 (5.7%) |
| Total | 2,328 (23.3%) | 1,846 (17.2%) |
Income Above Poverty by Sex and Age in Dolton
According to the poverty statistics in Dolton, males aged 25 to 34 years and females aged 75 years and over are the age groups that are most secure financially, with 94.2% of males and 94.3% of females in these age groups living above the poverty line.
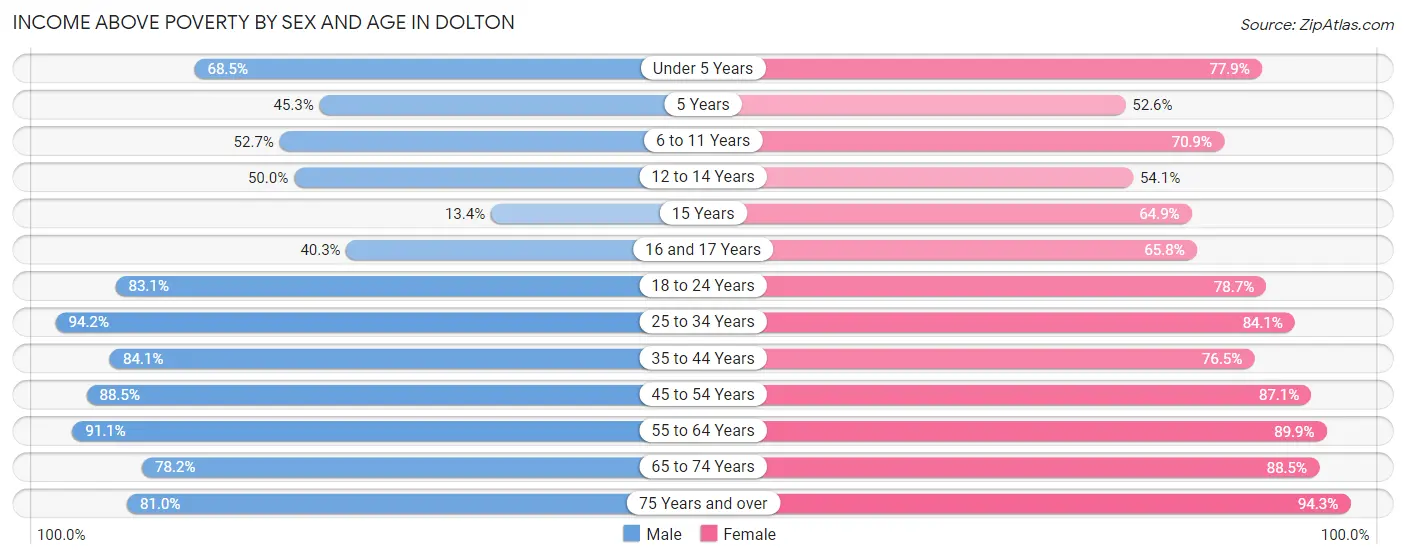
| Age Bracket | Male | Female |
| Under 5 Years | 536 (68.4%) | 282 (77.9%) |
| 5 Years | 43 (45.3%) | 10 (52.6%) |
| 6 to 11 Years | 585 (52.7%) | 514 (70.9%) |
| 12 to 14 Years | 213 (50.0%) | 167 (54.0%) |
| 15 Years | 18 (13.4%) | 61 (64.9%) |
| 16 and 17 Years | 155 (40.3%) | 183 (65.8%) |
| 18 to 24 Years | 960 (83.1%) | 618 (78.7%) |
| 25 to 34 Years | 1,048 (94.2%) | 1,350 (84.1%) |
| 35 to 44 Years | 779 (84.1%) | 942 (76.5%) |
| 45 to 54 Years | 953 (88.5%) | 1,302 (87.1%) |
| 55 to 64 Years | 1,253 (91.1%) | 1,509 (89.9%) |
| 65 to 74 Years | 728 (78.2%) | 1,227 (88.5%) |
| 75 Years and over | 379 (81.0%) | 716 (94.3%) |
| Total | 7,650 (76.7%) | 8,881 (82.8%) |
Income Below Poverty Among Married-Couple Families in Dolton
The poverty statistics for married-couple families in Dolton show that 9.2% or 169 of the total 1,828 families live below the poverty line. Families with 5 or more children have the highest poverty rate of 100.0%, comprising of 71 families. On the other hand, families with no children have the lowest poverty rate of 4.3%, which includes 62 families.
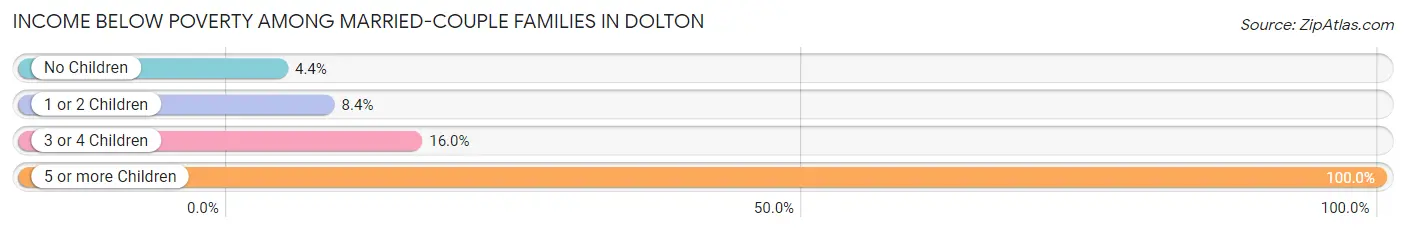
| Children | Above Poverty | Below Poverty |
| No Children | 1,363 (95.7%) | 62 (4.3%) |
| 1 or 2 Children | 207 (91.6%) | 19 (8.4%) |
| 3 or 4 Children | 89 (84.0%) | 17 (16.0%) |
| 5 or more Children | 0 (0.0%) | 71 (100.0%) |
| Total | 1,659 (90.7%) | 169 (9.2%) |
Income Below Poverty Among Single-Parent Households in Dolton
According to the poverty data in Dolton, 16.9% or 121 single-father households and 18.6% or 488 single-mother households are living below the poverty line. Among single-father households, those with 1 or 2 children have the highest poverty rate, with 87 households (31.9%) experiencing poverty. Likewise, among single-mother households, those with 5 or more children have the highest poverty rate, with 104 households (87.4%) falling below the poverty line.
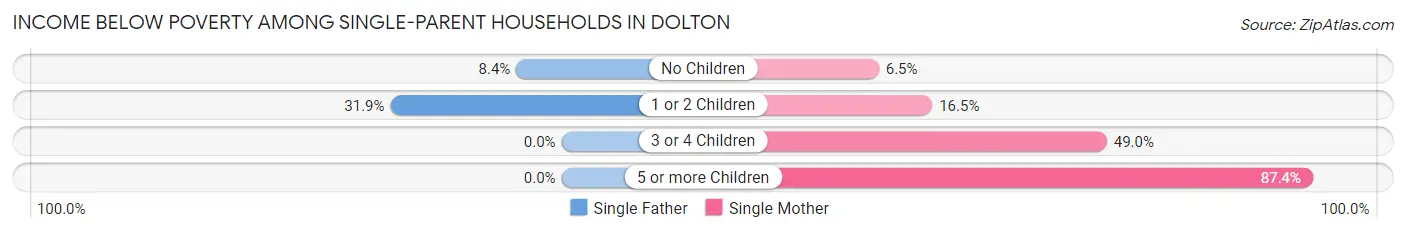
| Children | Single Father | Single Mother |
| No Children | 34 (8.4%) | 84 (6.5%) |
| 1 or 2 Children | 87 (31.9%) | 152 (16.5%) |
| 3 or 4 Children | 0 (0.0%) | 148 (49.0%) |
| 5 or more Children | 0 (0.0%) | 104 (87.4%) |
| Total | 121 (16.9%) | 488 (18.6%) |
Income Below Poverty Among Married-Couple vs Single-Parent Households in Dolton
The poverty data for Dolton shows that 169 of the married-couple family households (9.2%) and 609 of the single-parent households (18.2%) are living below the poverty level. Within the married-couple family households, those with 5 or more children have the highest poverty rate, with 71 households (100.0%) falling below the poverty line. Among the single-parent households, those with 5 or more children have the highest poverty rate, with 104 household (87.4%) living below poverty.
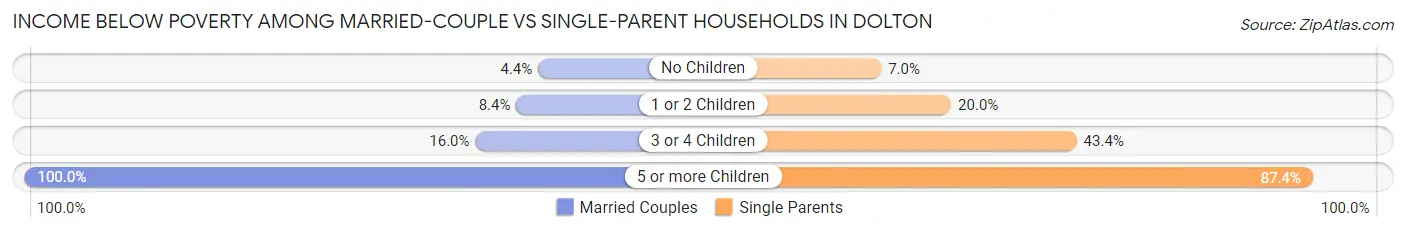
| Children | Married-Couple Families | Single-Parent Households |
| No Children | 62 (4.3%) | 118 (7.0%) |
| 1 or 2 Children | 19 (8.4%) | 239 (20.0%) |
| 3 or 4 Children | 17 (16.0%) | 148 (43.4%) |
| 5 or more Children | 71 (100.0%) | 104 (87.4%) |
| Total | 169 (9.2%) | 609 (18.2%) |
Race in Dolton
The most populous races in Dolton are Black / African American (19,409 | 91.2%), White / Caucasian (1,056 | 5.0%), and Two or more Races (567 | 2.7%).
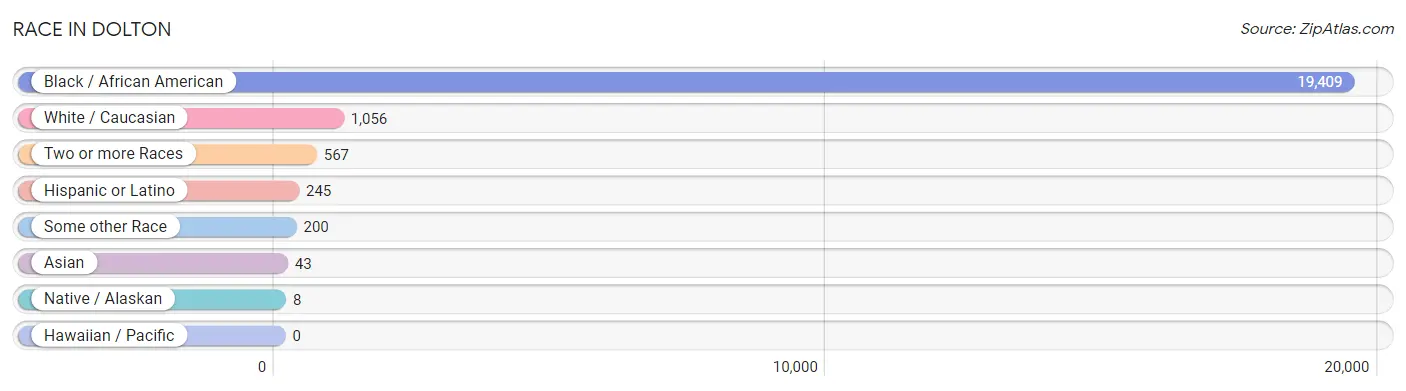
| Race | # Population | % Population |
| Asian | 43 | 0.2% |
| Black / African American | 19,409 | 91.2% |
| Hawaiian / Pacific | 0 | 0.0% |
| Hispanic or Latino | 245 | 1.1% |
| Native / Alaskan | 8 | 0.0% |
| White / Caucasian | 1,056 | 5.0% |
| Two or more Races | 567 | 2.7% |
| Some other Race | 200 | 0.9% |
| Total | 21,283 | 100.0% |
Ancestry in Dolton
The most populous ancestries reported in Dolton are Subsaharan African (720 | 3.4%), African (671 | 3.2%), Italian (393 | 1.8%), American (388 | 1.8%), and Irish (272 | 1.3%), together accounting for 11.5% of all Dolton residents.
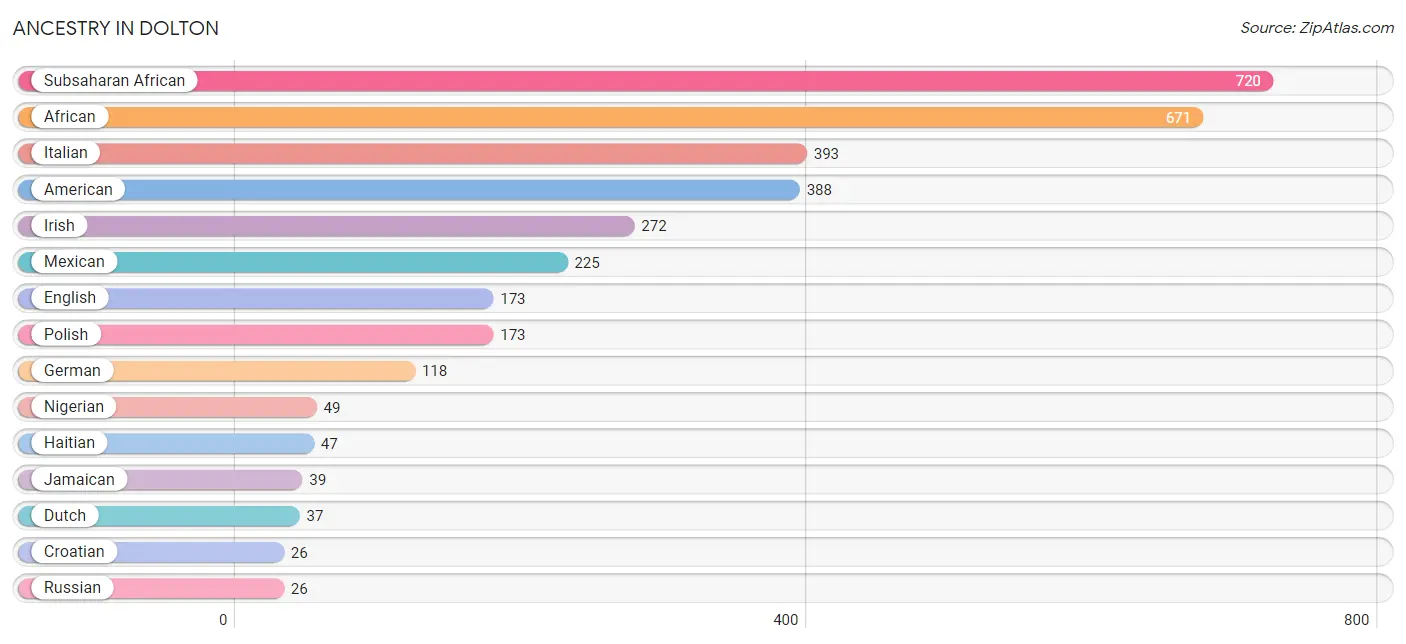
| Ancestry | # Population | % Population |
| African | 671 | 3.2% |
| American | 388 | 1.8% |
| Blackfeet | 19 | 0.1% |
| Central American | 13 | 0.1% |
| Cherokee | 16 | 0.1% |
| Choctaw | 10 | 0.1% |
| Croatian | 26 | 0.1% |
| Danish | 11 | 0.1% |
| Dutch | 37 | 0.2% |
| English | 173 | 0.8% |
| European | 12 | 0.1% |
| French | 19 | 0.1% |
| German | 118 | 0.5% |
| Guyanese | 11 | 0.1% |
| Haitian | 47 | 0.2% |
| Irish | 272 | 1.3% |
| Italian | 393 | 1.8% |
| Jamaican | 39 | 0.2% |
| Korean | 15 | 0.1% |
| Mexican | 225 | 1.1% |
| Nigerian | 49 | 0.2% |
| Norwegian | 9 | 0.0% |
| Pakistani | 4 | 0.0% |
| Polish | 173 | 0.8% |
| Puerto Rican | 7 | 0.0% |
| Russian | 26 | 0.1% |
| Salvadoran | 13 | 0.1% |
| Scottish | 15 | 0.1% |
| Slovene | 17 | 0.1% |
| Subsaharan African | 720 | 3.4% |
| Swedish | 20 | 0.1% |
| Thai | 24 | 0.1% |
| Ukrainian | 18 | 0.1% | View All 33 Rows |
Immigrants in Dolton
The most numerous immigrant groups reported in Dolton came from Latin America (180 | 0.9%), Africa (149 | 0.7%), Western Africa (149 | 0.7%), Caribbean (104 | 0.5%), and Nigeria (85 | 0.4%), together accounting for 3.1% of all Dolton residents.
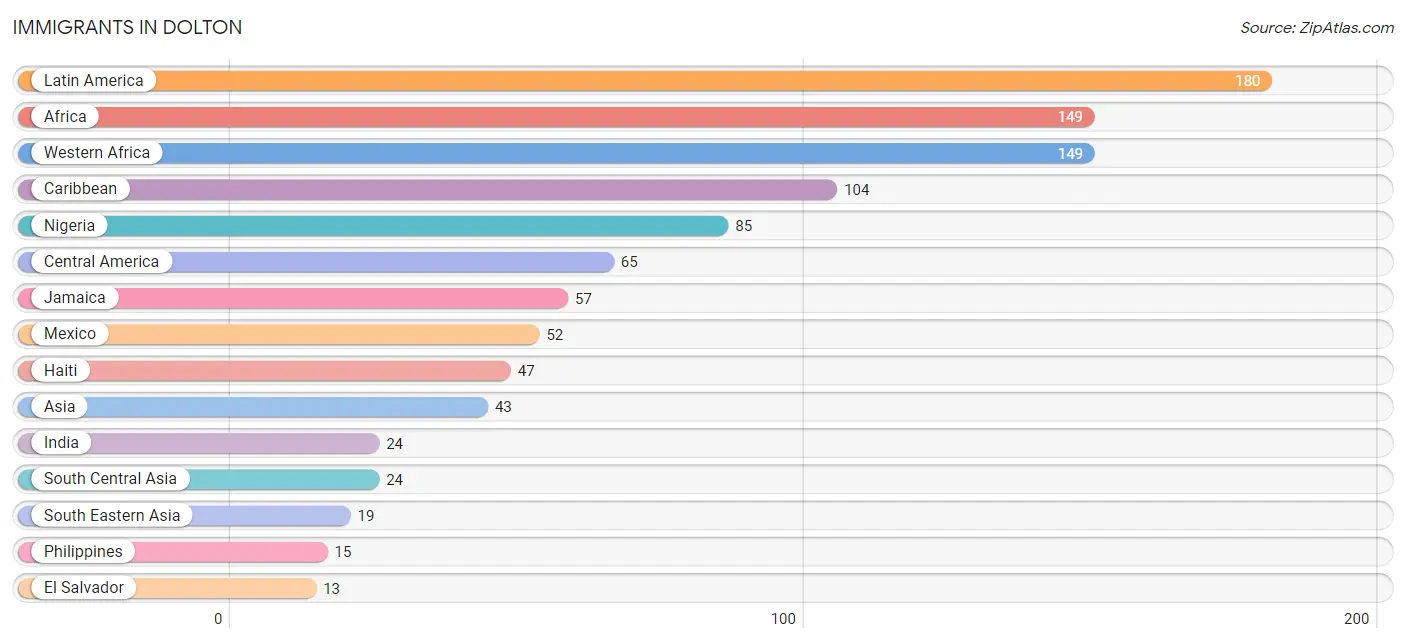
| Immigration Origin | # Population | % Population |
| Africa | 149 | 0.7% |
| Asia | 43 | 0.2% |
| Caribbean | 104 | 0.5% |
| Central America | 65 | 0.3% |
| El Salvador | 13 | 0.1% |
| Guyana | 11 | 0.1% |
| Haiti | 47 | 0.2% |
| India | 24 | 0.1% |
| Jamaica | 57 | 0.3% |
| Latin America | 180 | 0.9% |
| Mexico | 52 | 0.2% |
| Nigeria | 85 | 0.4% |
| Philippines | 15 | 0.1% |
| South America | 11 | 0.1% |
| South Central Asia | 24 | 0.1% |
| South Eastern Asia | 19 | 0.1% |
| Thailand | 4 | 0.0% |
| Western Africa | 149 | 0.7% | View All 18 Rows |
Sex and Age in Dolton
Sex and Age in Dolton
The most populous age groups in Dolton are Under 5 Years (989 | 9.5%) for men and 60 to 64 Years (952 | 8.7%) for women.
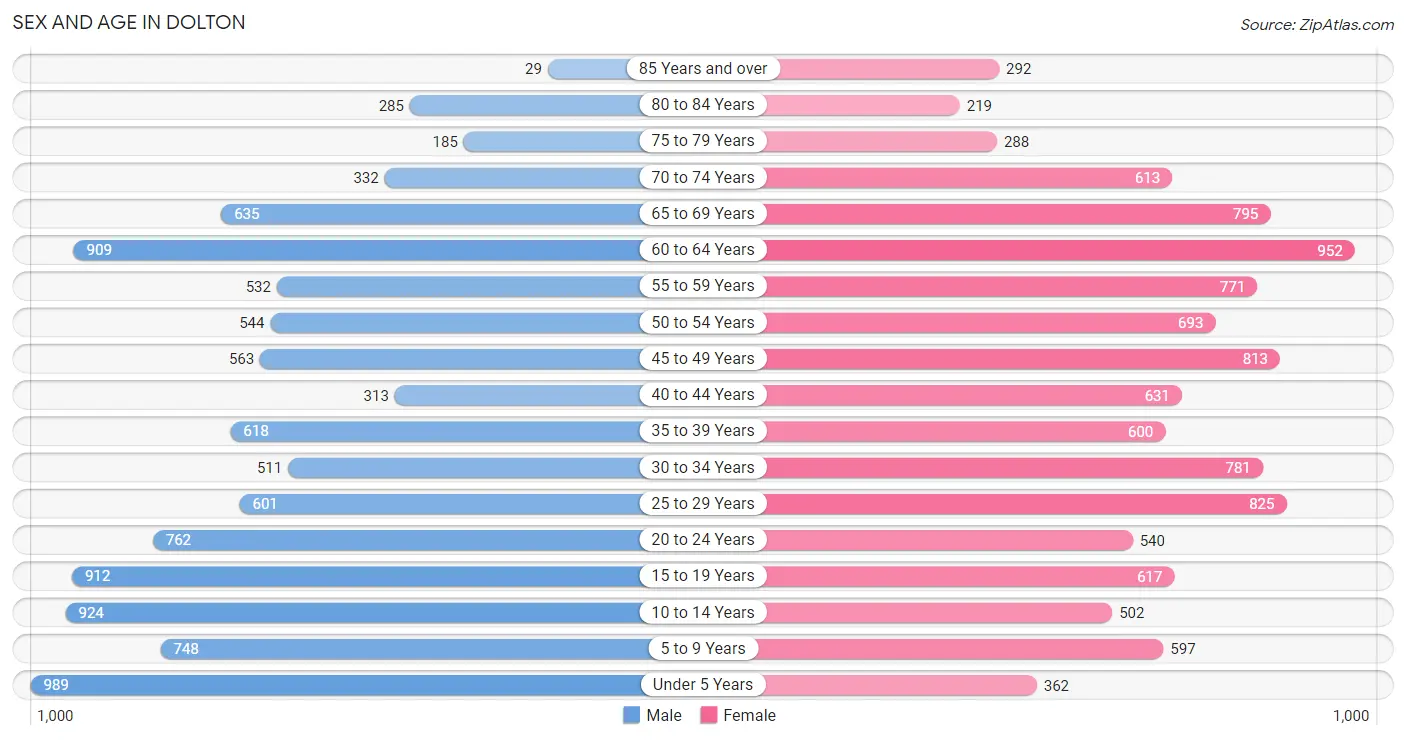
| Age Bracket | Male | Female |
| Under 5 Years | 989 (9.5%) | 362 (3.3%) |
| 5 to 9 Years | 748 (7.2%) | 597 (5.5%) |
| 10 to 14 Years | 924 (8.9%) | 502 (4.6%) |
| 15 to 19 Years | 912 (8.8%) | 617 (5.7%) |
| 20 to 24 Years | 762 (7.3%) | 540 (5.0%) |
| 25 to 29 Years | 601 (5.8%) | 825 (7.6%) |
| 30 to 34 Years | 511 (4.9%) | 781 (7.2%) |
| 35 to 39 Years | 618 (5.9%) | 600 (5.5%) |
| 40 to 44 Years | 313 (3.0%) | 631 (5.8%) |
| 45 to 49 Years | 563 (5.4%) | 813 (7.5%) |
| 50 to 54 Years | 544 (5.2%) | 693 (6.4%) |
| 55 to 59 Years | 532 (5.1%) | 771 (7.1%) |
| 60 to 64 Years | 909 (8.7%) | 952 (8.7%) |
| 65 to 69 Years | 635 (6.1%) | 795 (7.3%) |
| 70 to 74 Years | 332 (3.2%) | 613 (5.6%) |
| 75 to 79 Years | 185 (1.8%) | 288 (2.6%) |
| 80 to 84 Years | 285 (2.7%) | 219 (2.0%) |
| 85 Years and over | 29 (0.3%) | 292 (2.7%) |
| Total | 10,392 (100.0%) | 10,891 (100.0%) |
Families and Households in Dolton
Median Family Size in Dolton
The median family size in Dolton is 3.28 persons per family, with single female/mother families (2,626 | 50.8%) accounting for the largest median family size of 3.38 persons per family. On the other hand, single male/father families (715 | 13.8%) represent the smallest median family size with 2.94 persons per family.
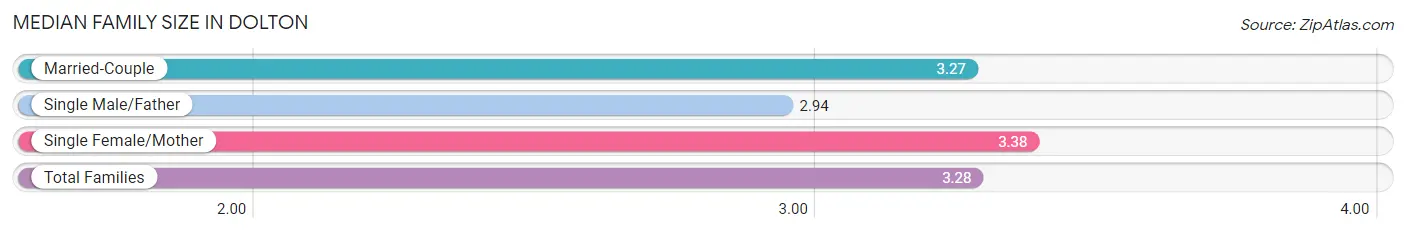
| Family Type | # Families | Family Size |
| Married-Couple | 1,828 (35.4%) | 3.27 |
| Single Male/Father | 715 (13.8%) | 2.94 |
| Single Female/Mother | 2,626 (50.8%) | 3.38 |
| Total Families | 5,169 (100.0%) | 3.28 |
Median Household Size in Dolton
The median household size in Dolton is 2.59 persons per household, with single female/mother households (2,626 | 32.4%) accounting for the largest median household size of 3.5 persons per household. non-family households (2,941 | 36.3%) represent the smallest median household size with 1.20 persons per household.
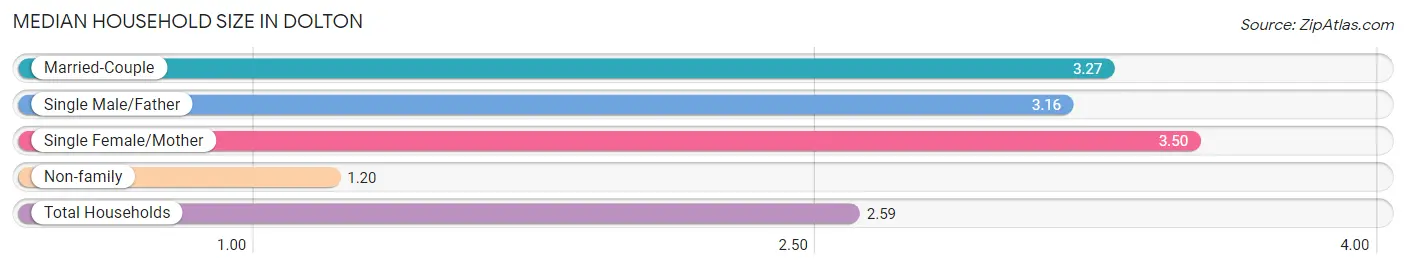
| Household Type | # Households | Household Size |
| Married-Couple | 1,828 (22.5%) | 3.27 |
| Single Male/Father | 715 (8.8%) | 3.16 |
| Single Female/Mother | 2,626 (32.4%) | 3.50 |
| Non-family | 2,941 (36.3%) | 1.20 |
| Total Households | 8,110 (100.0%) | 2.59 |
Household Size by Marriage Status in Dolton
Out of a total of 8,110 households in Dolton, 5,169 (63.7%) are family households, while 2,941 (36.3%) are nonfamily households. The most numerous type of family households are 2-person households, comprising 2,303, and the most common type of nonfamily households are 1-person households, comprising 2,641.
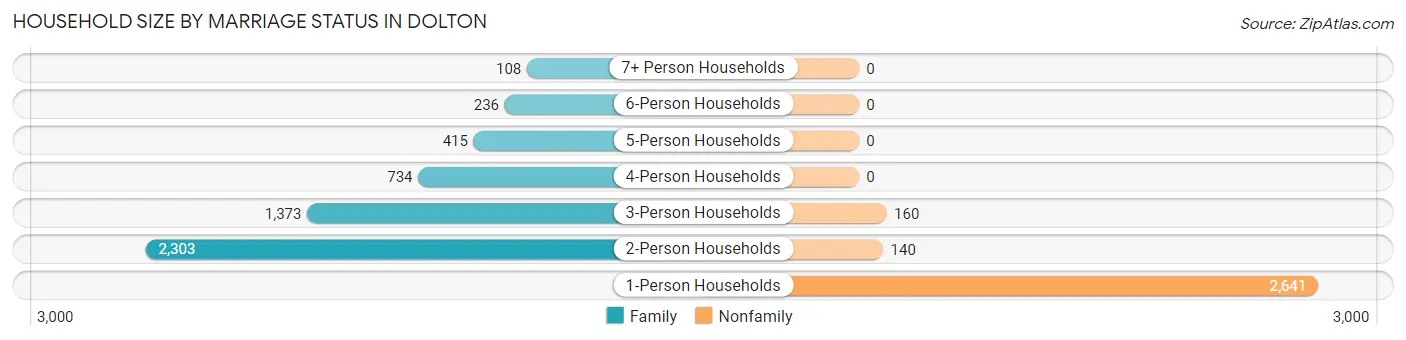
| Household Size | Family Households | Nonfamily Households |
| 1-Person Households | - | 2,641 (32.6%) |
| 2-Person Households | 2,303 (28.4%) | 140 (1.7%) |
| 3-Person Households | 1,373 (16.9%) | 160 (2.0%) |
| 4-Person Households | 734 (9.0%) | 0 (0.0%) |
| 5-Person Households | 415 (5.1%) | 0 (0.0%) |
| 6-Person Households | 236 (2.9%) | 0 (0.0%) |
| 7+ Person Households | 108 (1.3%) | 0 (0.0%) |
| Total | 5,169 (63.7%) | 2,941 (36.3%) |
Female Fertility in Dolton
Fertility by Age in Dolton
Average fertility rate in Dolton is 58.0 births per 1,000 women. Women in the age bracket of 20 to 34 years have the highest fertility rate with 100.0 births per 1,000 women. Women in the age bracket of 20 to 34 years acount for 73.3% of all women with births.
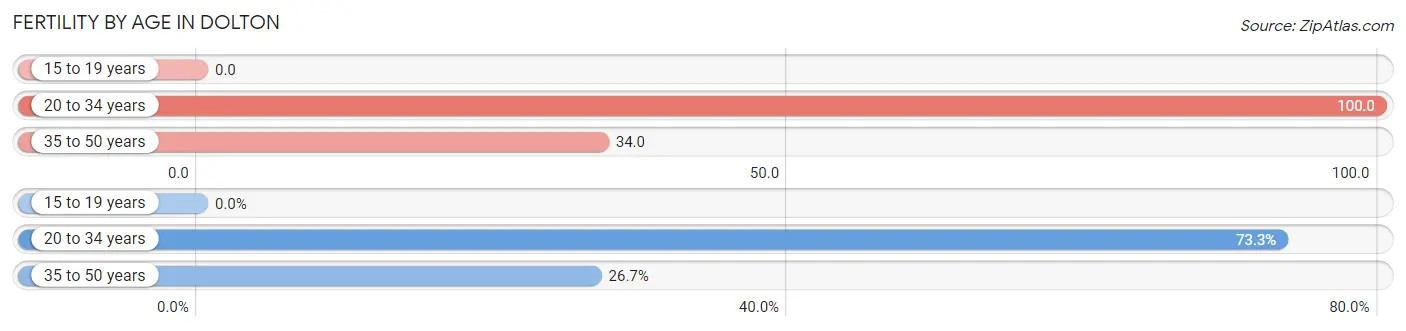
| Age Bracket | Women with Births | Births / 1,000 Women |
| 15 to 19 years | 0 (0.0%) | 0.0 |
| 20 to 34 years | 214 (73.3%) | 100.0 |
| 35 to 50 years | 78 (26.7%) | 34.0 |
| Total | 292 (100.0%) | 58.0 |
Fertility by Age by Marriage Status in Dolton
6.8% of women with births (292) in Dolton are married. The highest percentage of unmarried women with births falls into 35 to 50 years age bracket with 100.0% of them unmarried at the time of birth, while the lowest percentage of unmarried women with births belong to 20 to 34 years age bracket with 90.6% of them unmarried.
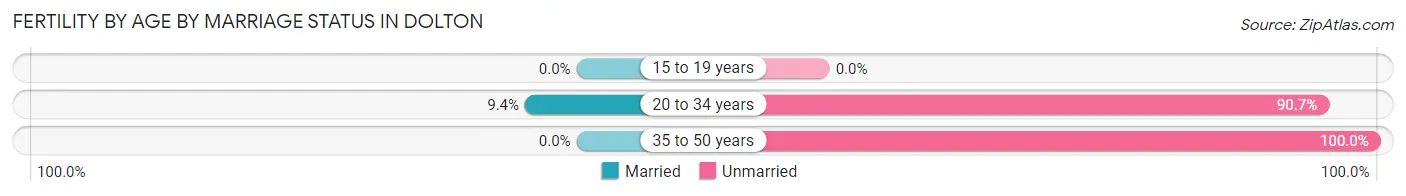
| Age Bracket | Married | Unmarried |
| 15 to 19 years | 0 (0.0%) | 0 (0.0%) |
| 20 to 34 years | 20 (9.3%) | 194 (90.6%) |
| 35 to 50 years | 0 (0.0%) | 78 (100.0%) |
| Total | 20 (6.9%) | 272 (93.1%) |
Fertility by Education in Dolton
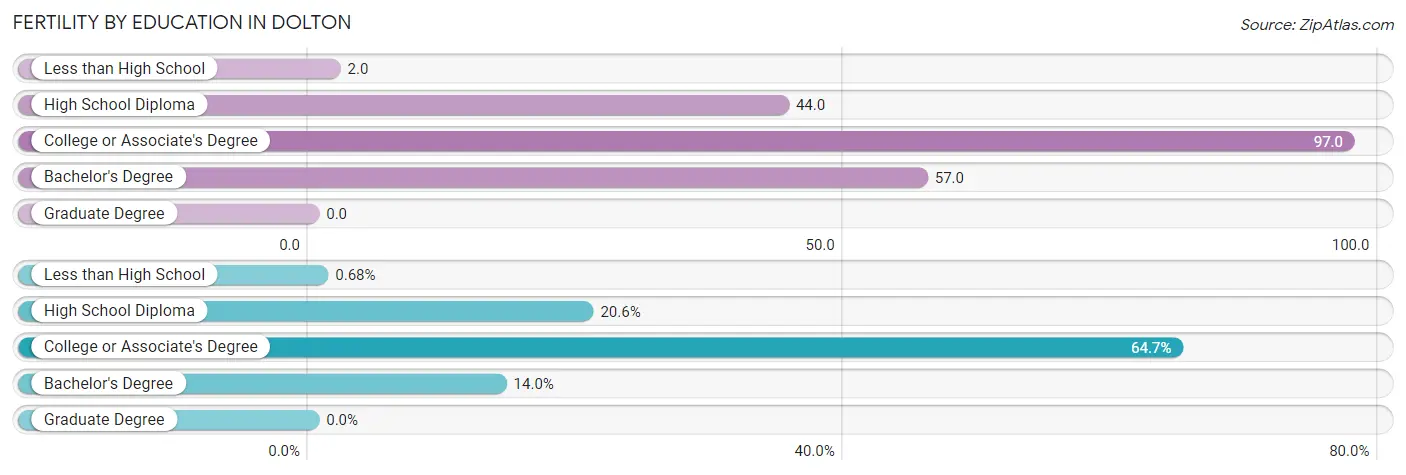
| Educational Attainment | Women with Births | Births / 1,000 Women |
| Less than High School | 2 (0.7%) | 2.0 |
| High School Diploma | 60 (20.5%) | 44.0 |
| College or Associate's Degree | 189 (64.7%) | 97.0 |
| Bachelor's Degree | 41 (14.0%) | 57.0 |
| Graduate Degree | 0 (0.0%) | 0.0 |
| Total | 292 (100.0%) | 58.0 |
Fertility by Education by Marriage Status in Dolton
93.1% of women with births in Dolton are unmarried. Women with the educational attainment of less than high school are most likely to be married with 100.0% of them married at childbirth, while women with the educational attainment of college or associate's degree are least likely to be married with 100.0% of them unmarried at childbirth.
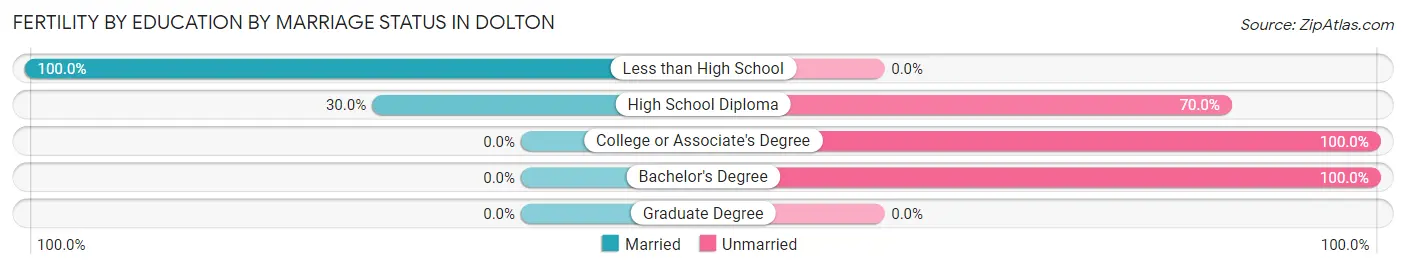
| Educational Attainment | Married | Unmarried |
| Less than High School | 2 (100.0%) | 0 (0.0%) |
| High School Diploma | 18 (30.0%) | 42 (70.0%) |
| College or Associate's Degree | 0 (0.0%) | 189 (100.0%) |
| Bachelor's Degree | 0 (0.0%) | 41 (100.0%) |
| Graduate Degree | 0 (0.0%) | 0 (0.0%) |
| Total | 20 (6.9%) | 272 (93.1%) |
Employment Characteristics in Dolton
Employment by Class of Employer in Dolton
Among the 8,228 employed individuals in Dolton, private company employees (5,099 | 62.0%), not-for-profit organizations (1,001 | 12.2%), and state government employees (642 | 7.8%) make up the most common classes of employment.
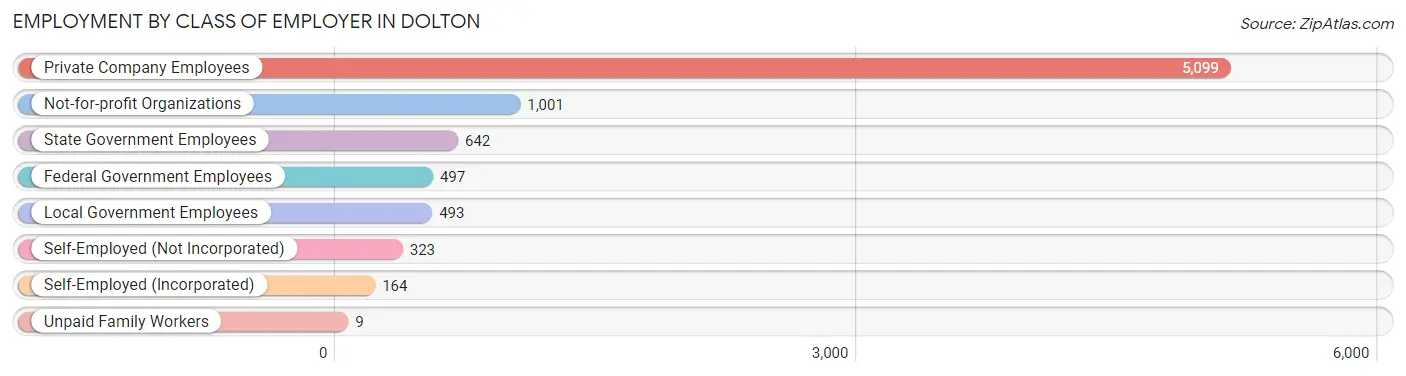
| Employer Class | # Employees | % Employees |
| Private Company Employees | 5,099 | 62.0% |
| Self-Employed (Incorporated) | 164 | 2.0% |
| Self-Employed (Not Incorporated) | 323 | 3.9% |
| Not-for-profit Organizations | 1,001 | 12.2% |
| Local Government Employees | 493 | 6.0% |
| State Government Employees | 642 | 7.8% |
| Federal Government Employees | 497 | 6.0% |
| Unpaid Family Workers | 9 | 0.1% |
| Total | 8,228 | 100.0% |
Employment Status by Age in Dolton
According to the labor force statistics for Dolton, out of the total population over 16 years of age (16,933), 57.6% or 9,753 individuals are in the labor force, with 12.7% or 1,239 of them unemployed. The age group with the highest labor force participation rate is 25 to 29 years, with 90.4% or 1,289 individuals in the labor force. Within the labor force, the 16 to 19 years age range has the highest percentage of unemployed individuals, with 27.7% or 121 of them being unemployed.
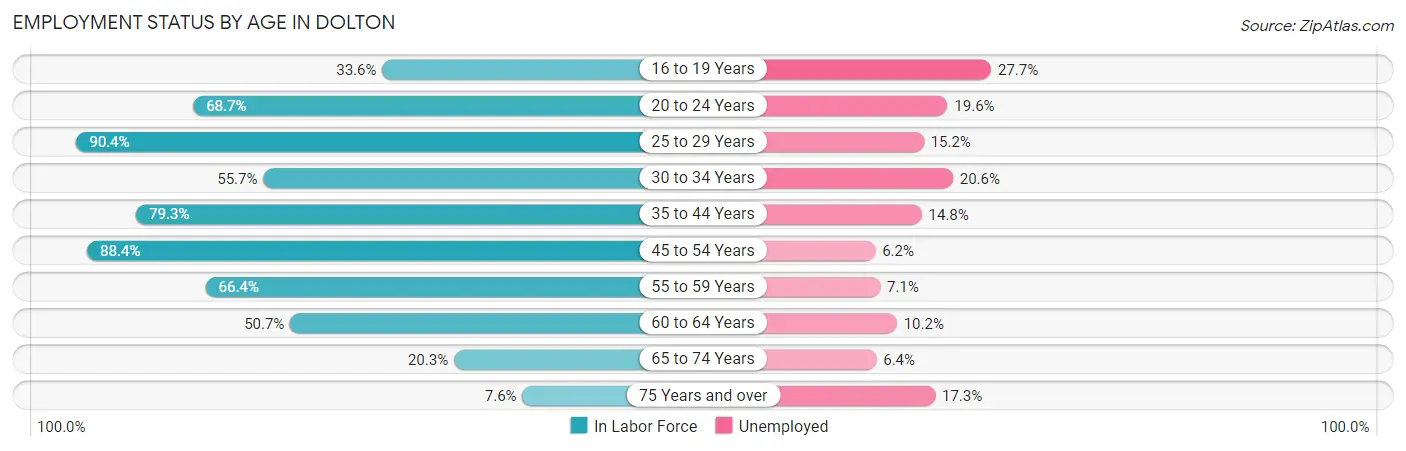
| Age Bracket | In Labor Force | Unemployed |
| 16 to 19 Years | 437 (33.6%) | 121 (27.7%) |
| 20 to 24 Years | 894 (68.7%) | 175 (19.6%) |
| 25 to 29 Years | 1,289 (90.4%) | 196 (15.2%) |
| 30 to 34 Years | 720 (55.7%) | 148 (20.6%) |
| 35 to 44 Years | 1,714 (79.3%) | 254 (14.8%) |
| 45 to 54 Years | 2,310 (88.4%) | 143 (6.2%) |
| 55 to 59 Years | 865 (66.4%) | 61 (7.1%) |
| 60 to 64 Years | 944 (50.7%) | 96 (10.2%) |
| 65 to 74 Years | 482 (20.3%) | 31 (6.4%) |
| 75 Years and over | 99 (7.6%) | 17 (17.3%) |
| Total | 9,753 (57.6%) | 1,239 (12.7%) |
Employment Status by Educational Attainment in Dolton
According to labor force statistics for Dolton, 73.6% of individuals (7,844) out of the total population between 25 and 64 years of age (10,657) are in the labor force, with 11.4% or 894 of them being unemployed. The group with the highest labor force participation rate are those with the educational attainment of college / associate degree, with 79.5% or 3,275 individuals in the labor force. Within the labor force, individuals with less than high school education have the highest percentage of unemployment, with 19.0% or 107 of them being unemployed.
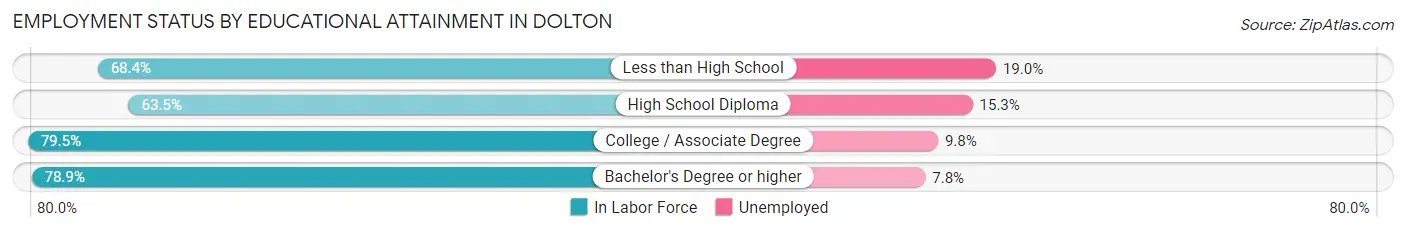
| Educational Attainment | In Labor Force | Unemployed |
| Less than High School | 564 (68.4%) | 157 (19.0%) |
| High School Diploma | 2,076 (63.5%) | 500 (15.3%) |
| College / Associate Degree | 3,275 (79.5%) | 404 (9.8%) |
| Bachelor's Degree or higher | 1,928 (78.9%) | 191 (7.8%) |
| Total | 7,844 (73.6%) | 1,215 (11.4%) |
Employment Occupations by Sex in Dolton
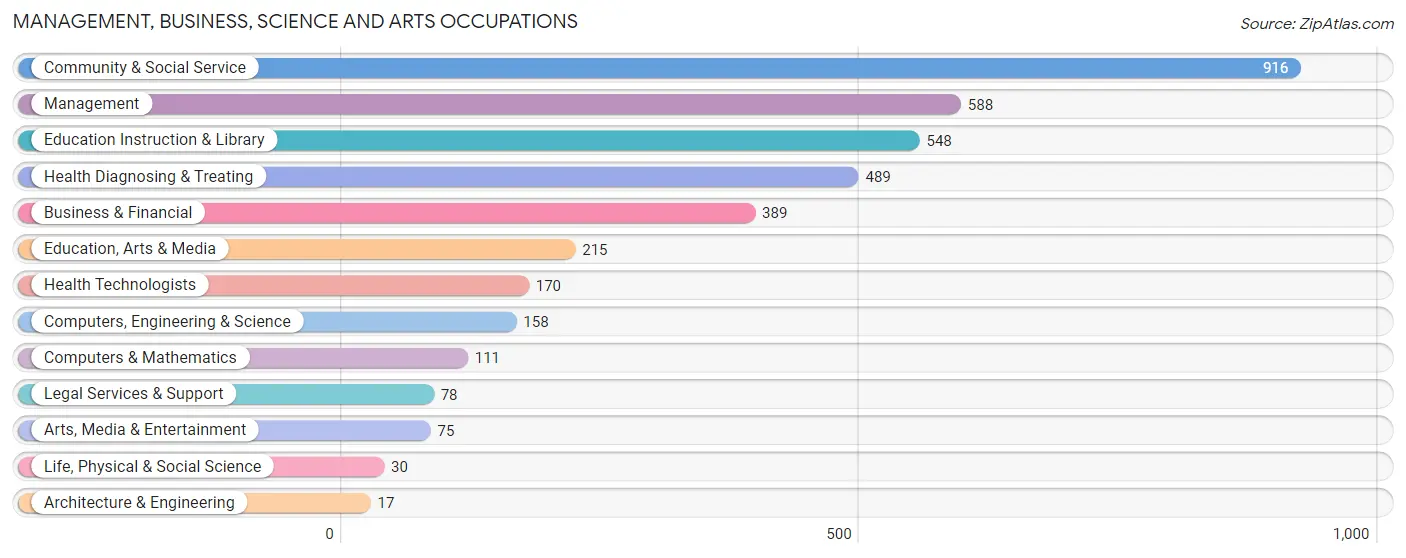
Management, Business, Science and Arts Occupations
The most common Management, Business, Science and Arts occupations in Dolton are Community & Social Service (916 | 10.8%), Management (588 | 6.9%), Education Instruction & Library (548 | 6.5%), Health Diagnosing & Treating (489 | 5.8%), and Business & Financial (389 | 4.6%).
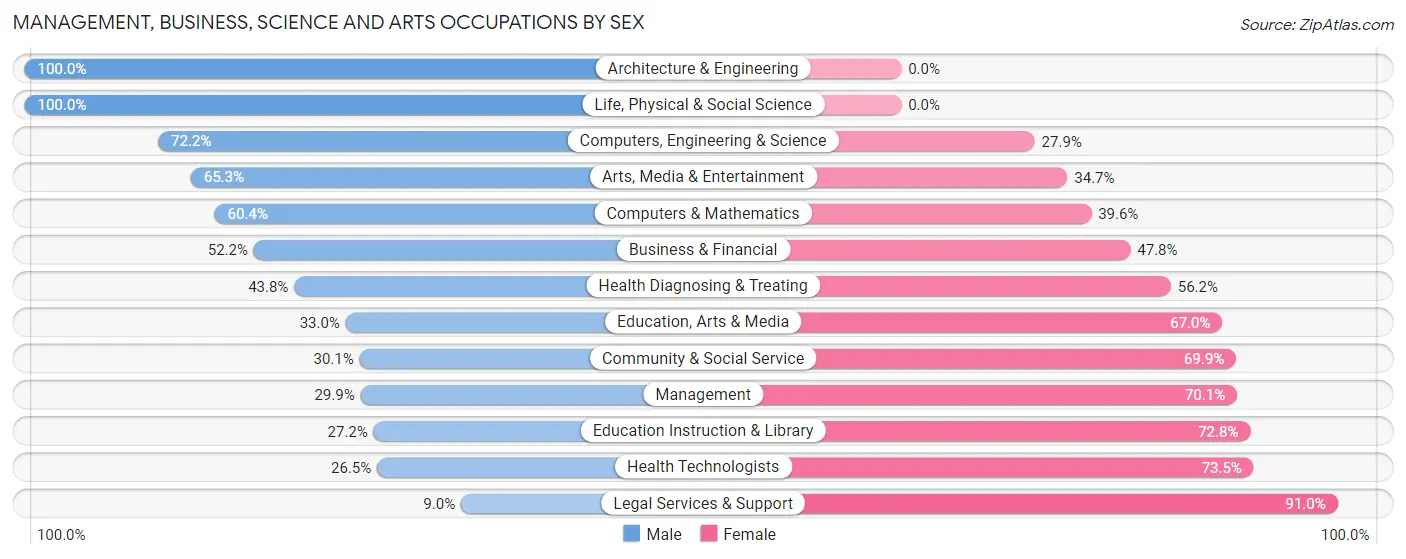
Management, Business, Science and Arts Occupations by Sex
Within the Management, Business, Science and Arts occupations in Dolton, the most male-oriented occupations are Architecture & Engineering (100.0%), Life, Physical & Social Science (100.0%), and Computers, Engineering & Science (72.2%), while the most female-oriented occupations are Legal Services & Support (91.0%), Health Technologists (73.5%), and Education Instruction & Library (72.8%).
| Occupation | Male | Female |
| Management | 176 (29.9%) | 412 (70.1%) |
| Business & Financial | 203 (52.2%) | 186 (47.8%) |
| Computers, Engineering & Science | 114 (72.2%) | 44 (27.9%) |
| Computers & Mathematics | 67 (60.4%) | 44 (39.6%) |
| Architecture & Engineering | 17 (100.0%) | 0 (0.0%) |
| Life, Physical & Social Science | 30 (100.0%) | 0 (0.0%) |
| Community & Social Service | 276 (30.1%) | 640 (69.9%) |
| Education, Arts & Media | 71 (33.0%) | 144 (67.0%) |
| Legal Services & Support | 7 (9.0%) | 71 (91.0%) |
| Education Instruction & Library | 149 (27.2%) | 399 (72.8%) |
| Arts, Media & Entertainment | 49 (65.3%) | 26 (34.7%) |
| Health Diagnosing & Treating | 214 (43.8%) | 275 (56.2%) |
| Health Technologists | 45 (26.5%) | 125 (73.5%) |
| Total (Category) | 983 (38.7%) | 1,557 (61.3%) |
| Total (Overall) | 3,737 (44.1%) | 4,739 (55.9%) |
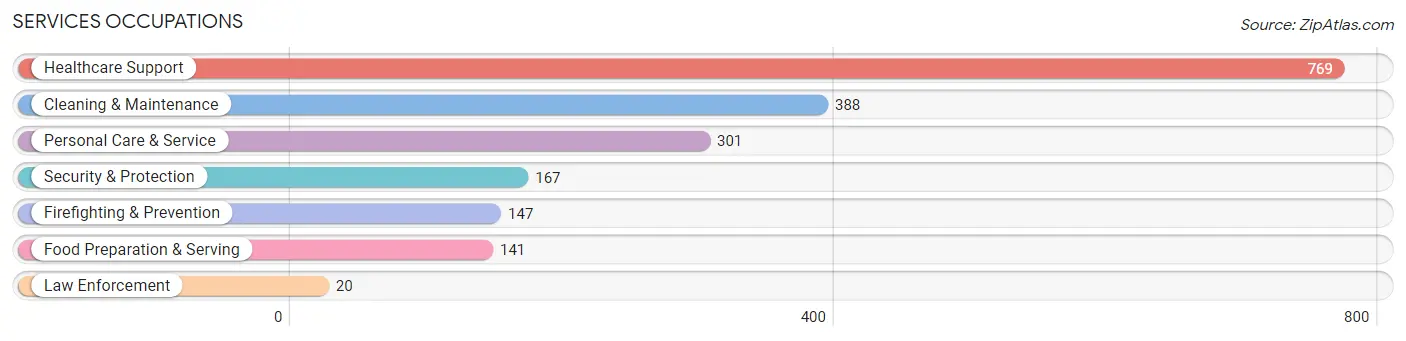
Services Occupations
The most common Services occupations in Dolton are Healthcare Support (769 | 9.1%), Cleaning & Maintenance (388 | 4.6%), Personal Care & Service (301 | 3.5%), Security & Protection (167 | 2.0%), and Firefighting & Prevention (147 | 1.7%).
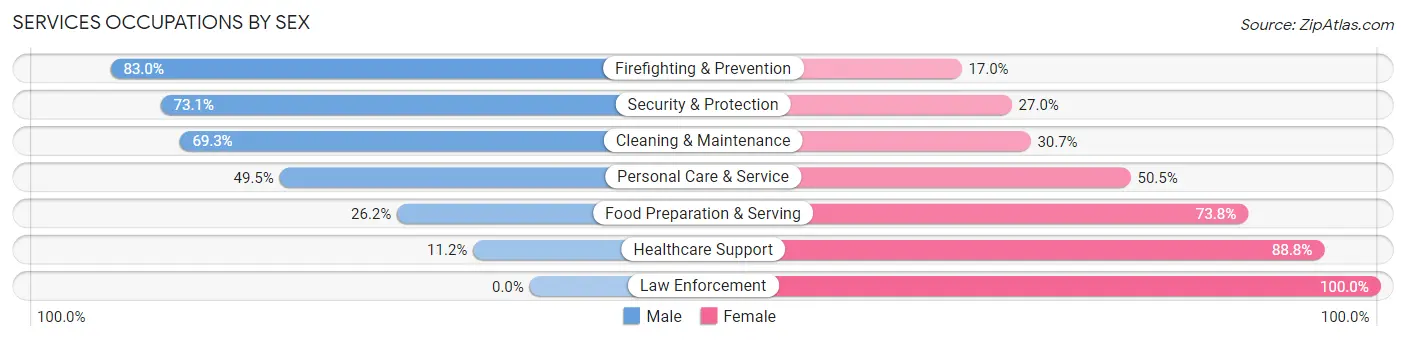
Services Occupations by Sex
Within the Services occupations in Dolton, the most male-oriented occupations are Firefighting & Prevention (83.0%), Security & Protection (73.1%), and Cleaning & Maintenance (69.3%), while the most female-oriented occupations are Law Enforcement (100.0%), Healthcare Support (88.8%), and Food Preparation & Serving (73.8%).
| Occupation | Male | Female |
| Healthcare Support | 86 (11.2%) | 683 (88.8%) |
| Security & Protection | 122 (73.1%) | 45 (27.0%) |
| Firefighting & Prevention | 122 (83.0%) | 25 (17.0%) |
| Law Enforcement | 0 (0.0%) | 20 (100.0%) |
| Food Preparation & Serving | 37 (26.2%) | 104 (73.8%) |
| Cleaning & Maintenance | 269 (69.3%) | 119 (30.7%) |
| Personal Care & Service | 149 (49.5%) | 152 (50.5%) |
| Total (Category) | 663 (37.5%) | 1,103 (62.5%) |
| Total (Overall) | 3,737 (44.1%) | 4,739 (55.9%) |
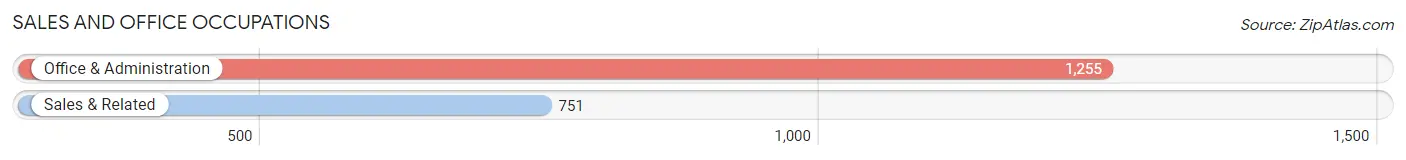
Sales and Office Occupations
The most common Sales and Office occupations in Dolton are Office & Administration (1,255 | 14.8%), and Sales & Related (751 | 8.9%).
Sales and Office Occupations by Sex
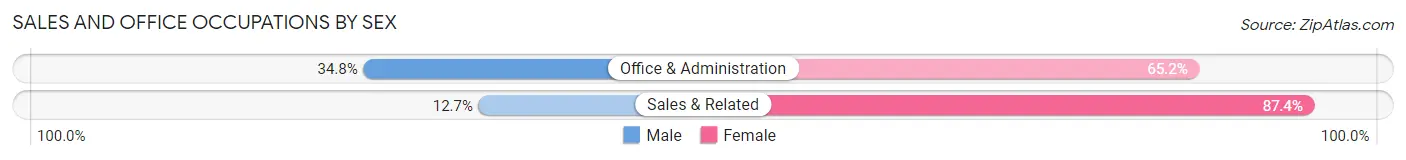
| Occupation | Male | Female |
| Sales & Related | 95 (12.7%) | 656 (87.4%) |
| Office & Administration | 437 (34.8%) | 818 (65.2%) |
| Total (Category) | 532 (26.5%) | 1,474 (73.5%) |
| Total (Overall) | 3,737 (44.1%) | 4,739 (55.9%) |
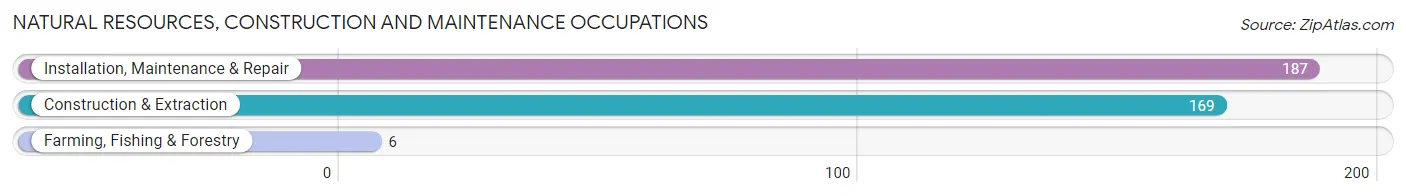
Natural Resources, Construction and Maintenance Occupations
The most common Natural Resources, Construction and Maintenance occupations in Dolton are Installation, Maintenance & Repair (187 | 2.2%), Construction & Extraction (169 | 2.0%), and Farming, Fishing & Forestry (6 | 0.1%).
Natural Resources, Construction and Maintenance Occupations by Sex
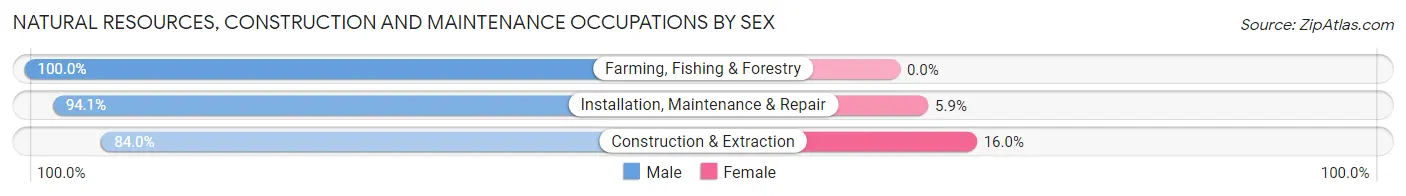
| Occupation | Male | Female |
| Farming, Fishing & Forestry | 6 (100.0%) | 0 (0.0%) |
| Construction & Extraction | 142 (84.0%) | 27 (16.0%) |
| Installation, Maintenance & Repair | 176 (94.1%) | 11 (5.9%) |
| Total (Category) | 324 (89.5%) | 38 (10.5%) |
| Total (Overall) | 3,737 (44.1%) | 4,739 (55.9%) |
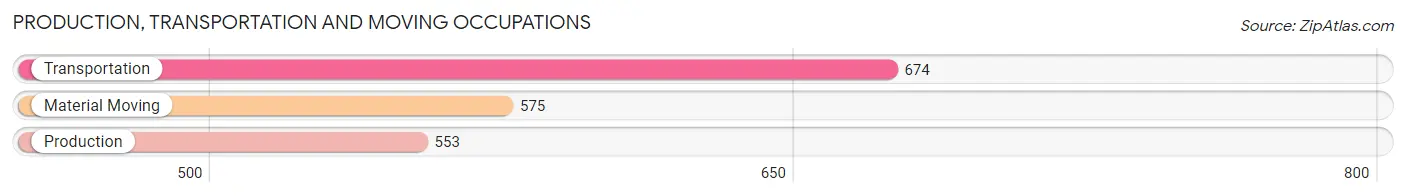
Production, Transportation and Moving Occupations
The most common Production, Transportation and Moving occupations in Dolton are Transportation (674 | 8.0%), Material Moving (575 | 6.8%), and Production (553 | 6.5%).
Production, Transportation and Moving Occupations by Sex
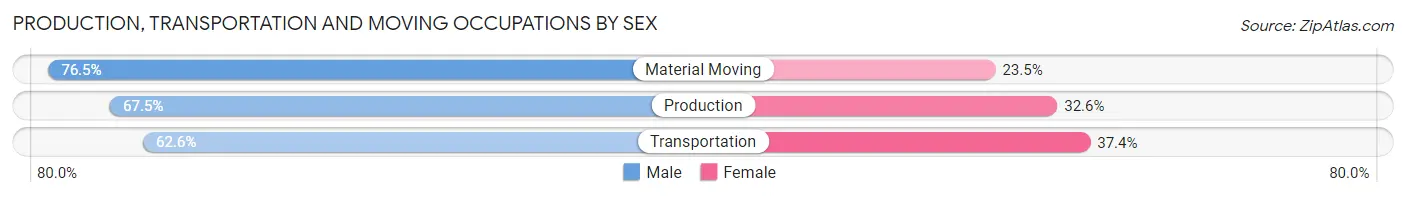
| Occupation | Male | Female |
| Production | 373 (67.4%) | 180 (32.6%) |
| Transportation | 422 (62.6%) | 252 (37.4%) |
| Material Moving | 440 (76.5%) | 135 (23.5%) |
| Total (Category) | 1,235 (68.5%) | 567 (31.5%) |
| Total (Overall) | 3,737 (44.1%) | 4,739 (55.9%) |
Employment Industries by Sex in Dolton
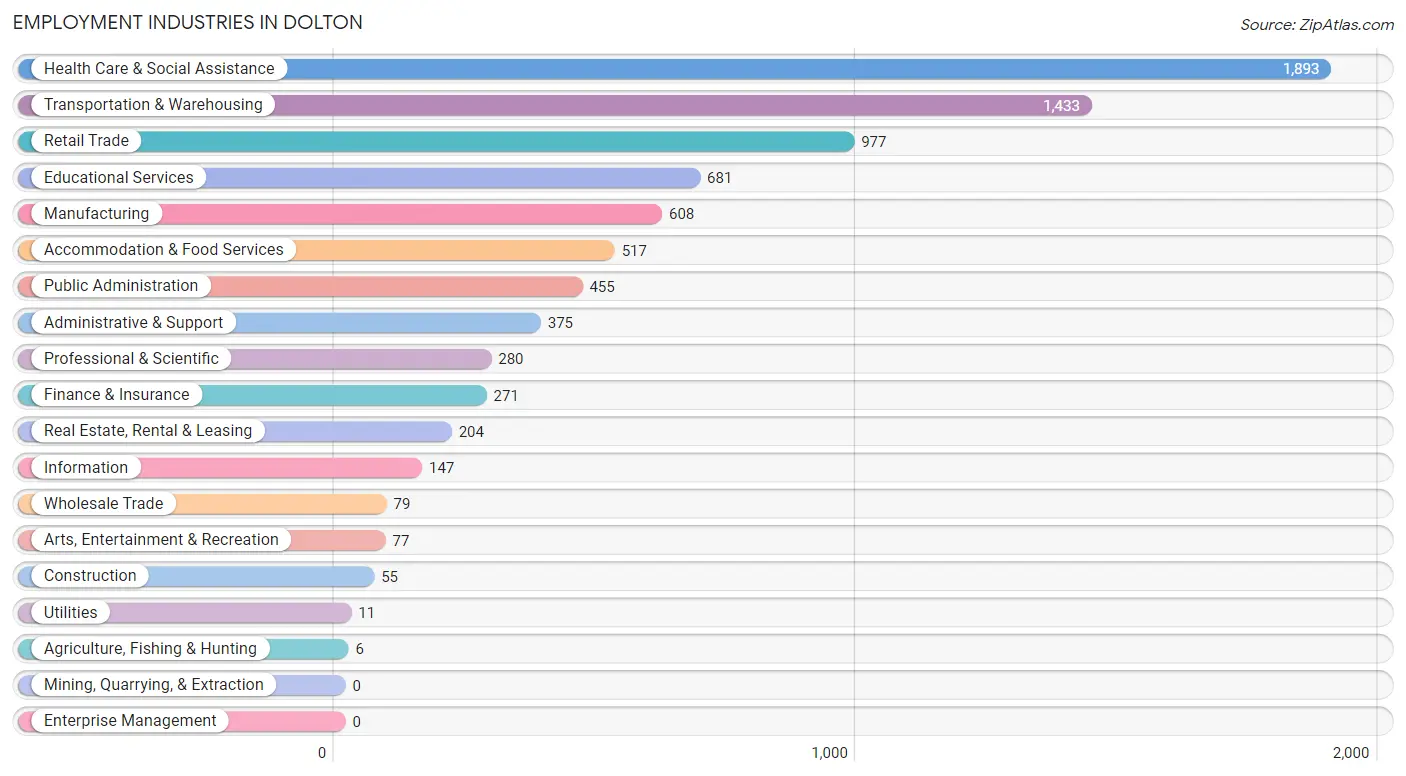
Employment Industries in Dolton
The major employment industries in Dolton include Health Care & Social Assistance (1,893 | 22.3%), Transportation & Warehousing (1,433 | 16.9%), Retail Trade (977 | 11.5%), Educational Services (681 | 8.0%), and Manufacturing (608 | 7.2%).
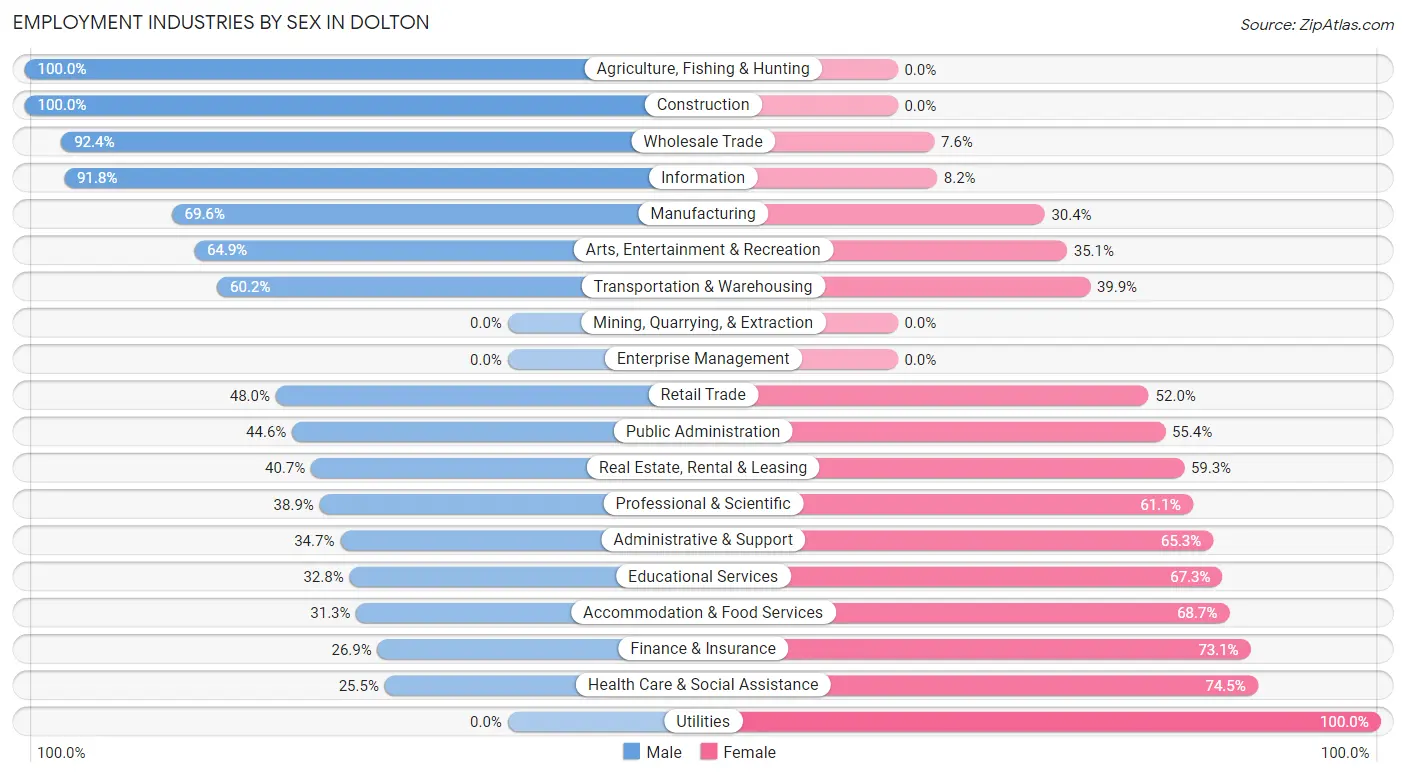
Employment Industries by Sex in Dolton
The Dolton industries that see more men than women are Agriculture, Fishing & Hunting (100.0%), Construction (100.0%), and Wholesale Trade (92.4%), whereas the industries that tend to have a higher number of women are Utilities (100.0%), Health Care & Social Assistance (74.5%), and Finance & Insurance (73.1%).
| Industry | Male | Female |
| Agriculture, Fishing & Hunting | 6 (100.0%) | 0 (0.0%) |
| Mining, Quarrying, & Extraction | 0 (0.0%) | 0 (0.0%) |
| Construction | 55 (100.0%) | 0 (0.0%) |
| Manufacturing | 423 (69.6%) | 185 (30.4%) |
| Wholesale Trade | 73 (92.4%) | 6 (7.6%) |
| Retail Trade | 469 (48.0%) | 508 (52.0%) |
| Transportation & Warehousing | 862 (60.2%) | 571 (39.9%) |
| Utilities | 0 (0.0%) | 11 (100.0%) |
| Information | 135 (91.8%) | 12 (8.2%) |
| Finance & Insurance | 73 (26.9%) | 198 (73.1%) |
| Real Estate, Rental & Leasing | 83 (40.7%) | 121 (59.3%) |
| Professional & Scientific | 109 (38.9%) | 171 (61.1%) |
| Enterprise Management | 0 (0.0%) | 0 (0.0%) |
| Administrative & Support | 130 (34.7%) | 245 (65.3%) |
| Educational Services | 223 (32.8%) | 458 (67.2%) |
| Health Care & Social Assistance | 482 (25.5%) | 1,411 (74.5%) |
| Arts, Entertainment & Recreation | 50 (64.9%) | 27 (35.1%) |
| Accommodation & Food Services | 162 (31.3%) | 355 (68.7%) |
| Public Administration | 203 (44.6%) | 252 (55.4%) |
| Total | 3,737 (44.1%) | 4,739 (55.9%) |
Education in Dolton
School Enrollment in Dolton
The most common levels of schooling among the 5,439 students in Dolton are elementary school (1,341 | 24.7%), high school (1,110 | 20.4%), and middle school (1,076 | 19.8%).
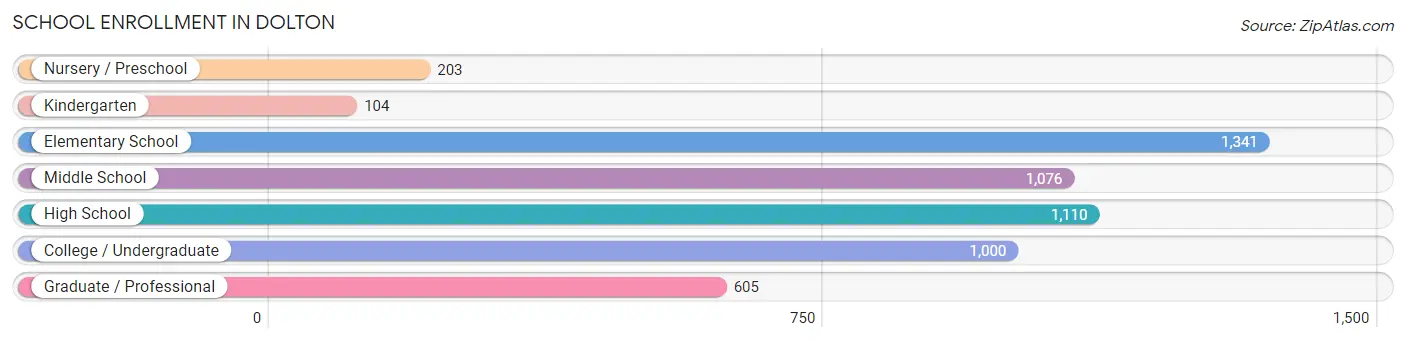
| School Level | # Students | % Students |
| Nursery / Preschool | 203 | 3.7% |
| Kindergarten | 104 | 1.9% |
| Elementary School | 1,341 | 24.7% |
| Middle School | 1,076 | 19.8% |
| High School | 1,110 | 20.4% |
| College / Undergraduate | 1,000 | 18.4% |
| Graduate / Professional | 605 | 11.1% |
| Total | 5,439 | 100.0% |
School Enrollment by Age by Funding Source in Dolton
Out of a total of 5,439 students who are enrolled in schools in Dolton, 647 (11.9%) attend a private institution, while the remaining 4,792 (88.1%) are enrolled in public schools. The age group of 25 to 34 year olds has the highest likelihood of being enrolled in private schools, with 189 (37.2% in the age bracket) enrolled. Conversely, the age group of 3 to 4 year olds has the lowest likelihood of being enrolled in a private school, with 192 (99.5% in the age bracket) attending a public institution.
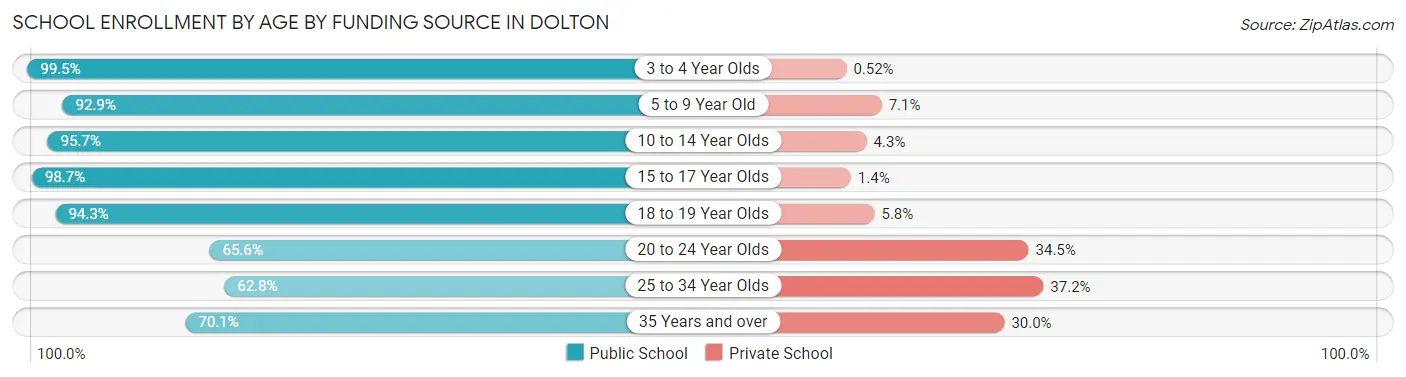
| Age Bracket | Public School | Private School |
| 3 to 4 Year Olds | 192 (99.5%) | 1 (0.5%) |
| 5 to 9 Year Old | 1,181 (92.9%) | 90 (7.1%) |
| 10 to 14 Year Olds | 1,365 (95.7%) | 61 (4.3%) |
| 15 to 17 Year Olds | 879 (98.7%) | 12 (1.3%) |
| 18 to 19 Year Olds | 246 (94.3%) | 15 (5.8%) |
| 20 to 24 Year Olds | 215 (65.5%) | 113 (34.4%) |
| 25 to 34 Year Olds | 319 (62.8%) | 189 (37.2%) |
| 35 Years and over | 393 (70.1%) | 168 (29.9%) |
| Total | 4,792 (88.1%) | 647 (11.9%) |
Educational Attainment by Field of Study in Dolton
Business (858 | 24.1%), science & technology (465 | 13.0%), education (450 | 12.6%), arts & humanities (417 | 11.7%), and literature & languages (209 | 5.9%) are the most common fields of study among 3,566 individuals in Dolton who have obtained a bachelor's degree or higher.
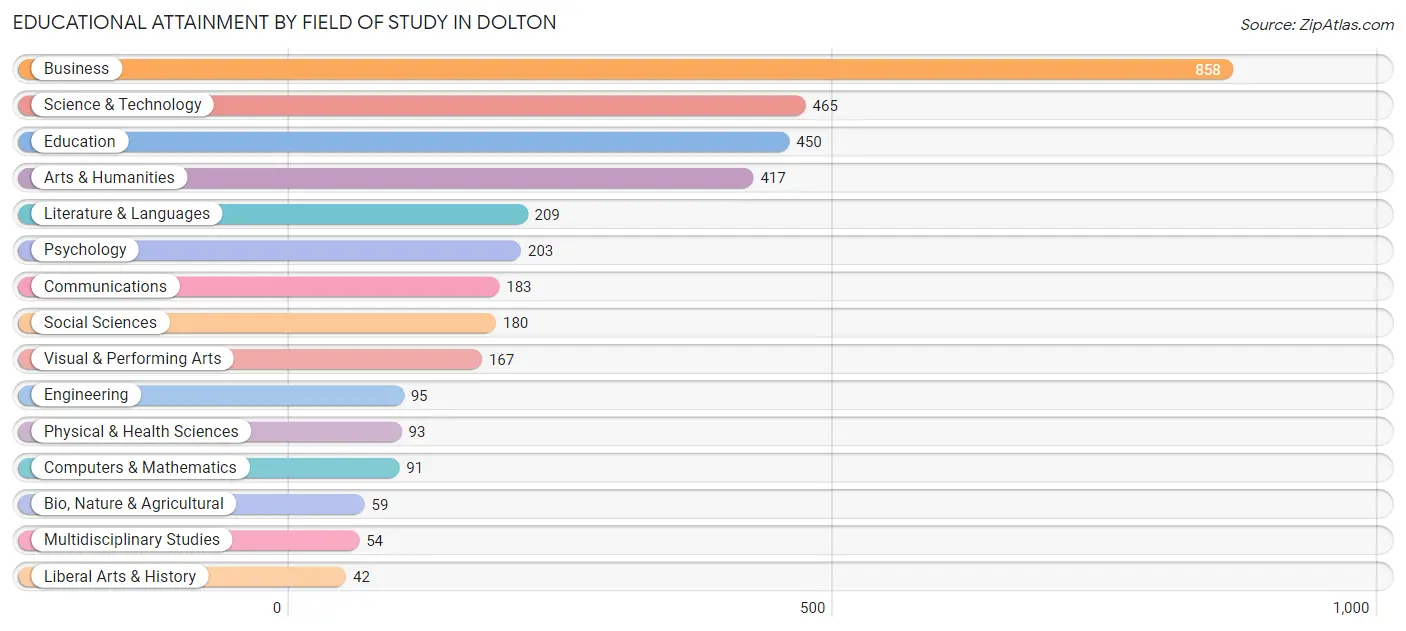
| Field of Study | # Graduates | % Graduates |
| Computers & Mathematics | 91 | 2.5% |
| Bio, Nature & Agricultural | 59 | 1.7% |
| Physical & Health Sciences | 93 | 2.6% |
| Psychology | 203 | 5.7% |
| Social Sciences | 180 | 5.1% |
| Engineering | 95 | 2.7% |
| Multidisciplinary Studies | 54 | 1.5% |
| Science & Technology | 465 | 13.0% |
| Business | 858 | 24.1% |
| Education | 450 | 12.6% |
| Literature & Languages | 209 | 5.9% |
| Liberal Arts & History | 42 | 1.2% |
| Visual & Performing Arts | 167 | 4.7% |
| Communications | 183 | 5.1% |
| Arts & Humanities | 417 | 11.7% |
| Total | 3,566 | 100.0% |
Transportation & Commute in Dolton
Vehicle Availability by Sex in Dolton
The most prevalent vehicle ownership categories in Dolton are males with 2 vehicles (1,481, accounting for 40.9%) and females with 2 vehicles (1,460, making up 32.1%).
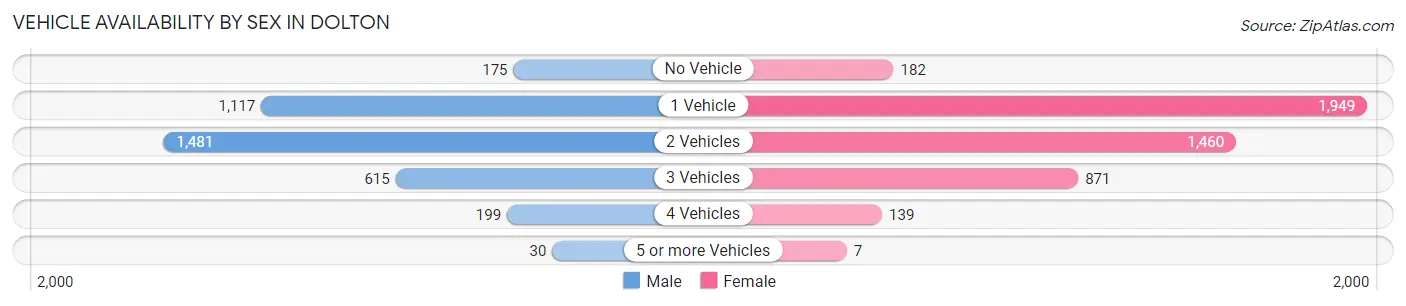
| Vehicles Available | Male | Female |
| No Vehicle | 175 (4.8%) | 182 (4.0%) |
| 1 Vehicle | 1,117 (30.9%) | 1,949 (42.3%) |
| 2 Vehicles | 1,481 (40.9%) | 1,460 (31.7%) |
| 3 Vehicles | 615 (17.0%) | 871 (18.9%) |
| 4 Vehicles | 199 (5.5%) | 139 (3.0%) |
| 5 or more Vehicles | 30 (0.8%) | 7 (0.2%) |
| Total | 3,617 (100.0%) | 4,608 (100.0%) |
Commute Time in Dolton
The most frequently occuring commute durations in Dolton are 30 to 34 minutes (1,126 commuters, 15.2%), 60 to 89 minutes (1,039 commuters, 14.0%), and 45 to 59 minutes (962 commuters, 13.0%).
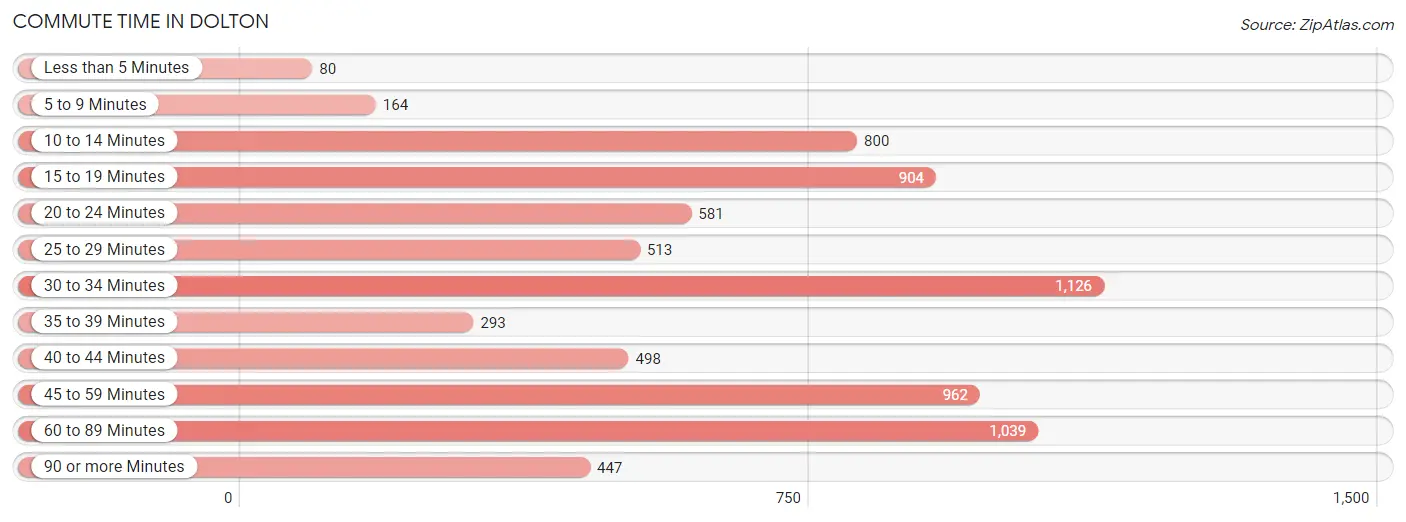
| Commute Time | # Commuters | % Commuters |
| Less than 5 Minutes | 80 | 1.1% |
| 5 to 9 Minutes | 164 | 2.2% |
| 10 to 14 Minutes | 800 | 10.8% |
| 15 to 19 Minutes | 904 | 12.2% |
| 20 to 24 Minutes | 581 | 7.8% |
| 25 to 29 Minutes | 513 | 6.9% |
| 30 to 34 Minutes | 1,126 | 15.2% |
| 35 to 39 Minutes | 293 | 4.0% |
| 40 to 44 Minutes | 498 | 6.7% |
| 45 to 59 Minutes | 962 | 13.0% |
| 60 to 89 Minutes | 1,039 | 14.0% |
| 90 or more Minutes | 447 | 6.0% |
Commute Time by Sex in Dolton
The most common commute times in Dolton are 45 to 59 minutes (540 commuters, 16.2%) for males and 60 to 89 minutes (695 commuters, 17.1%) for females.
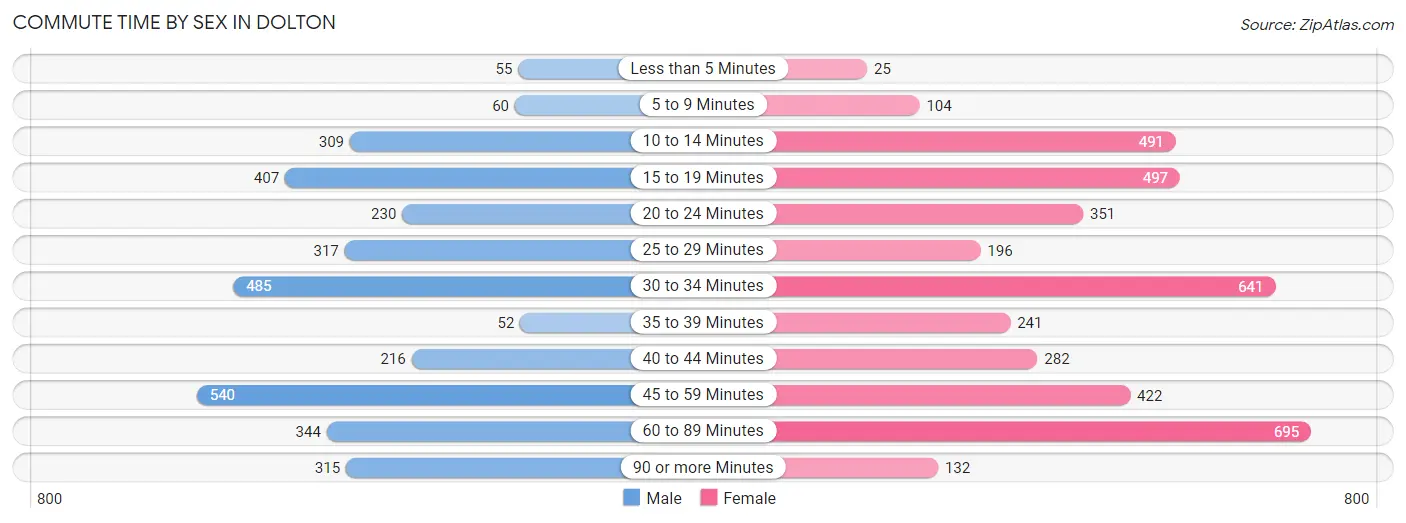
| Commute Time | Male | Female |
| Less than 5 Minutes | 55 (1.7%) | 25 (0.6%) |
| 5 to 9 Minutes | 60 (1.8%) | 104 (2.5%) |
| 10 to 14 Minutes | 309 (9.3%) | 491 (12.0%) |
| 15 to 19 Minutes | 407 (12.2%) | 497 (12.2%) |
| 20 to 24 Minutes | 230 (6.9%) | 351 (8.6%) |
| 25 to 29 Minutes | 317 (9.5%) | 196 (4.8%) |
| 30 to 34 Minutes | 485 (14.6%) | 641 (15.7%) |
| 35 to 39 Minutes | 52 (1.6%) | 241 (5.9%) |
| 40 to 44 Minutes | 216 (6.5%) | 282 (6.9%) |
| 45 to 59 Minutes | 540 (16.2%) | 422 (10.3%) |
| 60 to 89 Minutes | 344 (10.3%) | 695 (17.1%) |
| 90 or more Minutes | 315 (9.5%) | 132 (3.2%) |
Time of Departure to Work by Sex in Dolton
The most frequent times of departure to work in Dolton are 12:00 PM to 3:59 PM (486, 14.6%) for males and 7:00 AM to 7:29 AM (813, 19.9%) for females.
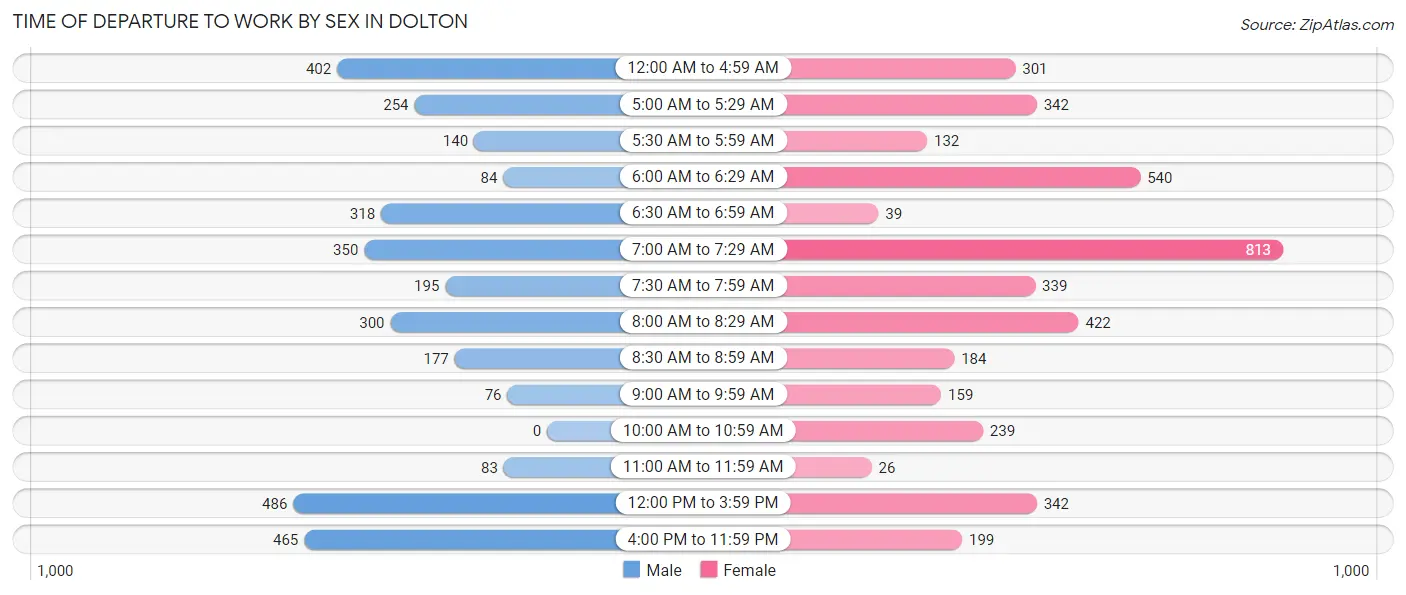
| Time of Departure | Male | Female |
| 12:00 AM to 4:59 AM | 402 (12.1%) | 301 (7.4%) |
| 5:00 AM to 5:29 AM | 254 (7.6%) | 342 (8.4%) |
| 5:30 AM to 5:59 AM | 140 (4.2%) | 132 (3.2%) |
| 6:00 AM to 6:29 AM | 84 (2.5%) | 540 (13.3%) |
| 6:30 AM to 6:59 AM | 318 (9.6%) | 39 (1.0%) |
| 7:00 AM to 7:29 AM | 350 (10.5%) | 813 (19.9%) |
| 7:30 AM to 7:59 AM | 195 (5.9%) | 339 (8.3%) |
| 8:00 AM to 8:29 AM | 300 (9.0%) | 422 (10.3%) |
| 8:30 AM to 8:59 AM | 177 (5.3%) | 184 (4.5%) |
| 9:00 AM to 9:59 AM | 76 (2.3%) | 159 (3.9%) |
| 10:00 AM to 10:59 AM | 0 (0.0%) | 239 (5.9%) |
| 11:00 AM to 11:59 AM | 83 (2.5%) | 26 (0.6%) |
| 12:00 PM to 3:59 PM | 486 (14.6%) | 342 (8.4%) |
| 4:00 PM to 11:59 PM | 465 (14.0%) | 199 (4.9%) |
| Total | 3,330 (100.0%) | 4,077 (100.0%) |
Housing Occupancy in Dolton
Occupancy by Ownership in Dolton
Of the total 8,110 dwellings in Dolton, owner-occupied units account for 5,902 (72.8%), while renter-occupied units make up 2,208 (27.2%).
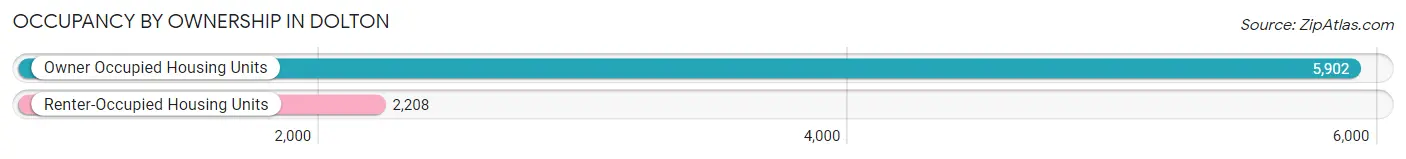
| Occupancy | # Housing Units | % Housing Units |
| Owner Occupied Housing Units | 5,902 | 72.8% |
| Renter-Occupied Housing Units | 2,208 | 27.2% |
| Total Occupied Housing Units | 8,110 | 100.0% |
Occupancy by Household Size in Dolton
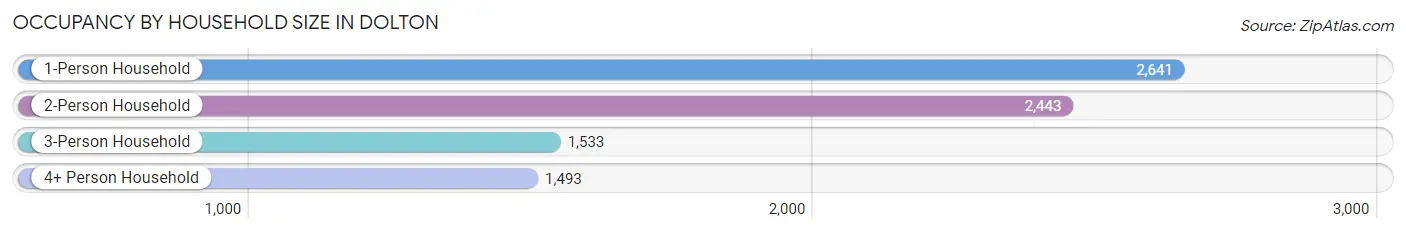
| Household Size | # Housing Units | % Housing Units |
| 1-Person Household | 2,641 | 32.6% |
| 2-Person Household | 2,443 | 30.1% |
| 3-Person Household | 1,533 | 18.9% |
| 4+ Person Household | 1,493 | 18.4% |
| Total Housing Units | 8,110 | 100.0% |
Occupancy by Ownership by Household Size in Dolton
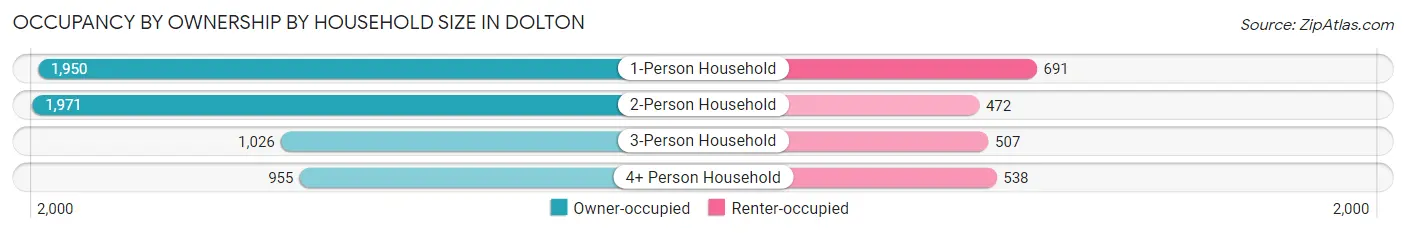
| Household Size | Owner-occupied | Renter-occupied |
| 1-Person Household | 1,950 (73.8%) | 691 (26.2%) |
| 2-Person Household | 1,971 (80.7%) | 472 (19.3%) |
| 3-Person Household | 1,026 (66.9%) | 507 (33.1%) |
| 4+ Person Household | 955 (64.0%) | 538 (36.0%) |
| Total Housing Units | 5,902 (72.8%) | 2,208 (27.2%) |
Occupancy by Educational Attainment in Dolton
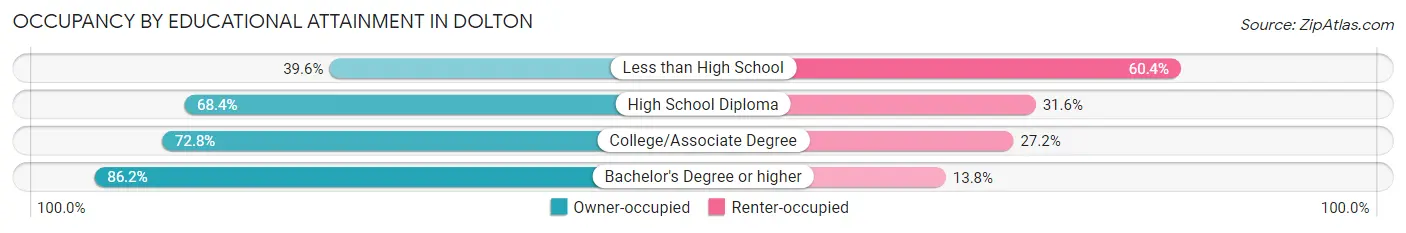
| Household Size | Owner-occupied | Renter-occupied |
| Less than High School | 219 (39.6%) | 334 (60.4%) |
| High School Diploma | 1,363 (68.4%) | 631 (31.6%) |
| College/Associate Degree | 2,574 (72.8%) | 963 (27.2%) |
| Bachelor's Degree or higher | 1,746 (86.2%) | 280 (13.8%) |
Occupancy by Age of Householder in Dolton
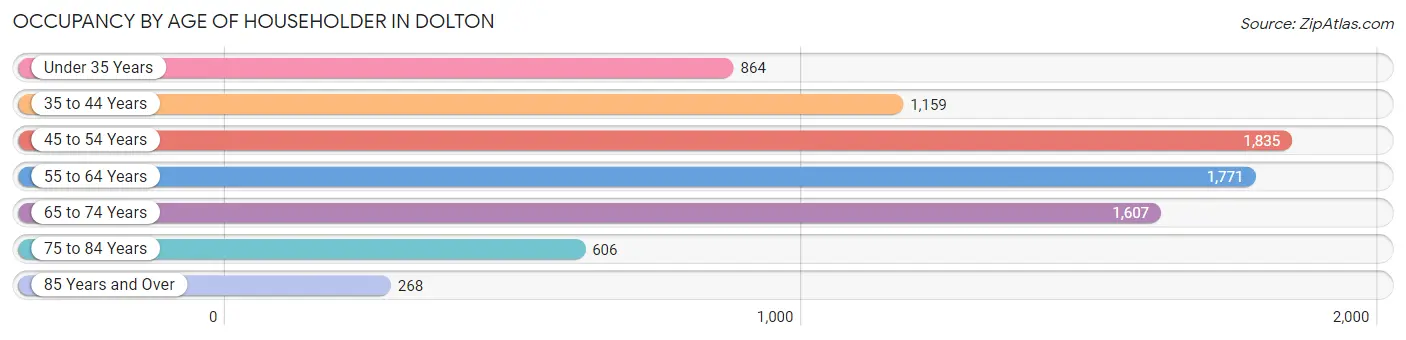
| Age Bracket | # Households | % Households |
| Under 35 Years | 864 | 10.6% |
| 35 to 44 Years | 1,159 | 14.3% |
| 45 to 54 Years | 1,835 | 22.6% |
| 55 to 64 Years | 1,771 | 21.8% |
| 65 to 74 Years | 1,607 | 19.8% |
| 75 to 84 Years | 606 | 7.5% |
| 85 Years and Over | 268 | 3.3% |
| Total | 8,110 | 100.0% |
Housing Finances in Dolton
Median Income by Occupancy in Dolton
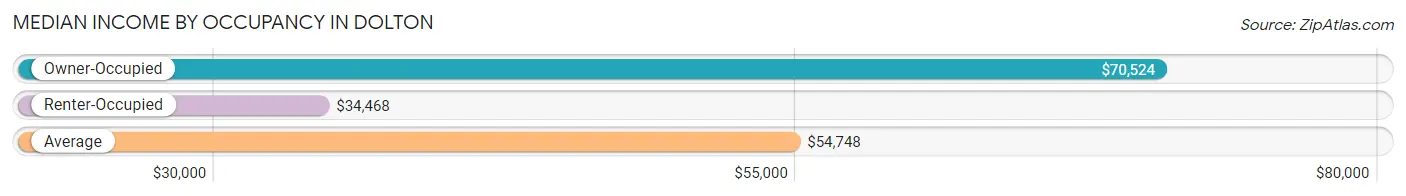
| Occupancy Type | # Households | Median Income |
| Owner-Occupied | 5,902 (72.8%) | $70,524 |
| Renter-Occupied | 2,208 (27.2%) | $34,468 |
| Average | 8,110 (100.0%) | $54,748 |
Occupancy by Householder Income Bracket in Dolton
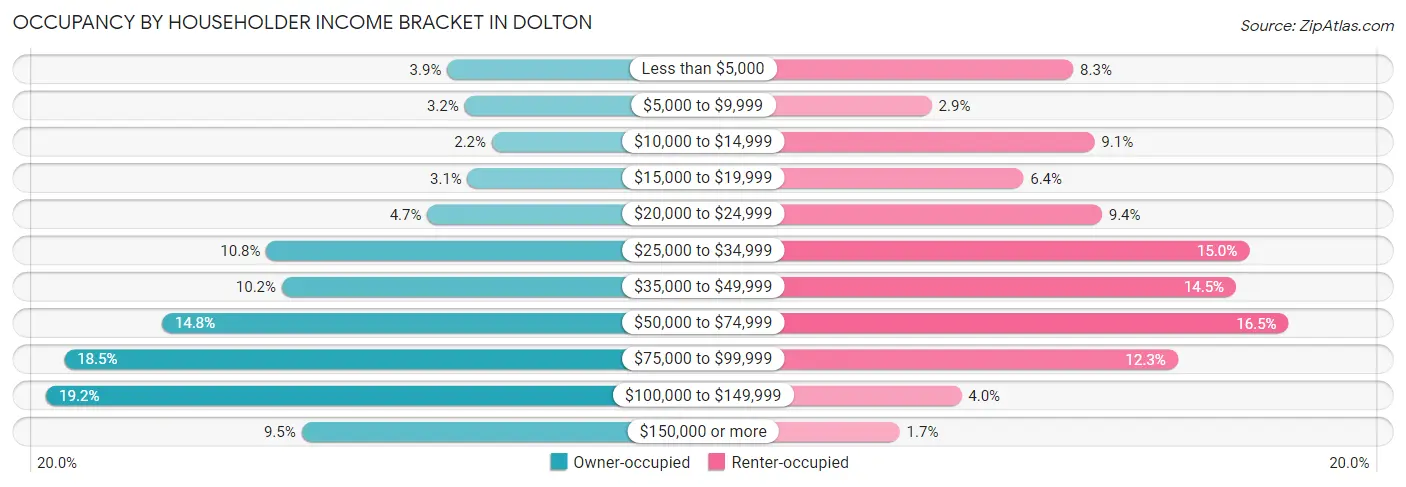
| Income Bracket | Owner-occupied | Renter-occupied |
| Less than $5,000 | 230 (3.9%) | 183 (8.3%) |
| $5,000 to $9,999 | 191 (3.2%) | 64 (2.9%) |
| $10,000 to $14,999 | 130 (2.2%) | 201 (9.1%) |
| $15,000 to $19,999 | 184 (3.1%) | 141 (6.4%) |
| $20,000 to $24,999 | 275 (4.7%) | 207 (9.4%) |
| $25,000 to $34,999 | 637 (10.8%) | 331 (15.0%) |
| $35,000 to $49,999 | 602 (10.2%) | 320 (14.5%) |
| $50,000 to $74,999 | 872 (14.8%) | 364 (16.5%) |
| $75,000 to $99,999 | 1,091 (18.5%) | 271 (12.3%) |
| $100,000 to $149,999 | 1,132 (19.2%) | 89 (4.0%) |
| $150,000 or more | 558 (9.5%) | 37 (1.7%) |
| Total | 5,902 (100.0%) | 2,208 (100.0%) |
Monthly Housing Cost Tiers in Dolton
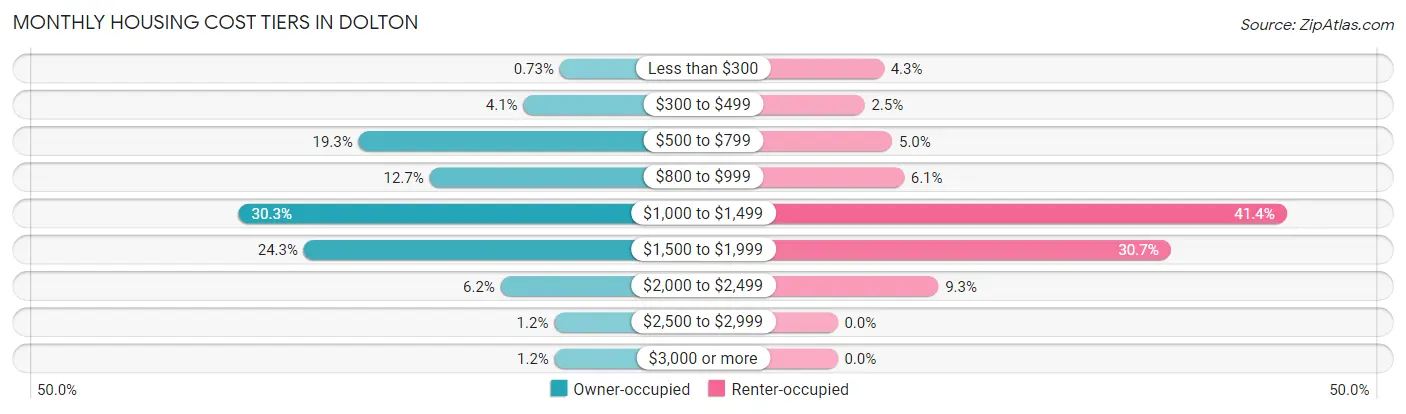
| Monthly Cost | Owner-occupied | Renter-occupied |
| Less than $300 | 43 (0.7%) | 94 (4.3%) |
| $300 to $499 | 241 (4.1%) | 55 (2.5%) |
| $500 to $799 | 1,137 (19.3%) | 111 (5.0%) |
| $800 to $999 | 751 (12.7%) | 135 (6.1%) |
| $1,000 to $1,499 | 1,788 (30.3%) | 913 (41.3%) |
| $1,500 to $1,999 | 1,434 (24.3%) | 677 (30.7%) |
| $2,000 to $2,499 | 364 (6.2%) | 205 (9.3%) |
| $2,500 to $2,999 | 73 (1.2%) | 0 (0.0%) |
| $3,000 or more | 71 (1.2%) | 0 (0.0%) |
| Total | 5,902 (100.0%) | 2,208 (100.0%) |
Physical Housing Characteristics in Dolton
Housing Structures in Dolton
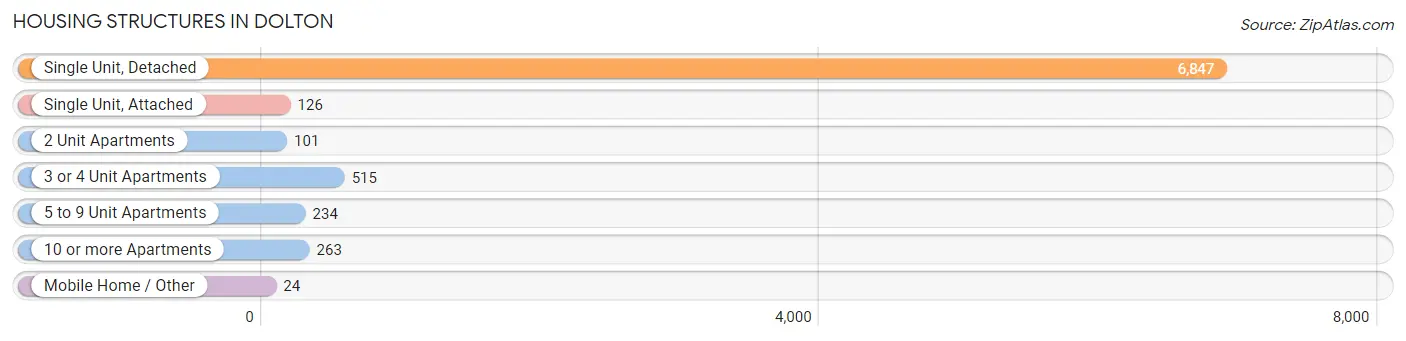
| Structure Type | # Housing Units | % Housing Units |
| Single Unit, Detached | 6,847 | 84.4% |
| Single Unit, Attached | 126 | 1.5% |
| 2 Unit Apartments | 101 | 1.3% |
| 3 or 4 Unit Apartments | 515 | 6.4% |
| 5 to 9 Unit Apartments | 234 | 2.9% |
| 10 or more Apartments | 263 | 3.2% |
| Mobile Home / Other | 24 | 0.3% |
| Total | 8,110 | 100.0% |
Housing Structures by Occupancy in Dolton
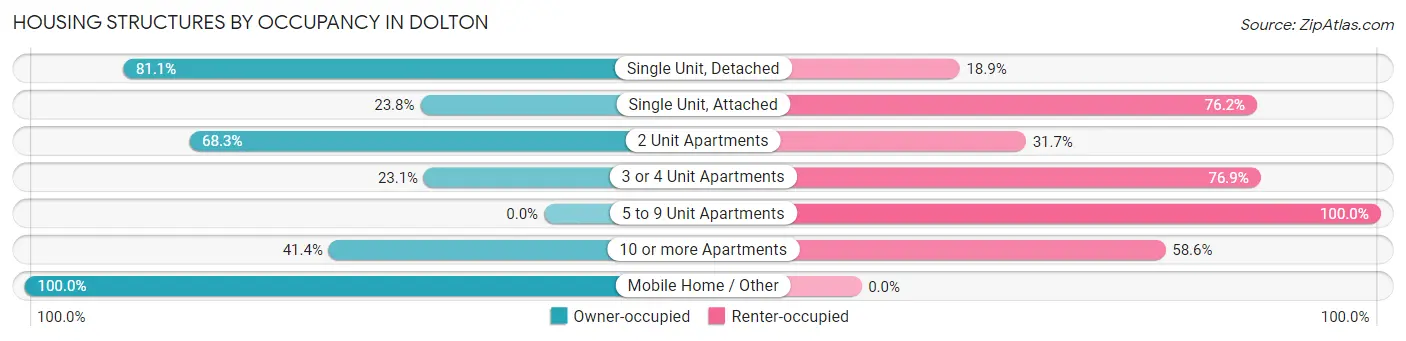
| Structure Type | Owner-occupied | Renter-occupied |
| Single Unit, Detached | 5,551 (81.1%) | 1,296 (18.9%) |
| Single Unit, Attached | 30 (23.8%) | 96 (76.2%) |
| 2 Unit Apartments | 69 (68.3%) | 32 (31.7%) |
| 3 or 4 Unit Apartments | 119 (23.1%) | 396 (76.9%) |
| 5 to 9 Unit Apartments | 0 (0.0%) | 234 (100.0%) |
| 10 or more Apartments | 109 (41.4%) | 154 (58.6%) |
| Mobile Home / Other | 24 (100.0%) | 0 (0.0%) |
| Total | 5,902 (72.8%) | 2,208 (27.2%) |
Housing Structures by Number of Rooms in Dolton
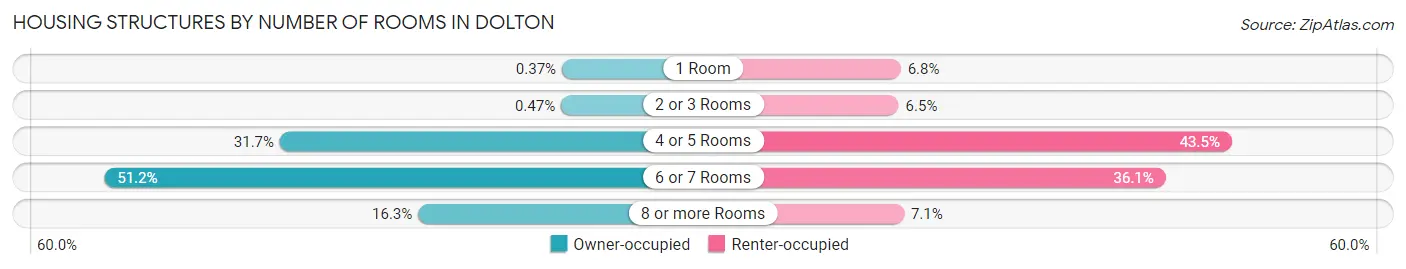
| Number of Rooms | Owner-occupied | Renter-occupied |
| 1 Room | 22 (0.4%) | 149 (6.8%) |
| 2 or 3 Rooms | 28 (0.5%) | 144 (6.5%) |
| 4 or 5 Rooms | 1,869 (31.7%) | 960 (43.5%) |
| 6 or 7 Rooms | 3,019 (51.1%) | 798 (36.1%) |
| 8 or more Rooms | 964 (16.3%) | 157 (7.1%) |
| Total | 5,902 (100.0%) | 2,208 (100.0%) |
Housing Structure by Heating Type in Dolton
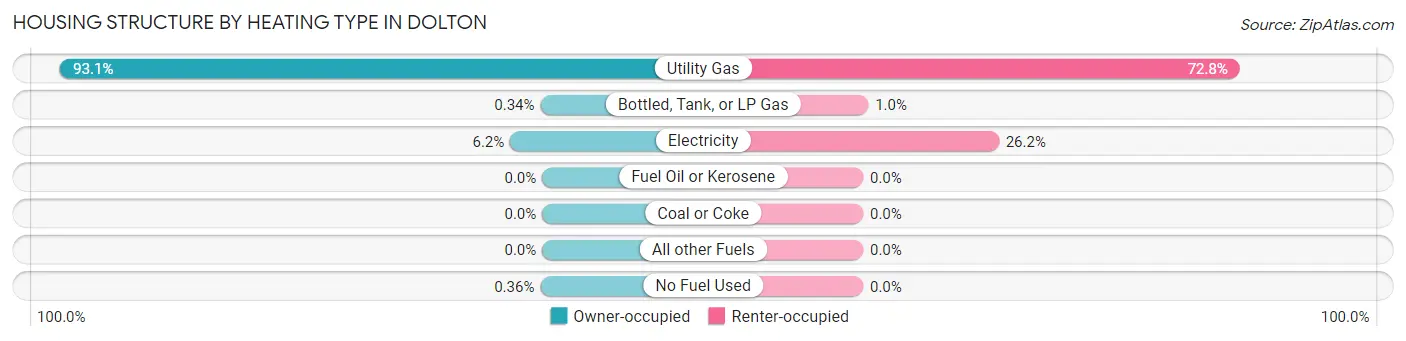
| Heating Type | Owner-occupied | Renter-occupied |
| Utility Gas | 5,496 (93.1%) | 1,607 (72.8%) |
| Bottled, Tank, or LP Gas | 20 (0.3%) | 22 (1.0%) |
| Electricity | 365 (6.2%) | 579 (26.2%) |
| Fuel Oil or Kerosene | 0 (0.0%) | 0 (0.0%) |
| Coal or Coke | 0 (0.0%) | 0 (0.0%) |
| All other Fuels | 0 (0.0%) | 0 (0.0%) |
| No Fuel Used | 21 (0.4%) | 0 (0.0%) |
| Total | 5,902 (100.0%) | 2,208 (100.0%) |
Household Vehicle Usage in Dolton
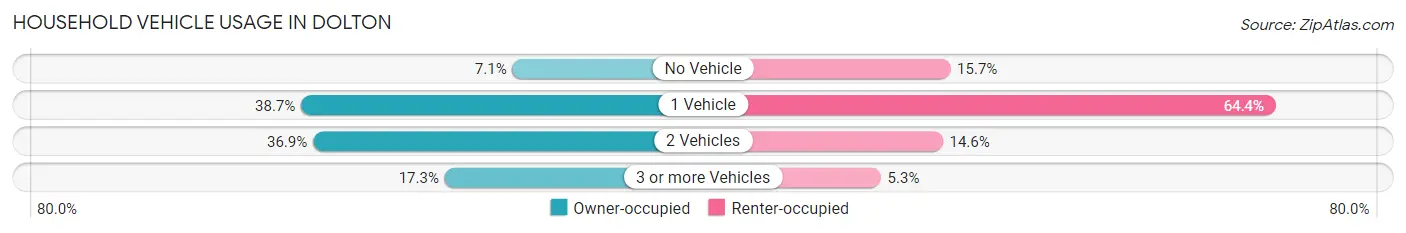
| Vehicles per Household | Owner-occupied | Renter-occupied |
| No Vehicle | 421 (7.1%) | 347 (15.7%) |
| 1 Vehicle | 2,284 (38.7%) | 1,421 (64.4%) |
| 2 Vehicles | 2,179 (36.9%) | 322 (14.6%) |
| 3 or more Vehicles | 1,018 (17.2%) | 118 (5.3%) |
| Total | 5,902 (100.0%) | 2,208 (100.0%) |
Real Estate & Mortgages in Dolton
Real Estate and Mortgage Overview in Dolton
| Characteristic | Without Mortgage | With Mortgage |
| Housing Units | 2,142 | 3,760 |
| Median Property Value | $127,100 | $129,600 |
| Median Household Income | $50,273 | $378 |
| Monthly Housing Costs | $724 | $71 |
| Real Estate Taxes | $4,252 | $168 |
Property Value by Mortgage Status in Dolton
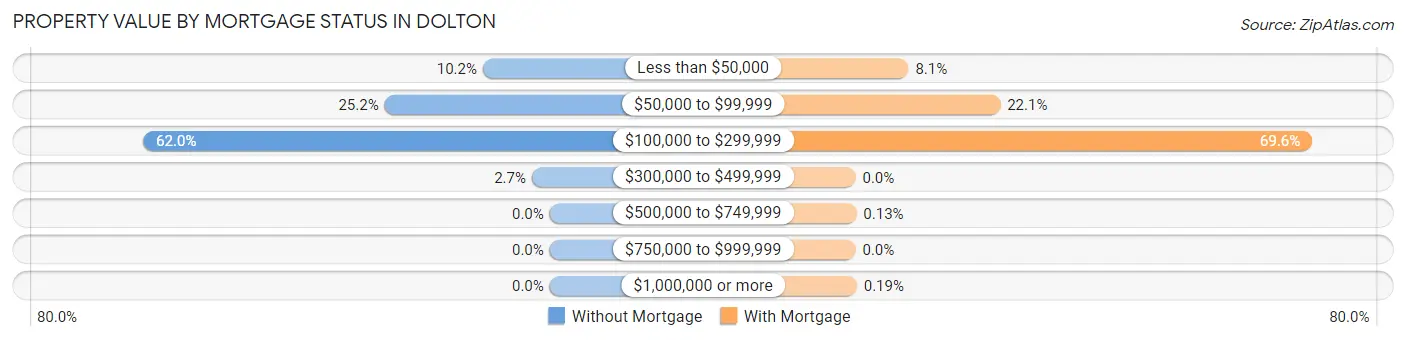
| Property Value | Without Mortgage | With Mortgage |
| Less than $50,000 | 218 (10.2%) | 303 (8.1%) |
| $50,000 to $99,999 | 539 (25.2%) | 829 (22.1%) |
| $100,000 to $299,999 | 1,327 (62.0%) | 2,616 (69.6%) |
| $300,000 to $499,999 | 58 (2.7%) | 0 (0.0%) |
| $500,000 to $749,999 | 0 (0.0%) | 5 (0.1%) |
| $750,000 to $999,999 | 0 (0.0%) | 0 (0.0%) |
| $1,000,000 or more | 0 (0.0%) | 7 (0.2%) |
| Total | 2,142 (100.0%) | 3,760 (100.0%) |
Household Income by Mortgage Status in Dolton
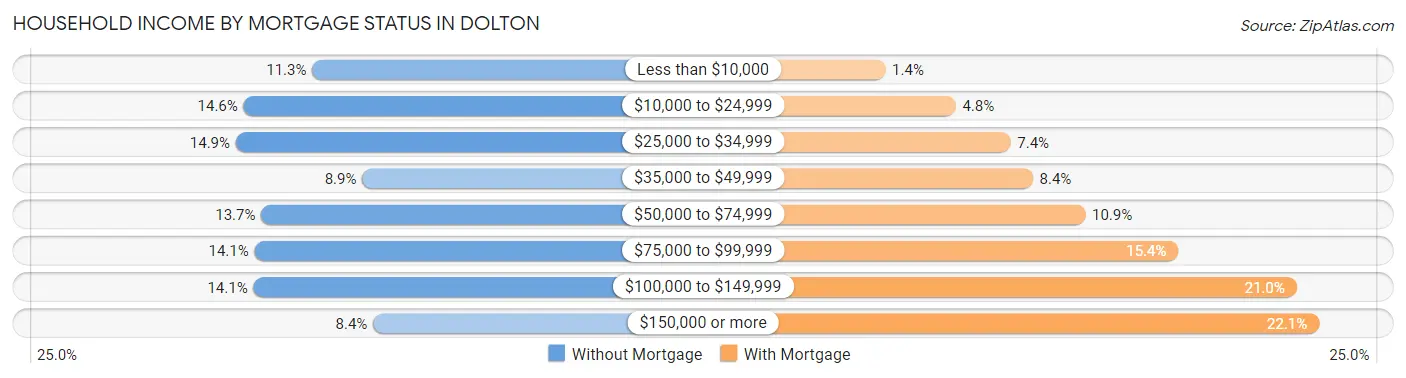
| Household Income | Without Mortgage | With Mortgage |
| Less than $10,000 | 242 (11.3%) | 53 (1.4%) |
| $10,000 to $24,999 | 312 (14.6%) | 179 (4.8%) |
| $25,000 to $34,999 | 320 (14.9%) | 277 (7.4%) |
| $35,000 to $49,999 | 191 (8.9%) | 317 (8.4%) |
| $50,000 to $74,999 | 294 (13.7%) | 411 (10.9%) |
| $75,000 to $99,999 | 301 (14.1%) | 578 (15.4%) |
| $100,000 to $149,999 | 302 (14.1%) | 790 (21.0%) |
| $150,000 or more | 180 (8.4%) | 830 (22.1%) |
| Total | 2,142 (100.0%) | 3,760 (100.0%) |
Property Value to Household Income Ratio in Dolton
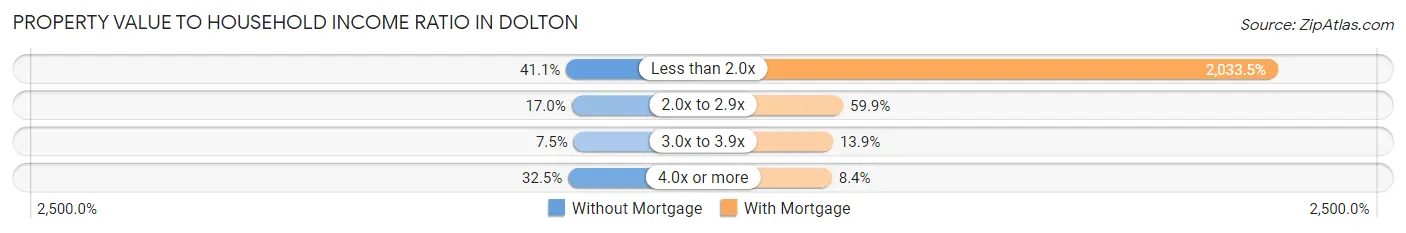
| Value-to-Income Ratio | Without Mortgage | With Mortgage |
| Less than 2.0x | 880 (41.1%) | 76,460 (2,033.5%) |
| 2.0x to 2.9x | 365 (17.0%) | 2,252 (59.9%) |
| 3.0x to 3.9x | 160 (7.5%) | 523 (13.9%) |
| 4.0x or more | 695 (32.5%) | 317 (8.4%) |
| Total | 2,142 (100.0%) | 3,760 (100.0%) |
Real Estate Taxes by Mortgage Status in Dolton
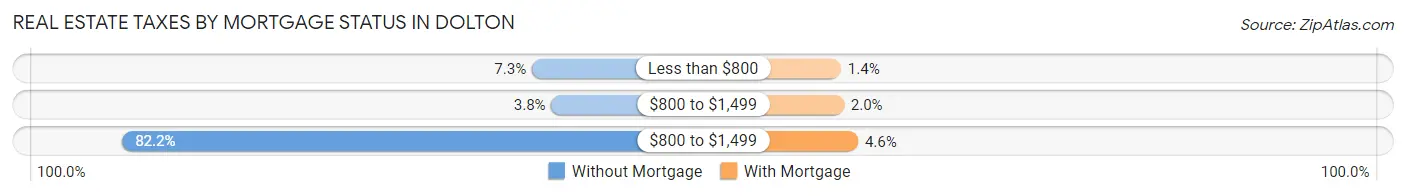
| Property Taxes | Without Mortgage | With Mortgage |
| Less than $800 | 157 (7.3%) | 54 (1.4%) |
| $800 to $1,499 | 81 (3.8%) | 74 (2.0%) |
| $800 to $1,499 | 1,760 (82.2%) | 171 (4.5%) |
| Total | 2,142 (100.0%) | 3,760 (100.0%) |
Health & Disability in Dolton
Health Insurance Coverage by Age in Dolton
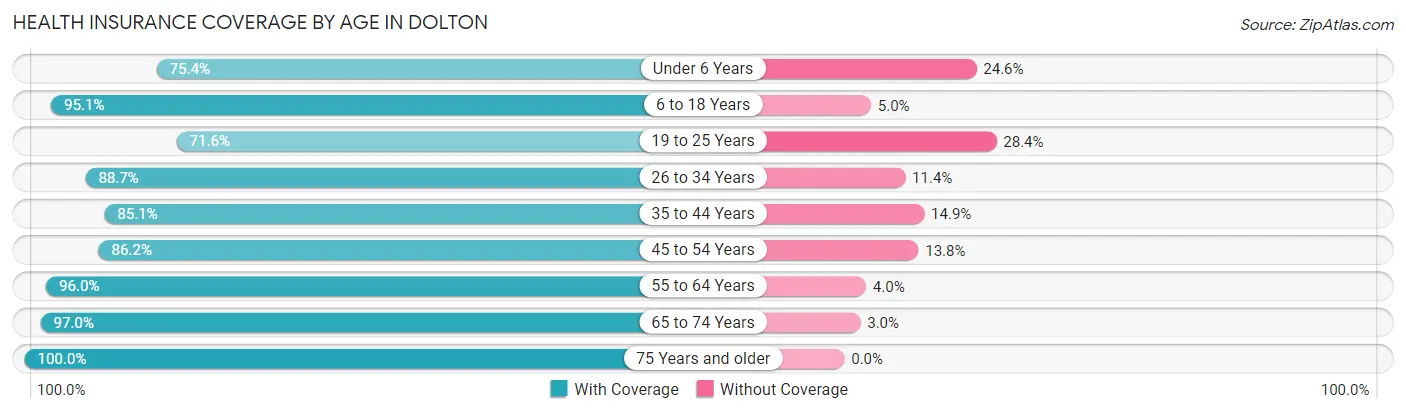
| Age Bracket | With Coverage | Without Coverage |
| Under 6 Years | 1,111 (75.4%) | 363 (24.6%) |
| 6 to 18 Years | 3,743 (95.1%) | 195 (5.0%) |
| 19 to 25 Years | 1,278 (71.6%) | 506 (28.4%) |
| 26 to 34 Years | 2,194 (88.6%) | 281 (11.4%) |
| 35 to 44 Years | 1,800 (85.1%) | 315 (14.9%) |
| 45 to 54 Years | 2,217 (86.2%) | 355 (13.8%) |
| 55 to 64 Years | 2,930 (96.0%) | 123 (4.0%) |
| 65 to 74 Years | 2,248 (97.0%) | 69 (3.0%) |
| 75 Years and older | 1,227 (100.0%) | 0 (0.0%) |
| Total | 18,748 (89.5%) | 2,207 (10.5%) |
Health Insurance Coverage by Citizenship Status in Dolton
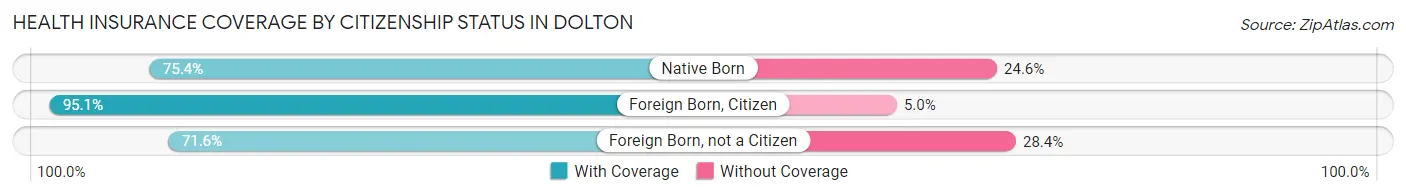
| Citizenship Status | With Coverage | Without Coverage |
| Native Born | 1,111 (75.4%) | 363 (24.6%) |
| Foreign Born, Citizen | 3,743 (95.1%) | 195 (5.0%) |
| Foreign Born, not a Citizen | 1,278 (71.6%) | 506 (28.4%) |
Health Insurance Coverage by Household Income in Dolton
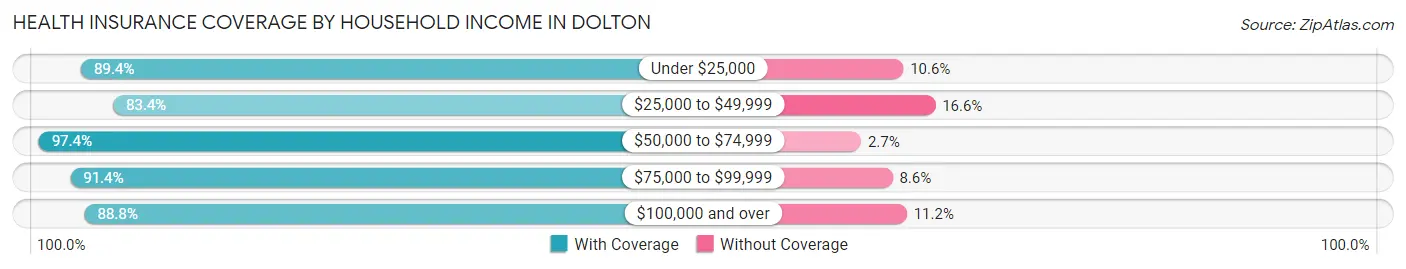
| Household Income | With Coverage | Without Coverage |
| Under $25,000 | 3,791 (89.4%) | 448 (10.6%) |
| $25,000 to $49,999 | 3,744 (83.4%) | 743 (16.6%) |
| $50,000 to $74,999 | 2,972 (97.4%) | 81 (2.6%) |
| $75,000 to $99,999 | 3,152 (91.4%) | 295 (8.6%) |
| $100,000 and over | 5,060 (88.8%) | 640 (11.2%) |
Public vs Private Health Insurance Coverage by Age in Dolton
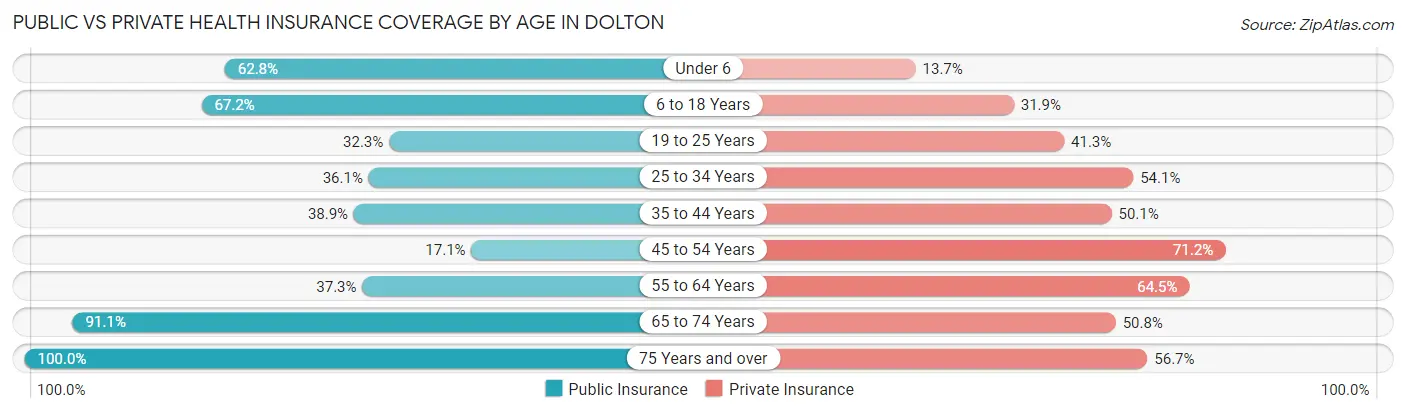
| Age Bracket | Public Insurance | Private Insurance |
| Under 6 | 926 (62.8%) | 202 (13.7%) |
| 6 to 18 Years | 2,645 (67.2%) | 1,257 (31.9%) |
| 19 to 25 Years | 577 (32.3%) | 736 (41.3%) |
| 25 to 34 Years | 894 (36.1%) | 1,339 (54.1%) |
| 35 to 44 Years | 822 (38.9%) | 1,059 (50.1%) |
| 45 to 54 Years | 439 (17.1%) | 1,830 (71.2%) |
| 55 to 64 Years | 1,139 (37.3%) | 1,969 (64.5%) |
| 65 to 74 Years | 2,111 (91.1%) | 1,178 (50.8%) |
| 75 Years and over | 1,227 (100.0%) | 696 (56.7%) |
| Total | 10,780 (51.4%) | 10,266 (49.0%) |
Disability Status by Sex by Age in Dolton
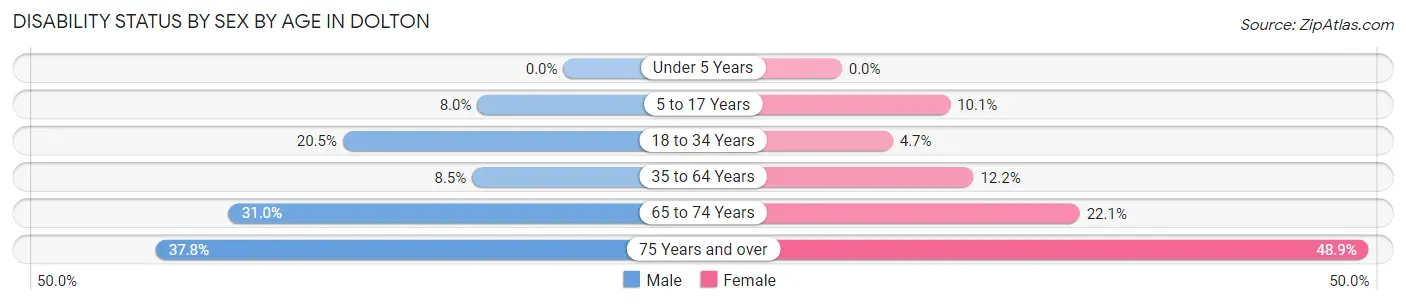
| Age Bracket | Male | Female |
| Under 5 Years | 0 (0.0%) | 0 (0.0%) |
| 5 to 17 Years | 175 (8.0%) | 148 (10.1%) |
| 18 to 34 Years | 464 (20.5%) | 113 (4.7%) |
| 35 to 64 Years | 286 (8.5%) | 533 (12.2%) |
| 65 to 74 Years | 289 (31.0%) | 306 (22.1%) |
| 75 Years and over | 177 (37.8%) | 371 (48.9%) |
Disability Class by Sex by Age in Dolton
Disability Class: Hearing Difficulty
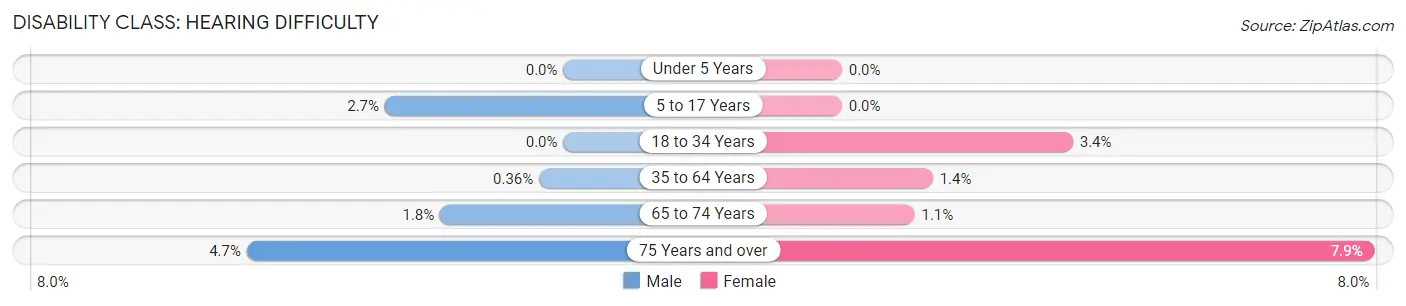
| Age Bracket | Male | Female |
| Under 5 Years | 0 (0.0%) | 0 (0.0%) |
| 5 to 17 Years | 58 (2.6%) | 0 (0.0%) |
| 18 to 34 Years | 0 (0.0%) | 82 (3.4%) |
| 35 to 64 Years | 12 (0.4%) | 59 (1.3%) |
| 65 to 74 Years | 17 (1.8%) | 15 (1.1%) |
| 75 Years and over | 22 (4.7%) | 60 (7.9%) |
Disability Class: Vision Difficulty

| Age Bracket | Male | Female |
| Under 5 Years | 0 (0.0%) | 0 (0.0%) |
| 5 to 17 Years | 41 (1.9%) | 28 (1.9%) |
| 18 to 34 Years | 39 (1.7%) | 82 (3.4%) |
| 35 to 64 Years | 96 (2.8%) | 128 (2.9%) |
| 65 to 74 Years | 25 (2.7%) | 40 (2.9%) |
| 75 Years and over | 28 (6.0%) | 27 (3.6%) |
Disability Class: Cognitive Difficulty
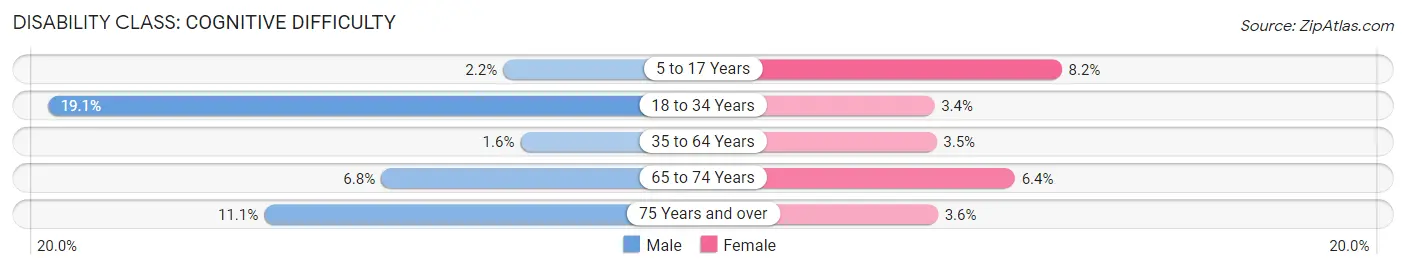
| Age Bracket | Male | Female |
| 5 to 17 Years | 49 (2.2%) | 120 (8.2%) |
| 18 to 34 Years | 434 (19.1%) | 82 (3.4%) |
| 35 to 64 Years | 54 (1.6%) | 153 (3.5%) |
| 65 to 74 Years | 63 (6.8%) | 89 (6.4%) |
| 75 Years and over | 52 (11.1%) | 27 (3.6%) |
Disability Class: Ambulatory Difficulty
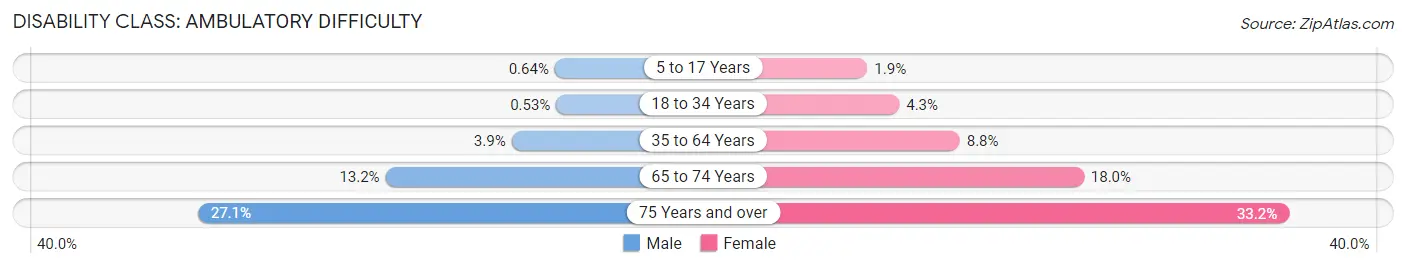
| Age Bracket | Male | Female |
| 5 to 17 Years | 14 (0.6%) | 28 (1.9%) |
| 18 to 34 Years | 12 (0.5%) | 102 (4.3%) |
| 35 to 64 Years | 130 (3.8%) | 382 (8.8%) |
| 65 to 74 Years | 123 (13.2%) | 249 (18.0%) |
| 75 Years and over | 127 (27.1%) | 252 (33.2%) |
Disability Class: Self-Care Difficulty
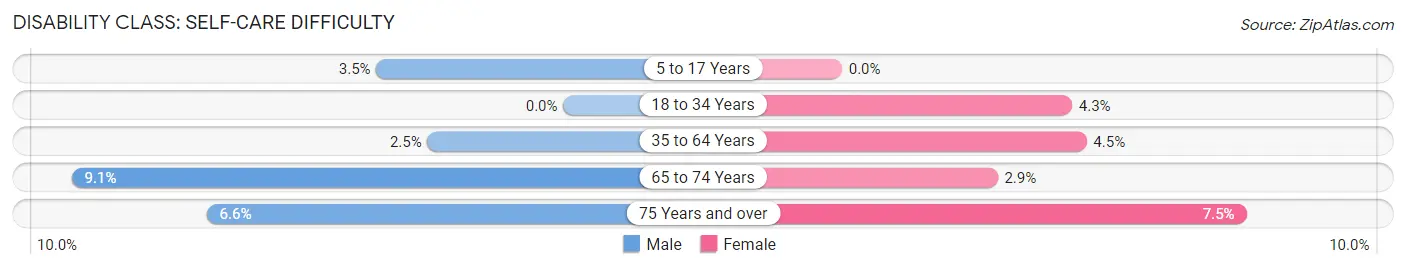
| Age Bracket | Male | Female |
| 5 to 17 Years | 76 (3.5%) | 0 (0.0%) |
| 18 to 34 Years | 0 (0.0%) | 102 (4.3%) |
| 35 to 64 Years | 85 (2.5%) | 198 (4.5%) |
| 65 to 74 Years | 85 (9.1%) | 40 (2.9%) |
| 75 Years and over | 31 (6.6%) | 57 (7.5%) |
Technology Access in Dolton
Computing Device Access in Dolton
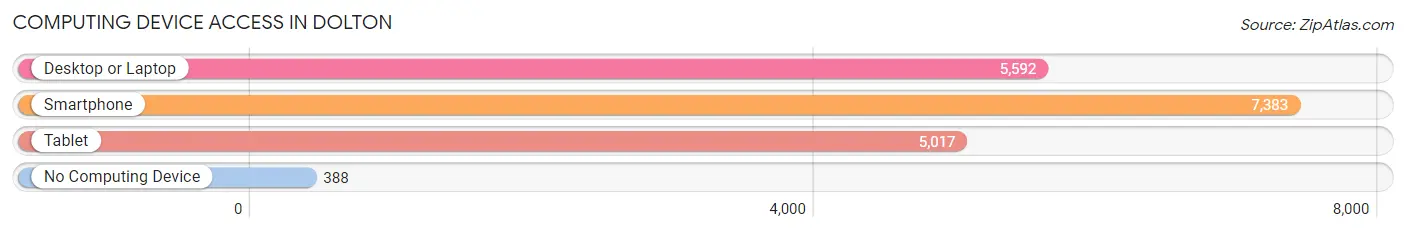
| Device Type | # Households | % Households |
| Desktop or Laptop | 5,592 | 69.0% |
| Smartphone | 7,383 | 91.0% |
| Tablet | 5,017 | 61.9% |
| No Computing Device | 388 | 4.8% |
| Total | 8,110 | 100.0% |
Internet Access in Dolton
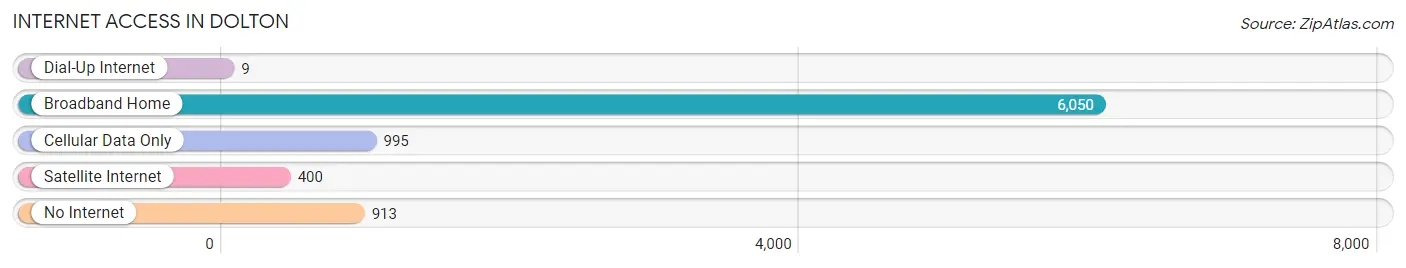
| Internet Type | # Households | % Households |
| Dial-Up Internet | 9 | 0.1% |
| Broadband Home | 6,050 | 74.6% |
| Cellular Data Only | 995 | 12.3% |
| Satellite Internet | 400 | 4.9% |
| No Internet | 913 | 11.3% |
| Total | 8,110 | 100.0% |
Dolton Summary
Dolton, Illinois is a village located in Cook County, Illinois, United States. It is a suburb of Chicago, located approximately 25 miles south of the city. The population of Dolton was 23,153 at the 2010 census.
History
Dolton was first settled in 1836 by a group of settlers from New York. The village was originally known as "Dodge's Crossing" after the first settler, John Dodge. The village was renamed Dolton in 1853 after the first postmaster, William Dolton.
In the late 19th century, Dolton was a popular destination for wealthy Chicagoans looking to escape the city. The village was known for its large estates and luxurious homes.
In the early 20th century, the village began to experience rapid growth as Chicagoans moved to the area in search of affordable housing. The village was incorporated in 1922 and experienced a population boom in the 1950s and 1960s.
Geography
Dolton is located at 41°35'17" North, 87°37'17" West (41.588, -87.621). According to the 2010 census, the village has a total area of 4.3 square miles, all land.
The village is bordered by the cities of Calumet City to the north, South Holland to the east, Riverdale to the south, and Harvey to the west.
Economy
Dolton is primarily a residential community, with a small commercial district located along Sibley Boulevard. The village is home to several small businesses, including restaurants, retail stores, and professional services.
The village is also home to several industrial parks, including the Dolton Industrial Park and the Dolton Business Park. These parks are home to a variety of businesses, including manufacturing, warehousing, and distribution companies.
Demographics
As of the 2010 census, there were 23,153 people, 8,717 households, and 5,945 families residing in the village. The population density was 5,364.3 people per square mile. The racial makeup of the village was 44.2% African American, 37.3% White, 0.3% Native American, 0.7% Asian, 0.1% Pacific Islander, 14.7% from other races, and 2.9% from two or more races. Hispanic or Latino of any race were 28.2% of the population.
The median income for a household in the village was $41,945, and the median income for a family was $50,945. The per capita income for the village was $19,945. About 17.2% of families and 20.3% of the population were below the poverty line, including 28.2% of those under age 18 and 11.2% of those age 65 or over.
Common Questions
What is Per Capita Income in Dolton?
Per Capita income in Dolton is $27,905.
What is the Median Family Income in Dolton?
Median Family Income in Dolton is $70,231.
What is the Median Household income in Dolton?
Median Household Income in Dolton is $54,748.
What is Income or Wage Gap in Dolton?
Income or Wage Gap in Dolton is 4.6%.
Women in Dolton earn 95.4 cents for every dollar earned by a man.
What is Family Income Deficit in Dolton?
Family Income Deficit in Dolton is $16,134.
Families that are below poverty line in Dolton earn $16,134 less on average than the poverty threshold level.
What is Inequality or Gini Index in Dolton?
Inequality or Gini Index in Dolton is 0.44.
What is the Total Population of Dolton?
Total Population of Dolton is 21,283.
What is the Total Male Population of Dolton?
Total Male Population of Dolton is 10,392.
What is the Total Female Population of Dolton?
Total Female Population of Dolton is 10,891.
What is the Ratio of Males per 100 Females in Dolton?
There are 95.42 Males per 100 Females in Dolton.
What is the Ratio of Females per 100 Males in Dolton?
There are 104.80 Females per 100 Males in Dolton.
What is the Median Population Age in Dolton?
Median Population Age in Dolton is 39.1 Years.
What is the Average Family Size in Dolton
Average Family Size in Dolton is 3.3 People.
What is the Average Household Size in Dolton
Average Household Size in Dolton is 2.6 People.
How Large is the Labor Force in Dolton?
There are 9,753 People in the Labor Forcein in Dolton.
What is the Percentage of People in the Labor Force in Dolton?
57.6% of People are in the Labor Force in Dolton.
What is the Unemployment Rate in Dolton?
Unemployment Rate in Dolton is 12.7%.