Avon, IL Map & Demographics
Avon Map
Avon Overview
$26,139
PER CAPITA INCOME
$70,132
AVG FAMILY INCOME
$41,607
AVG HOUSEHOLD INCOME
0.9%
WAGE / INCOME GAP [ % ]
99.1¢/ $1
WAGE / INCOME GAP [ $ ]
0.40
INEQUALITY / GINI INDEX
627
TOTAL POPULATION
350
MALE POPULATION
277
FEMALE POPULATION
126.35
MALES / 100 FEMALES
79.14
FEMALES / 100 MALES
44.7
MEDIAN AGE
2.8
AVG FAMILY SIZE
2.2
AVG HOUSEHOLD SIZE
362
LABOR FORCE [ PEOPLE ]
65.9%
PERCENT IN LABOR FORCE
3.6%
UNEMPLOYMENT RATE
Avon Zip Codes
Avon Area Codes
Income in Avon
Income Overview in Avon
Per Capita Income in Avon is $26,139, while median incomes of families and households are $70,132 and $41,607 respectively.
| Characteristic | Number | Measure |
| Per Capita Income | 627 | $26,139 |
| Median Family Income | 166 | $70,132 |
| Mean Family Income | 166 | $63,796 |
| Median Household Income | 290 | $41,607 |
| Mean Household Income | 290 | $56,677 |
| Income Deficit | 166 | $0 |
| Wage / Income Gap (%) | 627 | 0.87% |
| Wage / Income Gap ($) | 627 | 99.13¢ per $1 |
| Gini / Inequality Index | 627 | 0.40 |
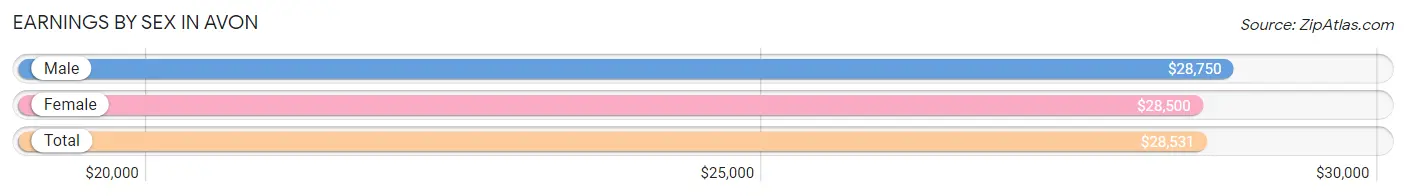
Earnings by Sex in Avon
Average Earnings in Avon are $28,531, $28,750 for men and $28,500 for women, a difference of 0.9%.
| Sex | Number | Average Earnings |
| Male | 199 (54.2%) | $28,750 |
| Female | 168 (45.8%) | $28,500 |
| Total | 367 (100.0%) | $28,531 |
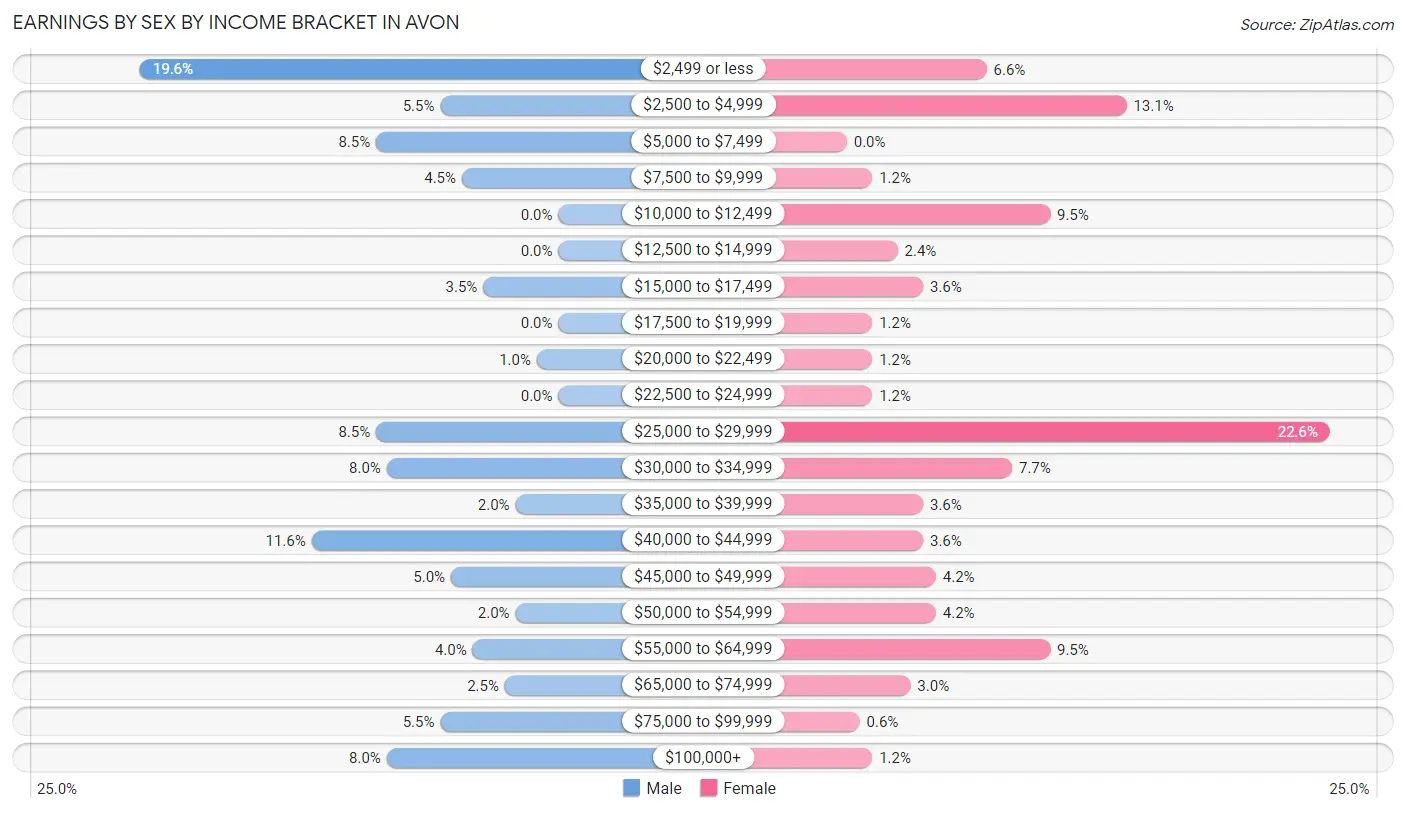
Earnings by Sex by Income Bracket in Avon
The most common earnings brackets in Avon are $2,499 or less for men (39 | 19.6%) and $25,000 to $29,999 for women (38 | 22.6%).
| Income | Male | Female |
| $2,499 or less | 39 (19.6%) | 11 (6.6%) |
| $2,500 to $4,999 | 11 (5.5%) | 22 (13.1%) |
| $5,000 to $7,499 | 17 (8.5%) | 0 (0.0%) |
| $7,500 to $9,999 | 9 (4.5%) | 2 (1.2%) |
| $10,000 to $12,499 | 0 (0.0%) | 16 (9.5%) |
| $12,500 to $14,999 | 0 (0.0%) | 4 (2.4%) |
| $15,000 to $17,499 | 7 (3.5%) | 6 (3.6%) |
| $17,500 to $19,999 | 0 (0.0%) | 2 (1.2%) |
| $20,000 to $22,499 | 2 (1.0%) | 2 (1.2%) |
| $22,500 to $24,999 | 0 (0.0%) | 2 (1.2%) |
| $25,000 to $29,999 | 17 (8.5%) | 38 (22.6%) |
| $30,000 to $34,999 | 16 (8.0%) | 13 (7.7%) |
| $35,000 to $39,999 | 4 (2.0%) | 6 (3.6%) |
| $40,000 to $44,999 | 23 (11.6%) | 6 (3.6%) |
| $45,000 to $49,999 | 10 (5.0%) | 7 (4.2%) |
| $50,000 to $54,999 | 4 (2.0%) | 7 (4.2%) |
| $55,000 to $64,999 | 8 (4.0%) | 16 (9.5%) |
| $65,000 to $74,999 | 5 (2.5%) | 5 (3.0%) |
| $75,000 to $99,999 | 11 (5.5%) | 1 (0.6%) |
| $100,000+ | 16 (8.0%) | 2 (1.2%) |
| Total | 199 (100.0%) | 168 (100.0%) |
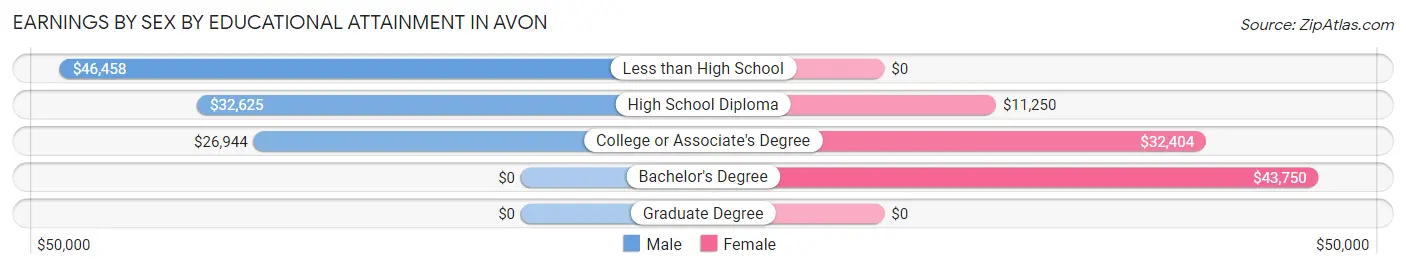
Earnings by Sex by Educational Attainment in Avon
Average earnings in Avon are $34,609 for men and $29,250 for women, a difference of 15.5%. Men with an educational attainment of less than high school enjoy the highest average annual earnings of $46,458, while those with college or associate's degree education earn the least with $26,944. Women with an educational attainment of bachelor's degree earn the most with the average annual earnings of $43,750, while those with high school diploma education have the smallest earnings of $11,250.
| Educational Attainment | Male Income | Female Income |
| Less than High School | $46,458 | $0 |
| High School Diploma | $32,625 | $11,250 |
| College or Associate's Degree | $26,944 | $32,404 |
| Bachelor's Degree | - | - |
| Graduate Degree | - | - |
| Total | $34,609 | $29,250 |
Family Income in Avon
Family Income Brackets in Avon
According to the Avon family income data, there are 42 families falling into the less than $10,000 income range, which is the most common income bracket and makes up 25.3% of all families.
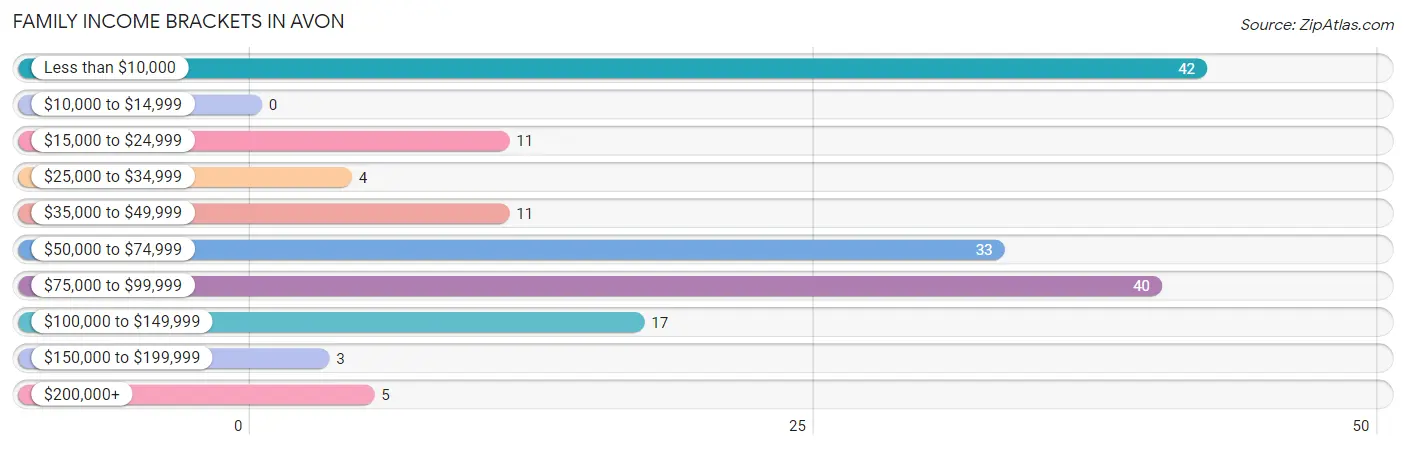
| Income Bracket | # Families | % Families |
| Less than $10,000 | 42 | 25.3% |
| $10,000 to $14,999 | 0 | 0.0% |
| $15,000 to $24,999 | 11 | 6.6% |
| $25,000 to $34,999 | 4 | 2.4% |
| $35,000 to $49,999 | 11 | 6.6% |
| $50,000 to $74,999 | 33 | 19.9% |
| $75,000 to $99,999 | 40 | 24.1% |
| $100,000 to $149,999 | 17 | 10.2% |
| $150,000 to $199,999 | 3 | 1.8% |
| $200,000+ | 5 | 3.0% |
Family Income by Famaliy Size in Avon
4-person families (26 | 15.7%) account for the highest median family income in Avon with $90,556 per family, while 2-person families (81 | 48.8%) have the highest median income of $35,312 per family member.
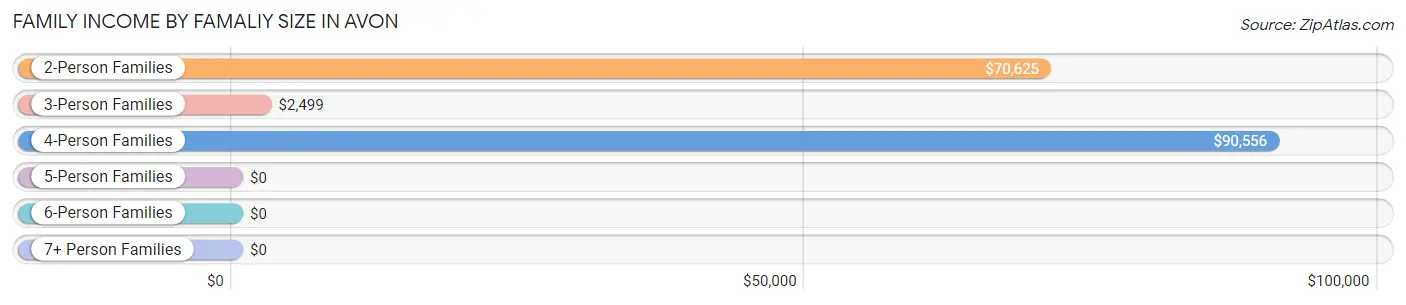
| Income Bracket | # Families | Median Income |
| 2-Person Families | 81 (48.8%) | $70,625 |
| 3-Person Families | 53 (31.9%) | $2,499 |
| 4-Person Families | 26 (15.7%) | $90,556 |
| 5-Person Families | 5 (3.0%) | $0 |
| 6-Person Families | 0 (0.0%) | $0 |
| 7+ Person Families | 1 (0.6%) | $0 |
| Total | 166 (100.0%) | $70,132 |
Family Income by Number of Earners in Avon
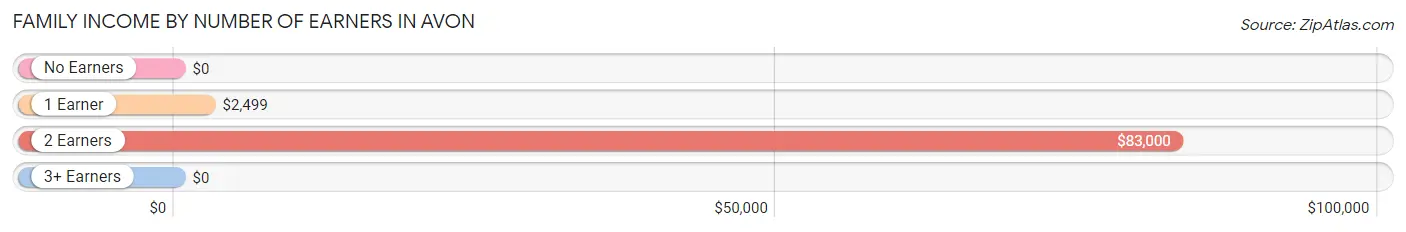
| Number of Earners | # Families | Median Income |
| No Earners | 28 (16.9%) | $0 |
| 1 Earner | 49 (29.5%) | $2,499 |
| 2 Earners | 80 (48.2%) | $83,000 |
| 3+ Earners | 9 (5.4%) | $0 |
| Total | 166 (100.0%) | $70,132 |
Household Income in Avon
Household Income Brackets in Avon
With 63 households falling in the category, the $25,000 to $34,999 income range is the most frequent in Avon, accounting for 21.7% of all households. In contrast, only 4 households (1.4%) fall into the $10,000 to $14,999 income bracket, making it the least populous group.
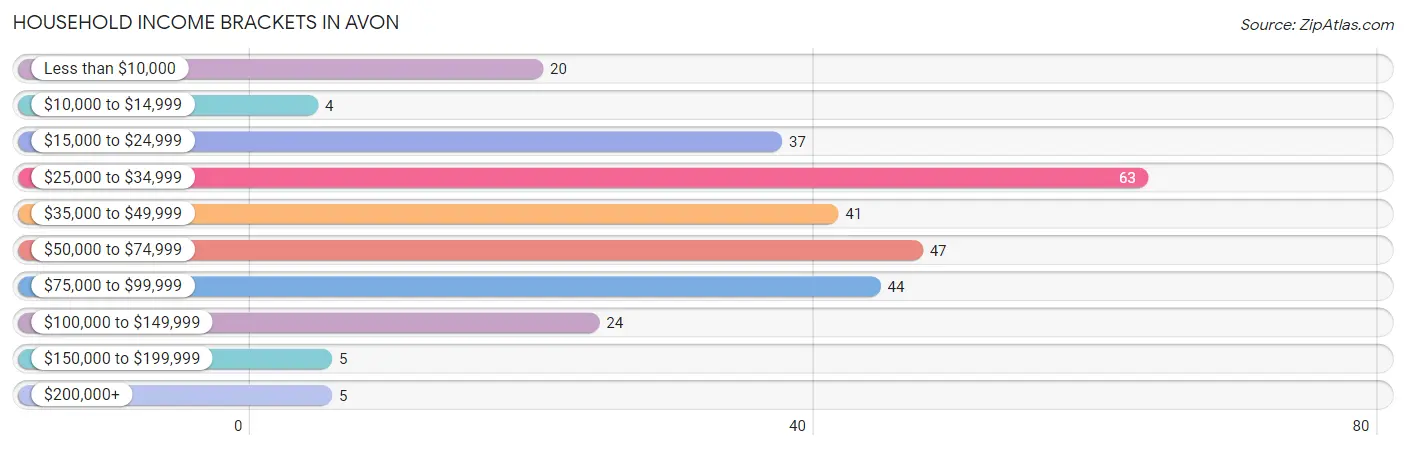
| Income Bracket | # Households | % Households |
| Less than $10,000 | 20 | 6.9% |
| $10,000 to $14,999 | 4 | 1.4% |
| $15,000 to $24,999 | 37 | 12.8% |
| $25,000 to $34,999 | 63 | 21.7% |
| $35,000 to $49,999 | 41 | 14.1% |
| $50,000 to $74,999 | 47 | 16.2% |
| $75,000 to $99,999 | 44 | 15.2% |
| $100,000 to $149,999 | 24 | 8.3% |
| $150,000 to $199,999 | 5 | 1.7% |
| $200,000+ | 5 | 1.7% |
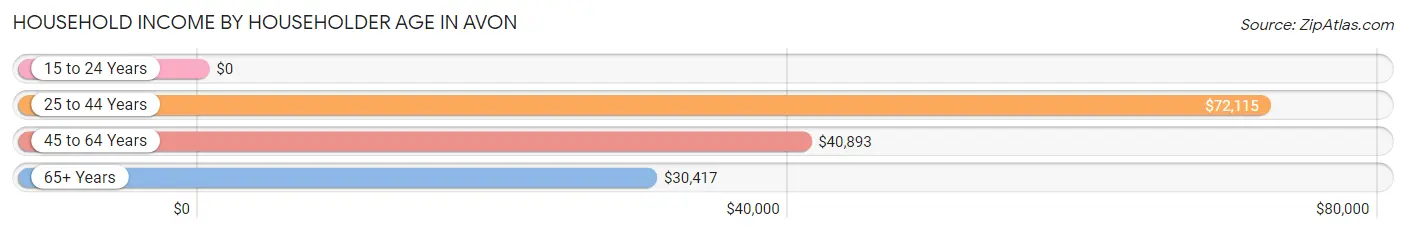
Household Income by Householder Age in Avon
The median household income in Avon is $41,607, with the highest median household income of $72,115 found in the 25 to 44 years age bracket for the primary householder. A total of 56 households (19.3%) fall into this category. Meanwhile, the 15 to 24 years age bracket for the primary householder has the lowest median household income of $0, with 5 households (1.7%) in this group.
| Income Bracket | # Households | Median Income |
| 15 to 24 Years | 5 (1.7%) | $0 |
| 25 to 44 Years | 56 (19.3%) | $72,115 |
| 45 to 64 Years | 146 (50.3%) | $40,893 |
| 65+ Years | 83 (28.6%) | $30,417 |
| Total | 290 (100.0%) | $41,607 |
Poverty in Avon
Income Below Poverty by Sex and Age in Avon
With 33.7% poverty level for males and 4.8% for females among the residents of Avon, 16 and 17 year old males and 18 to 24 year old females are the most vulnerable to poverty, with 59 males (96.7%) and 4 females (25.0%) in their respective age groups living below the poverty level.
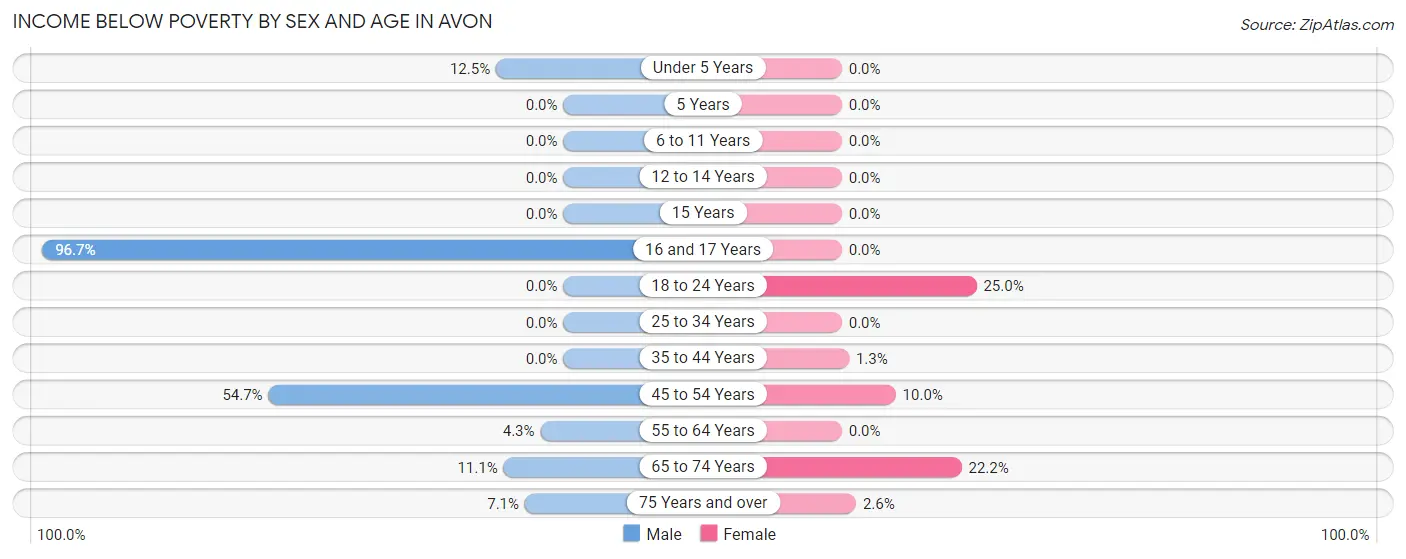
| Age Bracket | Male | Female |
| Under 5 Years | 1 (12.5%) | 0 (0.0%) |
| 5 Years | 0 (0.0%) | 0 (0.0%) |
| 6 to 11 Years | 0 (0.0%) | 0 (0.0%) |
| 12 to 14 Years | 0 (0.0%) | 0 (0.0%) |
| 15 Years | 0 (0.0%) | 0 (0.0%) |
| 16 and 17 Years | 59 (96.7%) | 0 (0.0%) |
| 18 to 24 Years | 0 (0.0%) | 4 (25.0%) |
| 25 to 34 Years | 0 (0.0%) | 0 (0.0%) |
| 35 to 44 Years | 0 (0.0%) | 1 (1.3%) |
| 45 to 54 Years | 52 (54.7%) | 3 (10.0%) |
| 55 to 64 Years | 2 (4.3%) | 0 (0.0%) |
| 65 to 74 Years | 2 (11.1%) | 4 (22.2%) |
| 75 Years and over | 2 (7.1%) | 1 (2.6%) |
| Total | 118 (33.7%) | 13 (4.8%) |
Income Above Poverty by Sex and Age in Avon
According to the poverty statistics in Avon, males aged 6 to 11 years and females aged under 5 years are the age groups that are most secure financially, with 100.0% of males and 100.0% of females in these age groups living above the poverty line.
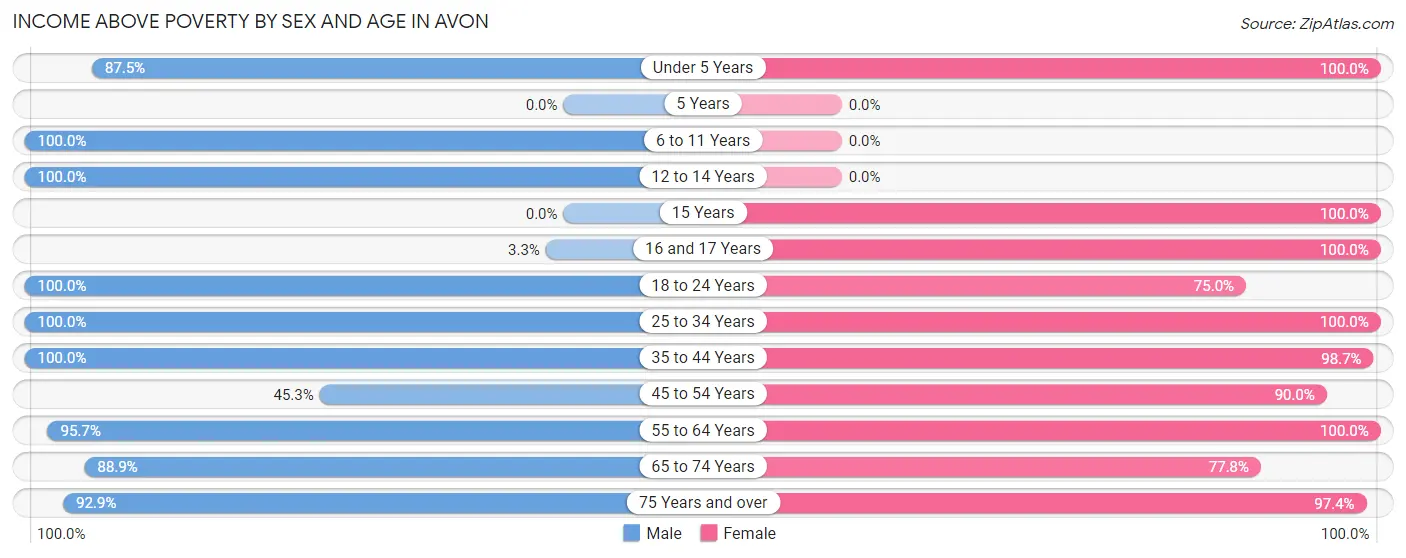
| Age Bracket | Male | Female |
| Under 5 Years | 7 (87.5%) | 30 (100.0%) |
| 5 Years | 0 (0.0%) | 0 (0.0%) |
| 6 to 11 Years | 6 (100.0%) | 0 (0.0%) |
| 12 to 14 Years | 24 (100.0%) | 0 (0.0%) |
| 15 Years | 0 (0.0%) | 5 (100.0%) |
| 16 and 17 Years | 2 (3.3%) | 13 (100.0%) |
| 18 to 24 Years | 10 (100.0%) | 12 (75.0%) |
| 25 to 34 Years | 14 (100.0%) | 10 (100.0%) |
| 35 to 44 Years | 39 (100.0%) | 74 (98.7%) |
| 45 to 54 Years | 43 (45.3%) | 27 (90.0%) |
| 55 to 64 Years | 45 (95.7%) | 37 (100.0%) |
| 65 to 74 Years | 16 (88.9%) | 14 (77.8%) |
| 75 Years and over | 26 (92.9%) | 37 (97.4%) |
| Total | 232 (66.3%) | 259 (95.2%) |
Income Below Poverty Among Married-Couple Families in Avon
The poverty statistics for married-couple families in Avon show that 3.8% or 4 of the total 105 families live below the poverty line. Families with no children have the highest poverty rate of 6.5%, comprising of 4 families. On the other hand, families with 1 or 2 children have the lowest poverty rate of 0.0%, which includes 0 families.
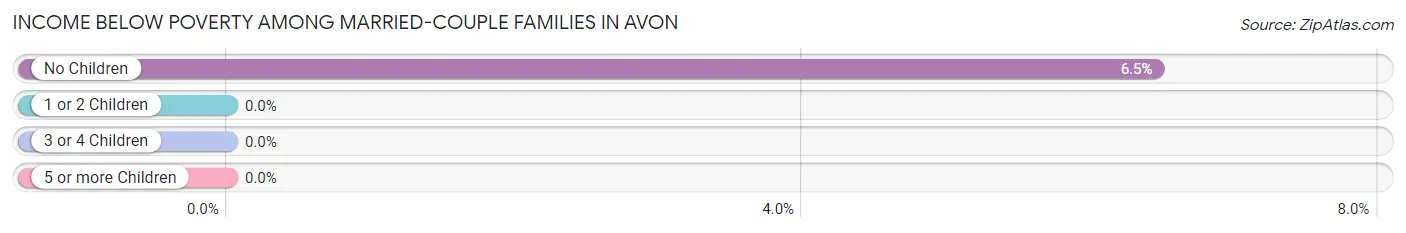
| Children | Above Poverty | Below Poverty |
| No Children | 58 (93.5%) | 4 (6.5%) |
| 1 or 2 Children | 42 (100.0%) | 0 (0.0%) |
| 3 or 4 Children | 0 (0.0%) | 0 (0.0%) |
| 5 or more Children | 1 (100.0%) | 0 (0.0%) |
| Total | 101 (96.2%) | 4 (3.8%) |
Income Below Poverty Among Single-Parent Households in Avon
According to the poverty data in Avon, 85.7% or 36 single-father households and 10.5% or 2 single-mother households are living below the poverty line. Among single-father households, those with 1 or 2 children have the highest poverty rate, with 36 households (100.0%) experiencing poverty. Likewise, among single-mother households, those with 1 or 2 children have the highest poverty rate, with 2 households (22.2%) falling below the poverty line.
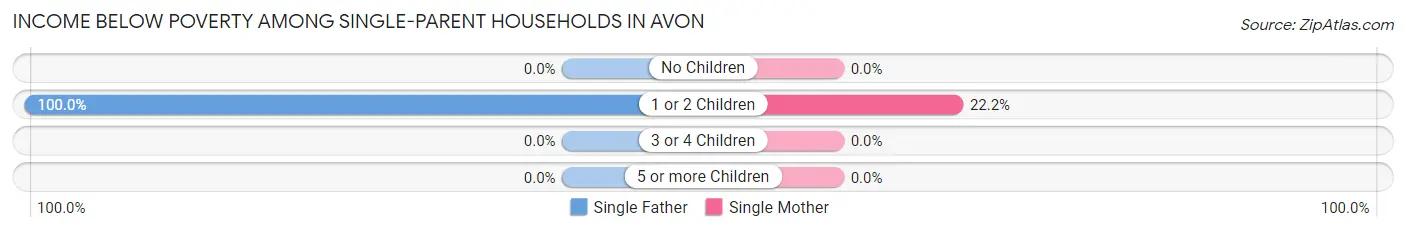
| Children | Single Father | Single Mother |
| No Children | 0 (0.0%) | 0 (0.0%) |
| 1 or 2 Children | 36 (100.0%) | 2 (22.2%) |
| 3 or 4 Children | 0 (0.0%) | 0 (0.0%) |
| 5 or more Children | 0 (0.0%) | 0 (0.0%) |
| Total | 36 (85.7%) | 2 (10.5%) |
Income Below Poverty Among Married-Couple vs Single-Parent Households in Avon
The poverty data for Avon shows that 4 of the married-couple family households (3.8%) and 38 of the single-parent households (62.3%) are living below the poverty level. Within the married-couple family households, those with no children have the highest poverty rate, with 4 households (6.5%) falling below the poverty line. Among the single-parent households, those with 1 or 2 children have the highest poverty rate, with 38 household (84.4%) living below poverty.
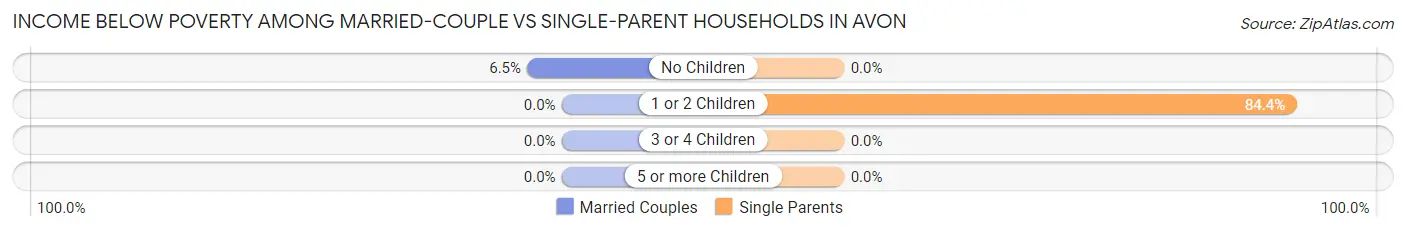
| Children | Married-Couple Families | Single-Parent Households |
| No Children | 4 (6.5%) | 0 (0.0%) |
| 1 or 2 Children | 0 (0.0%) | 38 (84.4%) |
| 3 or 4 Children | 0 (0.0%) | 0 (0.0%) |
| 5 or more Children | 0 (0.0%) | 0 (0.0%) |
| Total | 4 (3.8%) | 38 (62.3%) |
Race in Avon
The most populous races in Avon are White / Caucasian (625 | 99.7%), Black / African American (1 | 0.2%), and Two or more Races (1 | 0.2%).
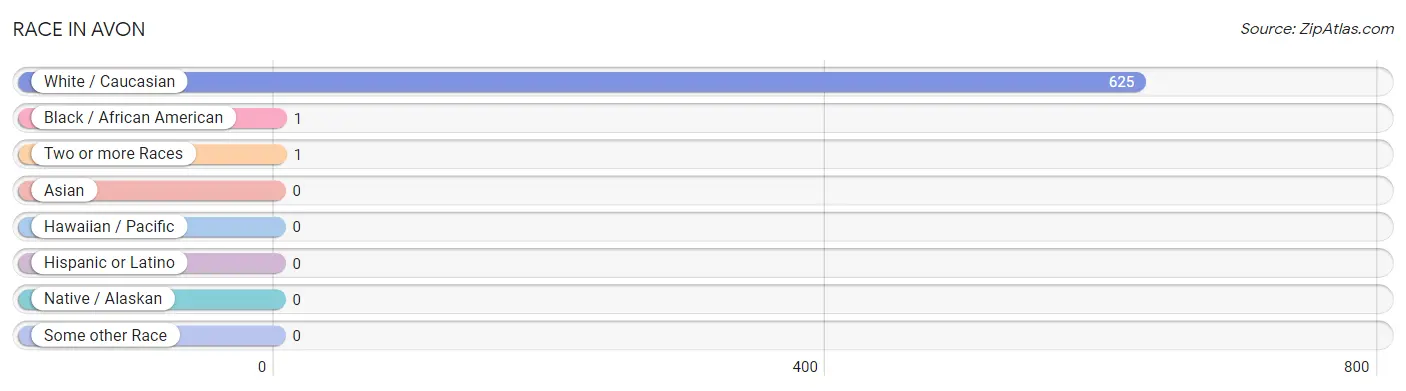
| Race | # Population | % Population |
| Asian | 0 | 0.0% |
| Black / African American | 1 | 0.2% |
| Hawaiian / Pacific | 0 | 0.0% |
| Hispanic or Latino | 0 | 0.0% |
| Native / Alaskan | 0 | 0.0% |
| White / Caucasian | 625 | 99.7% |
| Two or more Races | 1 | 0.2% |
| Some other Race | 0 | 0.0% |
| Total | 627 | 100.0% |
Ancestry in Avon
The most populous ancestries reported in Avon are German (129 | 20.6%), Irish (118 | 18.8%), English (71 | 11.3%), Scottish (30 | 4.8%), and American (18 | 2.9%), together accounting for 58.4% of all Avon residents.
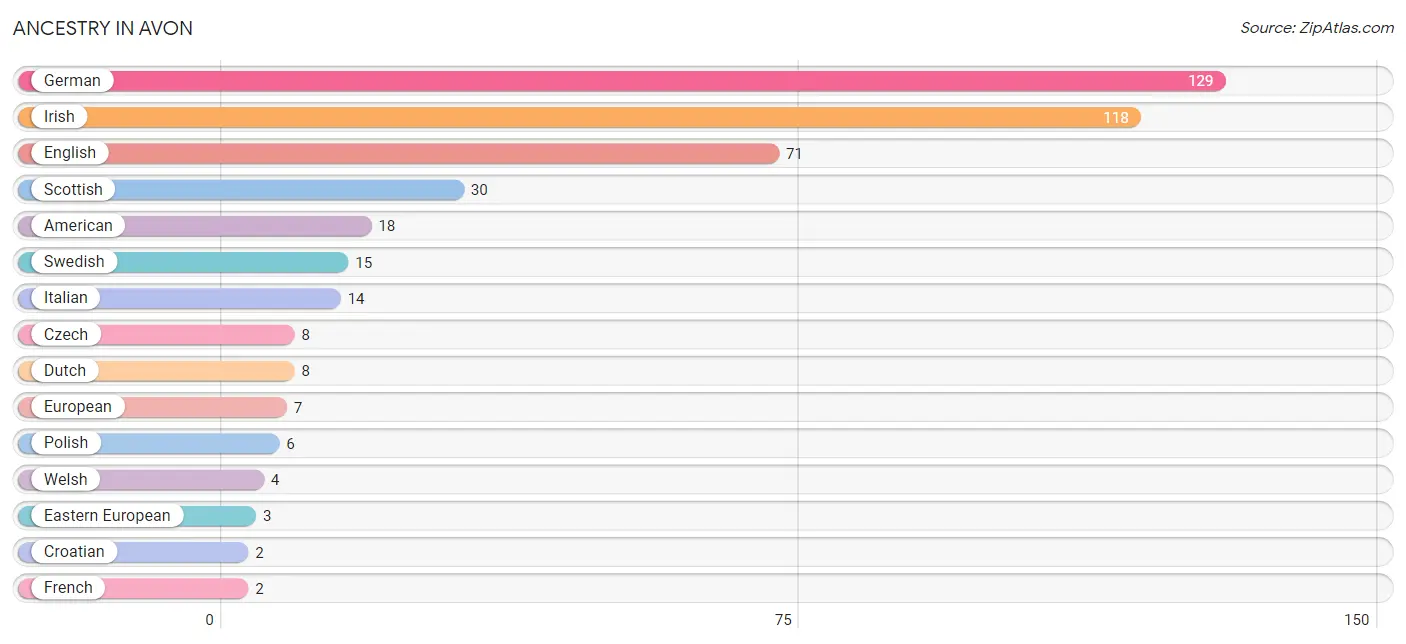
| Ancestry | # Population | % Population |
| American | 18 | 2.9% |
| Croatian | 2 | 0.3% |
| Czech | 8 | 1.3% |
| Dutch | 8 | 1.3% |
| Eastern European | 3 | 0.5% |
| English | 71 | 11.3% |
| European | 7 | 1.1% |
| French | 2 | 0.3% |
| German | 129 | 20.6% |
| Irish | 118 | 18.8% |
| Italian | 14 | 2.2% |
| Norwegian | 2 | 0.3% |
| Polish | 6 | 1.0% |
| Scottish | 30 | 4.8% |
| Swedish | 15 | 2.4% |
| Welsh | 4 | 0.6% | View All 16 Rows |
Immigrants in Avon

| Immigration Origin | # Population | % Population | View All 0 Rows |
Sex and Age in Avon
Sex and Age in Avon
The most populous age groups in Avon are 15 to 19 Years (64 | 18.3%) for men and 40 to 44 Years (66 | 23.8%) for women.
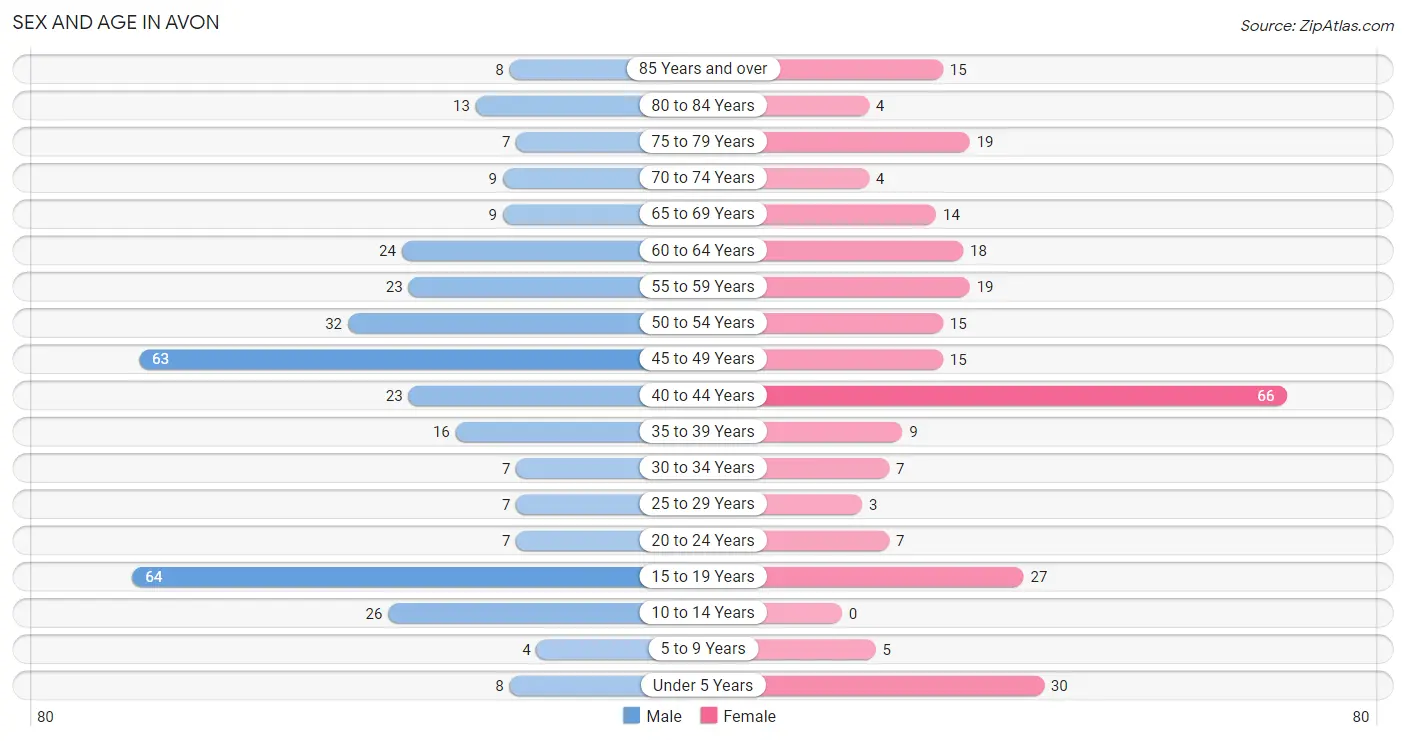
| Age Bracket | Male | Female |
| Under 5 Years | 8 (2.3%) | 30 (10.8%) |
| 5 to 9 Years | 4 (1.1%) | 5 (1.8%) |
| 10 to 14 Years | 26 (7.4%) | 0 (0.0%) |
| 15 to 19 Years | 64 (18.3%) | 27 (9.8%) |
| 20 to 24 Years | 7 (2.0%) | 7 (2.5%) |
| 25 to 29 Years | 7 (2.0%) | 3 (1.1%) |
| 30 to 34 Years | 7 (2.0%) | 7 (2.5%) |
| 35 to 39 Years | 16 (4.6%) | 9 (3.3%) |
| 40 to 44 Years | 23 (6.6%) | 66 (23.8%) |
| 45 to 49 Years | 63 (18.0%) | 15 (5.4%) |
| 50 to 54 Years | 32 (9.1%) | 15 (5.4%) |
| 55 to 59 Years | 23 (6.6%) | 19 (6.9%) |
| 60 to 64 Years | 24 (6.9%) | 18 (6.5%) |
| 65 to 69 Years | 9 (2.6%) | 14 (5.1%) |
| 70 to 74 Years | 9 (2.6%) | 4 (1.4%) |
| 75 to 79 Years | 7 (2.0%) | 19 (6.9%) |
| 80 to 84 Years | 13 (3.7%) | 4 (1.4%) |
| 85 Years and over | 8 (2.3%) | 15 (5.4%) |
| Total | 350 (100.0%) | 277 (100.0%) |
Families and Households in Avon
Median Family Size in Avon
The median family size in Avon is 2.75 persons per family, with married-couple families (105 | 63.2%) accounting for the largest median family size of 2.91 persons per family. On the other hand, single female/mother families (19 | 11.5%) represent the smallest median family size with 2.32 persons per family.
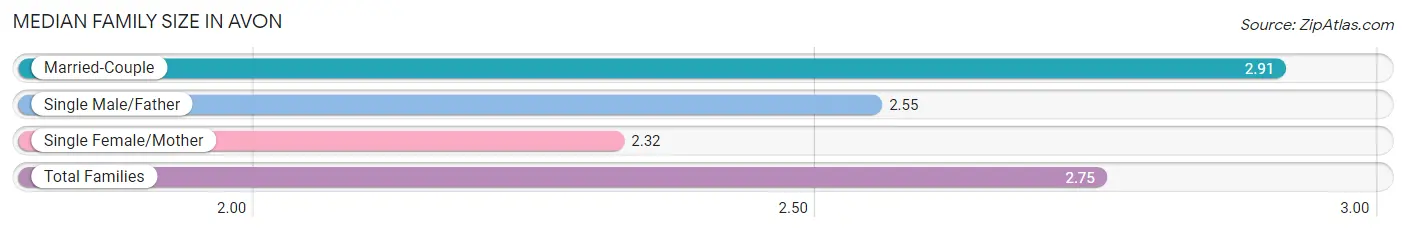
| Family Type | # Families | Family Size |
| Married-Couple | 105 (63.2%) | 2.91 |
| Single Male/Father | 42 (25.3%) | 2.55 |
| Single Female/Mother | 19 (11.5%) | 2.32 |
| Total Families | 166 (100.0%) | 2.75 |
Median Household Size in Avon
The median household size in Avon is 2.16 persons per household, with single male/father households (42 | 14.5%) accounting for the largest median household size of 3.38 persons per household. non-family households (124 | 42.8%) represent the smallest median household size with 1.05 persons per household.
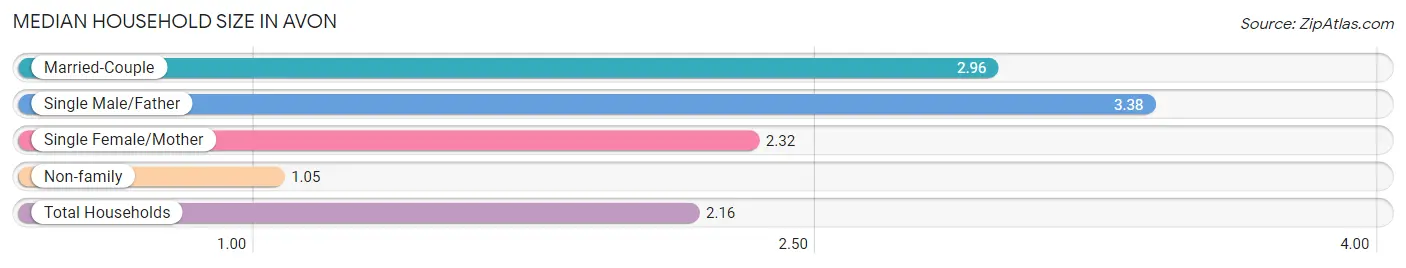
| Household Type | # Households | Household Size |
| Married-Couple | 105 (36.2%) | 2.96 |
| Single Male/Father | 42 (14.5%) | 3.38 |
| Single Female/Mother | 19 (6.6%) | 2.32 |
| Non-family | 124 (42.8%) | 1.05 |
| Total Households | 290 (100.0%) | 2.16 |
Household Size by Marriage Status in Avon
Out of a total of 290 households in Avon, 166 (57.2%) are family households, while 124 (42.8%) are nonfamily households. The most numerous type of family households are 2-person households, comprising 77, and the most common type of nonfamily households are 1-person households, comprising 118.
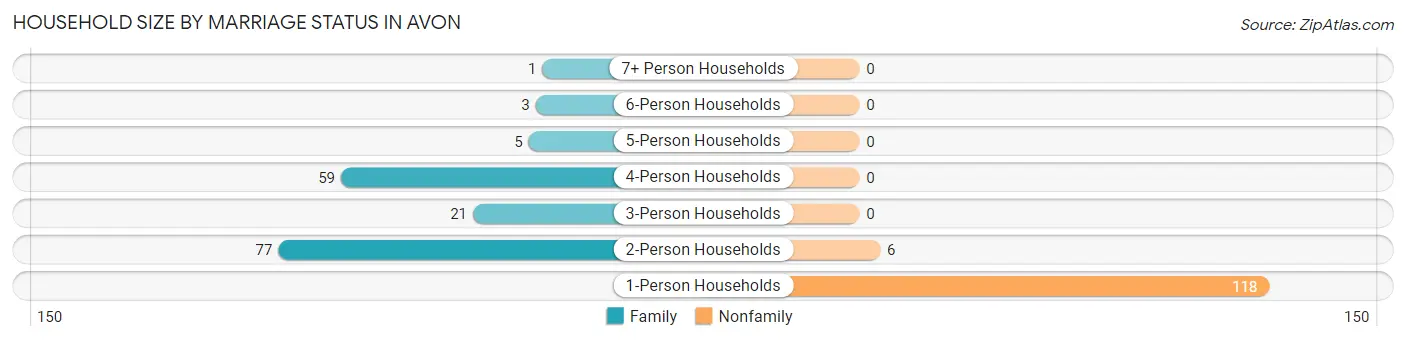
| Household Size | Family Households | Nonfamily Households |
| 1-Person Households | - | 118 (40.7%) |
| 2-Person Households | 77 (26.6%) | 6 (2.1%) |
| 3-Person Households | 21 (7.2%) | 0 (0.0%) |
| 4-Person Households | 59 (20.3%) | 0 (0.0%) |
| 5-Person Households | 5 (1.7%) | 0 (0.0%) |
| 6-Person Households | 3 (1.0%) | 0 (0.0%) |
| 7+ Person Households | 1 (0.3%) | 0 (0.0%) |
| Total | 166 (57.2%) | 124 (42.8%) |
Female Fertility in Avon
Fertility by Age in Avon
Average fertility rate in Avon is 64.0 births per 1,000 women. Women in the age bracket of 35 to 50 years have the highest fertility rate with 93.0 births per 1,000 women. Women in the age bracket of 35 to 50 years acount for 100.0% of all women with births.
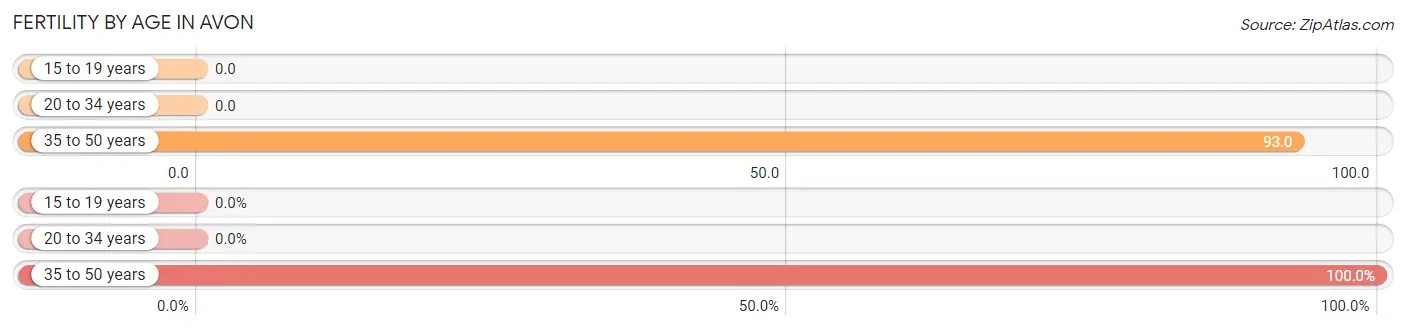
| Age Bracket | Women with Births | Births / 1,000 Women |
| 15 to 19 years | 0 (0.0%) | 0.0 |
| 20 to 34 years | 0 (0.0%) | 0.0 |
| 35 to 50 years | 9 (100.0%) | 93.0 |
| Total | 9 (100.0%) | 64.0 |
Fertility by Age by Marriage Status in Avon
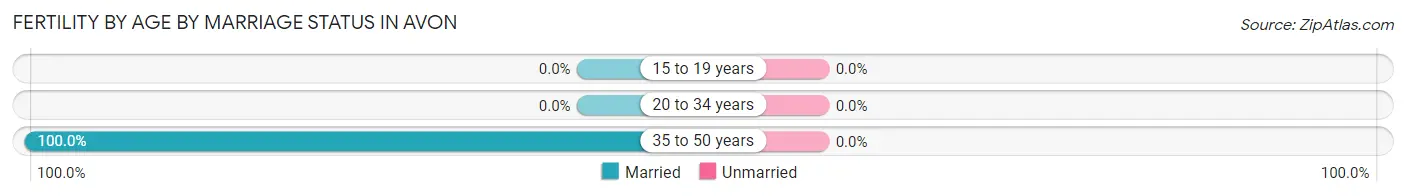
| Age Bracket | Married | Unmarried |
| 15 to 19 years | 0 (0.0%) | 0 (0.0%) |
| 20 to 34 years | 0 (0.0%) | 0 (0.0%) |
| 35 to 50 years | 9 (100.0%) | 0 (0.0%) |
| Total | 9 (100.0%) | 0 (0.0%) |
Fertility by Education in Avon
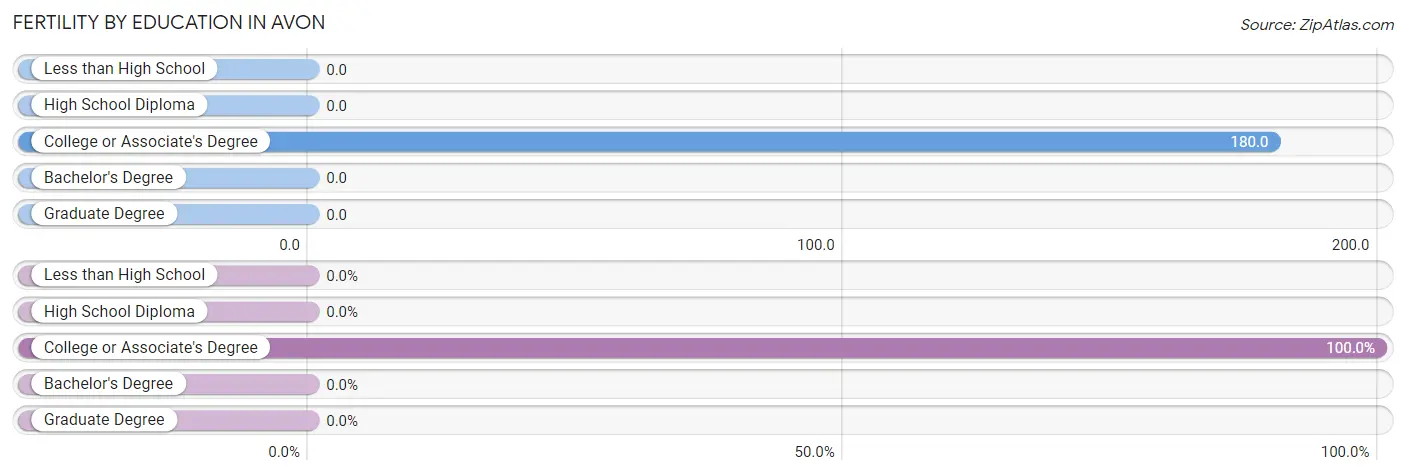
| Educational Attainment | Women with Births | Births / 1,000 Women |
| Less than High School | 0 (0.0%) | 0.0 |
| High School Diploma | 0 (0.0%) | 0.0 |
| College or Associate's Degree | 9 (100.0%) | 180.0 |
| Bachelor's Degree | 0 (0.0%) | 0.0 |
| Graduate Degree | 0 (0.0%) | 0.0 |
| Total | 9 (100.0%) | 64.0 |
Fertility by Education by Marriage Status in Avon
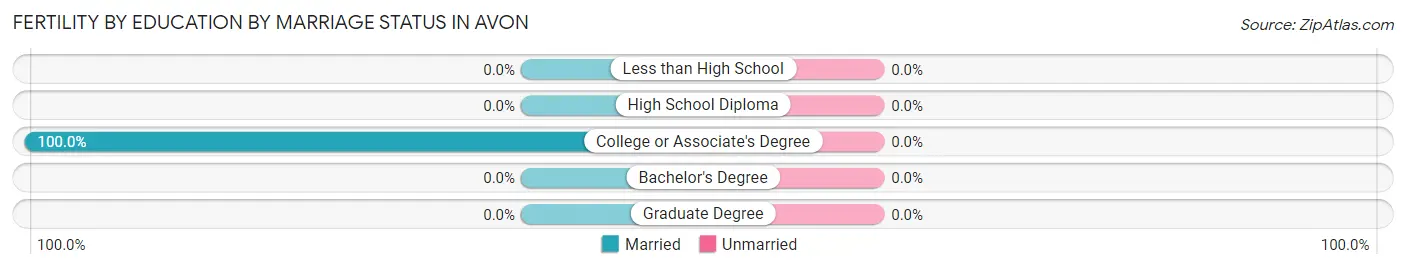
| Educational Attainment | Married | Unmarried |
| Less than High School | 0 (0.0%) | 0 (0.0%) |
| High School Diploma | 0 (0.0%) | 0 (0.0%) |
| College or Associate's Degree | 9 (100.0%) | 0 (0.0%) |
| Bachelor's Degree | 0 (0.0%) | 0 (0.0%) |
| Graduate Degree | 0 (0.0%) | 0 (0.0%) |
| Total | 9 (100.0%) | 0 (0.0%) |
Employment Characteristics in Avon
Employment by Class of Employer in Avon
Among the 349 employed individuals in Avon, private company employees (267 | 76.5%), self-employed (not incorporated) (44 | 12.6%), and local government employees (26 | 7.4%) make up the most common classes of employment.
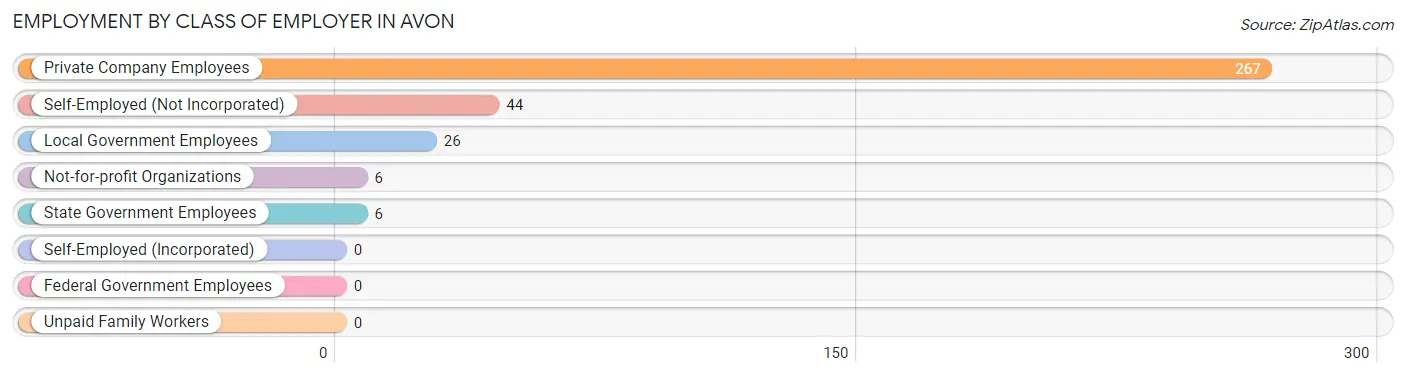
| Employer Class | # Employees | % Employees |
| Private Company Employees | 267 | 76.5% |
| Self-Employed (Incorporated) | 0 | 0.0% |
| Self-Employed (Not Incorporated) | 44 | 12.6% |
| Not-for-profit Organizations | 6 | 1.7% |
| Local Government Employees | 26 | 7.4% |
| State Government Employees | 6 | 1.7% |
| Federal Government Employees | 0 | 0.0% |
| Unpaid Family Workers | 0 | 0.0% |
| Total | 349 | 100.0% |
Employment Status by Age in Avon
According to the labor force statistics for Avon, out of the total population over 16 years of age (549), 65.9% or 362 individuals are in the labor force, with 3.6% or 13 of them unemployed. The age group with the highest labor force participation rate is 25 to 29 years, with 100.0% or 10 individuals in the labor force. Within the labor force, the 25 to 29 years age range has the highest percentage of unemployed individuals, with 30.0% or 3 of them being unemployed.
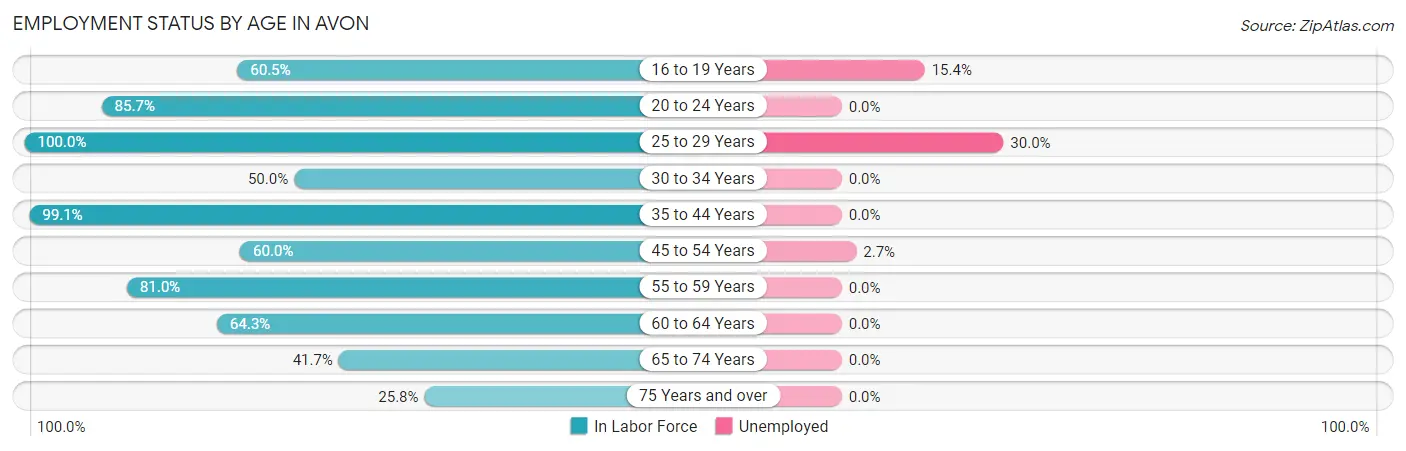
| Age Bracket | In Labor Force | Unemployed |
| 16 to 19 Years | 52 (60.5%) | 8 (15.4%) |
| 20 to 24 Years | 12 (85.7%) | 0 (0.0%) |
| 25 to 29 Years | 10 (100.0%) | 3 (30.0%) |
| 30 to 34 Years | 7 (50.0%) | 0 (0.0%) |
| 35 to 44 Years | 113 (99.1%) | 0 (0.0%) |
| 45 to 54 Years | 75 (60.0%) | 2 (2.7%) |
| 55 to 59 Years | 34 (81.0%) | 0 (0.0%) |
| 60 to 64 Years | 27 (64.3%) | 0 (0.0%) |
| 65 to 74 Years | 15 (41.7%) | 0 (0.0%) |
| 75 Years and over | 17 (25.8%) | 0 (0.0%) |
| Total | 362 (65.9%) | 13 (3.6%) |
Employment Status by Educational Attainment in Avon
According to labor force statistics for Avon, 76.7% of individuals (266) out of the total population between 25 and 64 years of age (347) are in the labor force, with 1.9% or 5 of them being unemployed. The group with the highest labor force participation rate are those with the educational attainment of college / associate degree, with 95.8% or 138 individuals in the labor force. Within the labor force, individuals with college / associate degree education have the highest percentage of unemployment, with 3.6% or 5 of them being unemployed.
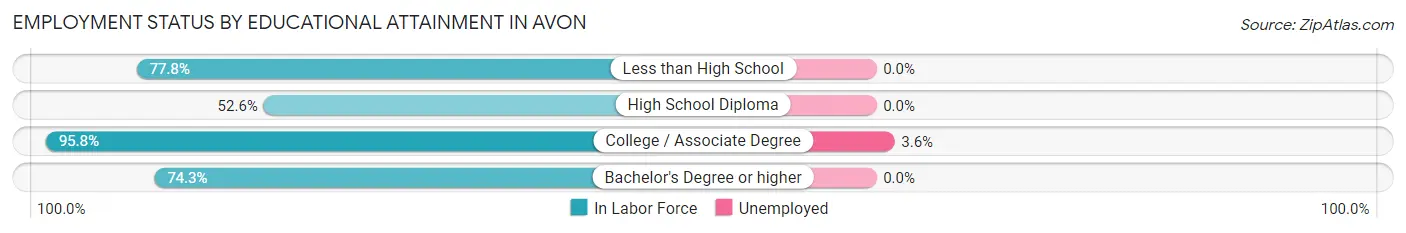
| Educational Attainment | In Labor Force | Unemployed |
| Less than High School | 42 (77.8%) | 0 (0.0%) |
| High School Diploma | 60 (52.6%) | 0 (0.0%) |
| College / Associate Degree | 138 (95.8%) | 5 (3.6%) |
| Bachelor's Degree or higher | 26 (74.3%) | 0 (0.0%) |
| Total | 266 (76.7%) | 7 (1.9%) |
Employment Occupations by Sex in Avon
Management, Business, Science and Arts Occupations
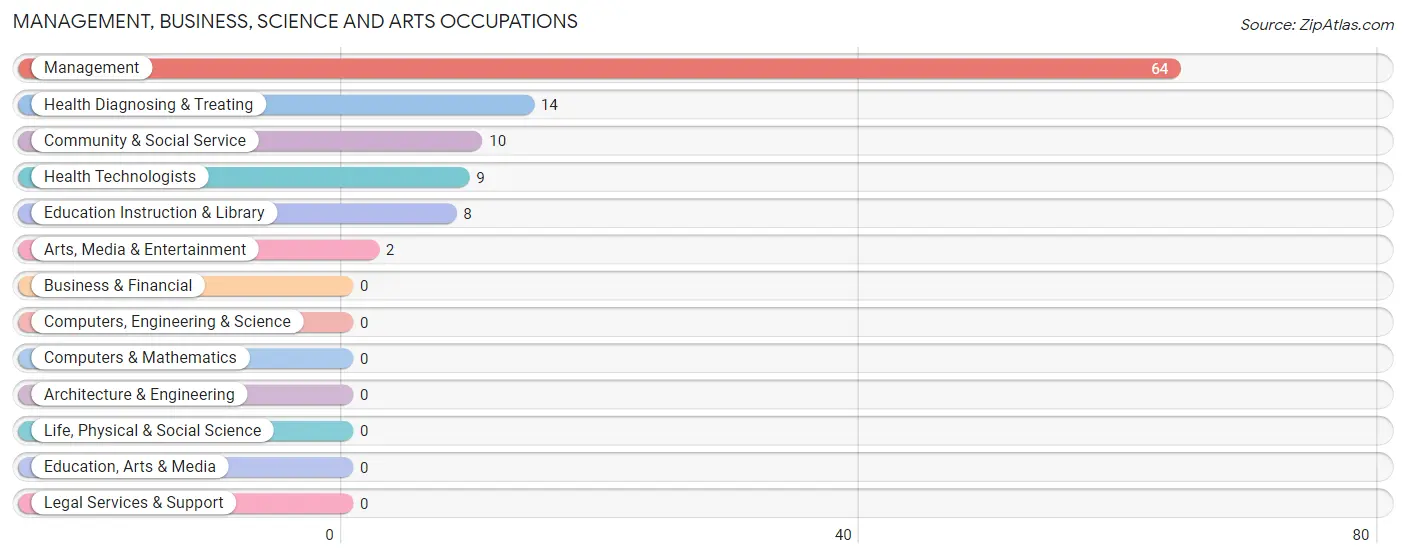
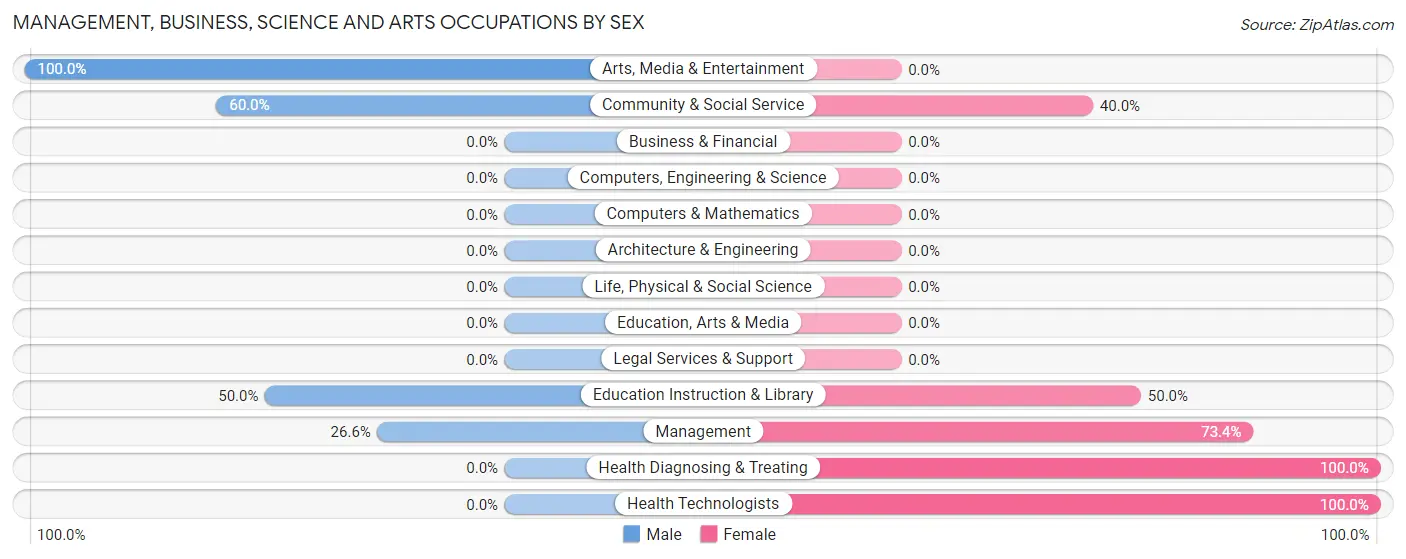
The most common Management, Business, Science and Arts occupations in Avon are Management (64 | 18.3%), Health Diagnosing & Treating (14 | 4.0%), Community & Social Service (10 | 2.9%), Health Technologists (9 | 2.6%), and Education Instruction & Library (8 | 2.3%).
Management, Business, Science and Arts Occupations by Sex
Within the Management, Business, Science and Arts occupations in Avon, the most male-oriented occupations are Arts, Media & Entertainment (100.0%), Community & Social Service (60.0%), and Education Instruction & Library (50.0%), while the most female-oriented occupations are Health Diagnosing & Treating (100.0%), Health Technologists (100.0%), and Management (73.4%).
| Occupation | Male | Female |
| Management | 17 (26.6%) | 47 (73.4%) |
| Business & Financial | 0 (0.0%) | 0 (0.0%) |
| Computers, Engineering & Science | 0 (0.0%) | 0 (0.0%) |
| Computers & Mathematics | 0 (0.0%) | 0 (0.0%) |
| Architecture & Engineering | 0 (0.0%) | 0 (0.0%) |
| Life, Physical & Social Science | 0 (0.0%) | 0 (0.0%) |
| Community & Social Service | 6 (60.0%) | 4 (40.0%) |
| Education, Arts & Media | 0 (0.0%) | 0 (0.0%) |
| Legal Services & Support | 0 (0.0%) | 0 (0.0%) |
| Education Instruction & Library | 4 (50.0%) | 4 (50.0%) |
| Arts, Media & Entertainment | 2 (100.0%) | 0 (0.0%) |
| Health Diagnosing & Treating | 0 (0.0%) | 14 (100.0%) |
| Health Technologists | 0 (0.0%) | 9 (100.0%) |
| Total (Category) | 23 (26.1%) | 65 (73.9%) |
| Total (Overall) | 192 (55.0%) | 157 (45.0%) |
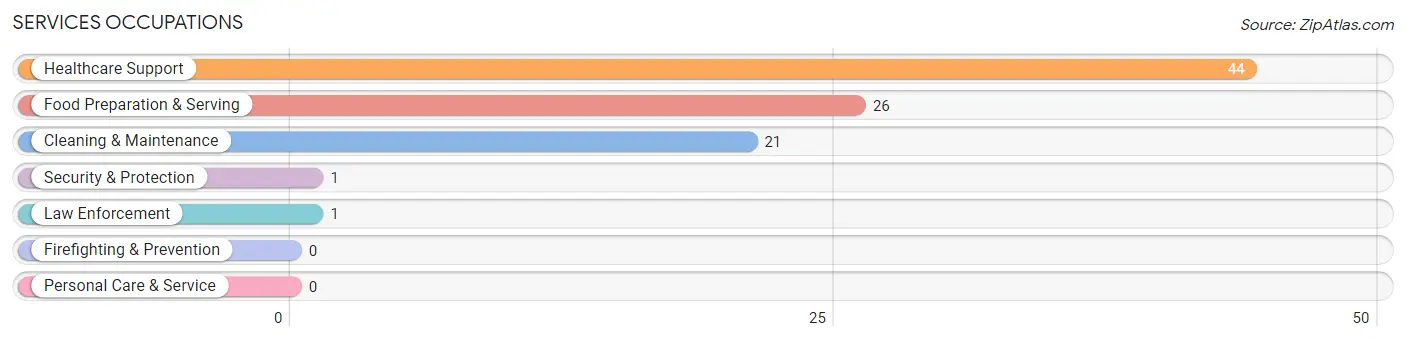
Services Occupations
The most common Services occupations in Avon are Healthcare Support (44 | 12.6%), Food Preparation & Serving (26 | 7.4%), Cleaning & Maintenance (21 | 6.0%), Security & Protection (1 | 0.3%), and Law Enforcement (1 | 0.3%).
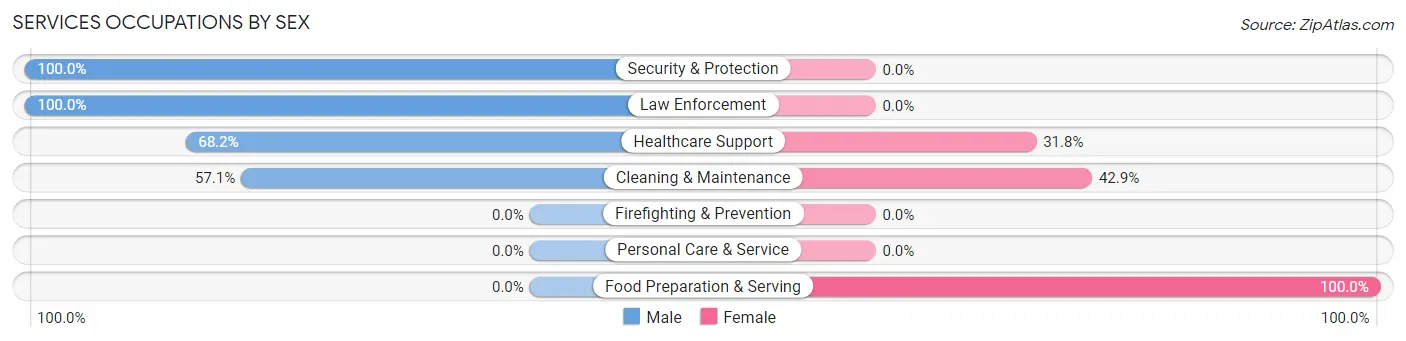
Services Occupations by Sex
Within the Services occupations in Avon, the most male-oriented occupations are Security & Protection (100.0%), Law Enforcement (100.0%), and Healthcare Support (68.2%), while the most female-oriented occupations are Food Preparation & Serving (100.0%), Cleaning & Maintenance (42.9%), and Healthcare Support (31.8%).
| Occupation | Male | Female |
| Healthcare Support | 30 (68.2%) | 14 (31.8%) |
| Security & Protection | 1 (100.0%) | 0 (0.0%) |
| Firefighting & Prevention | 0 (0.0%) | 0 (0.0%) |
| Law Enforcement | 1 (100.0%) | 0 (0.0%) |
| Food Preparation & Serving | 0 (0.0%) | 26 (100.0%) |
| Cleaning & Maintenance | 12 (57.1%) | 9 (42.9%) |
| Personal Care & Service | 0 (0.0%) | 0 (0.0%) |
| Total (Category) | 43 (46.7%) | 49 (53.3%) |
| Total (Overall) | 192 (55.0%) | 157 (45.0%) |
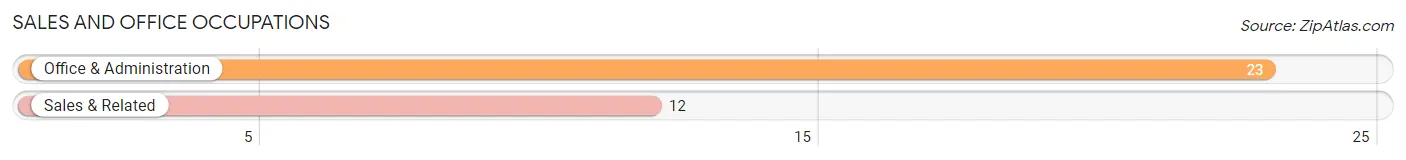
Sales and Office Occupations
The most common Sales and Office occupations in Avon are Office & Administration (23 | 6.6%), and Sales & Related (12 | 3.4%).
Sales and Office Occupations by Sex
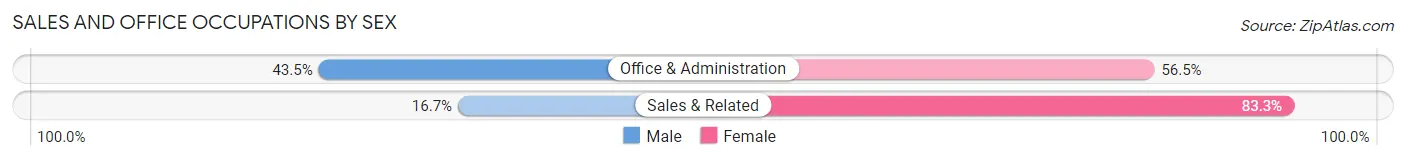
| Occupation | Male | Female |
| Sales & Related | 2 (16.7%) | 10 (83.3%) |
| Office & Administration | 10 (43.5%) | 13 (56.5%) |
| Total (Category) | 12 (34.3%) | 23 (65.7%) |
| Total (Overall) | 192 (55.0%) | 157 (45.0%) |
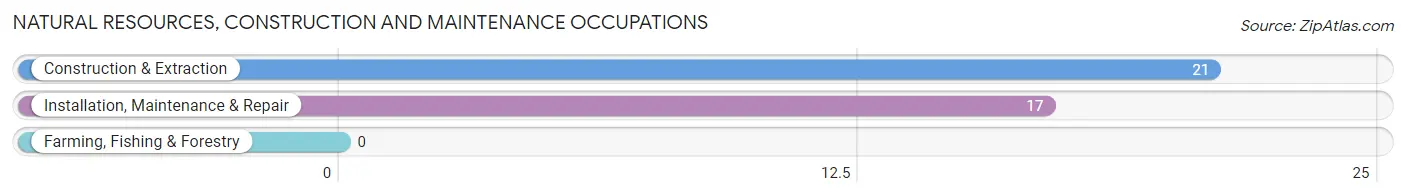
Natural Resources, Construction and Maintenance Occupations
The most common Natural Resources, Construction and Maintenance occupations in Avon are Construction & Extraction (21 | 6.0%), and Installation, Maintenance & Repair (17 | 4.9%).
Natural Resources, Construction and Maintenance Occupations by Sex
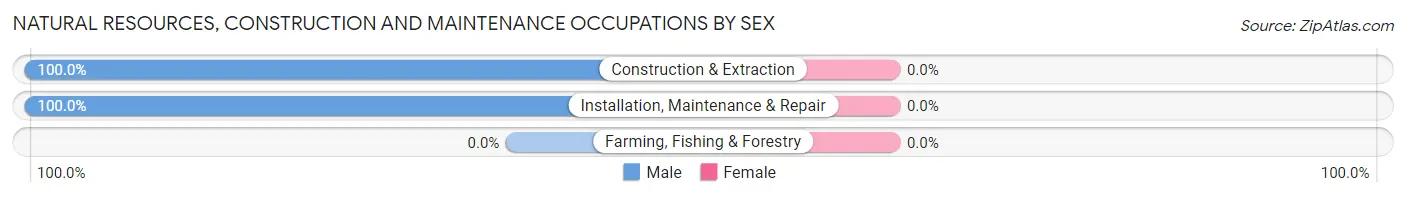
| Occupation | Male | Female |
| Farming, Fishing & Forestry | 0 (0.0%) | 0 (0.0%) |
| Construction & Extraction | 21 (100.0%) | 0 (0.0%) |
| Installation, Maintenance & Repair | 17 (100.0%) | 0 (0.0%) |
| Total (Category) | 38 (100.0%) | 0 (0.0%) |
| Total (Overall) | 192 (55.0%) | 157 (45.0%) |
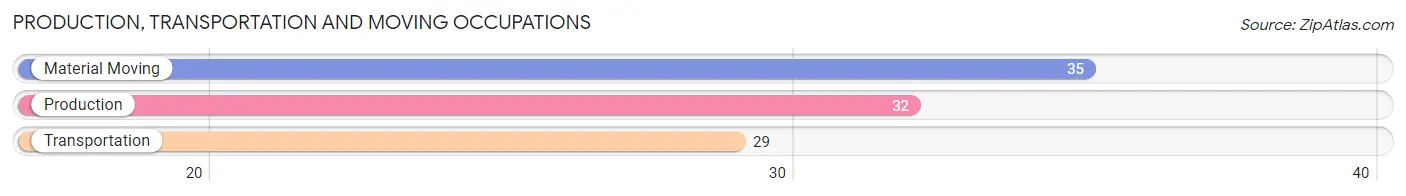
Production, Transportation and Moving Occupations
The most common Production, Transportation and Moving occupations in Avon are Material Moving (35 | 10.0%), Production (32 | 9.2%), and Transportation (29 | 8.3%).
Production, Transportation and Moving Occupations by Sex
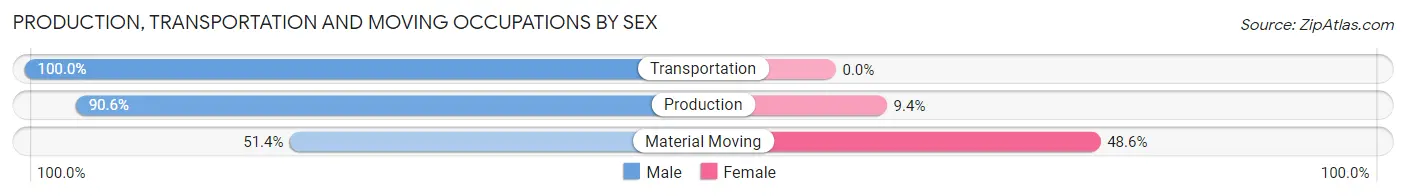
| Occupation | Male | Female |
| Production | 29 (90.6%) | 3 (9.4%) |
| Transportation | 29 (100.0%) | 0 (0.0%) |
| Material Moving | 18 (51.4%) | 17 (48.6%) |
| Total (Category) | 76 (79.2%) | 20 (20.8%) |
| Total (Overall) | 192 (55.0%) | 157 (45.0%) |
Employment Industries by Sex in Avon
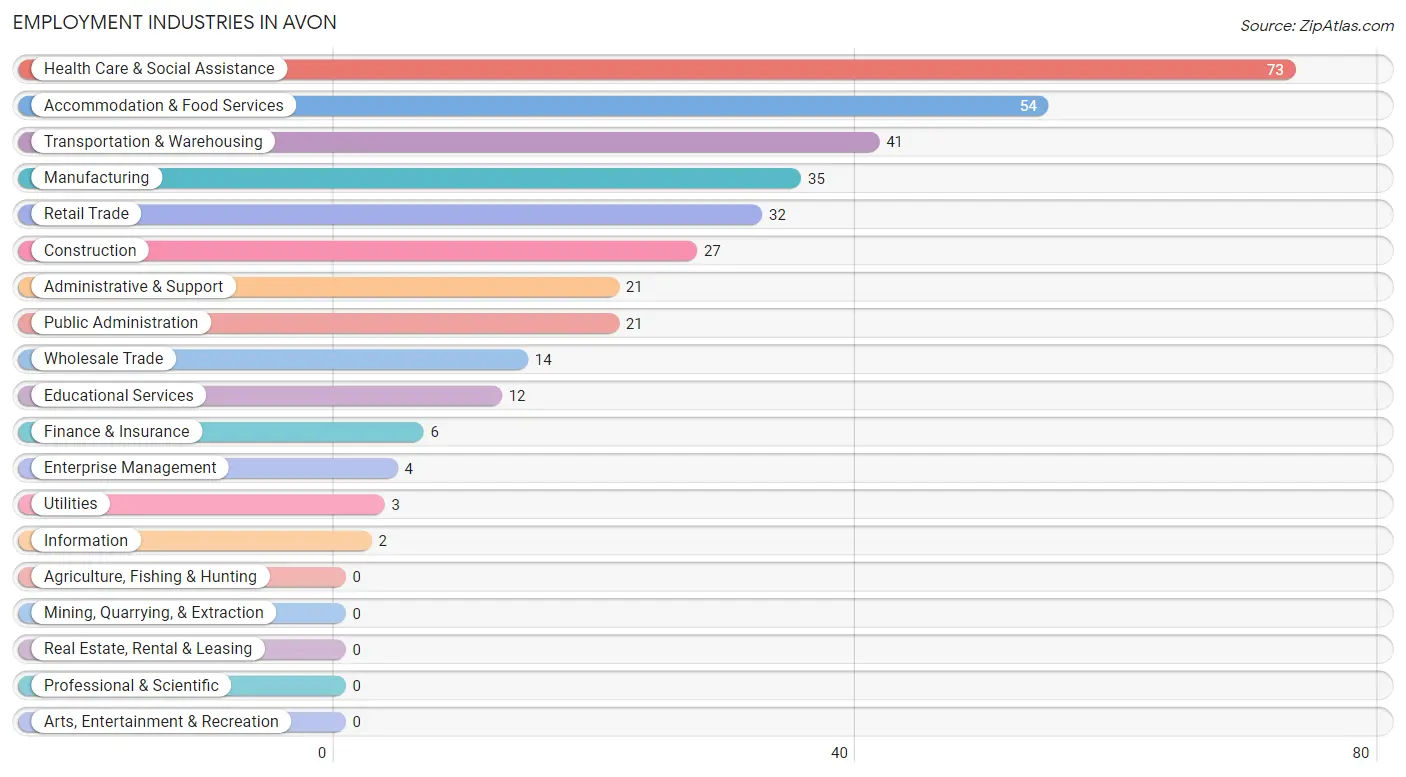
Employment Industries in Avon
The major employment industries in Avon include Health Care & Social Assistance (73 | 20.9%), Accommodation & Food Services (54 | 15.5%), Transportation & Warehousing (41 | 11.7%), Manufacturing (35 | 10.0%), and Retail Trade (32 | 9.2%).
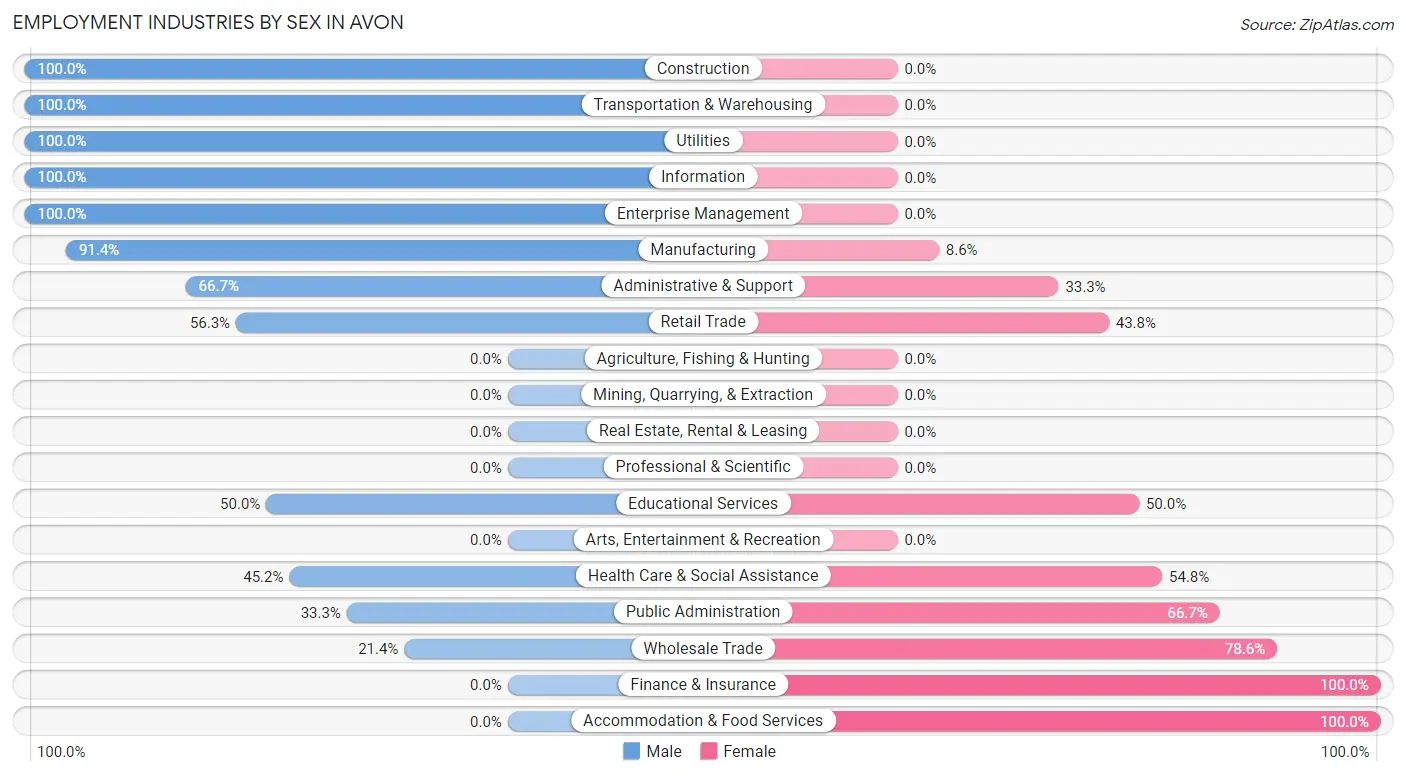
Employment Industries by Sex in Avon
The Avon industries that see more men than women are Construction (100.0%), Transportation & Warehousing (100.0%), and Utilities (100.0%), whereas the industries that tend to have a higher number of women are Finance & Insurance (100.0%), Accommodation & Food Services (100.0%), and Wholesale Trade (78.6%).
| Industry | Male | Female |
| Agriculture, Fishing & Hunting | 0 (0.0%) | 0 (0.0%) |
| Mining, Quarrying, & Extraction | 0 (0.0%) | 0 (0.0%) |
| Construction | 27 (100.0%) | 0 (0.0%) |
| Manufacturing | 32 (91.4%) | 3 (8.6%) |
| Wholesale Trade | 3 (21.4%) | 11 (78.6%) |
| Retail Trade | 18 (56.2%) | 14 (43.8%) |
| Transportation & Warehousing | 41 (100.0%) | 0 (0.0%) |
| Utilities | 3 (100.0%) | 0 (0.0%) |
| Information | 2 (100.0%) | 0 (0.0%) |
| Finance & Insurance | 0 (0.0%) | 6 (100.0%) |
| Real Estate, Rental & Leasing | 0 (0.0%) | 0 (0.0%) |
| Professional & Scientific | 0 (0.0%) | 0 (0.0%) |
| Enterprise Management | 4 (100.0%) | 0 (0.0%) |
| Administrative & Support | 14 (66.7%) | 7 (33.3%) |
| Educational Services | 6 (50.0%) | 6 (50.0%) |
| Health Care & Social Assistance | 33 (45.2%) | 40 (54.8%) |
| Arts, Entertainment & Recreation | 0 (0.0%) | 0 (0.0%) |
| Accommodation & Food Services | 0 (0.0%) | 54 (100.0%) |
| Public Administration | 7 (33.3%) | 14 (66.7%) |
| Total | 192 (55.0%) | 157 (45.0%) |
Education in Avon
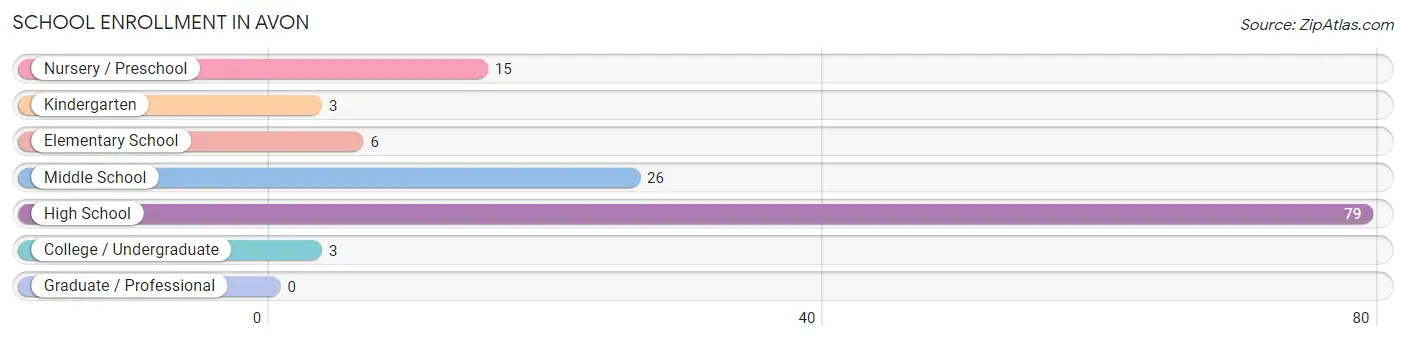
School Enrollment in Avon
The most common levels of schooling among the 132 students in Avon are high school (79 | 59.9%), middle school (26 | 19.7%), and nursery / preschool (15 | 11.4%).
| School Level | # Students | % Students |
| Nursery / Preschool | 15 | 11.4% |
| Kindergarten | 3 | 2.3% |
| Elementary School | 6 | 4.5% |
| Middle School | 26 | 19.7% |
| High School | 79 | 59.9% |
| College / Undergraduate | 3 | 2.3% |
| Graduate / Professional | 0 | 0.0% |
| Total | 132 | 100.0% |
School Enrollment by Age by Funding Source in Avon
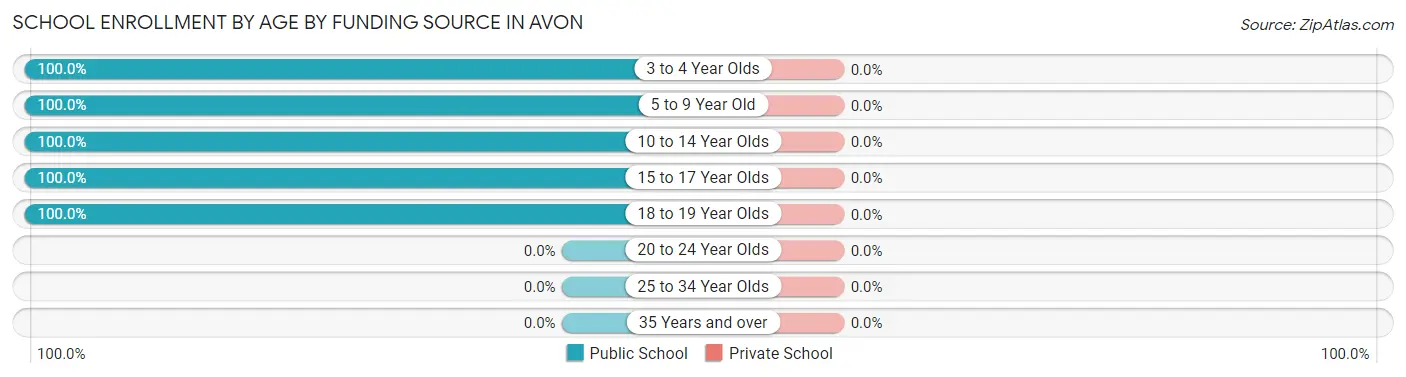
| Age Bracket | Public School | Private School |
| 3 to 4 Year Olds | 15 (100.0%) | 0 (0.0%) |
| 5 to 9 Year Old | 9 (100.0%) | 0 (0.0%) |
| 10 to 14 Year Olds | 26 (100.0%) | 0 (0.0%) |
| 15 to 17 Year Olds | 79 (100.0%) | 0 (0.0%) |
| 18 to 19 Year Olds | 3 (100.0%) | 0 (0.0%) |
| 20 to 24 Year Olds | 0 (0.0%) | 0 (0.0%) |
| 25 to 34 Year Olds | 0 (0.0%) | 0 (0.0%) |
| 35 Years and over | 0 (0.0%) | 0 (0.0%) |
| Total | 132 (100.0%) | 0 (0.0%) |
Educational Attainment by Field of Study in Avon
Business (17 | 46.0%), education (11 | 29.7%), arts & humanities (6 | 16.2%), and engineering (3 | 8.1%) are the most common fields of study among 37 individuals in Avon who have obtained a bachelor's degree or higher.
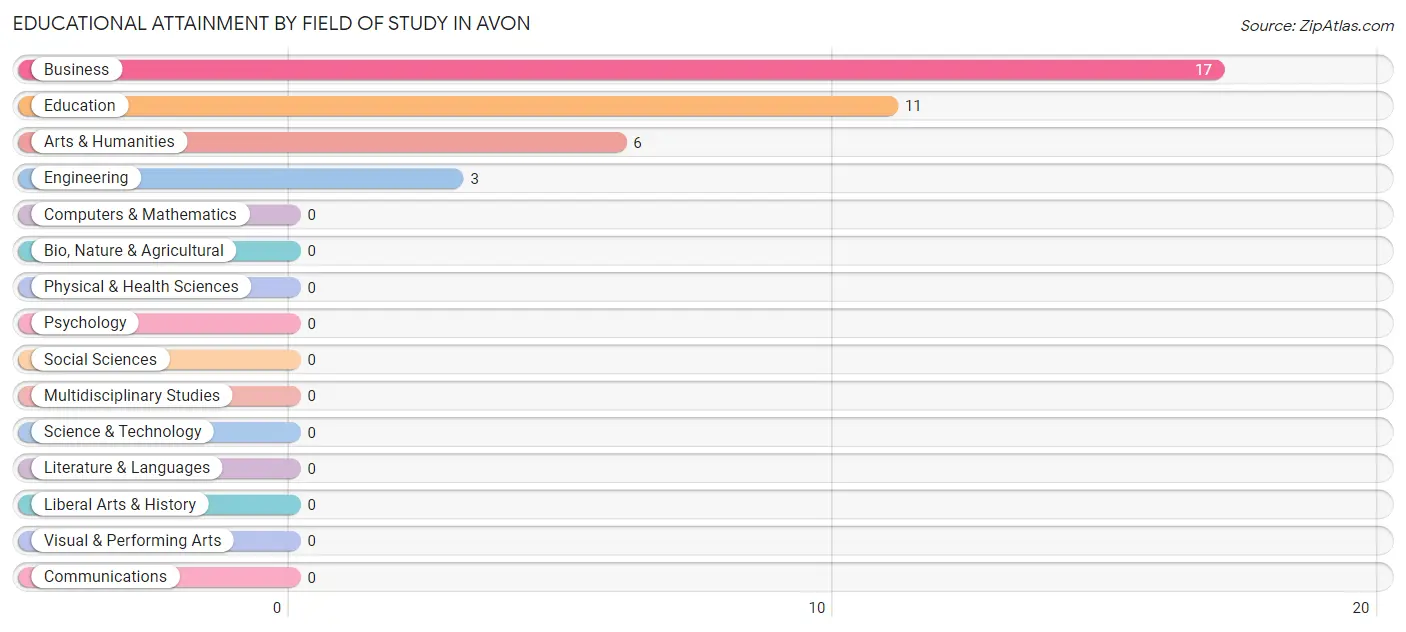
| Field of Study | # Graduates | % Graduates |
| Computers & Mathematics | 0 | 0.0% |
| Bio, Nature & Agricultural | 0 | 0.0% |
| Physical & Health Sciences | 0 | 0.0% |
| Psychology | 0 | 0.0% |
| Social Sciences | 0 | 0.0% |
| Engineering | 3 | 8.1% |
| Multidisciplinary Studies | 0 | 0.0% |
| Science & Technology | 0 | 0.0% |
| Business | 17 | 46.0% |
| Education | 11 | 29.7% |
| Literature & Languages | 0 | 0.0% |
| Liberal Arts & History | 0 | 0.0% |
| Visual & Performing Arts | 0 | 0.0% |
| Communications | 0 | 0.0% |
| Arts & Humanities | 6 | 16.2% |
| Total | 37 | 100.0% |
Transportation & Commute in Avon
Vehicle Availability by Sex in Avon
The most prevalent vehicle ownership categories in Avon are males with 3 vehicles (78, accounting for 40.6%) and females with 3 vehicles (76, making up 49.7%).
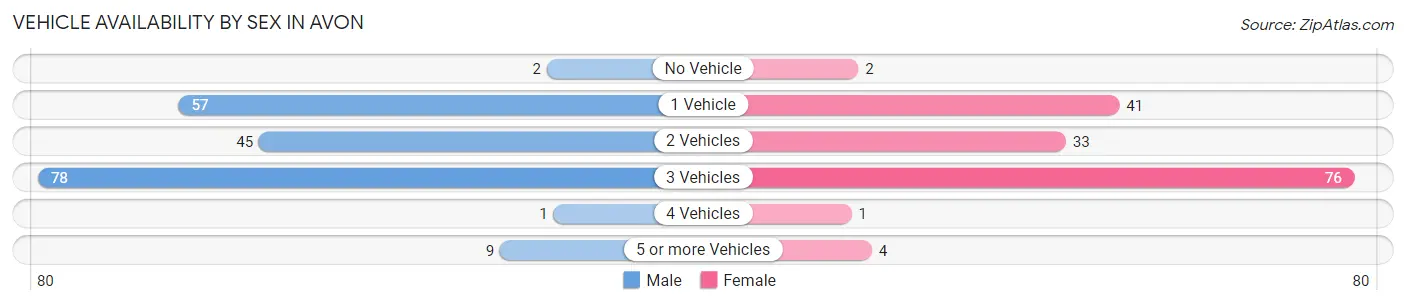
| Vehicles Available | Male | Female |
| No Vehicle | 2 (1.0%) | 2 (1.3%) |
| 1 Vehicle | 57 (29.7%) | 41 (26.1%) |
| 2 Vehicles | 45 (23.4%) | 33 (21.0%) |
| 3 Vehicles | 78 (40.6%) | 76 (48.4%) |
| 4 Vehicles | 1 (0.5%) | 1 (0.6%) |
| 5 or more Vehicles | 9 (4.7%) | 4 (2.5%) |
| Total | 192 (100.0%) | 157 (100.0%) |
Commute Time in Avon
The most frequently occuring commute durations in Avon are 30 to 34 minutes (83 commuters, 24.3%), less than 5 minutes (78 commuters, 22.9%), and 15 to 19 minutes (33 commuters, 9.7%).
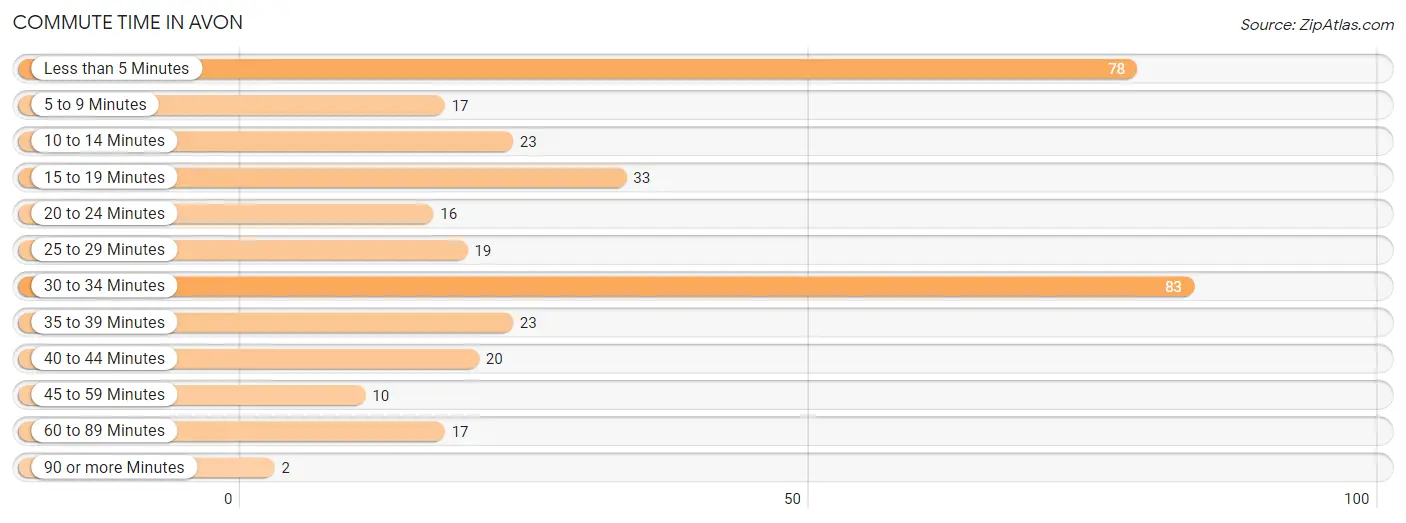
| Commute Time | # Commuters | % Commuters |
| Less than 5 Minutes | 78 | 22.9% |
| 5 to 9 Minutes | 17 | 5.0% |
| 10 to 14 Minutes | 23 | 6.7% |
| 15 to 19 Minutes | 33 | 9.7% |
| 20 to 24 Minutes | 16 | 4.7% |
| 25 to 29 Minutes | 19 | 5.6% |
| 30 to 34 Minutes | 83 | 24.3% |
| 35 to 39 Minutes | 23 | 6.7% |
| 40 to 44 Minutes | 20 | 5.9% |
| 45 to 59 Minutes | 10 | 2.9% |
| 60 to 89 Minutes | 17 | 5.0% |
| 90 or more Minutes | 2 | 0.6% |
Commute Time by Sex in Avon
The most common commute times in Avon are 30 to 34 minutes (54 commuters, 28.6%) for males and less than 5 minutes (66 commuters, 43.4%) for females.
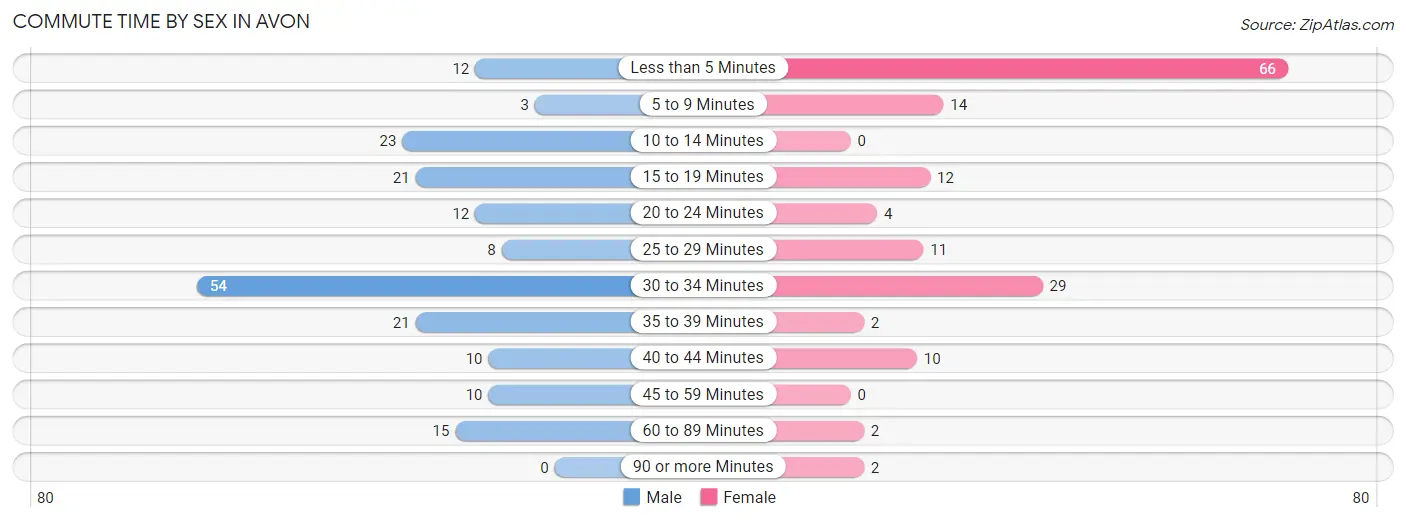
| Commute Time | Male | Female |
| Less than 5 Minutes | 12 (6.4%) | 66 (43.4%) |
| 5 to 9 Minutes | 3 (1.6%) | 14 (9.2%) |
| 10 to 14 Minutes | 23 (12.2%) | 0 (0.0%) |
| 15 to 19 Minutes | 21 (11.1%) | 12 (7.9%) |
| 20 to 24 Minutes | 12 (6.4%) | 4 (2.6%) |
| 25 to 29 Minutes | 8 (4.2%) | 11 (7.2%) |
| 30 to 34 Minutes | 54 (28.6%) | 29 (19.1%) |
| 35 to 39 Minutes | 21 (11.1%) | 2 (1.3%) |
| 40 to 44 Minutes | 10 (5.3%) | 10 (6.6%) |
| 45 to 59 Minutes | 10 (5.3%) | 0 (0.0%) |
| 60 to 89 Minutes | 15 (7.9%) | 2 (1.3%) |
| 90 or more Minutes | 0 (0.0%) | 2 (1.3%) |
Time of Departure to Work by Sex in Avon
The most frequent times of departure to work in Avon are 12:00 PM to 3:59 PM (36, 19.1%) for males and 5:30 AM to 5:59 AM (41, 27.0%) for females.
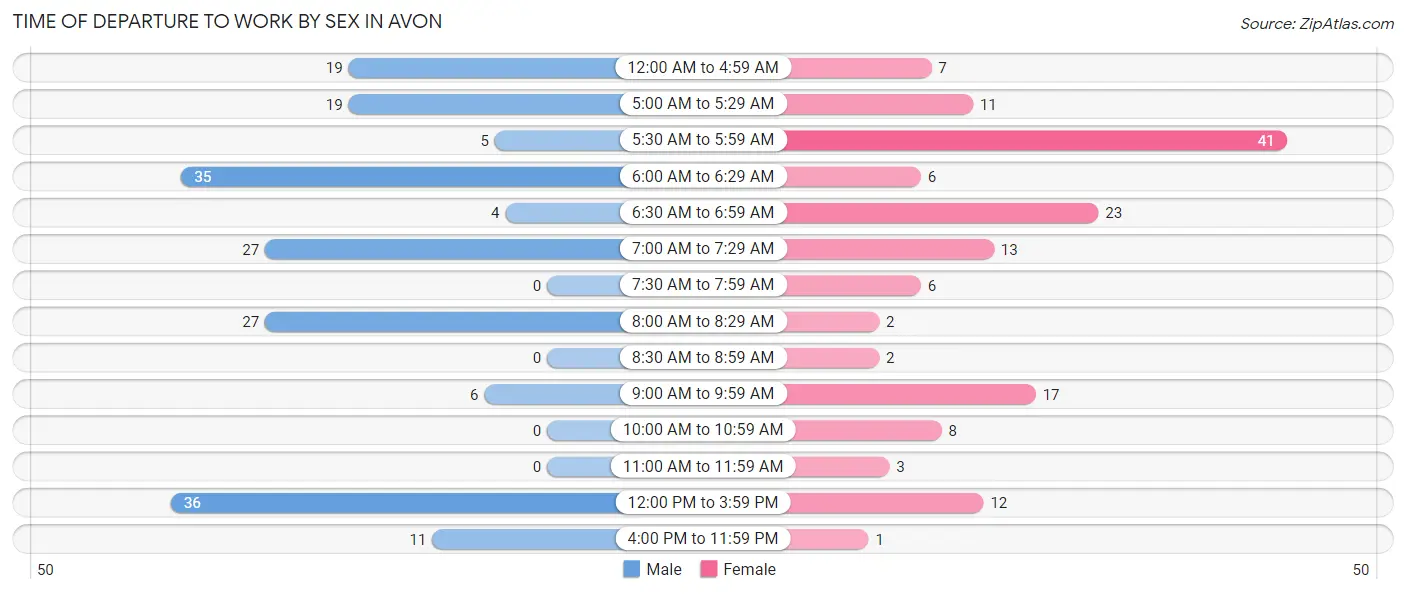
| Time of Departure | Male | Female |
| 12:00 AM to 4:59 AM | 19 (10.1%) | 7 (4.6%) |
| 5:00 AM to 5:29 AM | 19 (10.1%) | 11 (7.2%) |
| 5:30 AM to 5:59 AM | 5 (2.6%) | 41 (27.0%) |
| 6:00 AM to 6:29 AM | 35 (18.5%) | 6 (4.0%) |
| 6:30 AM to 6:59 AM | 4 (2.1%) | 23 (15.1%) |
| 7:00 AM to 7:29 AM | 27 (14.3%) | 13 (8.6%) |
| 7:30 AM to 7:59 AM | 0 (0.0%) | 6 (4.0%) |
| 8:00 AM to 8:29 AM | 27 (14.3%) | 2 (1.3%) |
| 8:30 AM to 8:59 AM | 0 (0.0%) | 2 (1.3%) |
| 9:00 AM to 9:59 AM | 6 (3.2%) | 17 (11.2%) |
| 10:00 AM to 10:59 AM | 0 (0.0%) | 8 (5.3%) |
| 11:00 AM to 11:59 AM | 0 (0.0%) | 3 (2.0%) |
| 12:00 PM to 3:59 PM | 36 (19.1%) | 12 (7.9%) |
| 4:00 PM to 11:59 PM | 11 (5.8%) | 1 (0.7%) |
| Total | 189 (100.0%) | 152 (100.0%) |
Housing Occupancy in Avon
Occupancy by Ownership in Avon
Of the total 290 dwellings in Avon, owner-occupied units account for 243 (83.8%), while renter-occupied units make up 47 (16.2%).
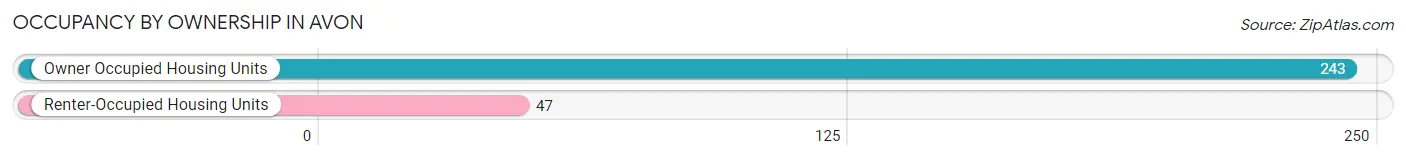
| Occupancy | # Housing Units | % Housing Units |
| Owner Occupied Housing Units | 243 | 83.8% |
| Renter-Occupied Housing Units | 47 | 16.2% |
| Total Occupied Housing Units | 290 | 100.0% |
Occupancy by Household Size in Avon
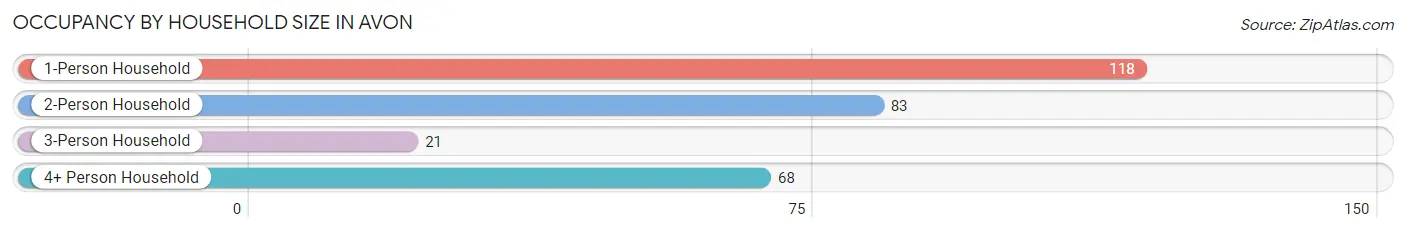
| Household Size | # Housing Units | % Housing Units |
| 1-Person Household | 118 | 40.7% |
| 2-Person Household | 83 | 28.6% |
| 3-Person Household | 21 | 7.2% |
| 4+ Person Household | 68 | 23.4% |
| Total Housing Units | 290 | 100.0% |
Occupancy by Ownership by Household Size in Avon
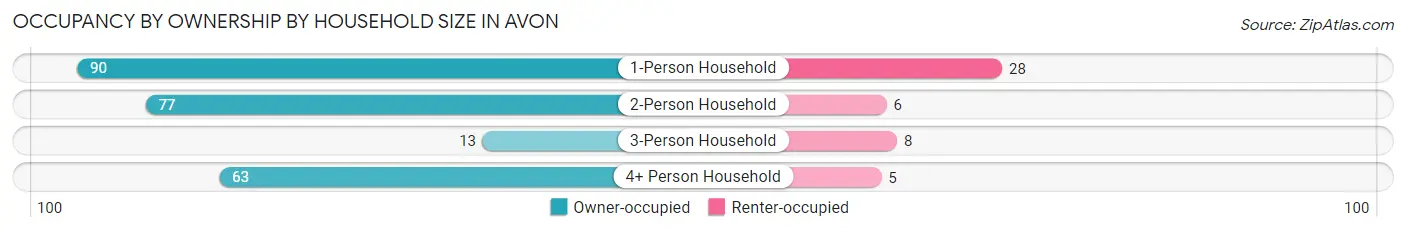
| Household Size | Owner-occupied | Renter-occupied |
| 1-Person Household | 90 (76.3%) | 28 (23.7%) |
| 2-Person Household | 77 (92.8%) | 6 (7.2%) |
| 3-Person Household | 13 (61.9%) | 8 (38.1%) |
| 4+ Person Household | 63 (92.6%) | 5 (7.3%) |
| Total Housing Units | 243 (83.8%) | 47 (16.2%) |
Occupancy by Educational Attainment in Avon
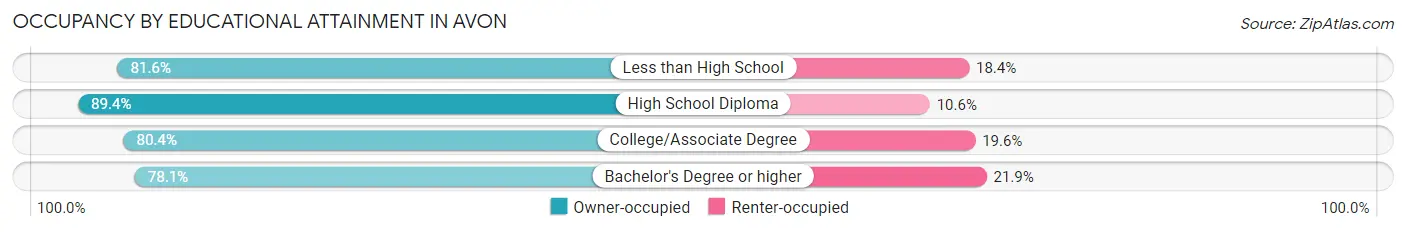
| Household Size | Owner-occupied | Renter-occupied |
| Less than High School | 31 (81.6%) | 7 (18.4%) |
| High School Diploma | 101 (89.4%) | 12 (10.6%) |
| College/Associate Degree | 86 (80.4%) | 21 (19.6%) |
| Bachelor's Degree or higher | 25 (78.1%) | 7 (21.9%) |
Occupancy by Age of Householder in Avon
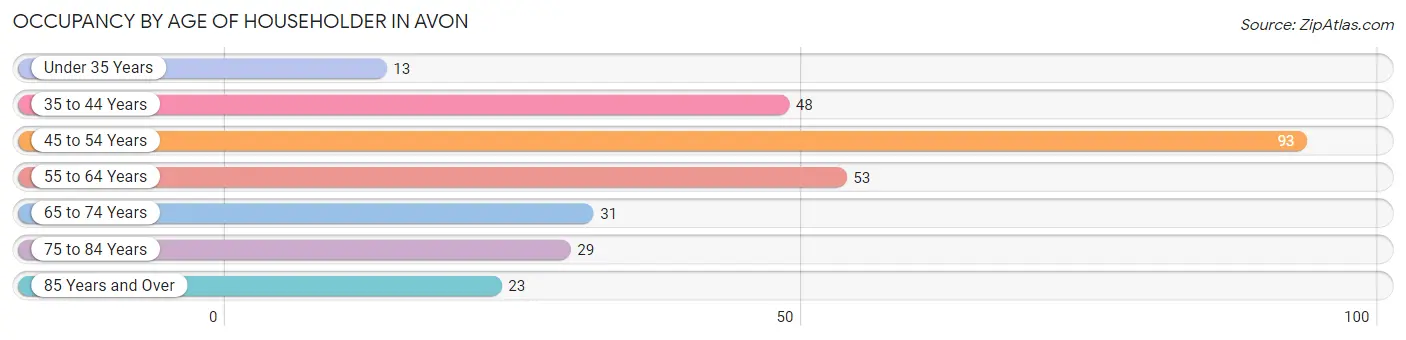
| Age Bracket | # Households | % Households |
| Under 35 Years | 13 | 4.5% |
| 35 to 44 Years | 48 | 16.6% |
| 45 to 54 Years | 93 | 32.1% |
| 55 to 64 Years | 53 | 18.3% |
| 65 to 74 Years | 31 | 10.7% |
| 75 to 84 Years | 29 | 10.0% |
| 85 Years and Over | 23 | 7.9% |
| Total | 290 | 100.0% |
Housing Finances in Avon
Median Income by Occupancy in Avon
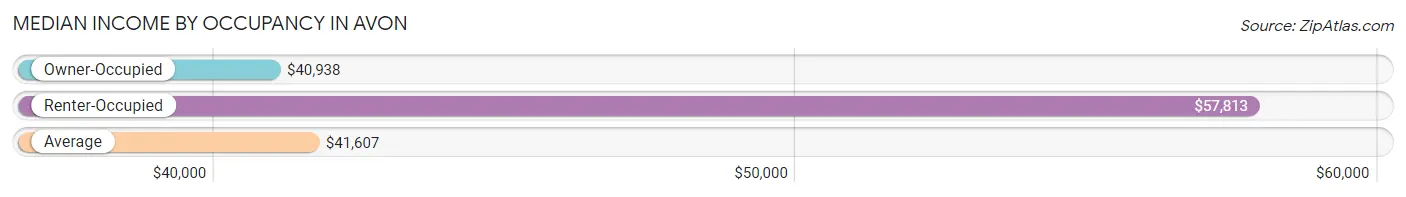
| Occupancy Type | # Households | Median Income |
| Owner-Occupied | 243 (83.8%) | $40,938 |
| Renter-Occupied | 47 (16.2%) | $57,813 |
| Average | 290 (100.0%) | $41,607 |
Occupancy by Householder Income Bracket in Avon
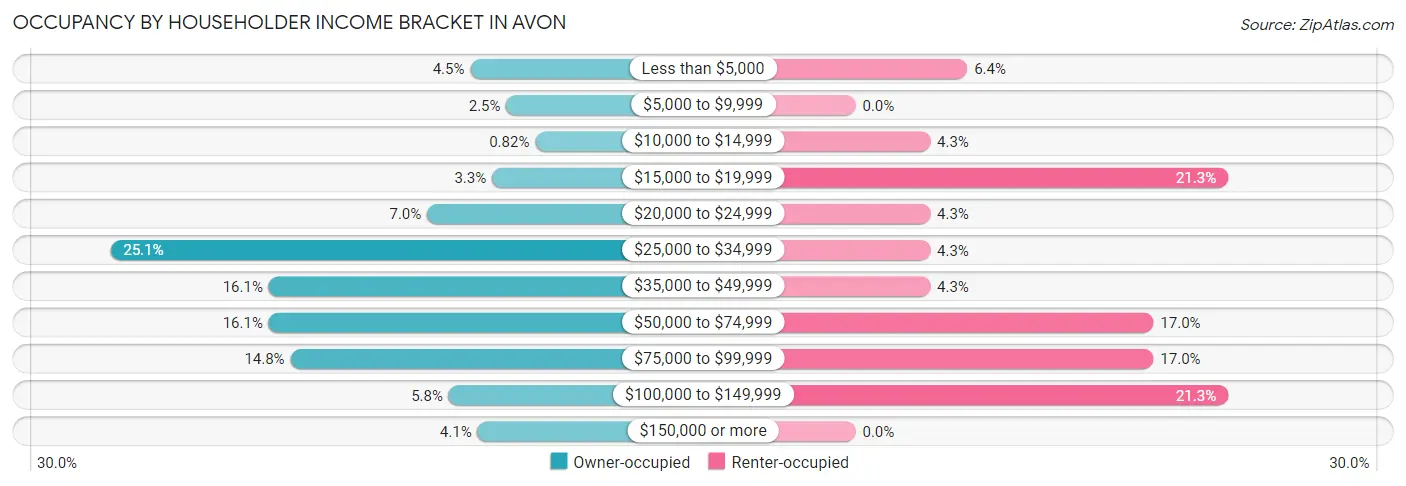
| Income Bracket | Owner-occupied | Renter-occupied |
| Less than $5,000 | 11 (4.5%) | 3 (6.4%) |
| $5,000 to $9,999 | 6 (2.5%) | 0 (0.0%) |
| $10,000 to $14,999 | 2 (0.8%) | 2 (4.3%) |
| $15,000 to $19,999 | 8 (3.3%) | 10 (21.3%) |
| $20,000 to $24,999 | 17 (7.0%) | 2 (4.3%) |
| $25,000 to $34,999 | 61 (25.1%) | 2 (4.3%) |
| $35,000 to $49,999 | 39 (16.1%) | 2 (4.3%) |
| $50,000 to $74,999 | 39 (16.1%) | 8 (17.0%) |
| $75,000 to $99,999 | 36 (14.8%) | 8 (17.0%) |
| $100,000 to $149,999 | 14 (5.8%) | 10 (21.3%) |
| $150,000 or more | 10 (4.1%) | 0 (0.0%) |
| Total | 243 (100.0%) | 47 (100.0%) |
Monthly Housing Cost Tiers in Avon
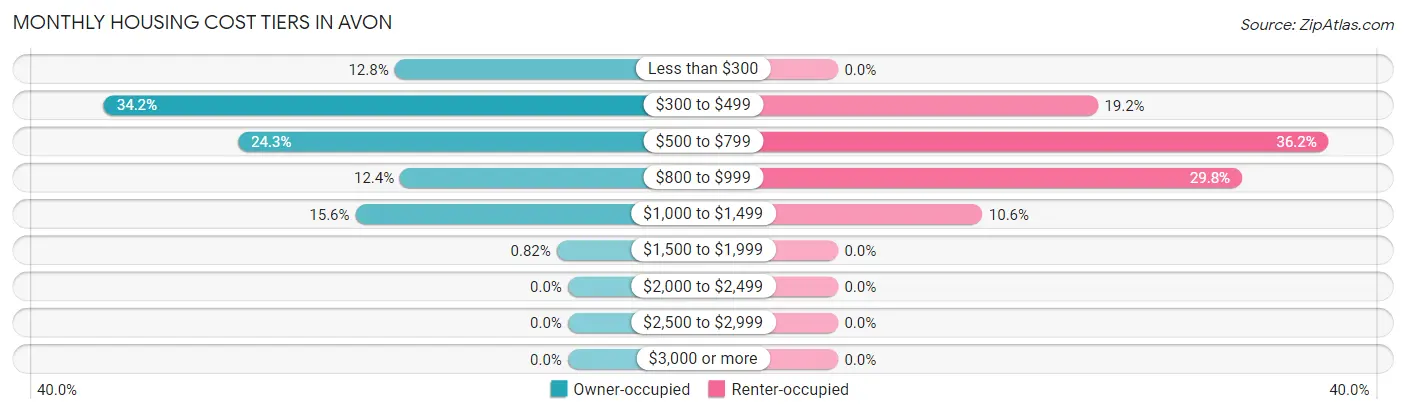
| Monthly Cost | Owner-occupied | Renter-occupied |
| Less than $300 | 31 (12.8%) | 0 (0.0%) |
| $300 to $499 | 83 (34.2%) | 9 (19.2%) |
| $500 to $799 | 59 (24.3%) | 17 (36.2%) |
| $800 to $999 | 30 (12.3%) | 14 (29.8%) |
| $1,000 to $1,499 | 38 (15.6%) | 5 (10.6%) |
| $1,500 to $1,999 | 2 (0.8%) | 0 (0.0%) |
| $2,000 to $2,499 | 0 (0.0%) | 0 (0.0%) |
| $2,500 to $2,999 | 0 (0.0%) | 0 (0.0%) |
| $3,000 or more | 0 (0.0%) | 0 (0.0%) |
| Total | 243 (100.0%) | 47 (100.0%) |
Physical Housing Characteristics in Avon
Housing Structures in Avon
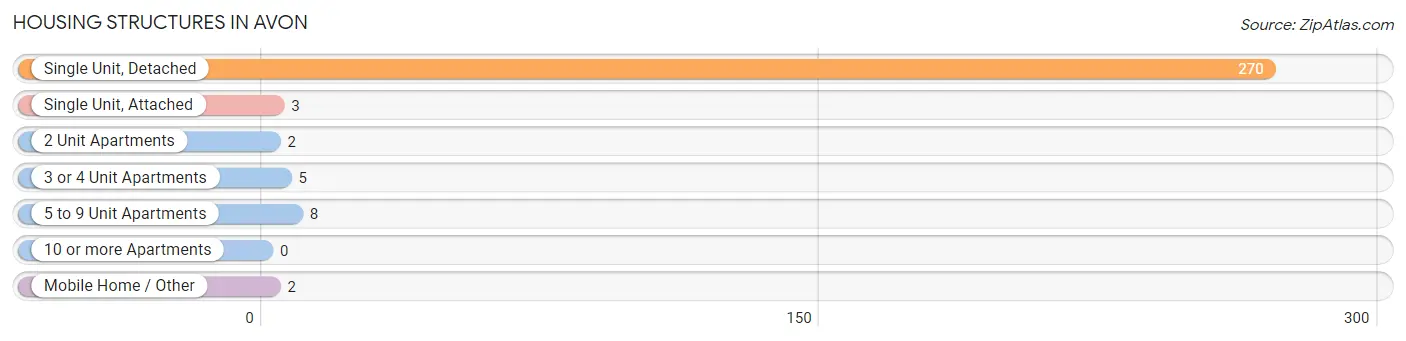
| Structure Type | # Housing Units | % Housing Units |
| Single Unit, Detached | 270 | 93.1% |
| Single Unit, Attached | 3 | 1.0% |
| 2 Unit Apartments | 2 | 0.7% |
| 3 or 4 Unit Apartments | 5 | 1.7% |
| 5 to 9 Unit Apartments | 8 | 2.8% |
| 10 or more Apartments | 0 | 0.0% |
| Mobile Home / Other | 2 | 0.7% |
| Total | 290 | 100.0% |
Housing Structures by Occupancy in Avon
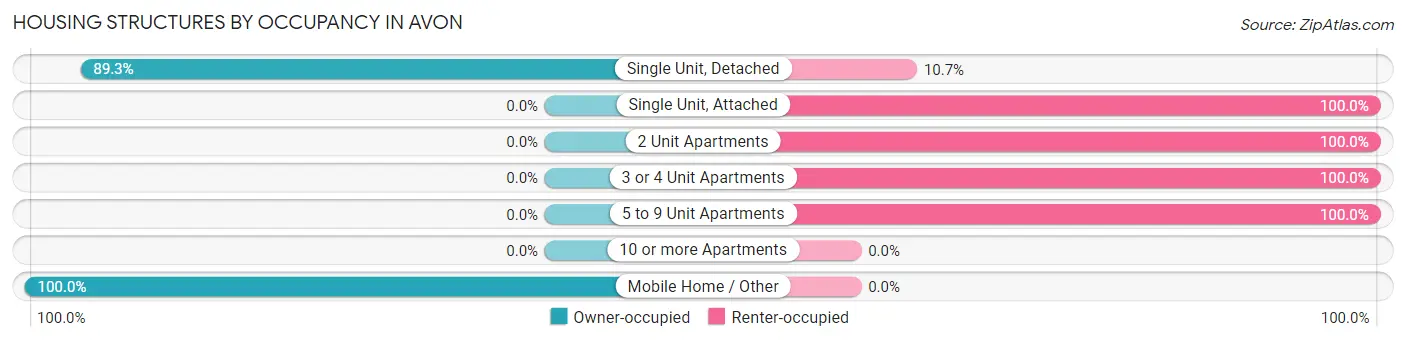
| Structure Type | Owner-occupied | Renter-occupied |
| Single Unit, Detached | 241 (89.3%) | 29 (10.7%) |
| Single Unit, Attached | 0 (0.0%) | 3 (100.0%) |
| 2 Unit Apartments | 0 (0.0%) | 2 (100.0%) |
| 3 or 4 Unit Apartments | 0 (0.0%) | 5 (100.0%) |
| 5 to 9 Unit Apartments | 0 (0.0%) | 8 (100.0%) |
| 10 or more Apartments | 0 (0.0%) | 0 (0.0%) |
| Mobile Home / Other | 2 (100.0%) | 0 (0.0%) |
| Total | 243 (83.8%) | 47 (16.2%) |
Housing Structures by Number of Rooms in Avon
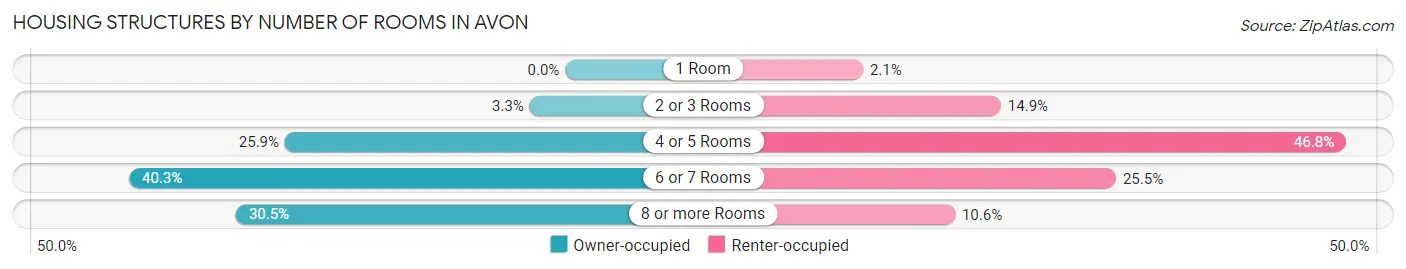
| Number of Rooms | Owner-occupied | Renter-occupied |
| 1 Room | 0 (0.0%) | 1 (2.1%) |
| 2 or 3 Rooms | 8 (3.3%) | 7 (14.9%) |
| 4 or 5 Rooms | 63 (25.9%) | 22 (46.8%) |
| 6 or 7 Rooms | 98 (40.3%) | 12 (25.5%) |
| 8 or more Rooms | 74 (30.4%) | 5 (10.6%) |
| Total | 243 (100.0%) | 47 (100.0%) |
Housing Structure by Heating Type in Avon
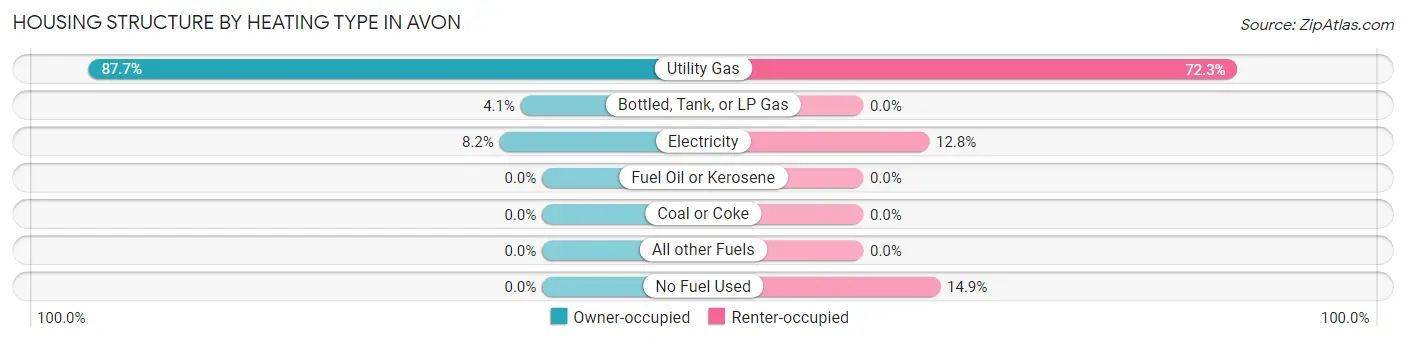
| Heating Type | Owner-occupied | Renter-occupied |
| Utility Gas | 213 (87.6%) | 34 (72.3%) |
| Bottled, Tank, or LP Gas | 10 (4.1%) | 0 (0.0%) |
| Electricity | 20 (8.2%) | 6 (12.8%) |
| Fuel Oil or Kerosene | 0 (0.0%) | 0 (0.0%) |
| Coal or Coke | 0 (0.0%) | 0 (0.0%) |
| All other Fuels | 0 (0.0%) | 0 (0.0%) |
| No Fuel Used | 0 (0.0%) | 7 (14.9%) |
| Total | 243 (100.0%) | 47 (100.0%) |
Household Vehicle Usage in Avon
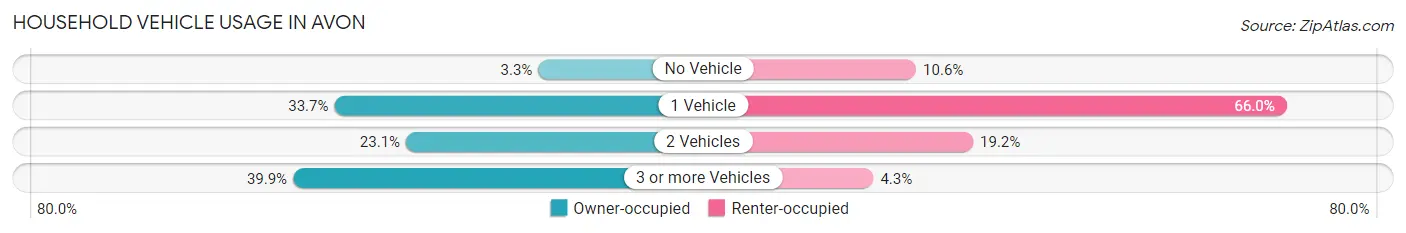
| Vehicles per Household | Owner-occupied | Renter-occupied |
| No Vehicle | 8 (3.3%) | 5 (10.6%) |
| 1 Vehicle | 82 (33.7%) | 31 (66.0%) |
| 2 Vehicles | 56 (23.1%) | 9 (19.2%) |
| 3 or more Vehicles | 97 (39.9%) | 2 (4.3%) |
| Total | 243 (100.0%) | 47 (100.0%) |
Real Estate & Mortgages in Avon
Real Estate and Mortgage Overview in Avon
| Characteristic | Without Mortgage | With Mortgage |
| Housing Units | 136 | 107 |
| Median Property Value | $34,100 | $72,500 |
| Median Household Income | $31,707 | $10 |
| Monthly Housing Costs | $378 | $0 |
| Real Estate Taxes | $914 | $0 |
Property Value by Mortgage Status in Avon
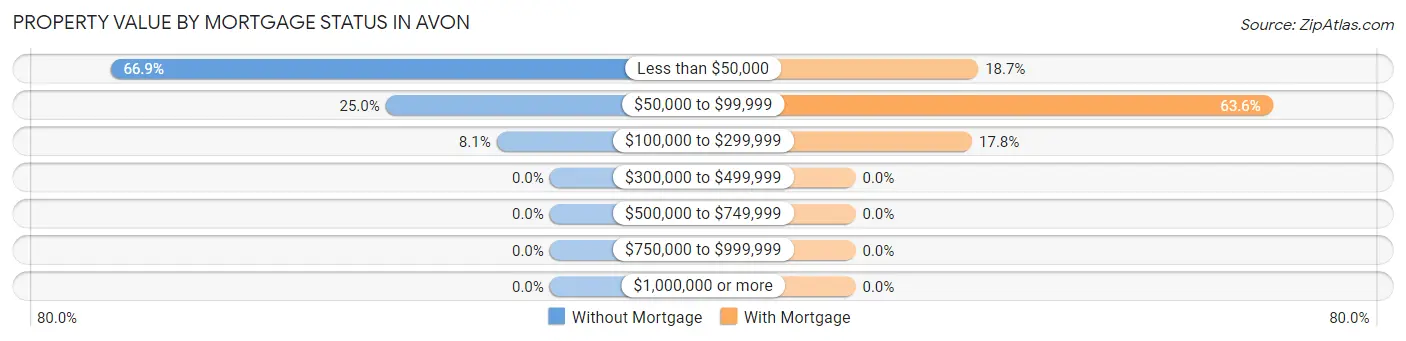
| Property Value | Without Mortgage | With Mortgage |
| Less than $50,000 | 91 (66.9%) | 20 (18.7%) |
| $50,000 to $99,999 | 34 (25.0%) | 68 (63.5%) |
| $100,000 to $299,999 | 11 (8.1%) | 19 (17.8%) |
| $300,000 to $499,999 | 0 (0.0%) | 0 (0.0%) |
| $500,000 to $749,999 | 0 (0.0%) | 0 (0.0%) |
| $750,000 to $999,999 | 0 (0.0%) | 0 (0.0%) |
| $1,000,000 or more | 0 (0.0%) | 0 (0.0%) |
| Total | 136 (100.0%) | 107 (100.0%) |
Household Income by Mortgage Status in Avon
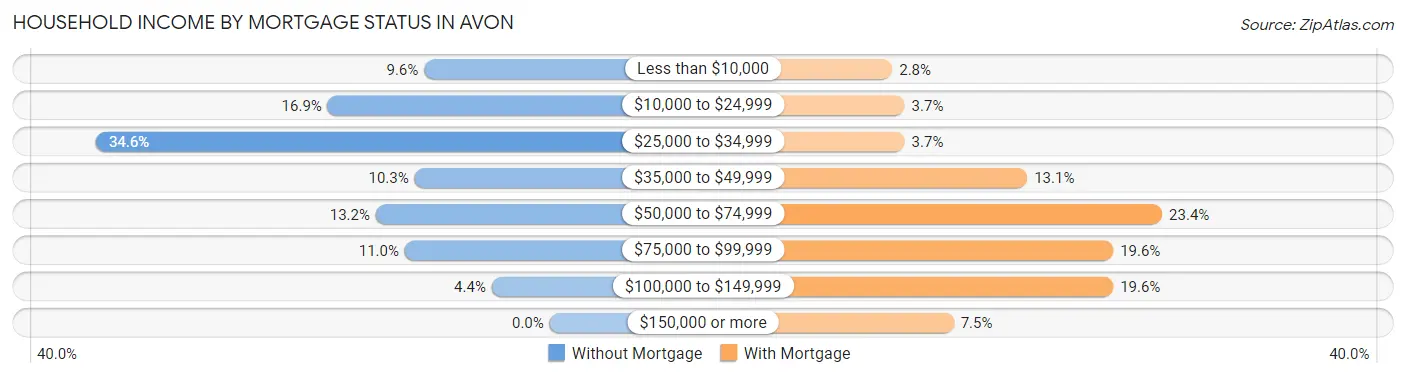
| Household Income | Without Mortgage | With Mortgage |
| Less than $10,000 | 13 (9.6%) | 3 (2.8%) |
| $10,000 to $24,999 | 23 (16.9%) | 4 (3.7%) |
| $25,000 to $34,999 | 47 (34.6%) | 4 (3.7%) |
| $35,000 to $49,999 | 14 (10.3%) | 14 (13.1%) |
| $50,000 to $74,999 | 18 (13.2%) | 25 (23.4%) |
| $75,000 to $99,999 | 15 (11.0%) | 21 (19.6%) |
| $100,000 to $149,999 | 6 (4.4%) | 21 (19.6%) |
| $150,000 or more | 0 (0.0%) | 8 (7.5%) |
| Total | 136 (100.0%) | 107 (100.0%) |
Property Value to Household Income Ratio in Avon
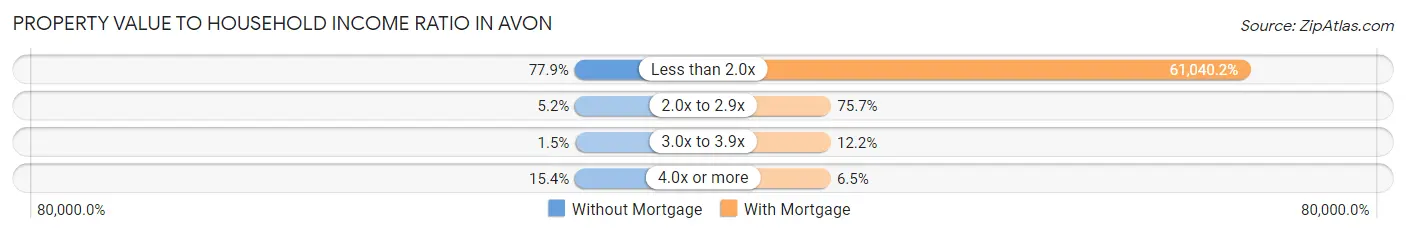
| Value-to-Income Ratio | Without Mortgage | With Mortgage |
| Less than 2.0x | 106 (77.9%) | 65,313 (61,040.2%) |
| 2.0x to 2.9x | 7 (5.1%) | 81 (75.7%) |
| 3.0x to 3.9x | 2 (1.5%) | 13 (12.1%) |
| 4.0x or more | 21 (15.4%) | 7 (6.5%) |
| Total | 136 (100.0%) | 107 (100.0%) |
Real Estate Taxes by Mortgage Status in Avon
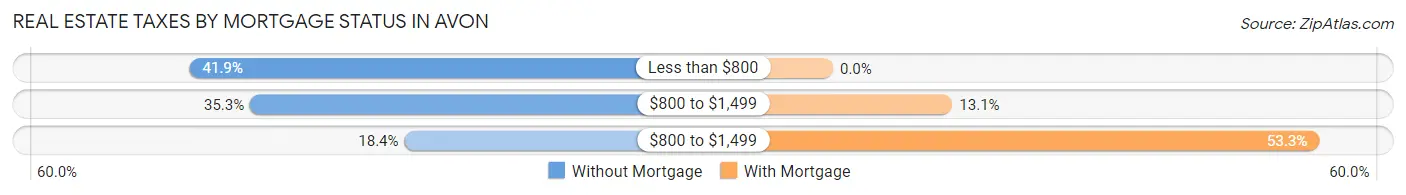
| Property Taxes | Without Mortgage | With Mortgage |
| Less than $800 | 57 (41.9%) | 0 (0.0%) |
| $800 to $1,499 | 48 (35.3%) | 14 (13.1%) |
| $800 to $1,499 | 25 (18.4%) | 57 (53.3%) |
| Total | 136 (100.0%) | 107 (100.0%) |
Health & Disability in Avon
Health Insurance Coverage by Age in Avon
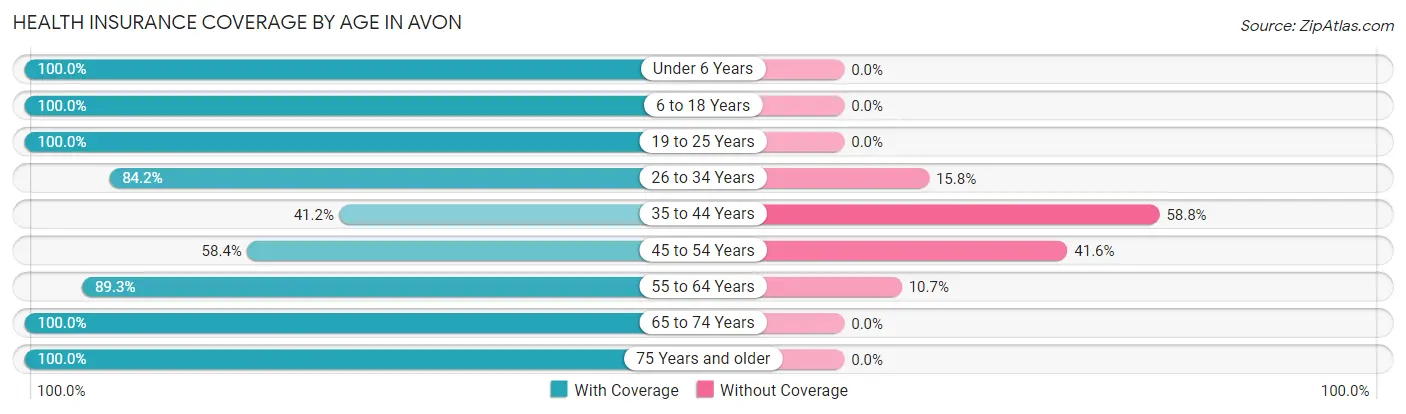
| Age Bracket | With Coverage | Without Coverage |
| Under 6 Years | 38 (100.0%) | 0 (0.0%) |
| 6 to 18 Years | 121 (100.0%) | 0 (0.0%) |
| 19 to 25 Years | 24 (100.0%) | 0 (0.0%) |
| 26 to 34 Years | 16 (84.2%) | 3 (15.8%) |
| 35 to 44 Years | 47 (41.2%) | 67 (58.8%) |
| 45 to 54 Years | 73 (58.4%) | 52 (41.6%) |
| 55 to 64 Years | 75 (89.3%) | 9 (10.7%) |
| 65 to 74 Years | 36 (100.0%) | 0 (0.0%) |
| 75 Years and older | 66 (100.0%) | 0 (0.0%) |
| Total | 496 (79.1%) | 131 (20.9%) |
Health Insurance Coverage by Citizenship Status in Avon
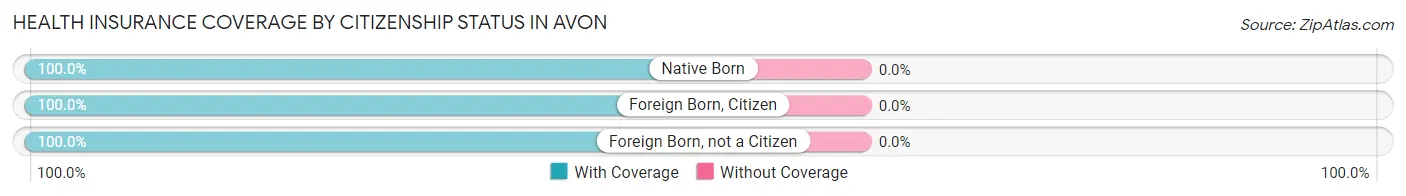
| Citizenship Status | With Coverage | Without Coverage |
| Native Born | 38 (100.0%) | 0 (0.0%) |
| Foreign Born, Citizen | 121 (100.0%) | 0 (0.0%) |
| Foreign Born, not a Citizen | 24 (100.0%) | 0 (0.0%) |
Health Insurance Coverage by Household Income in Avon
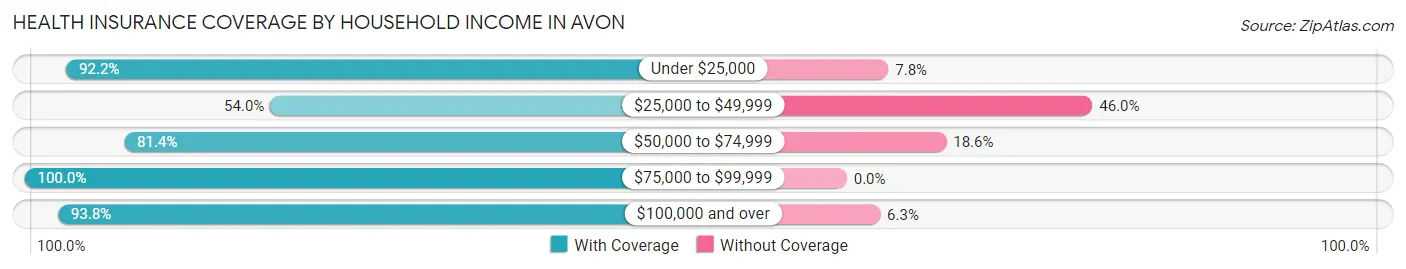
| Household Income | With Coverage | Without Coverage |
| Under $25,000 | 71 (92.2%) | 6 (7.8%) |
| $25,000 to $49,999 | 115 (54.0%) | 98 (46.0%) |
| $50,000 to $74,999 | 96 (81.4%) | 22 (18.6%) |
| $75,000 to $99,999 | 139 (100.0%) | 0 (0.0%) |
| $100,000 and over | 75 (93.8%) | 5 (6.2%) |
Public vs Private Health Insurance Coverage by Age in Avon
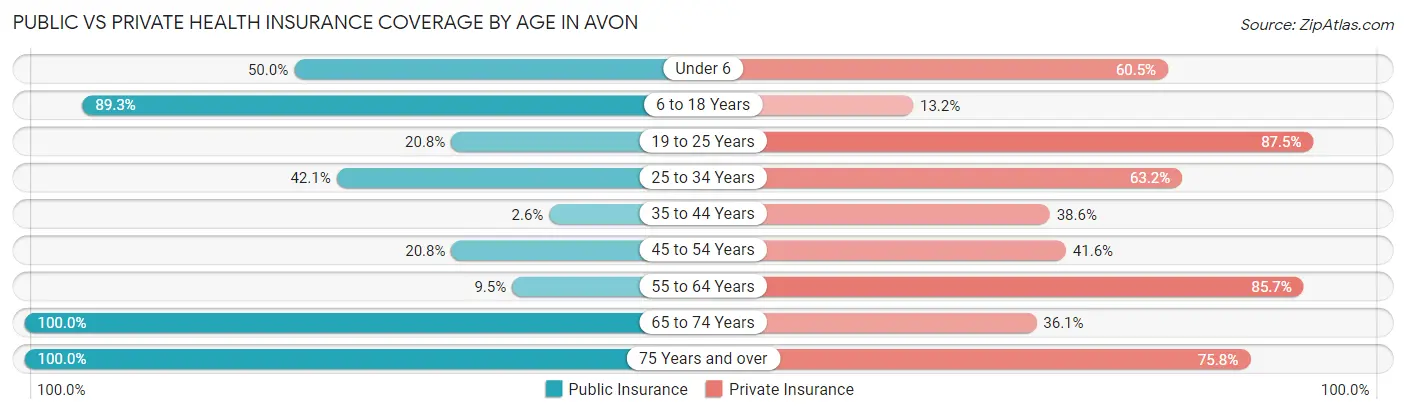
| Age Bracket | Public Insurance | Private Insurance |
| Under 6 | 19 (50.0%) | 23 (60.5%) |
| 6 to 18 Years | 108 (89.3%) | 16 (13.2%) |
| 19 to 25 Years | 5 (20.8%) | 21 (87.5%) |
| 25 to 34 Years | 8 (42.1%) | 12 (63.2%) |
| 35 to 44 Years | 3 (2.6%) | 44 (38.6%) |
| 45 to 54 Years | 26 (20.8%) | 52 (41.6%) |
| 55 to 64 Years | 8 (9.5%) | 72 (85.7%) |
| 65 to 74 Years | 36 (100.0%) | 13 (36.1%) |
| 75 Years and over | 66 (100.0%) | 50 (75.8%) |
| Total | 279 (44.5%) | 303 (48.3%) |
Disability Status by Sex by Age in Avon
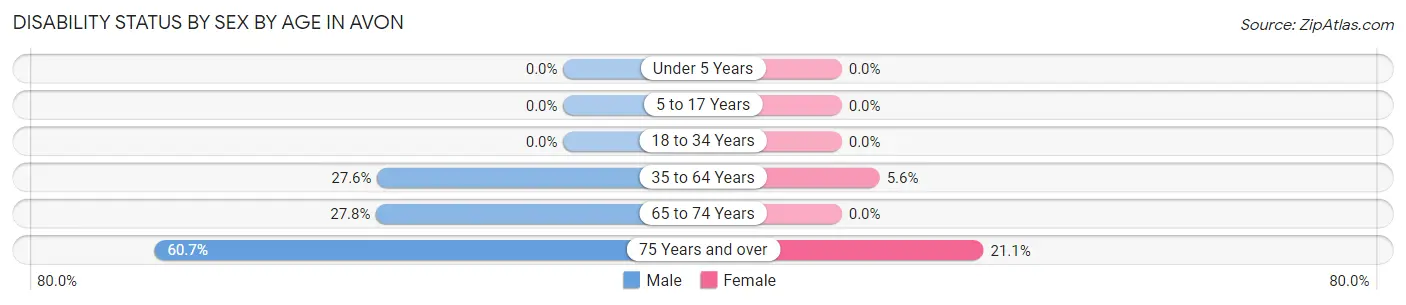
| Age Bracket | Male | Female |
| Under 5 Years | 0 (0.0%) | 0 (0.0%) |
| 5 to 17 Years | 0 (0.0%) | 0 (0.0%) |
| 18 to 34 Years | 0 (0.0%) | 0 (0.0%) |
| 35 to 64 Years | 50 (27.6%) | 8 (5.6%) |
| 65 to 74 Years | 5 (27.8%) | 0 (0.0%) |
| 75 Years and over | 17 (60.7%) | 8 (21.0%) |
Disability Class by Sex by Age in Avon
Disability Class: Hearing Difficulty
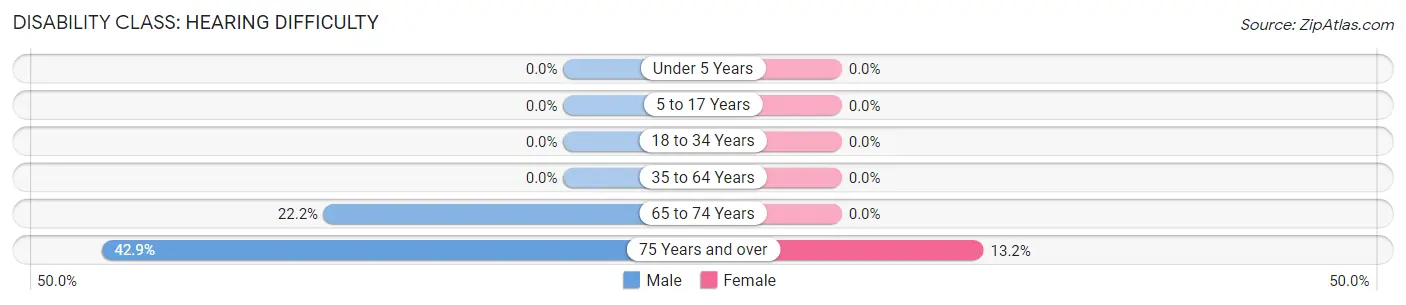
| Age Bracket | Male | Female |
| Under 5 Years | 0 (0.0%) | 0 (0.0%) |
| 5 to 17 Years | 0 (0.0%) | 0 (0.0%) |
| 18 to 34 Years | 0 (0.0%) | 0 (0.0%) |
| 35 to 64 Years | 0 (0.0%) | 0 (0.0%) |
| 65 to 74 Years | 4 (22.2%) | 0 (0.0%) |
| 75 Years and over | 12 (42.9%) | 5 (13.2%) |
Disability Class: Vision Difficulty
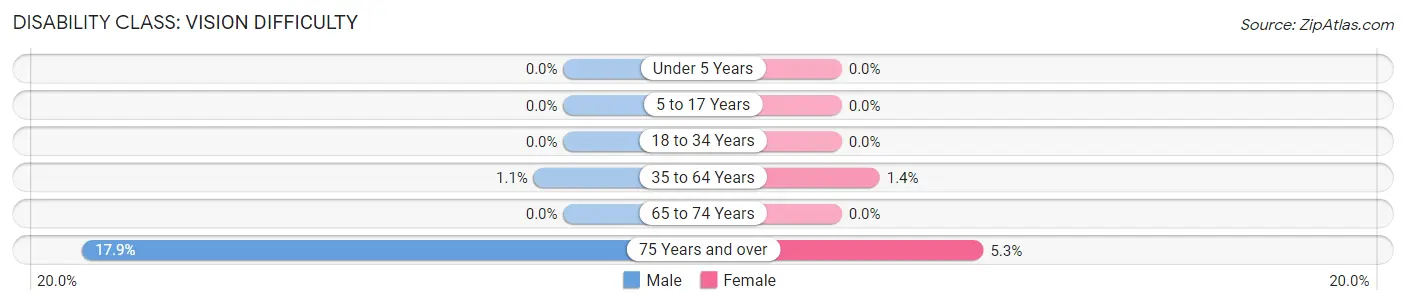
| Age Bracket | Male | Female |
| Under 5 Years | 0 (0.0%) | 0 (0.0%) |
| 5 to 17 Years | 0 (0.0%) | 0 (0.0%) |
| 18 to 34 Years | 0 (0.0%) | 0 (0.0%) |
| 35 to 64 Years | 2 (1.1%) | 2 (1.4%) |
| 65 to 74 Years | 0 (0.0%) | 0 (0.0%) |
| 75 Years and over | 5 (17.9%) | 2 (5.3%) |
Disability Class: Cognitive Difficulty
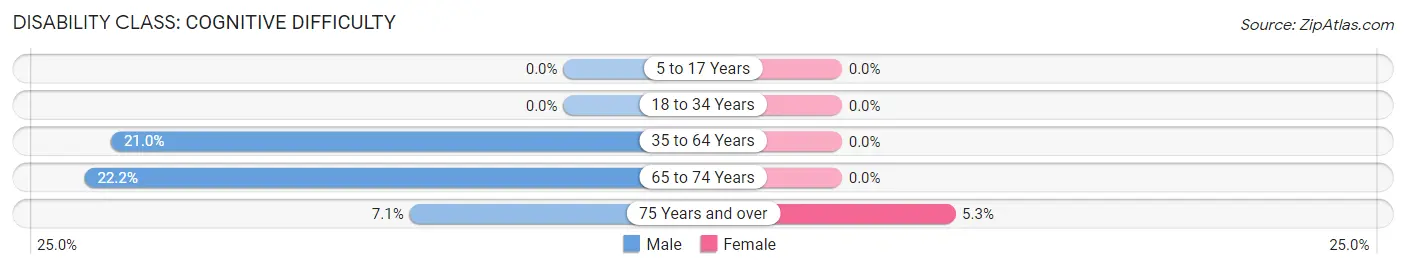
| Age Bracket | Male | Female |
| 5 to 17 Years | 0 (0.0%) | 0 (0.0%) |
| 18 to 34 Years | 0 (0.0%) | 0 (0.0%) |
| 35 to 64 Years | 38 (21.0%) | 0 (0.0%) |
| 65 to 74 Years | 4 (22.2%) | 0 (0.0%) |
| 75 Years and over | 2 (7.1%) | 2 (5.3%) |
Disability Class: Ambulatory Difficulty
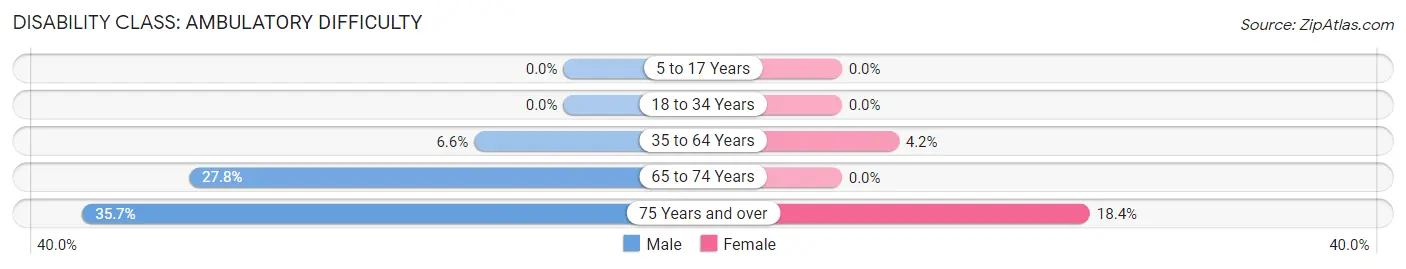
| Age Bracket | Male | Female |
| 5 to 17 Years | 0 (0.0%) | 0 (0.0%) |
| 18 to 34 Years | 0 (0.0%) | 0 (0.0%) |
| 35 to 64 Years | 12 (6.6%) | 6 (4.2%) |
| 65 to 74 Years | 5 (27.8%) | 0 (0.0%) |
| 75 Years and over | 10 (35.7%) | 7 (18.4%) |
Disability Class: Self-Care Difficulty
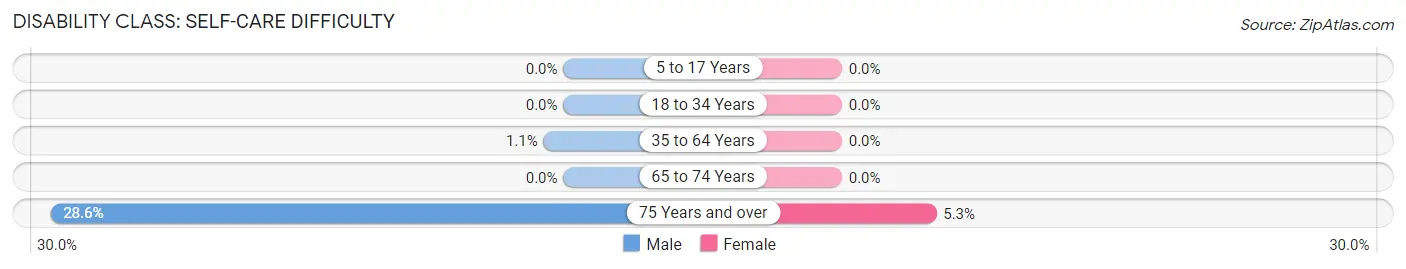
| Age Bracket | Male | Female |
| 5 to 17 Years | 0 (0.0%) | 0 (0.0%) |
| 18 to 34 Years | 0 (0.0%) | 0 (0.0%) |
| 35 to 64 Years | 2 (1.1%) | 0 (0.0%) |
| 65 to 74 Years | 0 (0.0%) | 0 (0.0%) |
| 75 Years and over | 8 (28.6%) | 2 (5.3%) |
Technology Access in Avon
Computing Device Access in Avon
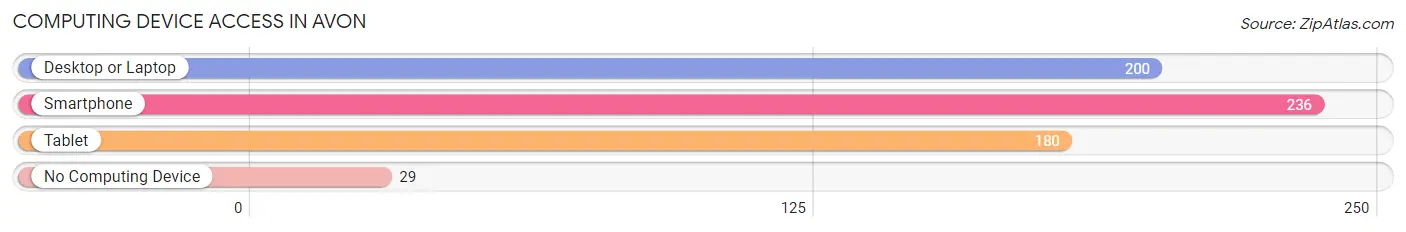
| Device Type | # Households | % Households |
| Desktop or Laptop | 200 | 69.0% |
| Smartphone | 236 | 81.4% |
| Tablet | 180 | 62.1% |
| No Computing Device | 29 | 10.0% |
| Total | 290 | 100.0% |
Internet Access in Avon
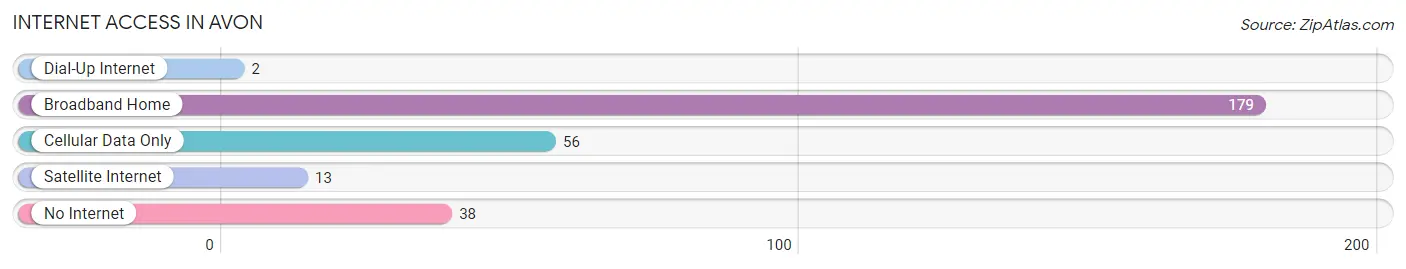
| Internet Type | # Households | % Households |
| Dial-Up Internet | 2 | 0.7% |
| Broadband Home | 179 | 61.7% |
| Cellular Data Only | 56 | 19.3% |
| Satellite Internet | 13 | 4.5% |
| No Internet | 38 | 13.1% |
| Total | 290 | 100.0% |
Avon Summary
Avon, Illinois is a small village located in Fulton County, Illinois. It is situated on the banks of the Spoon River, approximately 25 miles northwest of Peoria. The village has a population of 1,741 as of the 2010 census.
History
Avon was founded in 1836 by a group of settlers from New York. The village was named after the biblical city of Avon, which is mentioned in the book of Genesis. The first settlers were primarily farmers and the village grew slowly over the years. In 1854, the village was incorporated and the first post office was established.
In the late 19th century, Avon became a popular tourist destination due to its proximity to the Spoon River. The river was used for fishing, boating, and swimming. The village also had a number of hotels and resorts that catered to visitors.
In the early 20th century, Avon experienced a period of growth and development. The village was connected to the outside world by the Chicago, Burlington & Quincy Railroad in 1906. This allowed for the shipment of goods and services to and from the village. In addition, the village was connected to the outside world by the telephone in 1910.
Geography
Avon is located in the northwest corner of Fulton County, Illinois. It is situated on the banks of the Spoon River, approximately 25 miles northwest of Peoria. The village has a total area of 1.2 square miles, all of which is land.
The village is located in a rural area and is surrounded by farmland. The Spoon River flows through the village and is a popular spot for fishing and boating. The village is also home to a number of parks and recreational areas, including the Avon Park, which is located on the banks of the river.
Economy
Avon’s economy is primarily based on agriculture. The village is home to a number of farms that produce corn, soybeans, and other crops. In addition, the village is home to a number of small businesses, including restaurants, retail stores, and service providers.
The village is also home to a number of manufacturing companies, including a plastics manufacturer and a metal fabrication company. The village is also home to a number of transportation companies, including trucking companies and a railroad.
Demographics
As of the 2010 census, Avon had a population of 1,741. The population is primarily white (97.2%) and the median age is 43.7 years. The median household income is $50,972 and the median home value is $117,400.
The village is home to a number of churches, including the Avon United Methodist Church, the Avon Baptist Church, and the Avon Presbyterian Church. The village is also home to a number of schools, including the Avon Elementary School, the Avon Middle School, and the Avon High School.
Conclusion
Avon, Illinois is a small village located in Fulton County, Illinois. It is situated on the banks of the Spoon River, approximately 25 miles northwest of Peoria. The village has a population of 1,741 as of the 2010 census. The village’s economy is primarily based on agriculture and it is home to a number of small businesses, manufacturing companies, and transportation companies. The village is also home to a number of churches and schools.
Common Questions
What is Per Capita Income in Avon?
Per Capita income in Avon is $26,139.
What is the Median Family Income in Avon?
Median Family Income in Avon is $70,132.
What is the Median Household income in Avon?
Median Household Income in Avon is $41,607.
What is Income or Wage Gap in Avon?
Income or Wage Gap in Avon is 0.9%.
Women in Avon earn 99.1 cents for every dollar earned by a man.
What is Inequality or Gini Index in Avon?
Inequality or Gini Index in Avon is 0.40.
What is the Total Population of Avon?
Total Population of Avon is 627.
What is the Total Male Population of Avon?
Total Male Population of Avon is 350.
What is the Total Female Population of Avon?
Total Female Population of Avon is 277.
What is the Ratio of Males per 100 Females in Avon?
There are 126.35 Males per 100 Females in Avon.
What is the Ratio of Females per 100 Males in Avon?
There are 79.14 Females per 100 Males in Avon.
What is the Median Population Age in Avon?
Median Population Age in Avon is 44.7 Years.
What is the Average Family Size in Avon
Average Family Size in Avon is 2.8 People.
What is the Average Household Size in Avon
Average Household Size in Avon is 2.2 People.
How Large is the Labor Force in Avon?
There are 362 People in the Labor Forcein in Avon.
What is the Percentage of People in the Labor Force in Avon?
65.9% of People are in the Labor Force in Avon.
What is the Unemployment Rate in Avon?
Unemployment Rate in Avon is 3.6%.