Warsaw, IL Map & Demographics
Warsaw Map
Warsaw Overview
$32,907
PER CAPITA INCOME
$74,432
AVG FAMILY INCOME
$56,321
AVG HOUSEHOLD INCOME
59.0%
WAGE / INCOME GAP [ % ]
41.0¢/ $1
WAGE / INCOME GAP [ $ ]
0.42
INEQUALITY / GINI INDEX
1,538
TOTAL POPULATION
707
MALE POPULATION
831
FEMALE POPULATION
85.08
MALES / 100 FEMALES
117.54
FEMALES / 100 MALES
44.5
MEDIAN AGE
2.8
AVG FAMILY SIZE
2.2
AVG HOUSEHOLD SIZE
751
LABOR FORCE [ PEOPLE ]
63.3%
PERCENT IN LABOR FORCE
13.6%
UNEMPLOYMENT RATE
Warsaw Zip Codes
Warsaw Area Codes
Income in Warsaw
Income Overview in Warsaw
Per Capita Income in Warsaw is $32,907, while median incomes of families and households are $74,432 and $56,321 respectively.
| Characteristic | Number | Measure |
| Per Capita Income | 1,538 | $32,907 |
| Median Family Income | 441 | $74,432 |
| Mean Family Income | 441 | $91,772 |
| Median Household Income | 685 | $56,321 |
| Mean Household Income | 685 | $71,936 |
| Income Deficit | 441 | $0 |
| Wage / Income Gap (%) | 1,538 | 58.95% |
| Wage / Income Gap ($) | 1,538 | 41.05¢ per $1 |
| Gini / Inequality Index | 1,538 | 0.42 |
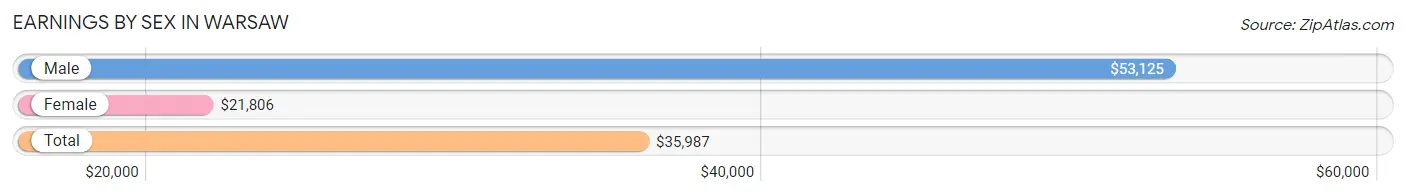
Earnings by Sex in Warsaw
Average Earnings in Warsaw are $35,987, $53,125 for men and $21,806 for women, a difference of 59.0%.
| Sex | Number | Average Earnings |
| Male | 353 (45.7%) | $53,125 |
| Female | 420 (54.3%) | $21,806 |
| Total | 773 (100.0%) | $35,987 |
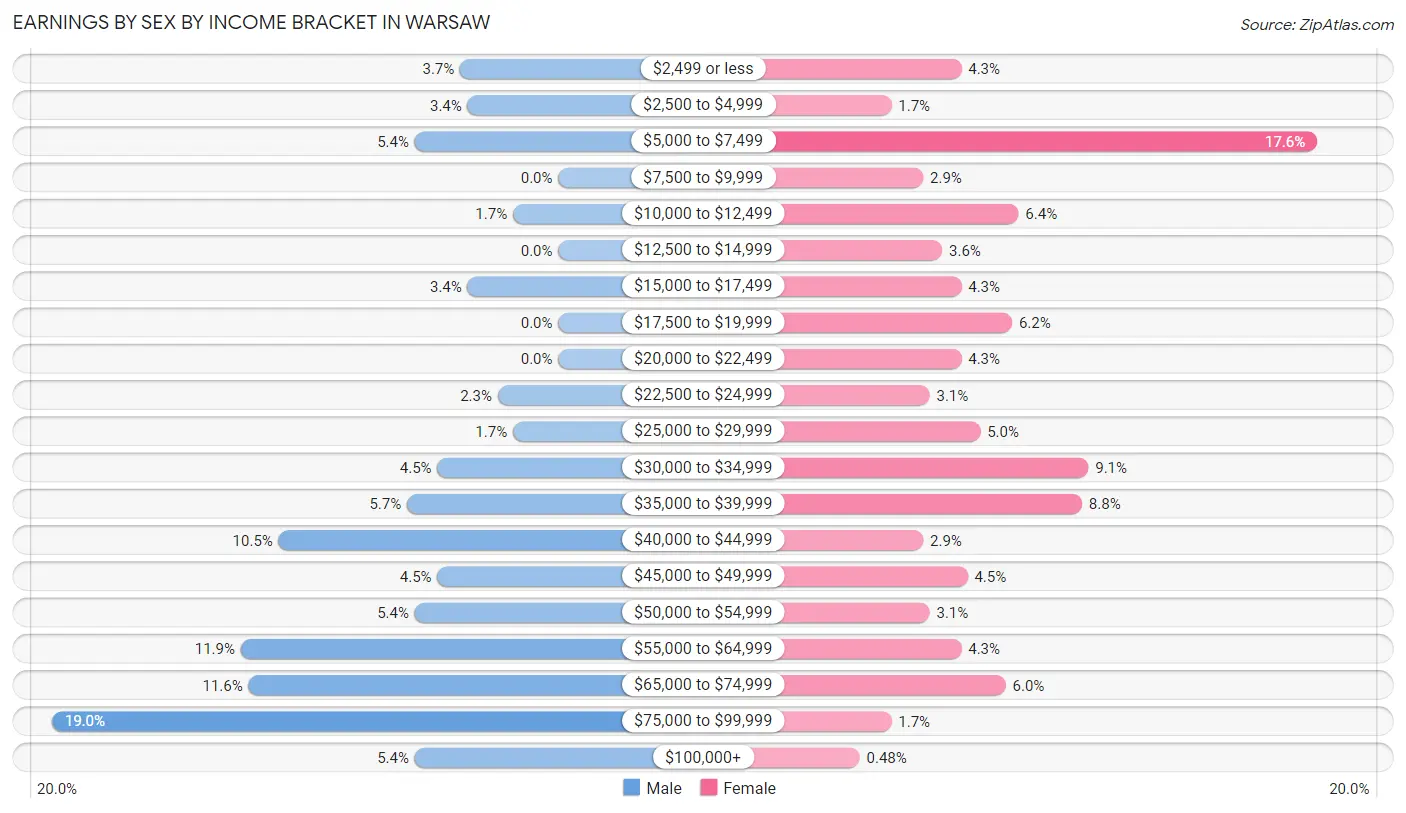
Earnings by Sex by Income Bracket in Warsaw
The most common earnings brackets in Warsaw are $75,000 to $99,999 for men (67 | 19.0%) and $5,000 to $7,499 for women (74 | 17.6%).
| Income | Male | Female |
| $2,499 or less | 13 (3.7%) | 18 (4.3%) |
| $2,500 to $4,999 | 12 (3.4%) | 7 (1.7%) |
| $5,000 to $7,499 | 19 (5.4%) | 74 (17.6%) |
| $7,500 to $9,999 | 0 (0.0%) | 12 (2.9%) |
| $10,000 to $12,499 | 6 (1.7%) | 27 (6.4%) |
| $12,500 to $14,999 | 0 (0.0%) | 15 (3.6%) |
| $15,000 to $17,499 | 12 (3.4%) | 18 (4.3%) |
| $17,500 to $19,999 | 0 (0.0%) | 26 (6.2%) |
| $20,000 to $22,499 | 0 (0.0%) | 18 (4.3%) |
| $22,500 to $24,999 | 8 (2.3%) | 13 (3.1%) |
| $25,000 to $29,999 | 6 (1.7%) | 21 (5.0%) |
| $30,000 to $34,999 | 16 (4.5%) | 38 (9.0%) |
| $35,000 to $39,999 | 20 (5.7%) | 37 (8.8%) |
| $40,000 to $44,999 | 37 (10.5%) | 12 (2.9%) |
| $45,000 to $49,999 | 16 (4.5%) | 19 (4.5%) |
| $50,000 to $54,999 | 19 (5.4%) | 13 (3.1%) |
| $55,000 to $64,999 | 42 (11.9%) | 18 (4.3%) |
| $65,000 to $74,999 | 41 (11.6%) | 25 (5.9%) |
| $75,000 to $99,999 | 67 (19.0%) | 7 (1.7%) |
| $100,000+ | 19 (5.4%) | 2 (0.5%) |
| Total | 353 (100.0%) | 420 (100.0%) |
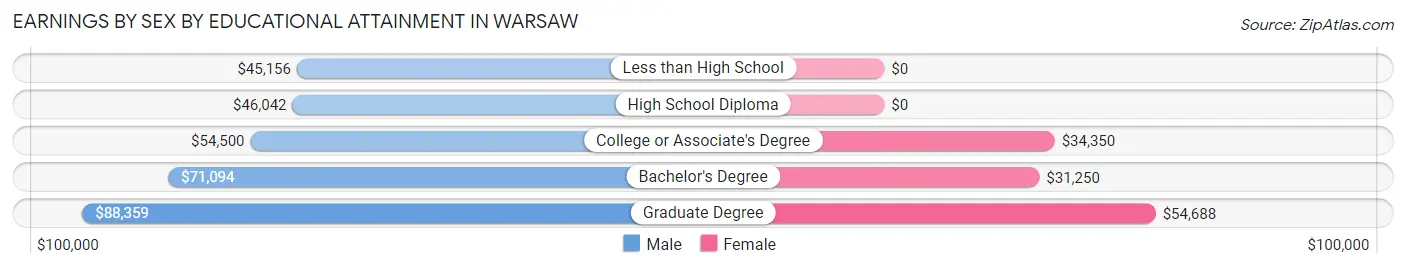
Earnings by Sex by Educational Attainment in Warsaw
Average earnings in Warsaw are $55,795 for men and $22,885 for women, a difference of 59.0%. Men with an educational attainment of graduate degree enjoy the highest average annual earnings of $88,359, while those with less than high school education earn the least with $45,156. Women with an educational attainment of graduate degree earn the most with the average annual earnings of $54,688, while those with bachelor's degree education have the smallest earnings of $31,250.
| Educational Attainment | Male Income | Female Income |
| Less than High School | $45,156 | $0 |
| High School Diploma | $46,042 | $0 |
| College or Associate's Degree | $54,500 | $34,350 |
| Bachelor's Degree | $71,094 | $31,250 |
| Graduate Degree | $88,359 | $54,688 |
| Total | $55,795 | $22,885 |
Family Income in Warsaw
Family Income Brackets in Warsaw
According to the Warsaw family income data, there are 119 families falling into the $50,000 to $74,999 income range, which is the most common income bracket and makes up 27.0% of all families. Conversely, the $200,000+ income bracket is the least frequent group with only 5 families (1.1%) belonging to this category.
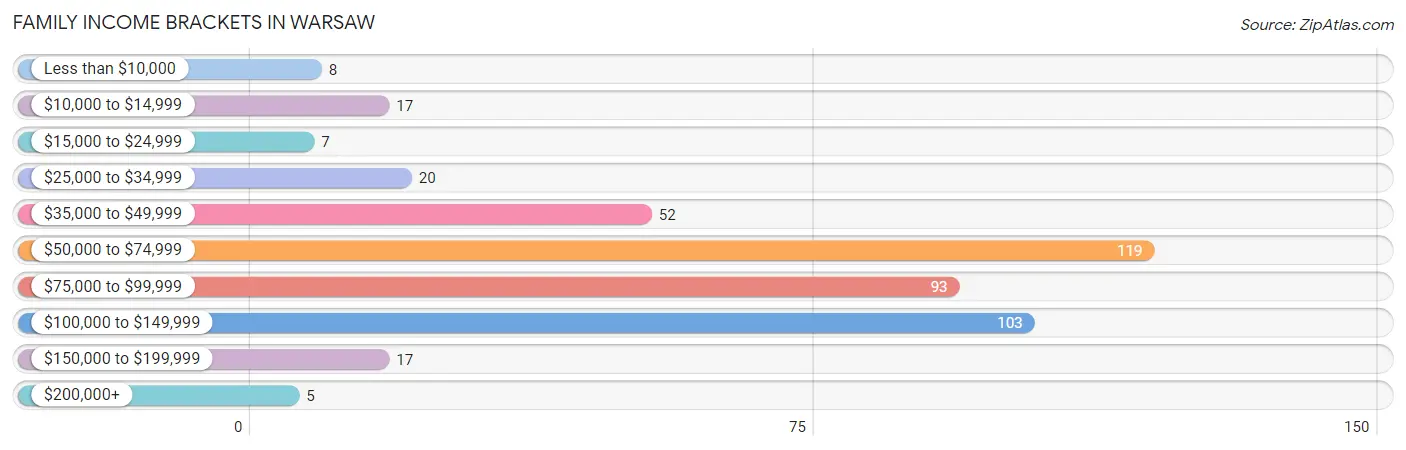
| Income Bracket | # Families | % Families |
| Less than $10,000 | 8 | 1.8% |
| $10,000 to $14,999 | 17 | 3.9% |
| $15,000 to $24,999 | 7 | 1.6% |
| $25,000 to $34,999 | 20 | 4.5% |
| $35,000 to $49,999 | 52 | 11.8% |
| $50,000 to $74,999 | 119 | 27.0% |
| $75,000 to $99,999 | 93 | 21.1% |
| $100,000 to $149,999 | 103 | 23.4% |
| $150,000 to $199,999 | 17 | 3.9% |
| $200,000+ | 5 | 1.1% |
Family Income by Famaliy Size in Warsaw
5-person families (17 | 3.8%) account for the highest median family income in Warsaw with $165,375 per family, while 5-person families (17 | 3.8%) have the highest median income of $33,075 per family member.
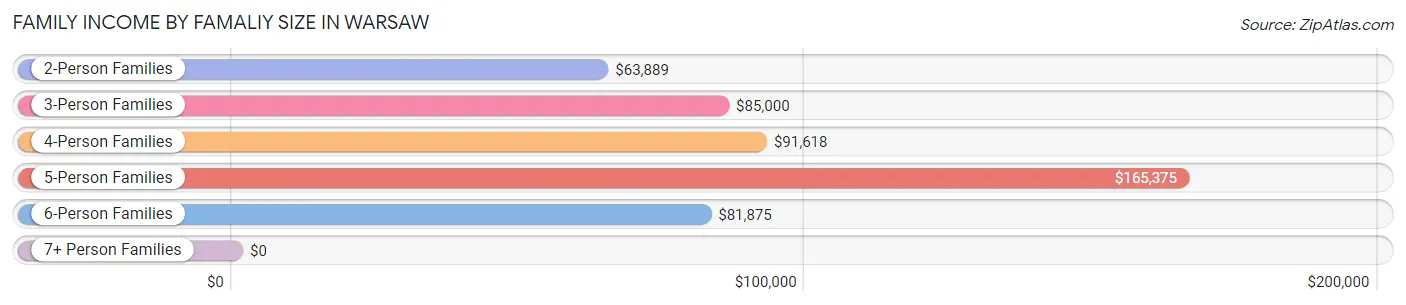
| Income Bracket | # Families | Median Income |
| 2-Person Families | 284 (64.4%) | $63,889 |
| 3-Person Families | 64 (14.5%) | $85,000 |
| 4-Person Families | 64 (14.5%) | $91,618 |
| 5-Person Families | 17 (3.8%) | $165,375 |
| 6-Person Families | 7 (1.6%) | $81,875 |
| 7+ Person Families | 5 (1.1%) | $0 |
| Total | 441 (100.0%) | $74,432 |
Family Income by Number of Earners in Warsaw
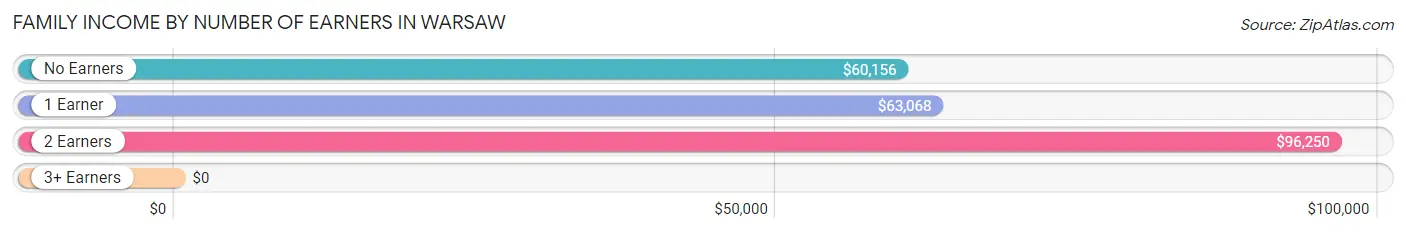
| Number of Earners | # Families | Median Income |
| No Earners | 83 (18.8%) | $60,156 |
| 1 Earner | 159 (36.0%) | $63,068 |
| 2 Earners | 192 (43.5%) | $96,250 |
| 3+ Earners | 7 (1.6%) | $0 |
| Total | 441 (100.0%) | $74,432 |
Household Income in Warsaw
Household Income Brackets in Warsaw
With 140 households falling in the category, the $50,000 to $74,999 income range is the most frequent in Warsaw, accounting for 20.4% of all households. In contrast, only 5 households (0.7%) fall into the $200,000+ income bracket, making it the least populous group.
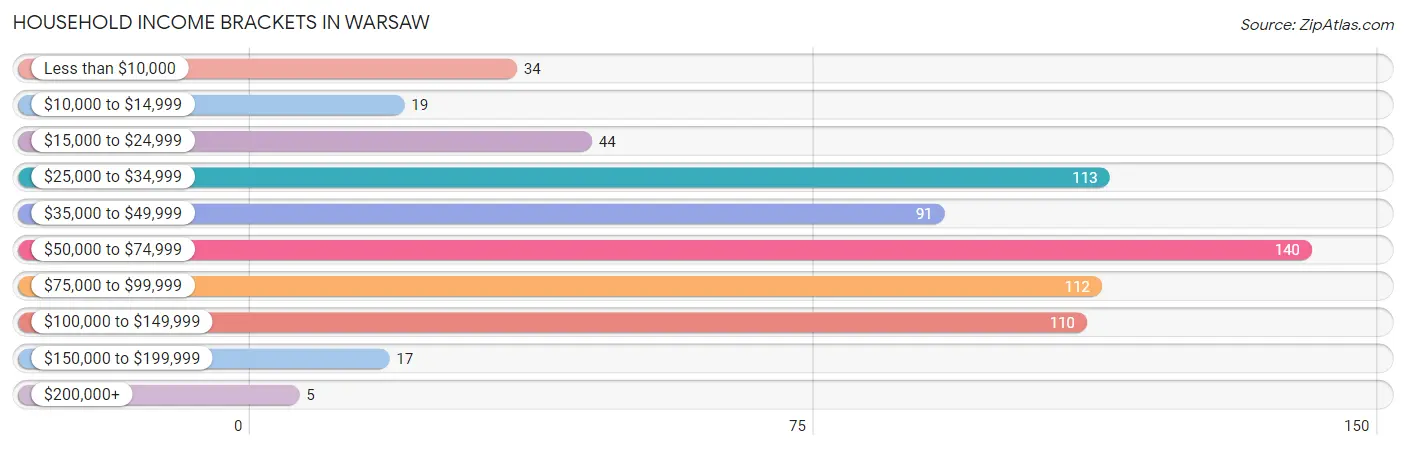
| Income Bracket | # Households | % Households |
| Less than $10,000 | 34 | 5.0% |
| $10,000 to $14,999 | 19 | 2.8% |
| $15,000 to $24,999 | 44 | 6.4% |
| $25,000 to $34,999 | 113 | 16.5% |
| $35,000 to $49,999 | 91 | 13.3% |
| $50,000 to $74,999 | 140 | 20.4% |
| $75,000 to $99,999 | 112 | 16.4% |
| $100,000 to $149,999 | 110 | 16.1% |
| $150,000 to $199,999 | 17 | 2.5% |
| $200,000+ | 5 | 0.7% |
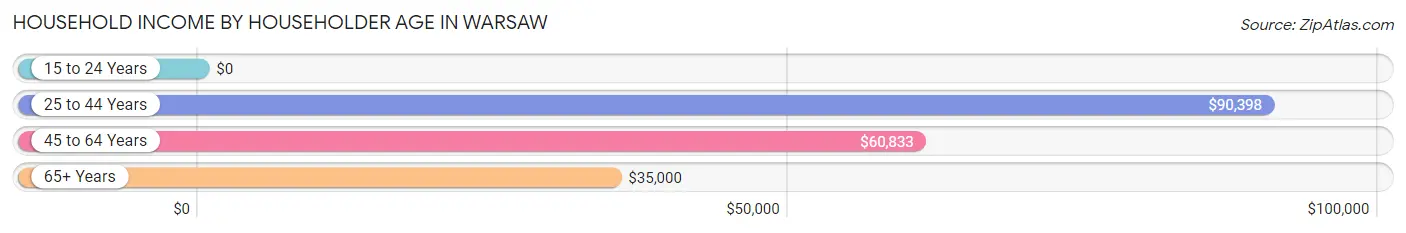
Household Income by Householder Age in Warsaw
The median household income in Warsaw is $56,321, with the highest median household income of $90,398 found in the 25 to 44 years age bracket for the primary householder. A total of 191 households (27.9%) fall into this category. Meanwhile, the 15 to 24 years age bracket for the primary householder has the lowest median household income of $0, with 4 households (0.6%) in this group.
| Income Bracket | # Households | Median Income |
| 15 to 24 Years | 4 (0.6%) | $0 |
| 25 to 44 Years | 191 (27.9%) | $90,398 |
| 45 to 64 Years | 216 (31.5%) | $60,833 |
| 65+ Years | 274 (40.0%) | $35,000 |
| Total | 685 (100.0%) | $56,321 |
Poverty in Warsaw
Income Below Poverty by Sex and Age in Warsaw
With 7.9% poverty level for males and 10.5% for females among the residents of Warsaw, 55 to 64 year old males and 15 year old females are the most vulnerable to poverty, with 30 males (21.7%) and 9 females (28.1%) in their respective age groups living below the poverty level.
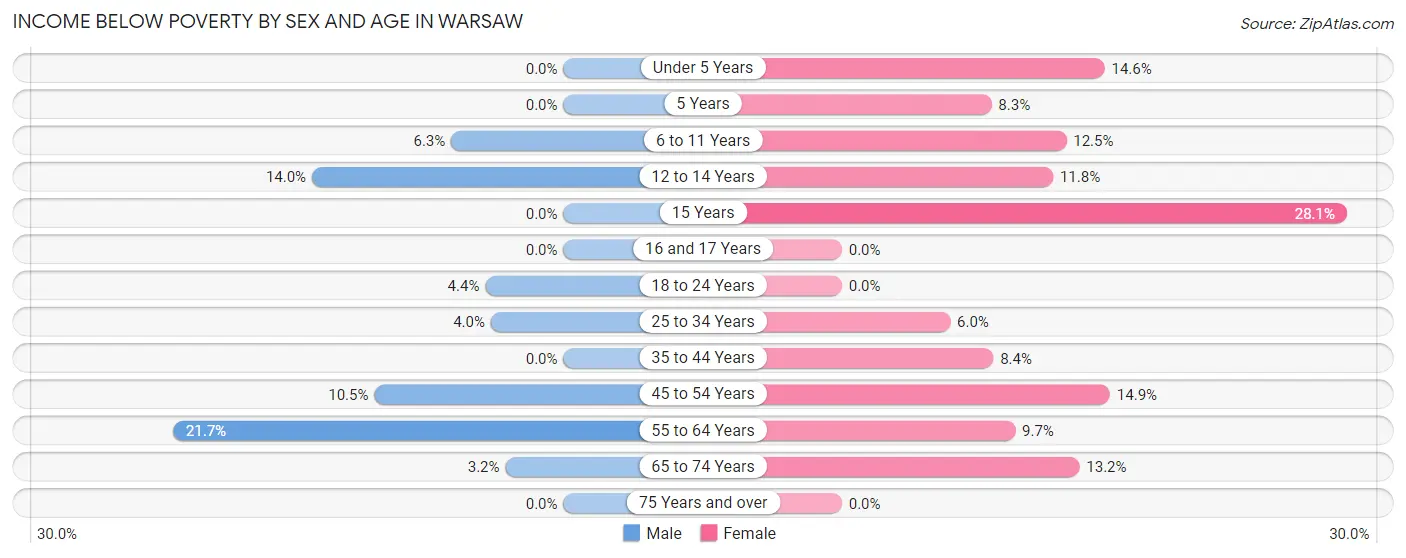
| Age Bracket | Male | Female |
| Under 5 Years | 0 (0.0%) | 6 (14.6%) |
| 5 Years | 0 (0.0%) | 3 (8.3%) |
| 6 to 11 Years | 4 (6.2%) | 5 (12.5%) |
| 12 to 14 Years | 7 (14.0%) | 4 (11.8%) |
| 15 Years | 0 (0.0%) | 9 (28.1%) |
| 16 and 17 Years | 0 (0.0%) | 0 (0.0%) |
| 18 to 24 Years | 1 (4.3%) | 0 (0.0%) |
| 25 to 34 Years | 4 (4.0%) | 7 (6.0%) |
| 35 to 44 Years | 0 (0.0%) | 7 (8.4%) |
| 45 to 54 Years | 6 (10.5%) | 10 (14.9%) |
| 55 to 64 Years | 30 (21.7%) | 11 (9.7%) |
| 65 to 74 Years | 4 (3.2%) | 25 (13.2%) |
| 75 Years and over | 0 (0.0%) | 0 (0.0%) |
| Total | 56 (7.9%) | 87 (10.5%) |
Income Above Poverty by Sex and Age in Warsaw
According to the poverty statistics in Warsaw, males aged under 5 years and females aged 16 and 17 years are the age groups that are most secure financially, with 100.0% of males and 100.0% of females in these age groups living above the poverty line.
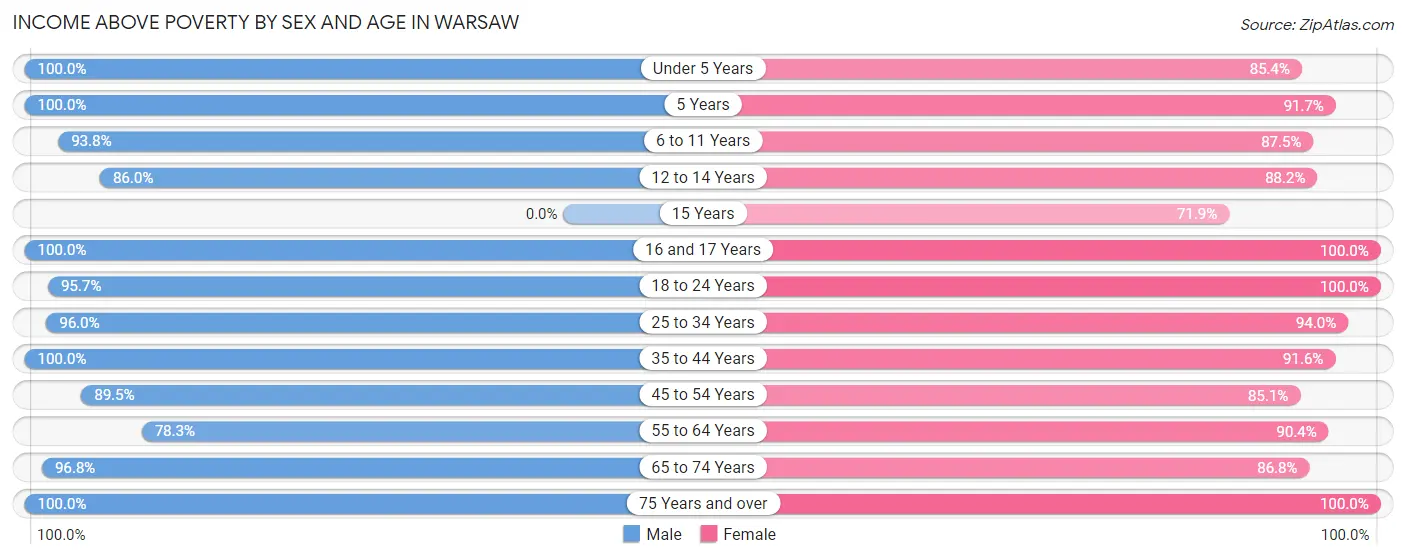
| Age Bracket | Male | Female |
| Under 5 Years | 48 (100.0%) | 35 (85.4%) |
| 5 Years | 6 (100.0%) | 33 (91.7%) |
| 6 to 11 Years | 60 (93.8%) | 35 (87.5%) |
| 12 to 14 Years | 43 (86.0%) | 30 (88.2%) |
| 15 Years | 0 (0.0%) | 23 (71.9%) |
| 16 and 17 Years | 13 (100.0%) | 20 (100.0%) |
| 18 to 24 Years | 22 (95.7%) | 7 (100.0%) |
| 25 to 34 Years | 95 (96.0%) | 109 (94.0%) |
| 35 to 44 Years | 57 (100.0%) | 76 (91.6%) |
| 45 to 54 Years | 51 (89.5%) | 57 (85.1%) |
| 55 to 64 Years | 108 (78.3%) | 103 (90.3%) |
| 65 to 74 Years | 120 (96.8%) | 164 (86.8%) |
| 75 Years and over | 28 (100.0%) | 52 (100.0%) |
| Total | 651 (92.1%) | 744 (89.5%) |
Income Below Poverty Among Married-Couple Families in Warsaw
The poverty statistics for married-couple families in Warsaw show that 4.7% or 16 of the total 338 families live below the poverty line. Families with no children have the highest poverty rate of 6.2%, comprising of 13 families. On the other hand, families with 3 or 4 children have the lowest poverty rate of 0.0%, which includes 0 families.
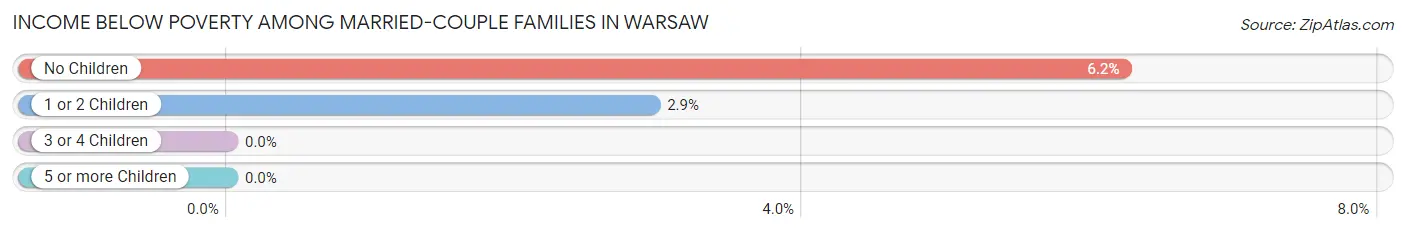
| Children | Above Poverty | Below Poverty |
| No Children | 196 (93.8%) | 13 (6.2%) |
| 1 or 2 Children | 99 (97.1%) | 3 (2.9%) |
| 3 or 4 Children | 27 (100.0%) | 0 (0.0%) |
| 5 or more Children | 0 (0.0%) | 0 (0.0%) |
| Total | 322 (95.3%) | 16 (4.7%) |
Income Below Poverty Among Single-Parent Households in Warsaw
According to the poverty data in Warsaw, 28.0% or 7 single-father households and 9.0% or 7 single-mother households are living below the poverty line. Among single-father households, those with no children have the highest poverty rate, with 2 households (28.6%) experiencing poverty. Likewise, among single-mother households, those with 3 or 4 children have the highest poverty rate, with 3 households (50.0%) falling below the poverty line.
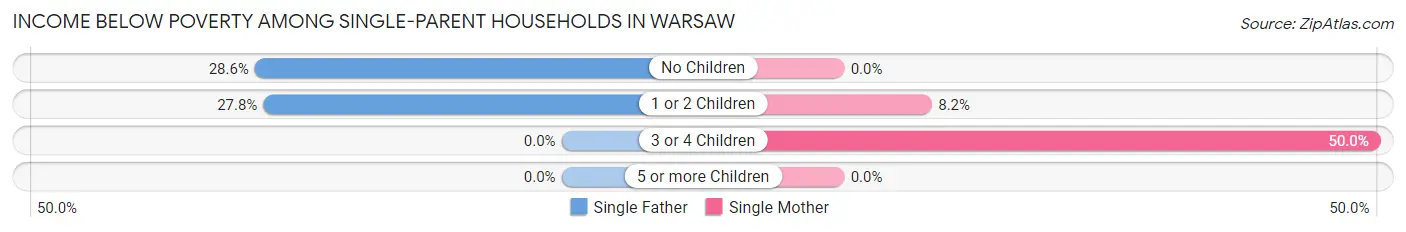
| Children | Single Father | Single Mother |
| No Children | 2 (28.6%) | 0 (0.0%) |
| 1 or 2 Children | 5 (27.8%) | 4 (8.2%) |
| 3 or 4 Children | 0 (0.0%) | 3 (50.0%) |
| 5 or more Children | 0 (0.0%) | 0 (0.0%) |
| Total | 7 (28.0%) | 7 (9.0%) |
Income Below Poverty Among Married-Couple vs Single-Parent Households in Warsaw
The poverty data for Warsaw shows that 16 of the married-couple family households (4.7%) and 14 of the single-parent households (13.6%) are living below the poverty level. Within the married-couple family households, those with no children have the highest poverty rate, with 13 households (6.2%) falling below the poverty line. Among the single-parent households, those with 3 or 4 children have the highest poverty rate, with 3 household (50.0%) living below poverty.
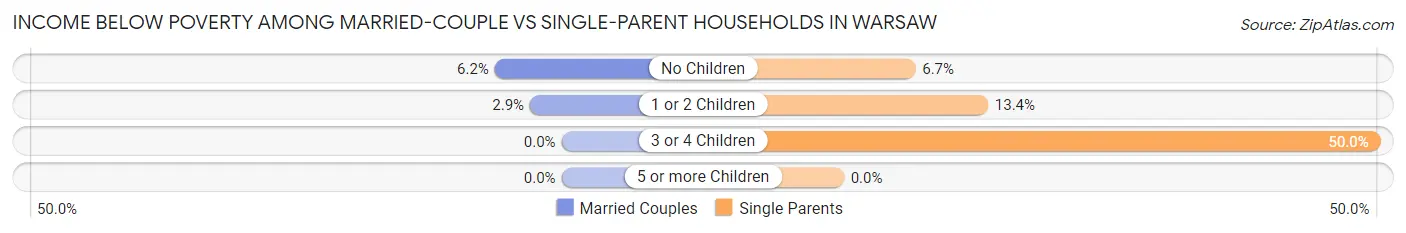
| Children | Married-Couple Families | Single-Parent Households |
| No Children | 13 (6.2%) | 2 (6.7%) |
| 1 or 2 Children | 3 (2.9%) | 9 (13.4%) |
| 3 or 4 Children | 0 (0.0%) | 3 (50.0%) |
| 5 or more Children | 0 (0.0%) | 0 (0.0%) |
| Total | 16 (4.7%) | 14 (13.6%) |
Race in Warsaw
The most populous races in Warsaw are White / Caucasian (1,497 | 97.3%), Two or more Races (32 | 2.1%), and Hispanic or Latino (16 | 1.0%).
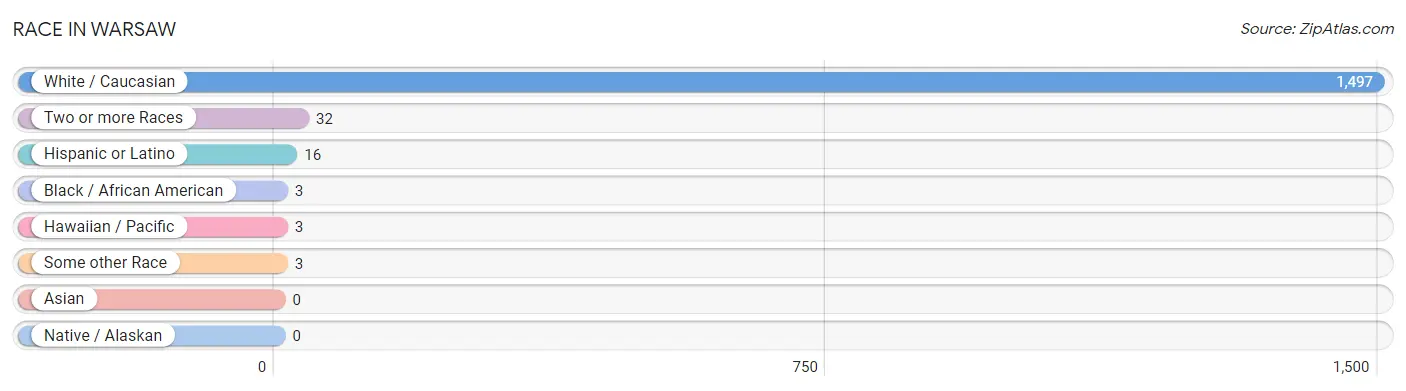
| Race | # Population | % Population |
| Asian | 0 | 0.0% |
| Black / African American | 3 | 0.2% |
| Hawaiian / Pacific | 3 | 0.2% |
| Hispanic or Latino | 16 | 1.0% |
| Native / Alaskan | 0 | 0.0% |
| White / Caucasian | 1,497 | 97.3% |
| Two or more Races | 32 | 2.1% |
| Some other Race | 3 | 0.2% |
| Total | 1,538 | 100.0% |
Ancestry in Warsaw
The most populous ancestries reported in Warsaw are German (468 | 30.4%), Irish (223 | 14.5%), American (180 | 11.7%), English (118 | 7.7%), and Scottish (100 | 6.5%), together accounting for 70.8% of all Warsaw residents.
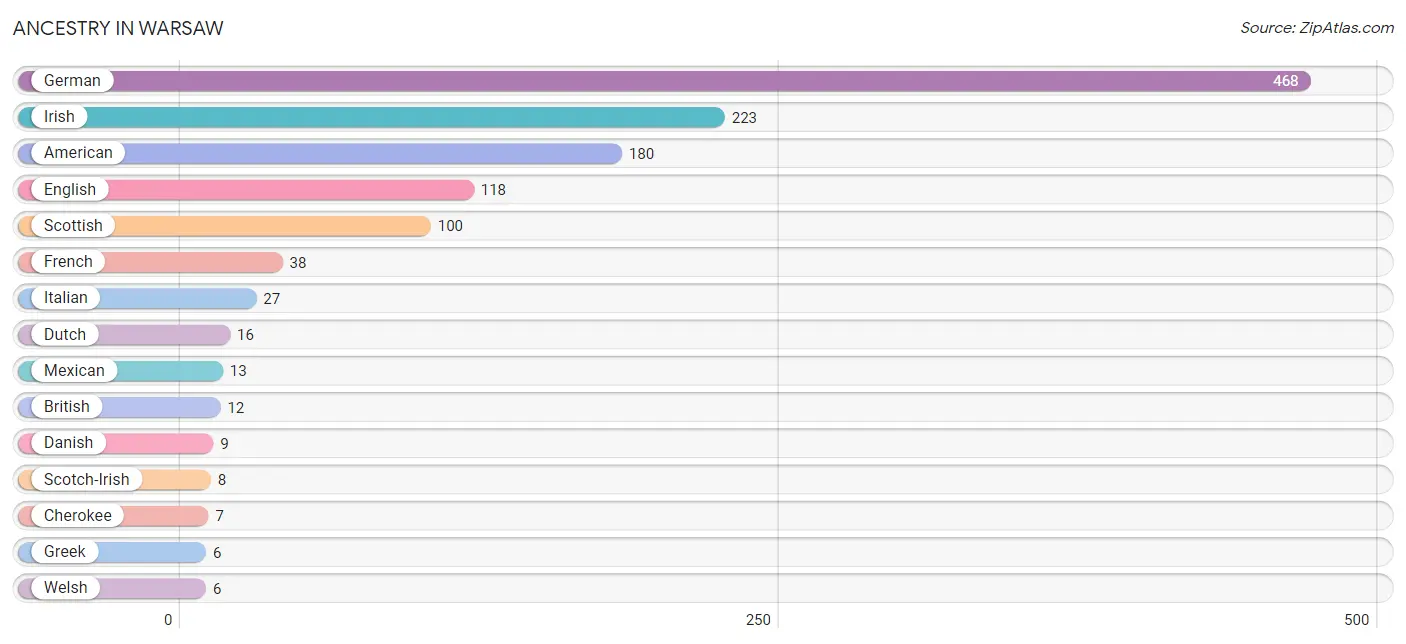
| Ancestry | # Population | % Population |
| American | 180 | 11.7% |
| Blackfeet | 3 | 0.2% |
| British | 12 | 0.8% |
| Canadian | 2 | 0.1% |
| Central American | 3 | 0.2% |
| Cherokee | 7 | 0.5% |
| Danish | 9 | 0.6% |
| Delaware | 4 | 0.3% |
| Dutch | 16 | 1.0% |
| English | 118 | 7.7% |
| European | 3 | 0.2% |
| French | 38 | 2.5% |
| German | 468 | 30.4% |
| Greek | 6 | 0.4% |
| Irish | 223 | 14.5% |
| Iroquois | 3 | 0.2% |
| Italian | 27 | 1.8% |
| Latvian | 2 | 0.1% |
| Mexican | 13 | 0.9% |
| Norwegian | 4 | 0.3% |
| Panamanian | 3 | 0.2% |
| Polish | 2 | 0.1% |
| Samoan | 3 | 0.2% |
| Scotch-Irish | 8 | 0.5% |
| Scottish | 100 | 6.5% |
| South African | 3 | 0.2% |
| Subsaharan African | 3 | 0.2% |
| Swedish | 3 | 0.2% |
| Swiss | 3 | 0.2% |
| Thai | 2 | 0.1% |
| Welsh | 6 | 0.4% | View All 31 Rows |
Immigrants in Warsaw
The most numerous immigrant groups reported in Warsaw came from Europe (6 | 0.4%), Central America (3 | 0.2%), Germany (3 | 0.2%), Italy (3 | 0.2%), and Latin America (3 | 0.2%), together accounting for 1.2% of all Warsaw residents.
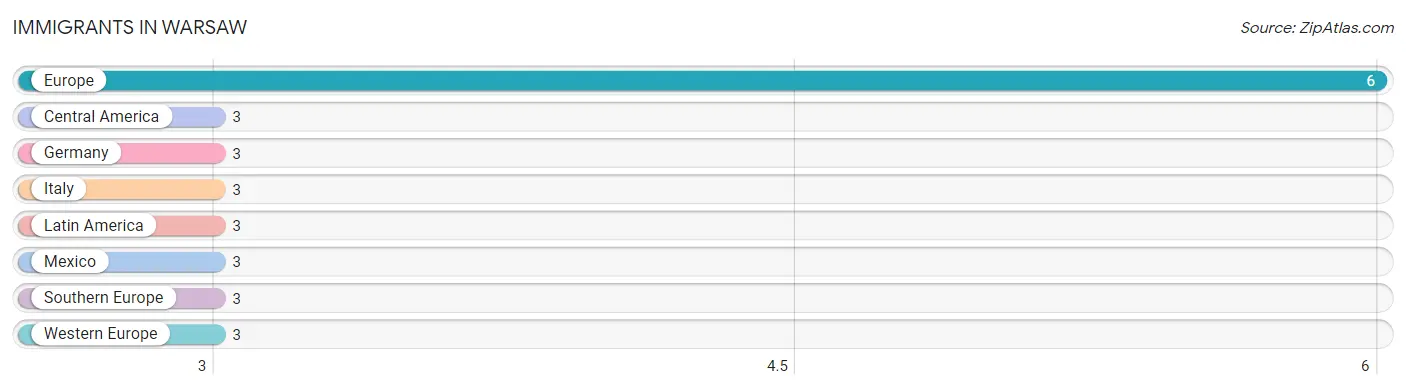
| Immigration Origin | # Population | % Population |
| Central America | 3 | 0.2% |
| Europe | 6 | 0.4% |
| Germany | 3 | 0.2% |
| Italy | 3 | 0.2% |
| Latin America | 3 | 0.2% |
| Mexico | 3 | 0.2% |
| Southern Europe | 3 | 0.2% |
| Western Europe | 3 | 0.2% | View All 8 Rows |
Sex and Age in Warsaw
Sex and Age in Warsaw
The most populous age groups in Warsaw are 65 to 69 Years (73 | 10.3%) for men and 65 to 69 Years (125 | 15.0%) for women.
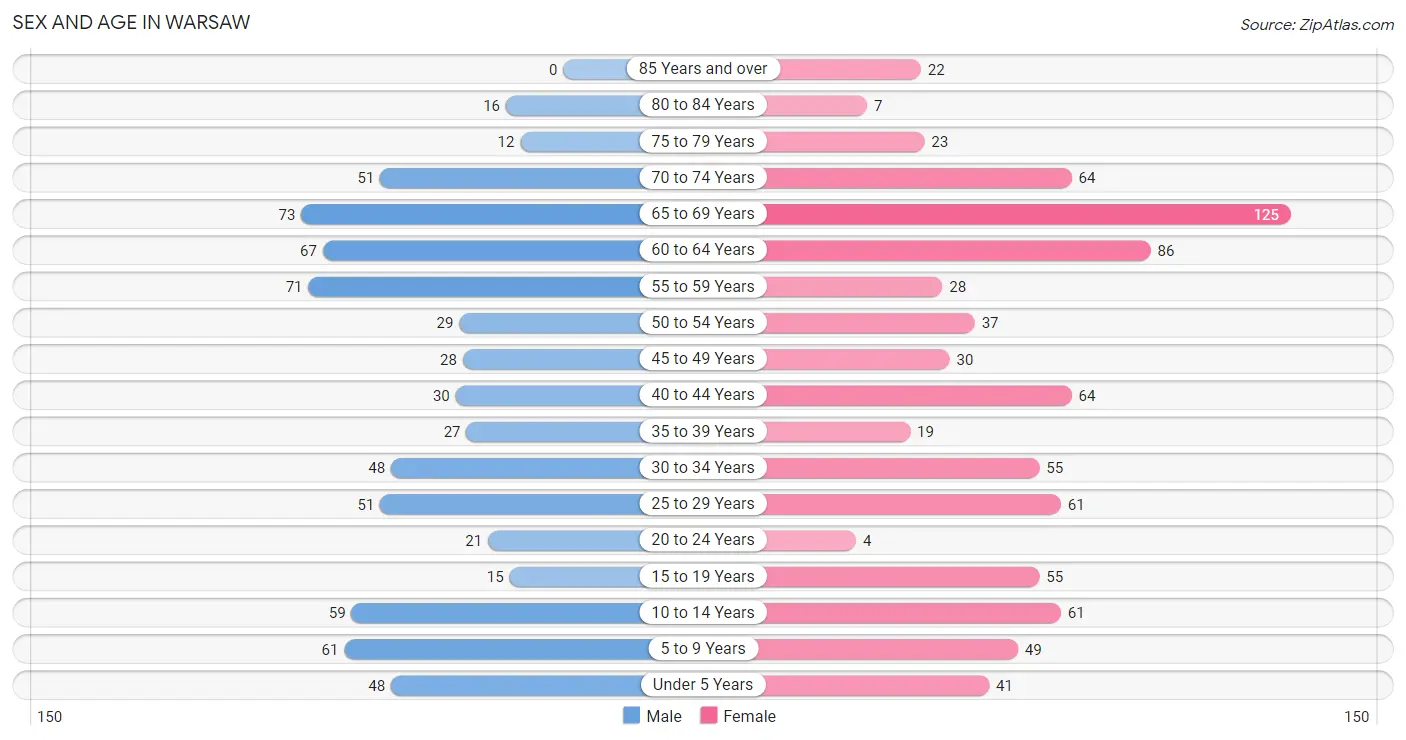
| Age Bracket | Male | Female |
| Under 5 Years | 48 (6.8%) | 41 (4.9%) |
| 5 to 9 Years | 61 (8.6%) | 49 (5.9%) |
| 10 to 14 Years | 59 (8.4%) | 61 (7.3%) |
| 15 to 19 Years | 15 (2.1%) | 55 (6.6%) |
| 20 to 24 Years | 21 (3.0%) | 4 (0.5%) |
| 25 to 29 Years | 51 (7.2%) | 61 (7.3%) |
| 30 to 34 Years | 48 (6.8%) | 55 (6.6%) |
| 35 to 39 Years | 27 (3.8%) | 19 (2.3%) |
| 40 to 44 Years | 30 (4.2%) | 64 (7.7%) |
| 45 to 49 Years | 28 (4.0%) | 30 (3.6%) |
| 50 to 54 Years | 29 (4.1%) | 37 (4.4%) |
| 55 to 59 Years | 71 (10.0%) | 28 (3.4%) |
| 60 to 64 Years | 67 (9.5%) | 86 (10.3%) |
| 65 to 69 Years | 73 (10.3%) | 125 (15.0%) |
| 70 to 74 Years | 51 (7.2%) | 64 (7.7%) |
| 75 to 79 Years | 12 (1.7%) | 23 (2.8%) |
| 80 to 84 Years | 16 (2.3%) | 7 (0.8%) |
| 85 Years and over | 0 (0.0%) | 22 (2.6%) |
| Total | 707 (100.0%) | 831 (100.0%) |
Families and Households in Warsaw
Median Family Size in Warsaw
The median family size in Warsaw is 2.81 persons per family, with married-couple families (338 | 76.6%) accounting for the largest median family size of 2.92 persons per family. On the other hand, single female/mother families (78 | 17.7%) represent the smallest median family size with 2.40 persons per family.
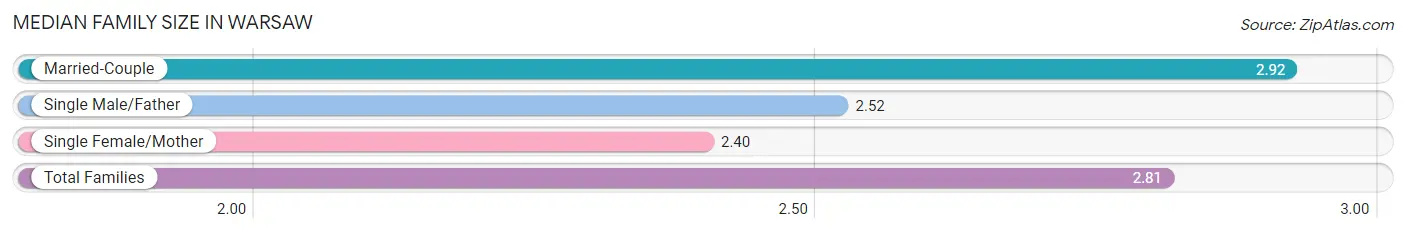
| Family Type | # Families | Family Size |
| Married-Couple | 338 (76.6%) | 2.92 |
| Single Male/Father | 25 (5.7%) | 2.52 |
| Single Female/Mother | 78 (17.7%) | 2.40 |
| Total Families | 441 (100.0%) | 2.81 |
Median Household Size in Warsaw
The median household size in Warsaw is 2.25 persons per household, with married-couple households (338 | 49.3%) accounting for the largest median household size of 2.92 persons per household. non-family households (244 | 35.6%) represent the smallest median household size with 1.16 persons per household.
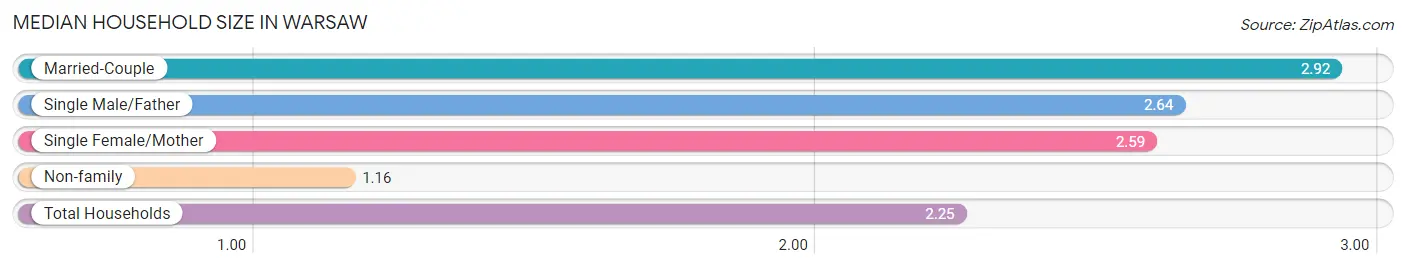
| Household Type | # Households | Household Size |
| Married-Couple | 338 (49.3%) | 2.92 |
| Single Male/Father | 25 (3.6%) | 2.64 |
| Single Female/Mother | 78 (11.4%) | 2.59 |
| Non-family | 244 (35.6%) | 1.16 |
| Total Households | 685 (100.0%) | 2.25 |
Household Size by Marriage Status in Warsaw
Out of a total of 685 households in Warsaw, 441 (64.4%) are family households, while 244 (35.6%) are nonfamily households. The most numerous type of family households are 2-person households, comprising 275, and the most common type of nonfamily households are 1-person households, comprising 217.
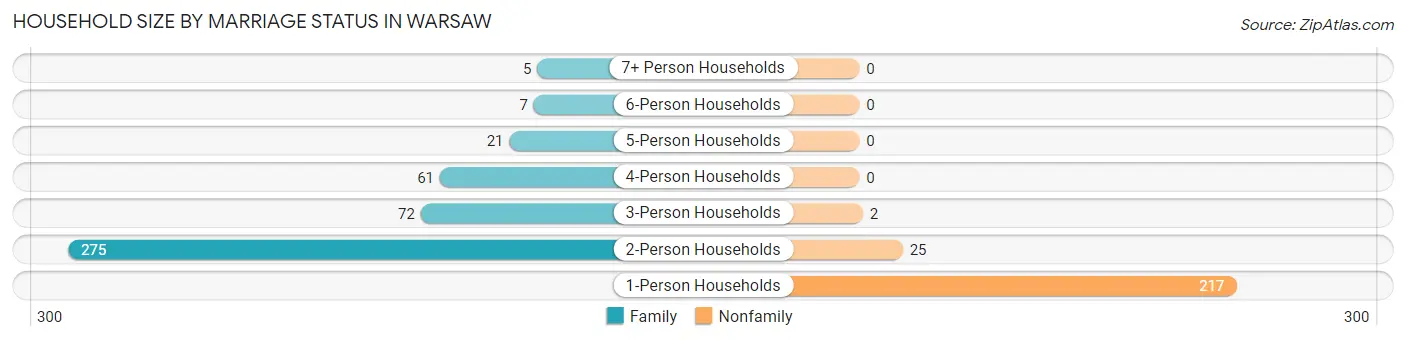
| Household Size | Family Households | Nonfamily Households |
| 1-Person Households | - | 217 (31.7%) |
| 2-Person Households | 275 (40.2%) | 25 (3.6%) |
| 3-Person Households | 72 (10.5%) | 2 (0.3%) |
| 4-Person Households | 61 (8.9%) | 0 (0.0%) |
| 5-Person Households | 21 (3.1%) | 0 (0.0%) |
| 6-Person Households | 7 (1.0%) | 0 (0.0%) |
| 7+ Person Households | 5 (0.7%) | 0 (0.0%) |
| Total | 441 (64.4%) | 244 (35.6%) |
Female Fertility in Warsaw
Fertility by Age in Warsaw
Average fertility rate in Warsaw is 80.0 births per 1,000 women. Women in the age bracket of 20 to 34 years have the highest fertility rate with 167.0 births per 1,000 women. Women in the age bracket of 20 to 34 years acount for 87.0% of all women with births.
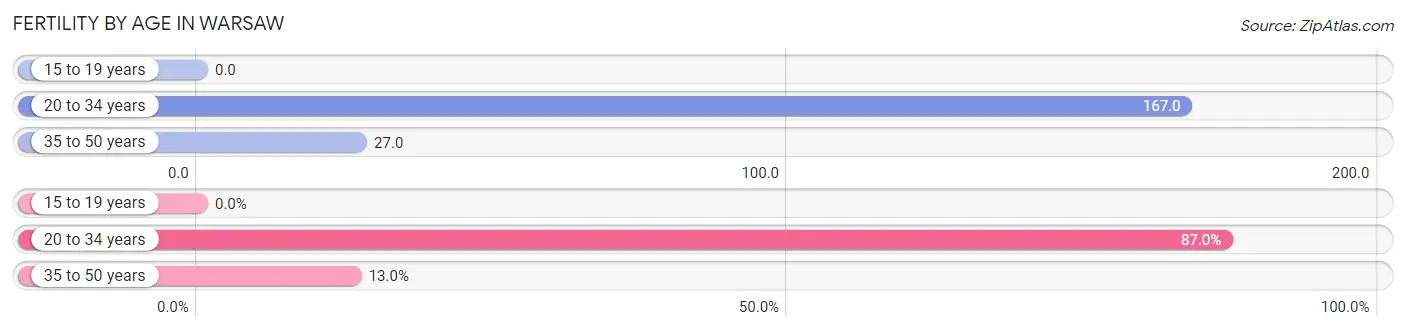
| Age Bracket | Women with Births | Births / 1,000 Women |
| 15 to 19 years | 0 (0.0%) | 0.0 |
| 20 to 34 years | 20 (87.0%) | 167.0 |
| 35 to 50 years | 3 (13.0%) | 27.0 |
| Total | 23 (100.0%) | 80.0 |
Fertility by Age by Marriage Status in Warsaw
60.9% of women with births (23) in Warsaw are married. The highest percentage of unmarried women with births falls into 35 to 50 years age bracket with 100.0% of them unmarried at the time of birth, while the lowest percentage of unmarried women with births belong to 20 to 34 years age bracket with 30.0% of them unmarried.
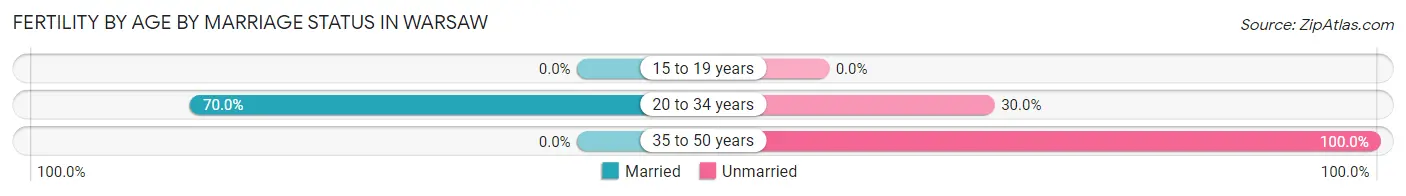
| Age Bracket | Married | Unmarried |
| 15 to 19 years | 0 (0.0%) | 0 (0.0%) |
| 20 to 34 years | 14 (70.0%) | 6 (30.0%) |
| 35 to 50 years | 0 (0.0%) | 3 (100.0%) |
| Total | 14 (60.9%) | 9 (39.1%) |
Fertility by Education in Warsaw
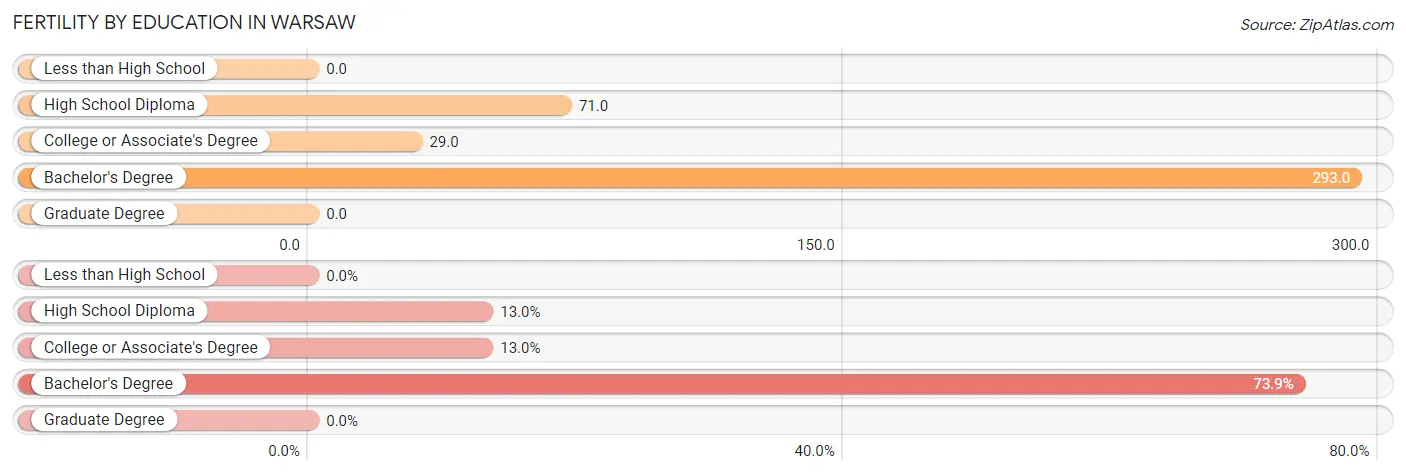
| Educational Attainment | Women with Births | Births / 1,000 Women |
| Less than High School | 0 (0.0%) | 0.0 |
| High School Diploma | 3 (13.0%) | 71.0 |
| College or Associate's Degree | 3 (13.0%) | 29.0 |
| Bachelor's Degree | 17 (73.9%) | 293.0 |
| Graduate Degree | 0 (0.0%) | 0.0 |
| Total | 23 (100.0%) | 80.0 |
Fertility by Education by Marriage Status in Warsaw
39.1% of women with births in Warsaw are unmarried. Women with the educational attainment of bachelor's degree are most likely to be married with 82.4% of them married at childbirth, while women with the educational attainment of high school diploma are least likely to be married with 100.0% of them unmarried at childbirth.
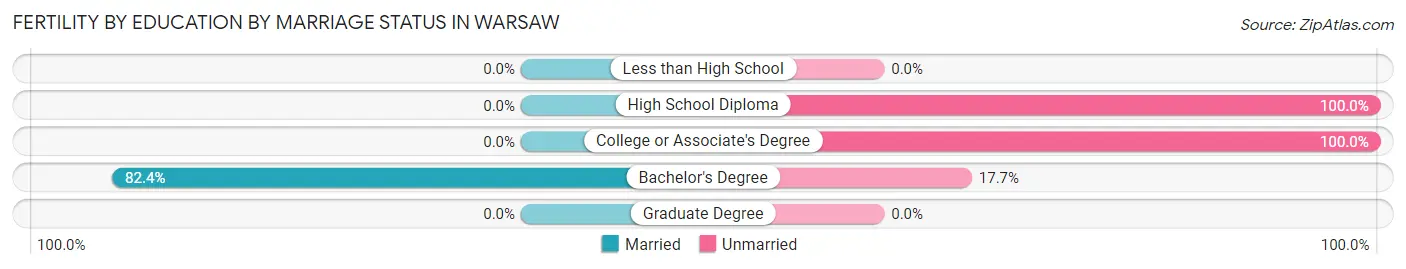
| Educational Attainment | Married | Unmarried |
| Less than High School | 0 (0.0%) | 0 (0.0%) |
| High School Diploma | 0 (0.0%) | 3 (100.0%) |
| College or Associate's Degree | 0 (0.0%) | 3 (100.0%) |
| Bachelor's Degree | 14 (82.4%) | 3 (17.6%) |
| Graduate Degree | 0 (0.0%) | 0 (0.0%) |
| Total | 14 (60.9%) | 9 (39.1%) |
Employment Characteristics in Warsaw
Employment by Class of Employer in Warsaw
Among the 632 employed individuals in Warsaw, private company employees (413 | 65.3%), not-for-profit organizations (74 | 11.7%), and state government employees (47 | 7.4%) make up the most common classes of employment.
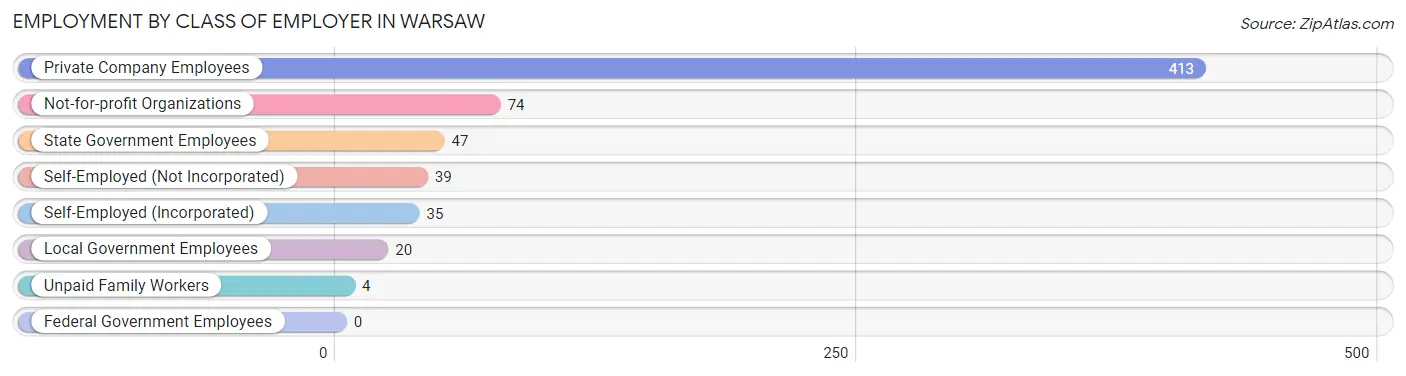
| Employer Class | # Employees | % Employees |
| Private Company Employees | 413 | 65.3% |
| Self-Employed (Incorporated) | 35 | 5.5% |
| Self-Employed (Not Incorporated) | 39 | 6.2% |
| Not-for-profit Organizations | 74 | 11.7% |
| Local Government Employees | 20 | 3.2% |
| State Government Employees | 47 | 7.4% |
| Federal Government Employees | 0 | 0.0% |
| Unpaid Family Workers | 4 | 0.6% |
| Total | 632 | 100.0% |
Employment Status by Age in Warsaw
According to the labor force statistics for Warsaw, out of the total population over 16 years of age (1,187), 63.3% or 751 individuals are in the labor force, with 13.6% or 102 of them unemployed. The age group with the highest labor force participation rate is 20 to 24 years, with 100.0% or 25 individuals in the labor force. Within the labor force, the 65 to 74 years age range has the highest percentage of unemployed individuals, with 56.9% or 70 of them being unemployed.
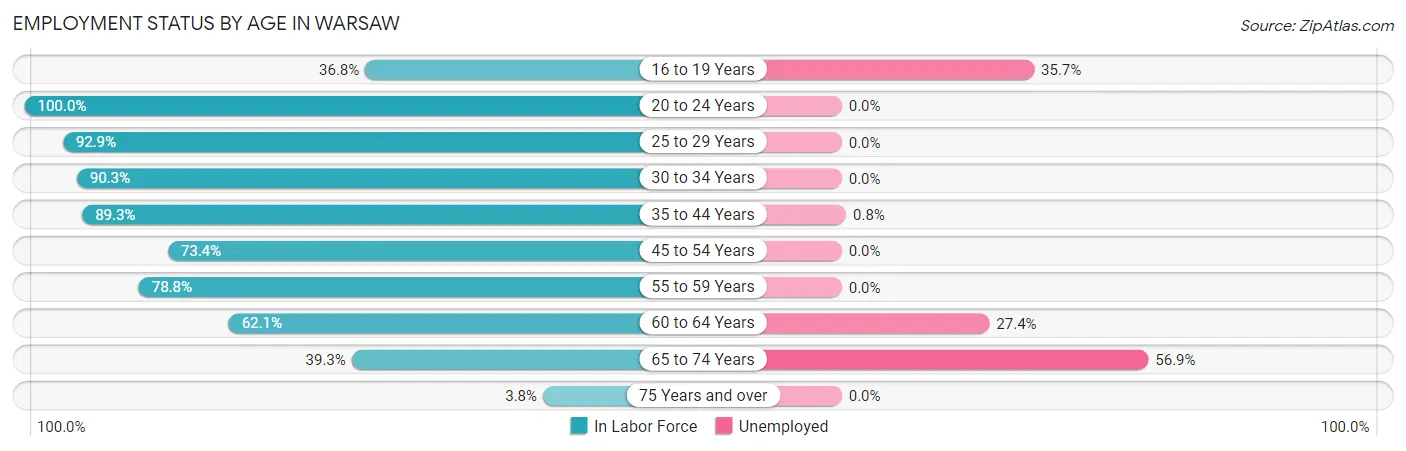
| Age Bracket | In Labor Force | Unemployed |
| 16 to 19 Years | 14 (36.8%) | 5 (35.7%) |
| 20 to 24 Years | 25 (100.0%) | 0 (0.0%) |
| 25 to 29 Years | 104 (92.9%) | 0 (0.0%) |
| 30 to 34 Years | 93 (90.3%) | 0 (0.0%) |
| 35 to 44 Years | 125 (89.3%) | 1 (0.8%) |
| 45 to 54 Years | 91 (73.4%) | 0 (0.0%) |
| 55 to 59 Years | 78 (78.8%) | 0 (0.0%) |
| 60 to 64 Years | 95 (62.1%) | 26 (27.4%) |
| 65 to 74 Years | 123 (39.3%) | 70 (56.9%) |
| 75 Years and over | 3 (3.8%) | 0 (0.0%) |
| Total | 751 (63.3%) | 102 (13.6%) |
Employment Status by Educational Attainment in Warsaw
According to labor force statistics for Warsaw, 80.2% of individuals (586) out of the total population between 25 and 64 years of age (731) are in the labor force, with 4.6% or 27 of them being unemployed. The group with the highest labor force participation rate are those with the educational attainment of bachelor's degree or higher, with 84.4% or 168 individuals in the labor force. Within the labor force, individuals with college / associate degree education have the highest percentage of unemployment, with 7.3% or 17 of them being unemployed.
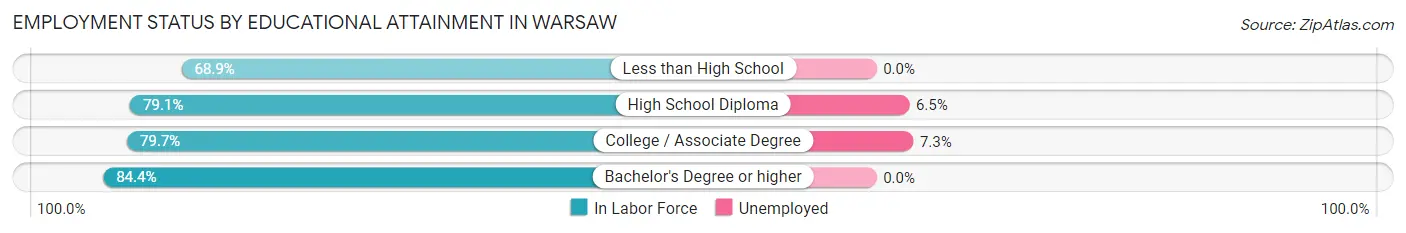
| Educational Attainment | In Labor Force | Unemployed |
| Less than High School | 31 (68.9%) | 0 (0.0%) |
| High School Diploma | 155 (79.1%) | 13 (6.5%) |
| College / Associate Degree | 232 (79.7%) | 21 (7.3%) |
| Bachelor's Degree or higher | 168 (84.4%) | 0 (0.0%) |
| Total | 586 (80.2%) | 34 (4.6%) |
Employment Occupations by Sex in Warsaw
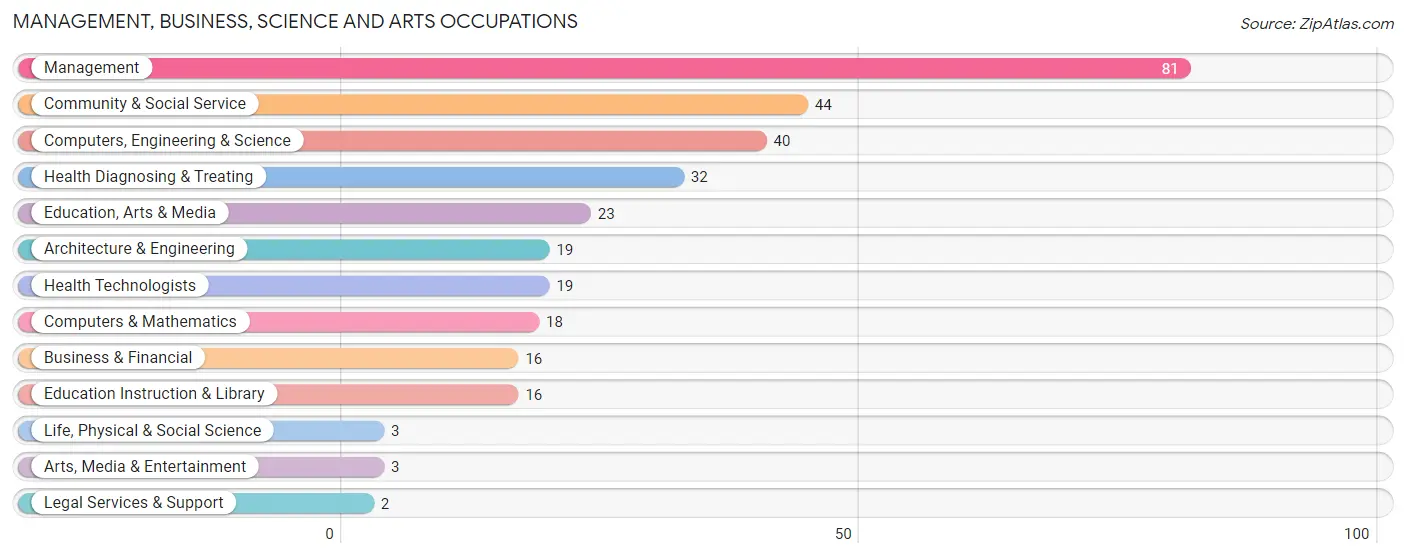
Management, Business, Science and Arts Occupations
The most common Management, Business, Science and Arts occupations in Warsaw are Management (81 | 12.5%), Community & Social Service (44 | 6.8%), Computers, Engineering & Science (40 | 6.2%), Health Diagnosing & Treating (32 | 4.9%), and Education, Arts & Media (23 | 3.5%).
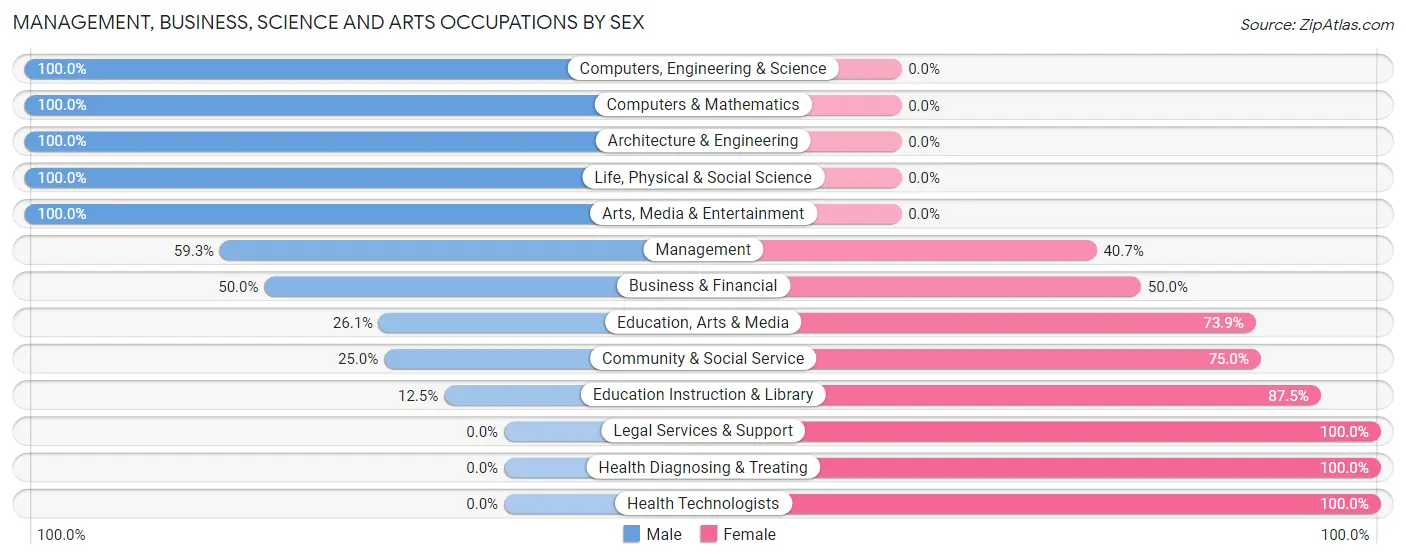
Management, Business, Science and Arts Occupations by Sex
Within the Management, Business, Science and Arts occupations in Warsaw, the most male-oriented occupations are Computers, Engineering & Science (100.0%), Computers & Mathematics (100.0%), and Architecture & Engineering (100.0%), while the most female-oriented occupations are Legal Services & Support (100.0%), Health Diagnosing & Treating (100.0%), and Health Technologists (100.0%).
| Occupation | Male | Female |
| Management | 48 (59.3%) | 33 (40.7%) |
| Business & Financial | 8 (50.0%) | 8 (50.0%) |
| Computers, Engineering & Science | 40 (100.0%) | 0 (0.0%) |
| Computers & Mathematics | 18 (100.0%) | 0 (0.0%) |
| Architecture & Engineering | 19 (100.0%) | 0 (0.0%) |
| Life, Physical & Social Science | 3 (100.0%) | 0 (0.0%) |
| Community & Social Service | 11 (25.0%) | 33 (75.0%) |
| Education, Arts & Media | 6 (26.1%) | 17 (73.9%) |
| Legal Services & Support | 0 (0.0%) | 2 (100.0%) |
| Education Instruction & Library | 2 (12.5%) | 14 (87.5%) |
| Arts, Media & Entertainment | 3 (100.0%) | 0 (0.0%) |
| Health Diagnosing & Treating | 0 (0.0%) | 32 (100.0%) |
| Health Technologists | 0 (0.0%) | 19 (100.0%) |
| Total (Category) | 107 (50.2%) | 106 (49.8%) |
| Total (Overall) | 333 (51.3%) | 316 (48.7%) |
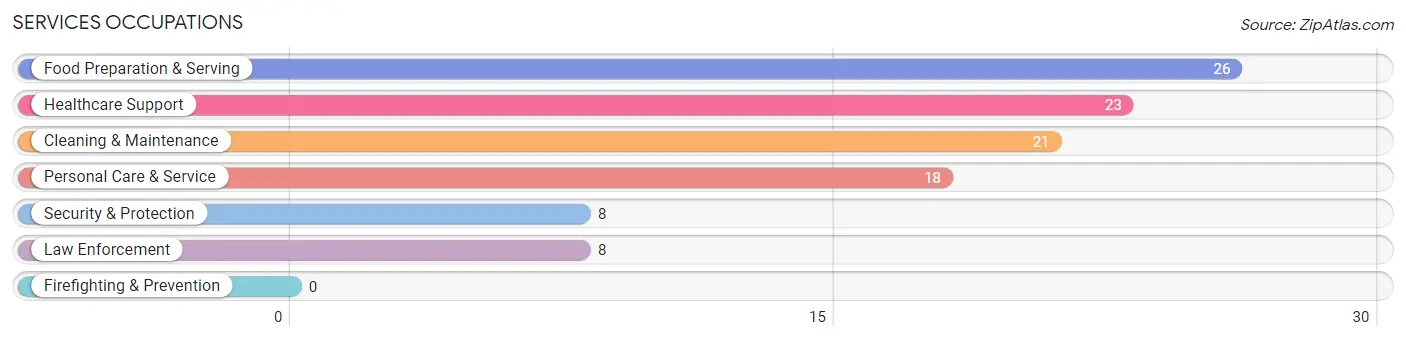
Services Occupations
The most common Services occupations in Warsaw are Food Preparation & Serving (26 | 4.0%), Healthcare Support (23 | 3.5%), Cleaning & Maintenance (21 | 3.2%), Personal Care & Service (18 | 2.8%), and Security & Protection (8 | 1.2%).
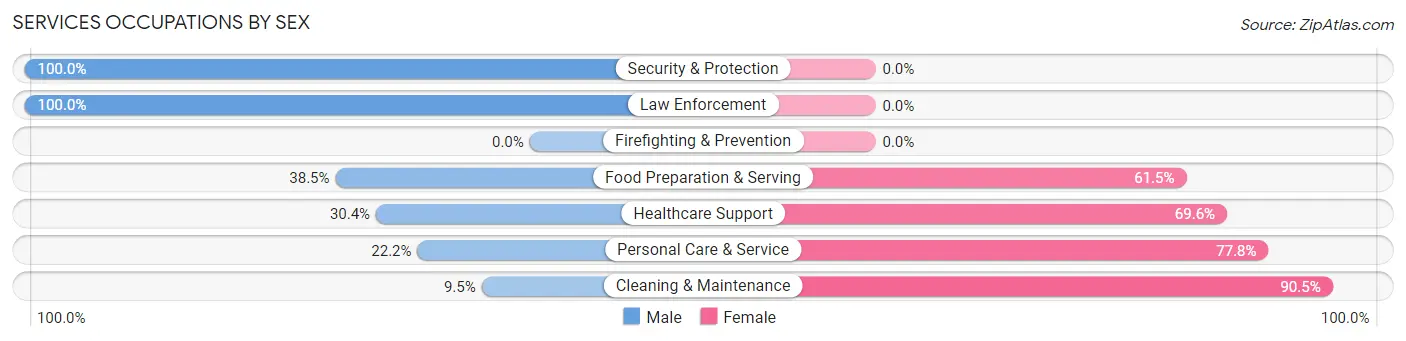
Services Occupations by Sex
Within the Services occupations in Warsaw, the most male-oriented occupations are Security & Protection (100.0%), Law Enforcement (100.0%), and Food Preparation & Serving (38.5%), while the most female-oriented occupations are Cleaning & Maintenance (90.5%), Personal Care & Service (77.8%), and Healthcare Support (69.6%).
| Occupation | Male | Female |
| Healthcare Support | 7 (30.4%) | 16 (69.6%) |
| Security & Protection | 8 (100.0%) | 0 (0.0%) |
| Firefighting & Prevention | 0 (0.0%) | 0 (0.0%) |
| Law Enforcement | 8 (100.0%) | 0 (0.0%) |
| Food Preparation & Serving | 10 (38.5%) | 16 (61.5%) |
| Cleaning & Maintenance | 2 (9.5%) | 19 (90.5%) |
| Personal Care & Service | 4 (22.2%) | 14 (77.8%) |
| Total (Category) | 31 (32.3%) | 65 (67.7%) |
| Total (Overall) | 333 (51.3%) | 316 (48.7%) |
Sales and Office Occupations
The most common Sales and Office occupations in Warsaw are Sales & Related (88 | 13.6%), and Office & Administration (85 | 13.1%).

Sales and Office Occupations by Sex

| Occupation | Male | Female |
| Sales & Related | 42 (47.7%) | 46 (52.3%) |
| Office & Administration | 6 (7.1%) | 79 (92.9%) |
| Total (Category) | 48 (27.8%) | 125 (72.3%) |
| Total (Overall) | 333 (51.3%) | 316 (48.7%) |
Natural Resources, Construction and Maintenance Occupations
The most common Natural Resources, Construction and Maintenance occupations in Warsaw are Installation, Maintenance & Repair (22 | 3.4%), Construction & Extraction (12 | 1.8%), and Farming, Fishing & Forestry (3 | 0.5%).
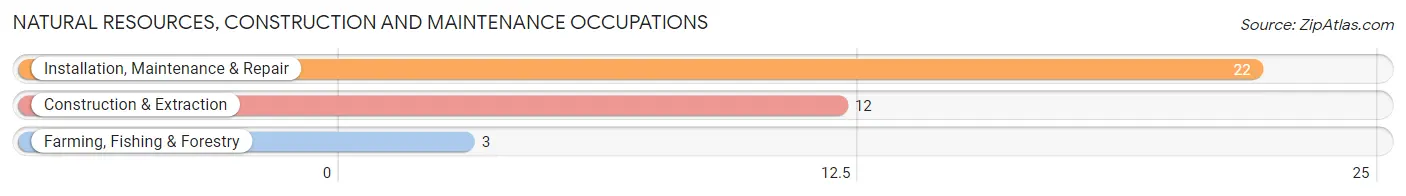
Natural Resources, Construction and Maintenance Occupations by Sex
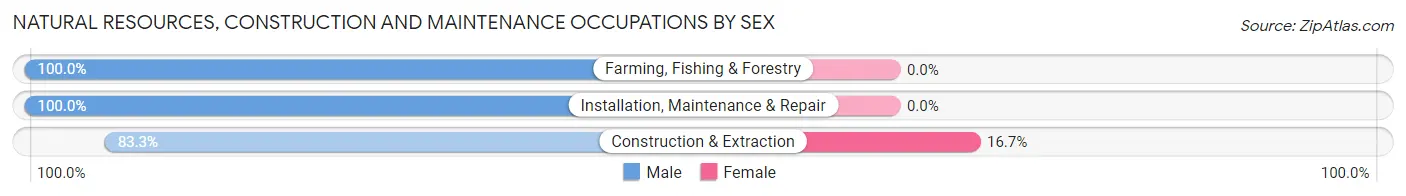
| Occupation | Male | Female |
| Farming, Fishing & Forestry | 3 (100.0%) | 0 (0.0%) |
| Construction & Extraction | 10 (83.3%) | 2 (16.7%) |
| Installation, Maintenance & Repair | 22 (100.0%) | 0 (0.0%) |
| Total (Category) | 35 (94.6%) | 2 (5.4%) |
| Total (Overall) | 333 (51.3%) | 316 (48.7%) |
Production, Transportation and Moving Occupations
The most common Production, Transportation and Moving occupations in Warsaw are Production (72 | 11.1%), Material Moving (34 | 5.2%), and Transportation (24 | 3.7%).
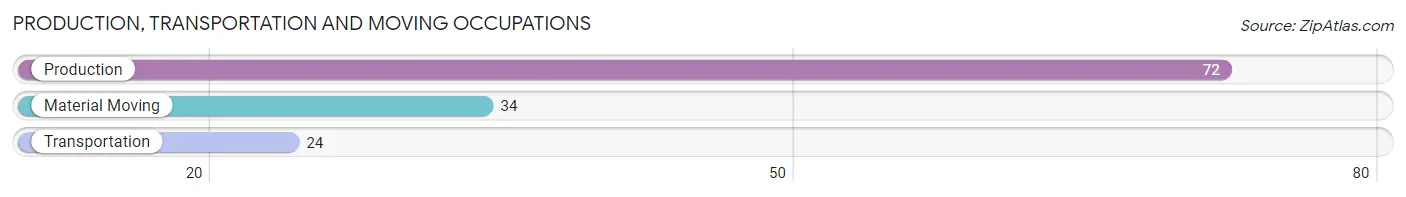
Production, Transportation and Moving Occupations by Sex
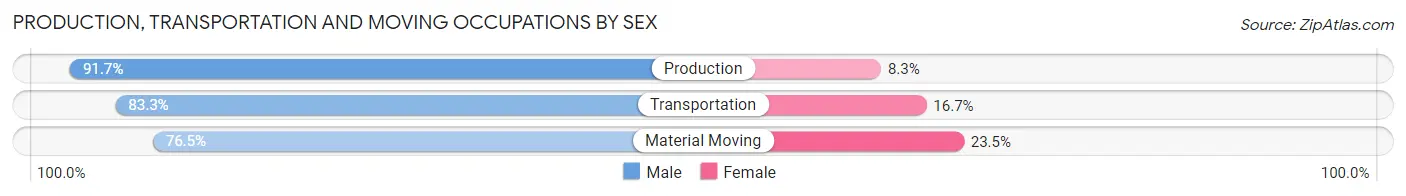
| Occupation | Male | Female |
| Production | 66 (91.7%) | 6 (8.3%) |
| Transportation | 20 (83.3%) | 4 (16.7%) |
| Material Moving | 26 (76.5%) | 8 (23.5%) |
| Total (Category) | 112 (86.2%) | 18 (13.9%) |
| Total (Overall) | 333 (51.3%) | 316 (48.7%) |
Employment Industries by Sex in Warsaw
Employment Industries in Warsaw
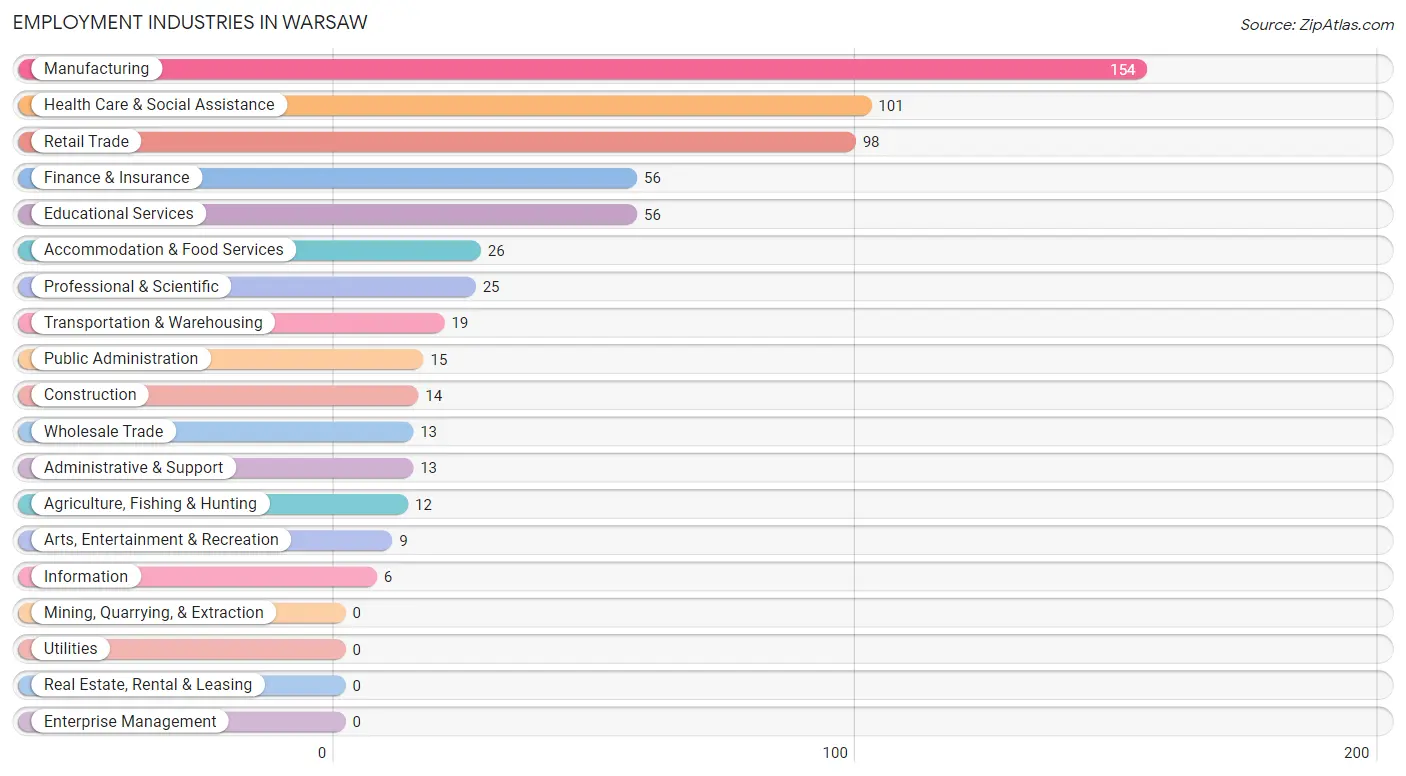
The major employment industries in Warsaw include Manufacturing (154 | 23.7%), Health Care & Social Assistance (101 | 15.6%), Retail Trade (98 | 15.1%), Finance & Insurance (56 | 8.6%), and Educational Services (56 | 8.6%).
Employment Industries by Sex in Warsaw
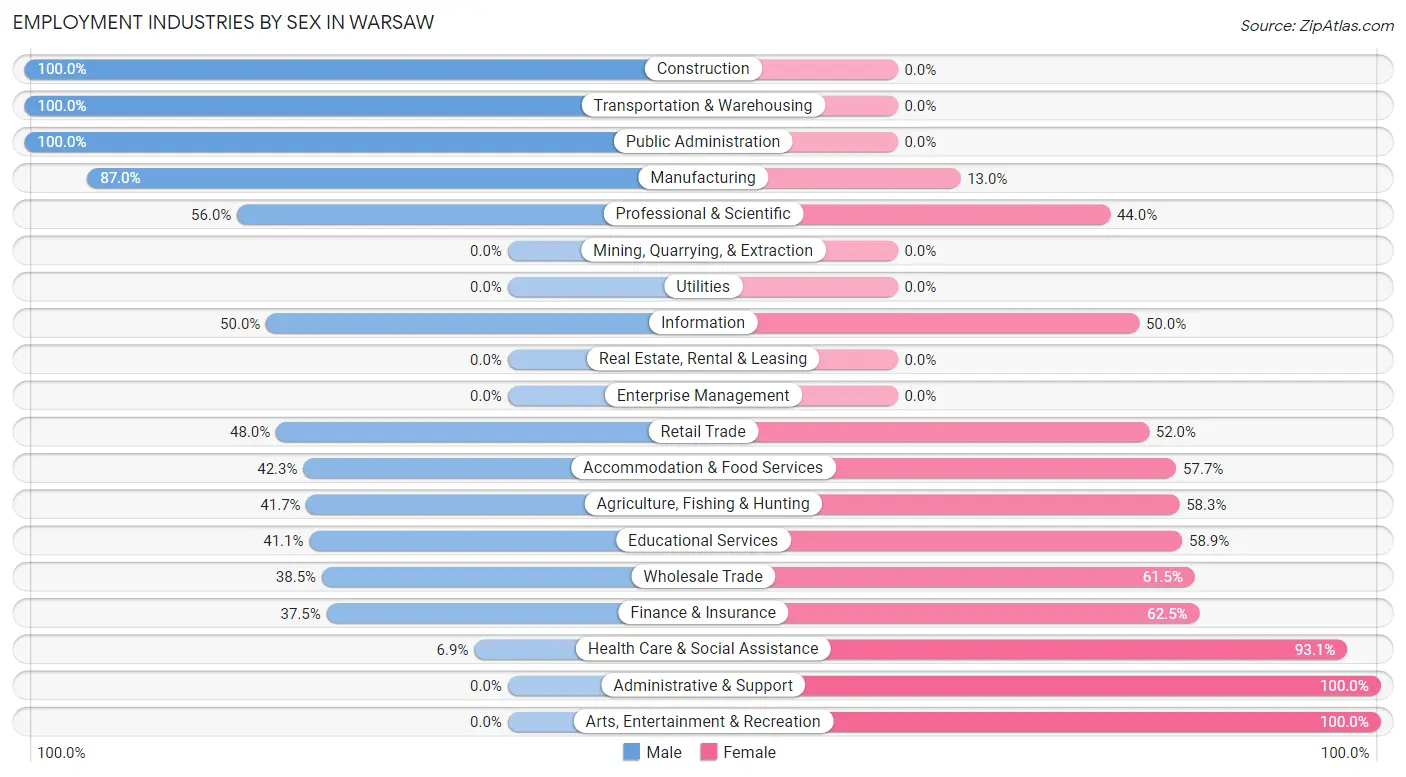
The Warsaw industries that see more men than women are Construction (100.0%), Transportation & Warehousing (100.0%), and Public Administration (100.0%), whereas the industries that tend to have a higher number of women are Administrative & Support (100.0%), Arts, Entertainment & Recreation (100.0%), and Health Care & Social Assistance (93.1%).
| Industry | Male | Female |
| Agriculture, Fishing & Hunting | 5 (41.7%) | 7 (58.3%) |
| Mining, Quarrying, & Extraction | 0 (0.0%) | 0 (0.0%) |
| Construction | 14 (100.0%) | 0 (0.0%) |
| Manufacturing | 134 (87.0%) | 20 (13.0%) |
| Wholesale Trade | 5 (38.5%) | 8 (61.5%) |
| Retail Trade | 47 (48.0%) | 51 (52.0%) |
| Transportation & Warehousing | 19 (100.0%) | 0 (0.0%) |
| Utilities | 0 (0.0%) | 0 (0.0%) |
| Information | 3 (50.0%) | 3 (50.0%) |
| Finance & Insurance | 21 (37.5%) | 35 (62.5%) |
| Real Estate, Rental & Leasing | 0 (0.0%) | 0 (0.0%) |
| Professional & Scientific | 14 (56.0%) | 11 (44.0%) |
| Enterprise Management | 0 (0.0%) | 0 (0.0%) |
| Administrative & Support | 0 (0.0%) | 13 (100.0%) |
| Educational Services | 23 (41.1%) | 33 (58.9%) |
| Health Care & Social Assistance | 7 (6.9%) | 94 (93.1%) |
| Arts, Entertainment & Recreation | 0 (0.0%) | 9 (100.0%) |
| Accommodation & Food Services | 11 (42.3%) | 15 (57.7%) |
| Public Administration | 15 (100.0%) | 0 (0.0%) |
| Total | 333 (51.3%) | 316 (48.7%) |
Education in Warsaw
School Enrollment in Warsaw
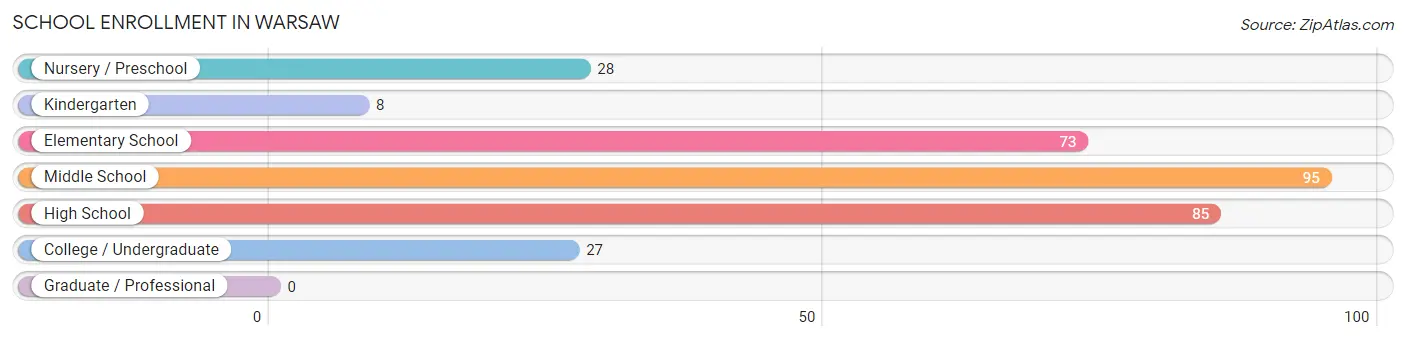
The most common levels of schooling among the 316 students in Warsaw are middle school (95 | 30.1%), high school (85 | 26.9%), and elementary school (73 | 23.1%).
| School Level | # Students | % Students |
| Nursery / Preschool | 28 | 8.9% |
| Kindergarten | 8 | 2.5% |
| Elementary School | 73 | 23.1% |
| Middle School | 95 | 30.1% |
| High School | 85 | 26.9% |
| College / Undergraduate | 27 | 8.5% |
| Graduate / Professional | 0 | 0.0% |
| Total | 316 | 100.0% |
School Enrollment by Age by Funding Source in Warsaw
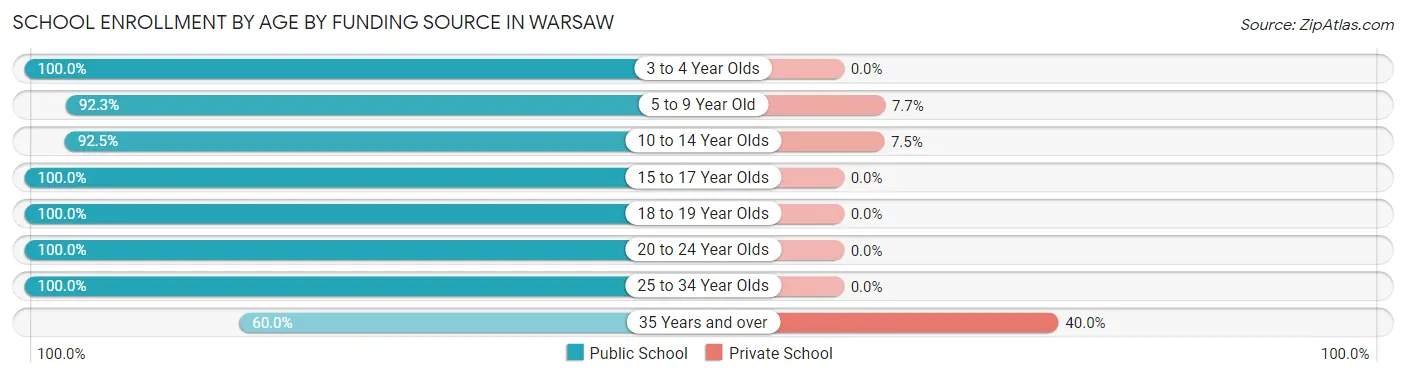
Out of a total of 316 students who are enrolled in schools in Warsaw, 22 (7.0%) attend a private institution, while the remaining 294 (93.0%) are enrolled in public schools. The age group of 35 years and over has the highest likelihood of being enrolled in private schools, with 6 (40.0% in the age bracket) enrolled. Conversely, the age group of 3 to 4 year olds has the lowest likelihood of being enrolled in a private school, with 5 (100.0% in the age bracket) attending a public institution.
| Age Bracket | Public School | Private School |
| 3 to 4 Year Olds | 5 (100.0%) | 0 (0.0%) |
| 5 to 9 Year Old | 84 (92.3%) | 7 (7.7%) |
| 10 to 14 Year Olds | 111 (92.5%) | 9 (7.5%) |
| 15 to 17 Year Olds | 65 (100.0%) | 0 (0.0%) |
| 18 to 19 Year Olds | 3 (100.0%) | 0 (0.0%) |
| 20 to 24 Year Olds | 4 (100.0%) | 0 (0.0%) |
| 25 to 34 Year Olds | 13 (100.0%) | 0 (0.0%) |
| 35 Years and over | 9 (60.0%) | 6 (40.0%) |
| Total | 294 (93.0%) | 22 (7.0%) |
Educational Attainment by Field of Study in Warsaw
Education (59 | 24.3%), business (41 | 16.9%), science & technology (32 | 13.2%), physical & health sciences (25 | 10.3%), and engineering (25 | 10.3%) are the most common fields of study among 243 individuals in Warsaw who have obtained a bachelor's degree or higher.
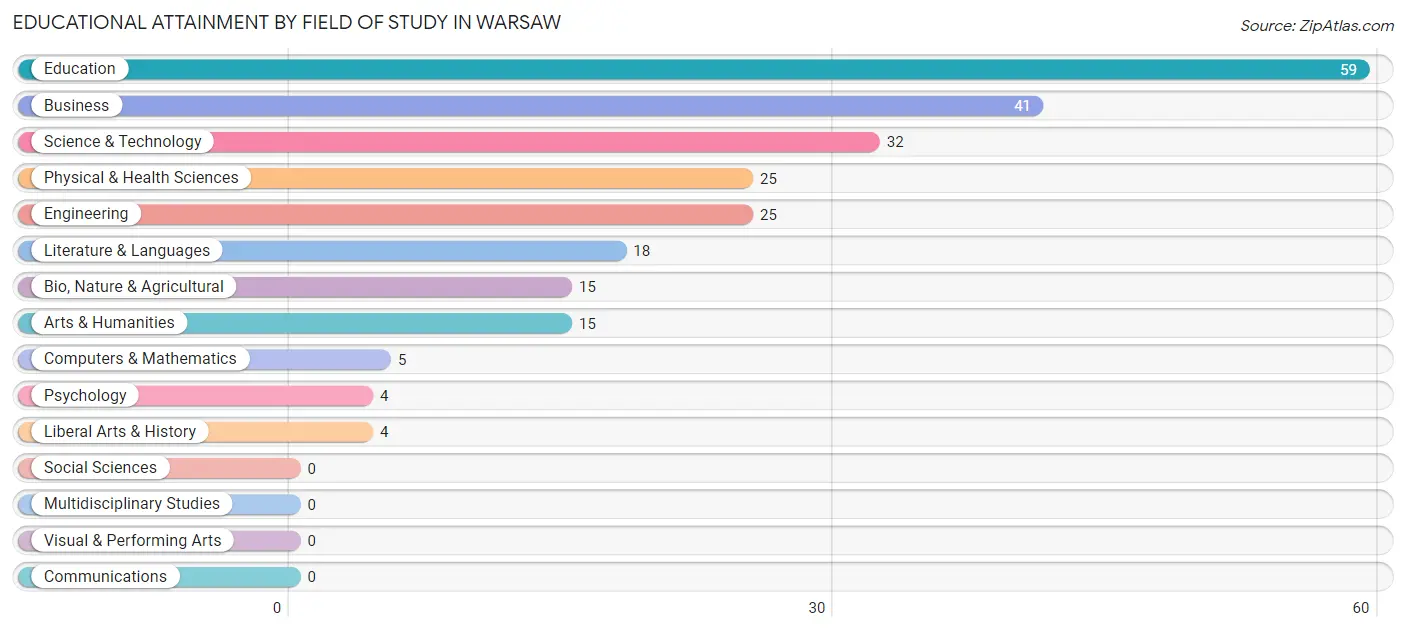
| Field of Study | # Graduates | % Graduates |
| Computers & Mathematics | 5 | 2.1% |
| Bio, Nature & Agricultural | 15 | 6.2% |
| Physical & Health Sciences | 25 | 10.3% |
| Psychology | 4 | 1.7% |
| Social Sciences | 0 | 0.0% |
| Engineering | 25 | 10.3% |
| Multidisciplinary Studies | 0 | 0.0% |
| Science & Technology | 32 | 13.2% |
| Business | 41 | 16.9% |
| Education | 59 | 24.3% |
| Literature & Languages | 18 | 7.4% |
| Liberal Arts & History | 4 | 1.7% |
| Visual & Performing Arts | 0 | 0.0% |
| Communications | 0 | 0.0% |
| Arts & Humanities | 15 | 6.2% |
| Total | 243 | 100.0% |
Transportation & Commute in Warsaw
Vehicle Availability by Sex in Warsaw
The most prevalent vehicle ownership categories in Warsaw are males with 2 vehicles (156, accounting for 47.6%) and females with 2 vehicles (141, making up 51.3%).
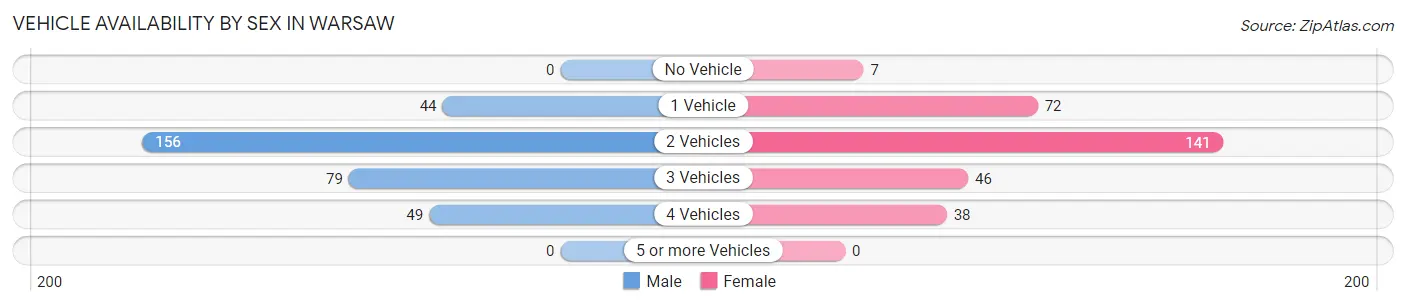
| Vehicles Available | Male | Female |
| No Vehicle | 0 (0.0%) | 7 (2.3%) |
| 1 Vehicle | 44 (13.4%) | 72 (23.7%) |
| 2 Vehicles | 156 (47.6%) | 141 (46.4%) |
| 3 Vehicles | 79 (24.1%) | 46 (15.1%) |
| 4 Vehicles | 49 (14.9%) | 38 (12.5%) |
| 5 or more Vehicles | 0 (0.0%) | 0 (0.0%) |
| Total | 328 (100.0%) | 304 (100.0%) |
Commute Time in Warsaw
The most frequently occuring commute durations in Warsaw are 15 to 19 minutes (86 commuters, 15.0%), 20 to 24 minutes (85 commuters, 14.8%), and 45 to 59 minutes (71 commuters, 12.4%).
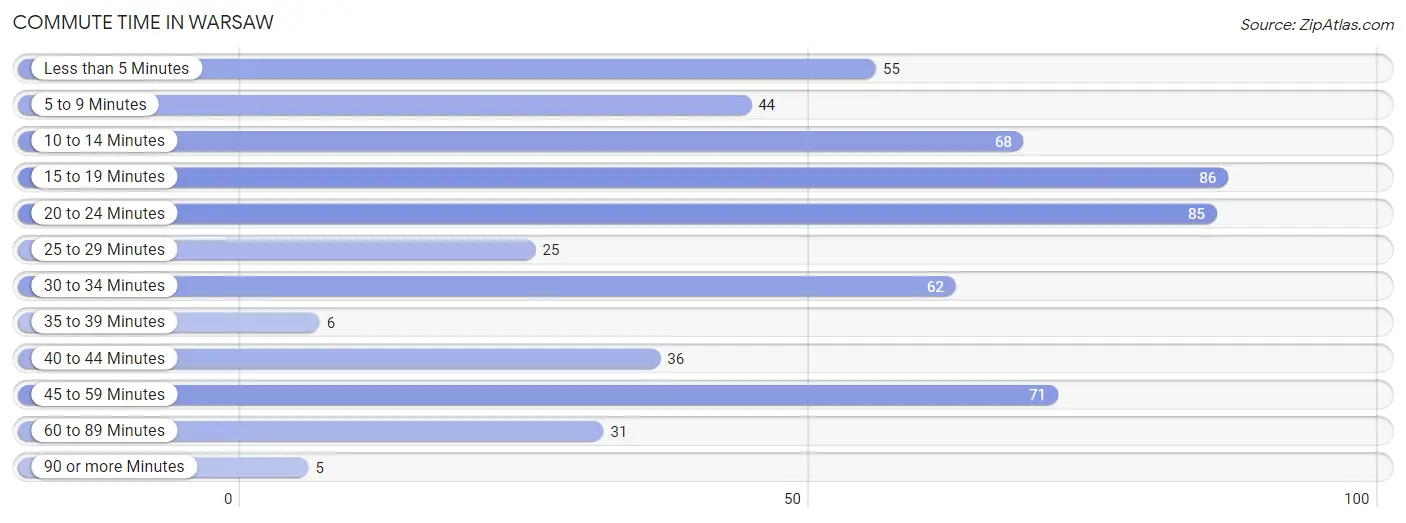
| Commute Time | # Commuters | % Commuters |
| Less than 5 Minutes | 55 | 9.6% |
| 5 to 9 Minutes | 44 | 7.7% |
| 10 to 14 Minutes | 68 | 11.8% |
| 15 to 19 Minutes | 86 | 15.0% |
| 20 to 24 Minutes | 85 | 14.8% |
| 25 to 29 Minutes | 25 | 4.4% |
| 30 to 34 Minutes | 62 | 10.8% |
| 35 to 39 Minutes | 6 | 1.1% |
| 40 to 44 Minutes | 36 | 6.3% |
| 45 to 59 Minutes | 71 | 12.4% |
| 60 to 89 Minutes | 31 | 5.4% |
| 90 or more Minutes | 5 | 0.9% |
Commute Time by Sex in Warsaw
The most common commute times in Warsaw are 15 to 19 minutes (50 commuters, 15.8%) for males and 20 to 24 minutes (42 commuters, 16.3%) for females.
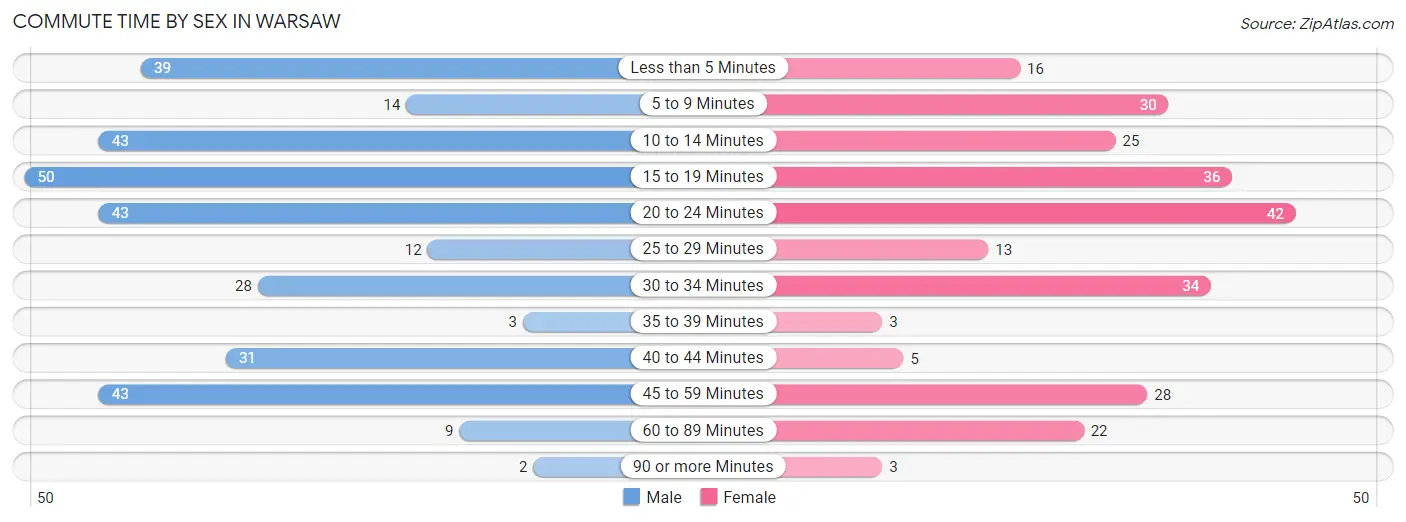
| Commute Time | Male | Female |
| Less than 5 Minutes | 39 (12.3%) | 16 (6.2%) |
| 5 to 9 Minutes | 14 (4.4%) | 30 (11.7%) |
| 10 to 14 Minutes | 43 (13.6%) | 25 (9.7%) |
| 15 to 19 Minutes | 50 (15.8%) | 36 (14.0%) |
| 20 to 24 Minutes | 43 (13.6%) | 42 (16.3%) |
| 25 to 29 Minutes | 12 (3.8%) | 13 (5.1%) |
| 30 to 34 Minutes | 28 (8.8%) | 34 (13.2%) |
| 35 to 39 Minutes | 3 (0.9%) | 3 (1.2%) |
| 40 to 44 Minutes | 31 (9.8%) | 5 (1.9%) |
| 45 to 59 Minutes | 43 (13.6%) | 28 (10.9%) |
| 60 to 89 Minutes | 9 (2.8%) | 22 (8.6%) |
| 90 or more Minutes | 2 (0.6%) | 3 (1.2%) |
Time of Departure to Work by Sex in Warsaw
The most frequent times of departure to work in Warsaw are 7:00 AM to 7:29 AM (66, 20.8%) for males and 7:30 AM to 7:59 AM (49, 19.1%) for females.
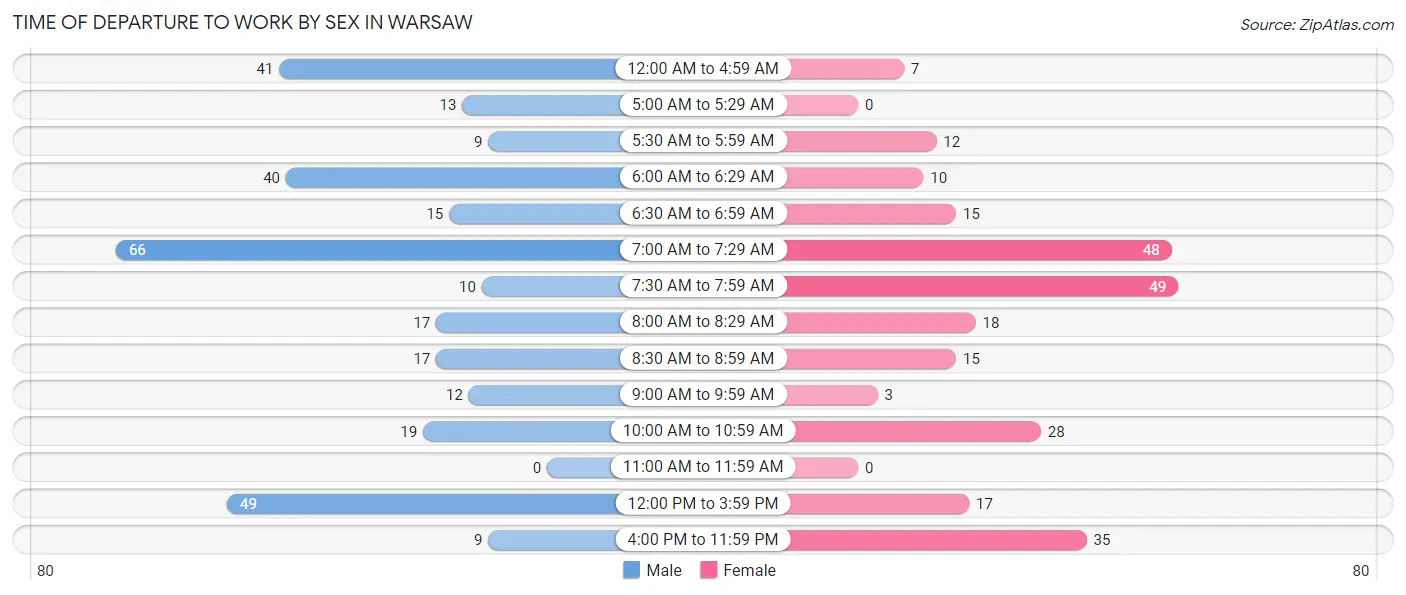
| Time of Departure | Male | Female |
| 12:00 AM to 4:59 AM | 41 (12.9%) | 7 (2.7%) |
| 5:00 AM to 5:29 AM | 13 (4.1%) | 0 (0.0%) |
| 5:30 AM to 5:59 AM | 9 (2.8%) | 12 (4.7%) |
| 6:00 AM to 6:29 AM | 40 (12.6%) | 10 (3.9%) |
| 6:30 AM to 6:59 AM | 15 (4.7%) | 15 (5.8%) |
| 7:00 AM to 7:29 AM | 66 (20.8%) | 48 (18.7%) |
| 7:30 AM to 7:59 AM | 10 (3.2%) | 49 (19.1%) |
| 8:00 AM to 8:29 AM | 17 (5.4%) | 18 (7.0%) |
| 8:30 AM to 8:59 AM | 17 (5.4%) | 15 (5.8%) |
| 9:00 AM to 9:59 AM | 12 (3.8%) | 3 (1.2%) |
| 10:00 AM to 10:59 AM | 19 (6.0%) | 28 (10.9%) |
| 11:00 AM to 11:59 AM | 0 (0.0%) | 0 (0.0%) |
| 12:00 PM to 3:59 PM | 49 (15.5%) | 17 (6.6%) |
| 4:00 PM to 11:59 PM | 9 (2.8%) | 35 (13.6%) |
| Total | 317 (100.0%) | 257 (100.0%) |
Housing Occupancy in Warsaw
Occupancy by Ownership in Warsaw
Of the total 685 dwellings in Warsaw, owner-occupied units account for 577 (84.2%), while renter-occupied units make up 108 (15.8%).
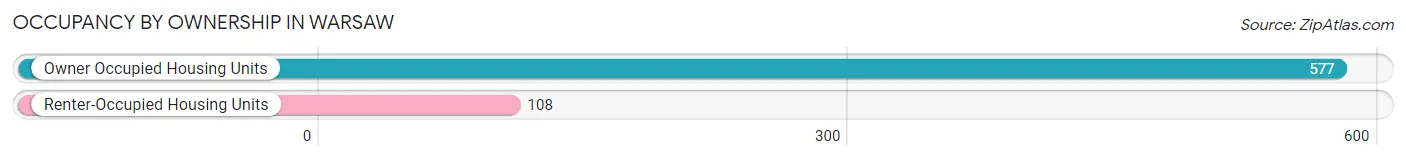
| Occupancy | # Housing Units | % Housing Units |
| Owner Occupied Housing Units | 577 | 84.2% |
| Renter-Occupied Housing Units | 108 | 15.8% |
| Total Occupied Housing Units | 685 | 100.0% |
Occupancy by Household Size in Warsaw
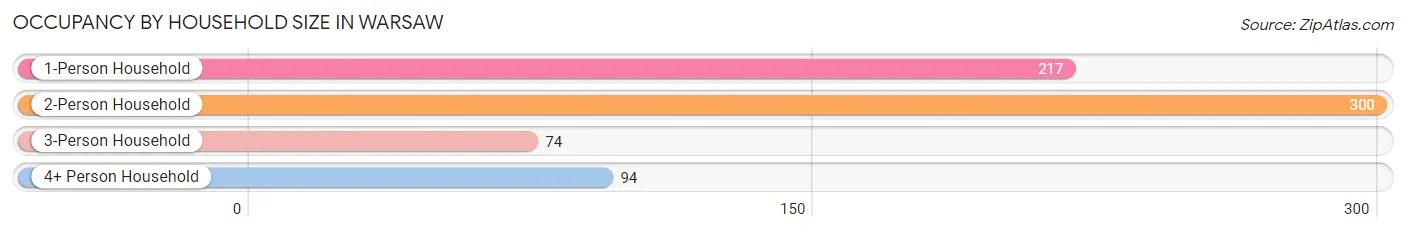
| Household Size | # Housing Units | % Housing Units |
| 1-Person Household | 217 | 31.7% |
| 2-Person Household | 300 | 43.8% |
| 3-Person Household | 74 | 10.8% |
| 4+ Person Household | 94 | 13.7% |
| Total Housing Units | 685 | 100.0% |
Occupancy by Ownership by Household Size in Warsaw
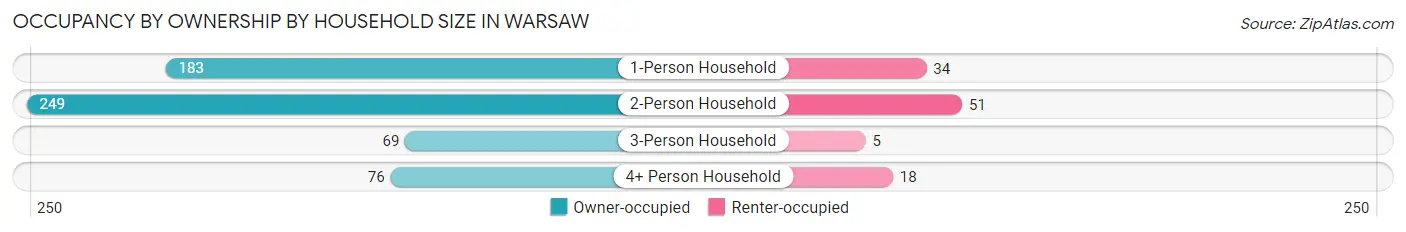
| Household Size | Owner-occupied | Renter-occupied |
| 1-Person Household | 183 (84.3%) | 34 (15.7%) |
| 2-Person Household | 249 (83.0%) | 51 (17.0%) |
| 3-Person Household | 69 (93.2%) | 5 (6.8%) |
| 4+ Person Household | 76 (80.8%) | 18 (19.2%) |
| Total Housing Units | 577 (84.2%) | 108 (15.8%) |
Occupancy by Educational Attainment in Warsaw
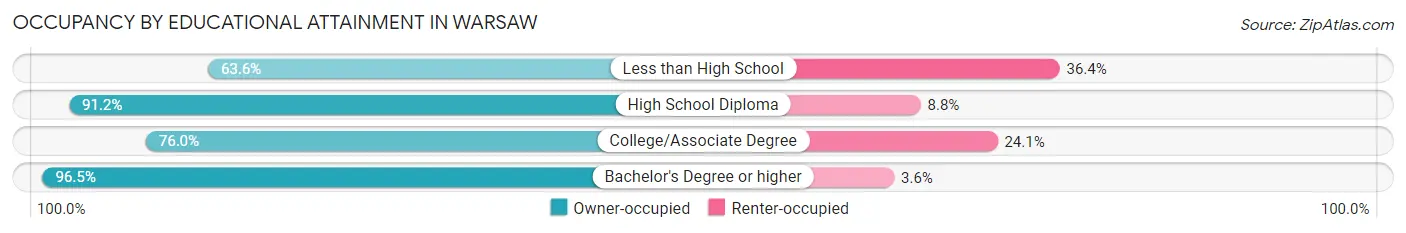
| Household Size | Owner-occupied | Renter-occupied |
| Less than High School | 35 (63.6%) | 20 (36.4%) |
| High School Diploma | 207 (91.2%) | 20 (8.8%) |
| College/Associate Degree | 199 (75.9%) | 63 (24.0%) |
| Bachelor's Degree or higher | 136 (96.5%) | 5 (3.5%) |
Occupancy by Age of Householder in Warsaw
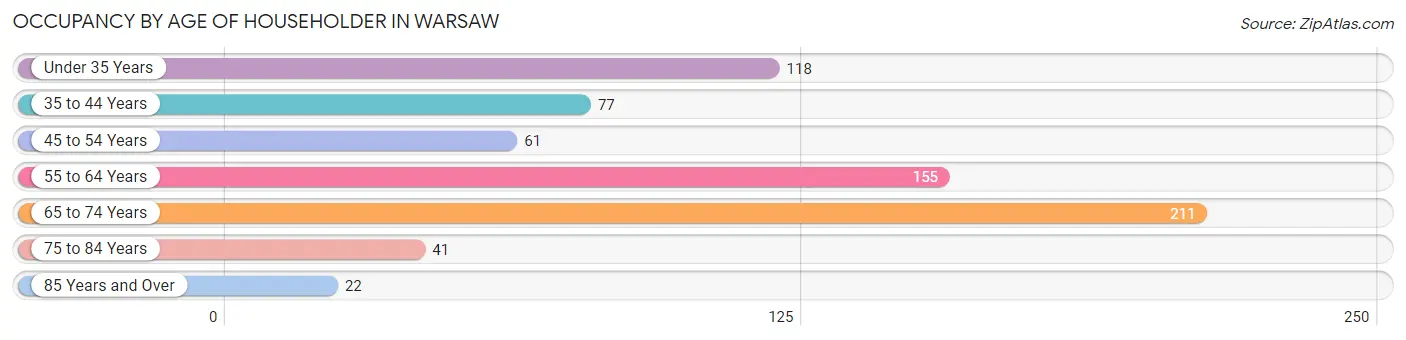
| Age Bracket | # Households | % Households |
| Under 35 Years | 118 | 17.2% |
| 35 to 44 Years | 77 | 11.2% |
| 45 to 54 Years | 61 | 8.9% |
| 55 to 64 Years | 155 | 22.6% |
| 65 to 74 Years | 211 | 30.8% |
| 75 to 84 Years | 41 | 6.0% |
| 85 Years and Over | 22 | 3.2% |
| Total | 685 | 100.0% |
Housing Finances in Warsaw
Median Income by Occupancy in Warsaw
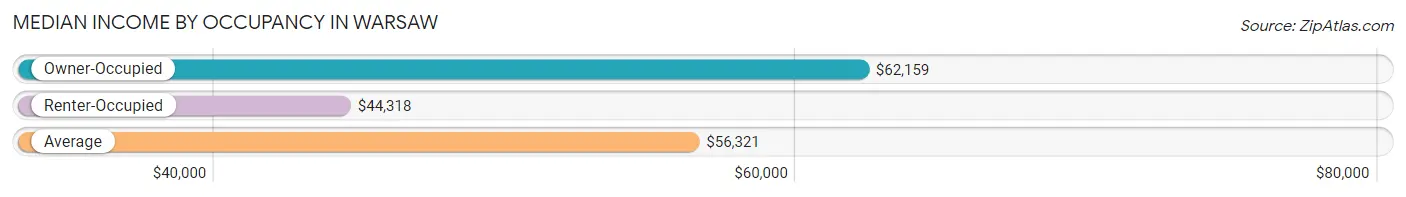
| Occupancy Type | # Households | Median Income |
| Owner-Occupied | 577 (84.2%) | $62,159 |
| Renter-Occupied | 108 (15.8%) | $44,318 |
| Average | 685 (100.0%) | $56,321 |
Occupancy by Householder Income Bracket in Warsaw
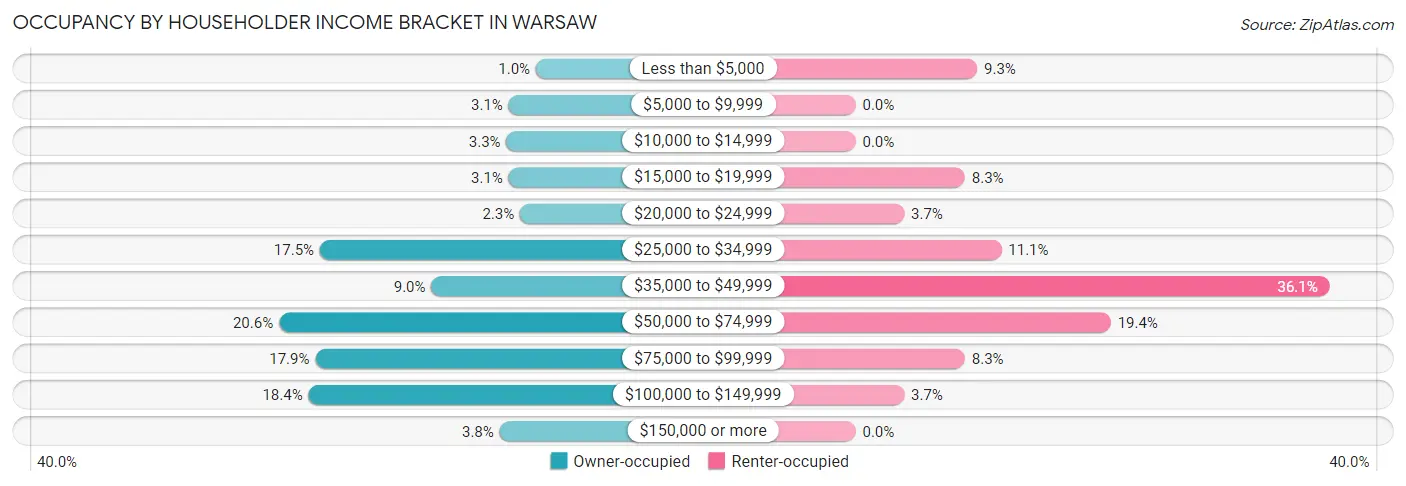
| Income Bracket | Owner-occupied | Renter-occupied |
| Less than $5,000 | 6 (1.0%) | 10 (9.3%) |
| $5,000 to $9,999 | 18 (3.1%) | 0 (0.0%) |
| $10,000 to $14,999 | 19 (3.3%) | 0 (0.0%) |
| $15,000 to $19,999 | 18 (3.1%) | 9 (8.3%) |
| $20,000 to $24,999 | 13 (2.2%) | 4 (3.7%) |
| $25,000 to $34,999 | 101 (17.5%) | 12 (11.1%) |
| $35,000 to $49,999 | 52 (9.0%) | 39 (36.1%) |
| $50,000 to $74,999 | 119 (20.6%) | 21 (19.4%) |
| $75,000 to $99,999 | 103 (17.8%) | 9 (8.3%) |
| $100,000 to $149,999 | 106 (18.4%) | 4 (3.7%) |
| $150,000 or more | 22 (3.8%) | 0 (0.0%) |
| Total | 577 (100.0%) | 108 (100.0%) |
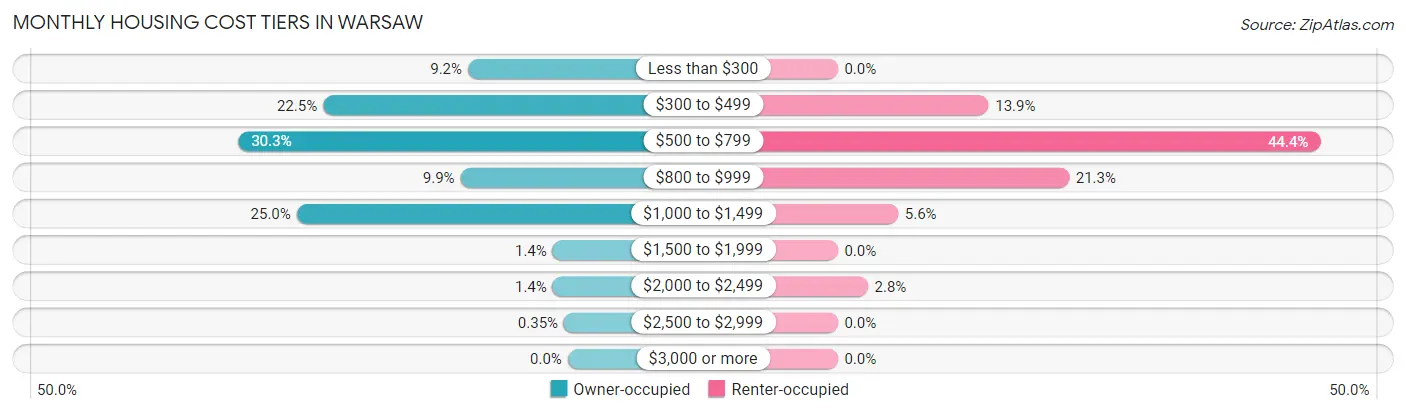
Monthly Housing Cost Tiers in Warsaw
| Monthly Cost | Owner-occupied | Renter-occupied |
| Less than $300 | 53 (9.2%) | 0 (0.0%) |
| $300 to $499 | 130 (22.5%) | 15 (13.9%) |
| $500 to $799 | 175 (30.3%) | 48 (44.4%) |
| $800 to $999 | 57 (9.9%) | 23 (21.3%) |
| $1,000 to $1,499 | 144 (25.0%) | 6 (5.6%) |
| $1,500 to $1,999 | 8 (1.4%) | 0 (0.0%) |
| $2,000 to $2,499 | 8 (1.4%) | 3 (2.8%) |
| $2,500 to $2,999 | 2 (0.4%) | 0 (0.0%) |
| $3,000 or more | 0 (0.0%) | 0 (0.0%) |
| Total | 577 (100.0%) | 108 (100.0%) |
Physical Housing Characteristics in Warsaw
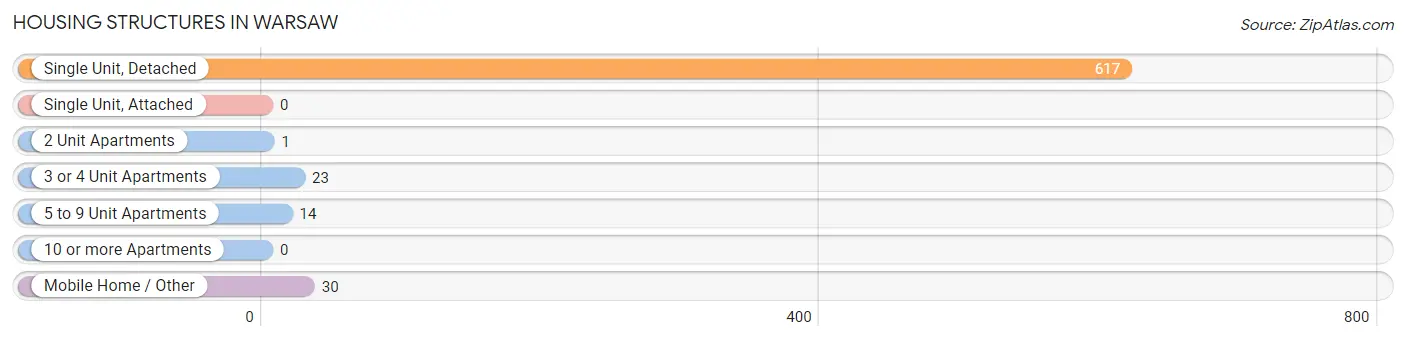
Housing Structures in Warsaw
| Structure Type | # Housing Units | % Housing Units |
| Single Unit, Detached | 617 | 90.1% |
| Single Unit, Attached | 0 | 0.0% |
| 2 Unit Apartments | 1 | 0.2% |
| 3 or 4 Unit Apartments | 23 | 3.4% |
| 5 to 9 Unit Apartments | 14 | 2.0% |
| 10 or more Apartments | 0 | 0.0% |
| Mobile Home / Other | 30 | 4.4% |
| Total | 685 | 100.0% |
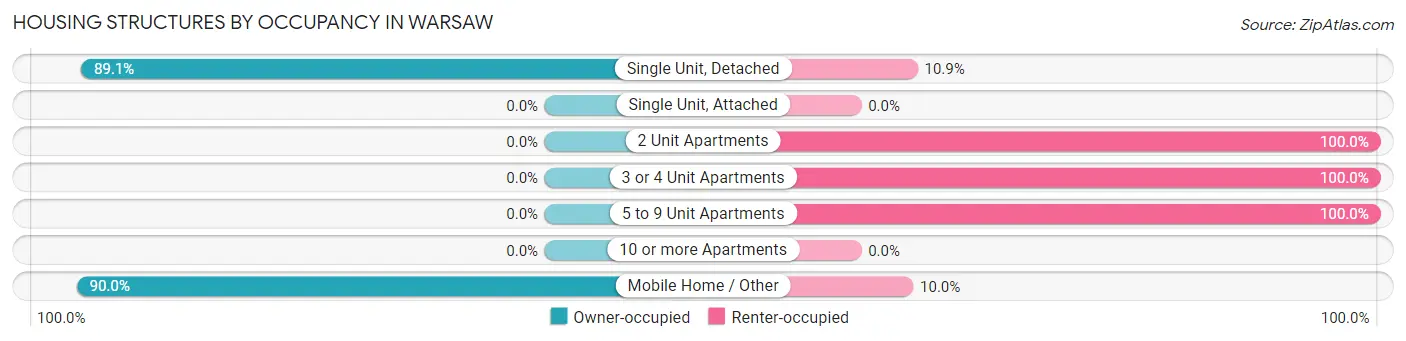
Housing Structures by Occupancy in Warsaw
| Structure Type | Owner-occupied | Renter-occupied |
| Single Unit, Detached | 550 (89.1%) | 67 (10.9%) |
| Single Unit, Attached | 0 (0.0%) | 0 (0.0%) |
| 2 Unit Apartments | 0 (0.0%) | 1 (100.0%) |
| 3 or 4 Unit Apartments | 0 (0.0%) | 23 (100.0%) |
| 5 to 9 Unit Apartments | 0 (0.0%) | 14 (100.0%) |
| 10 or more Apartments | 0 (0.0%) | 0 (0.0%) |
| Mobile Home / Other | 27 (90.0%) | 3 (10.0%) |
| Total | 577 (84.2%) | 108 (15.8%) |
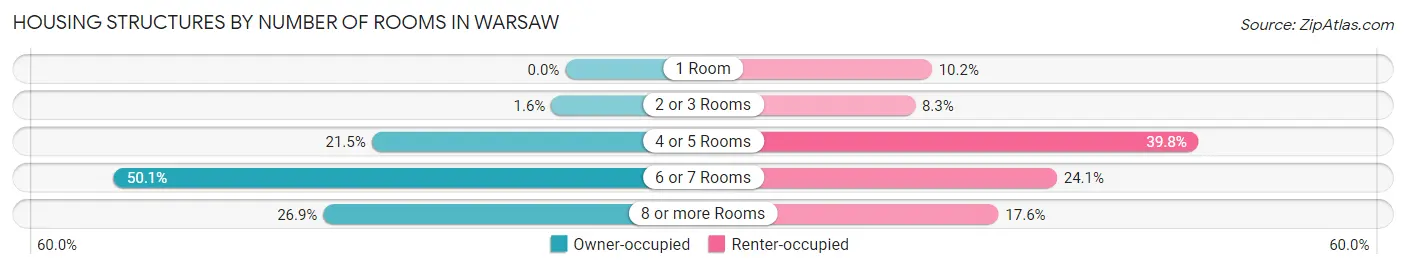
Housing Structures by Number of Rooms in Warsaw
| Number of Rooms | Owner-occupied | Renter-occupied |
| 1 Room | 0 (0.0%) | 11 (10.2%) |
| 2 or 3 Rooms | 9 (1.6%) | 9 (8.3%) |
| 4 or 5 Rooms | 124 (21.5%) | 43 (39.8%) |
| 6 or 7 Rooms | 289 (50.1%) | 26 (24.1%) |
| 8 or more Rooms | 155 (26.9%) | 19 (17.6%) |
| Total | 577 (100.0%) | 108 (100.0%) |
Housing Structure by Heating Type in Warsaw
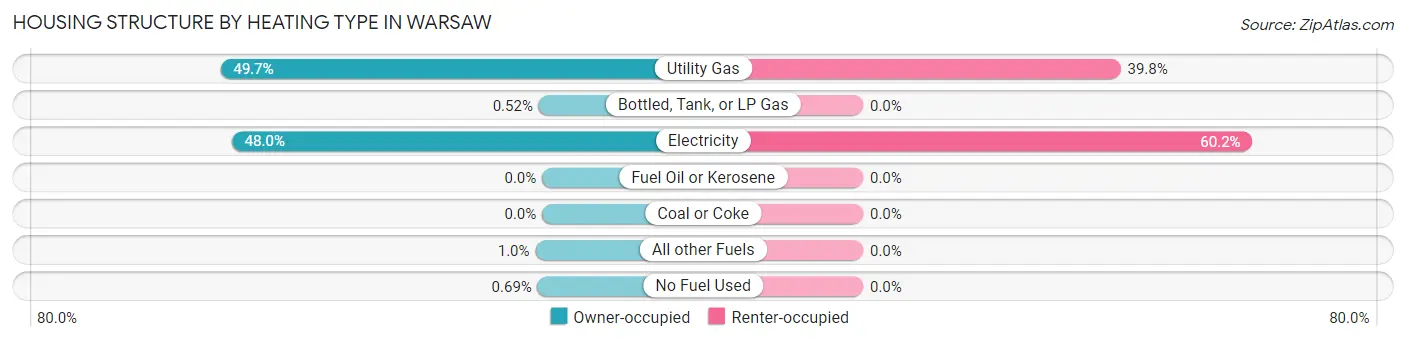
| Heating Type | Owner-occupied | Renter-occupied |
| Utility Gas | 287 (49.7%) | 43 (39.8%) |
| Bottled, Tank, or LP Gas | 3 (0.5%) | 0 (0.0%) |
| Electricity | 277 (48.0%) | 65 (60.2%) |
| Fuel Oil or Kerosene | 0 (0.0%) | 0 (0.0%) |
| Coal or Coke | 0 (0.0%) | 0 (0.0%) |
| All other Fuels | 6 (1.0%) | 0 (0.0%) |
| No Fuel Used | 4 (0.7%) | 0 (0.0%) |
| Total | 577 (100.0%) | 108 (100.0%) |
Household Vehicle Usage in Warsaw
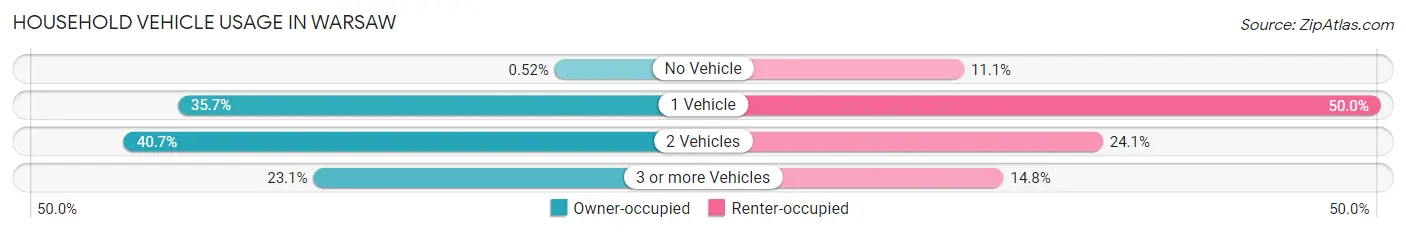
| Vehicles per Household | Owner-occupied | Renter-occupied |
| No Vehicle | 3 (0.5%) | 12 (11.1%) |
| 1 Vehicle | 206 (35.7%) | 54 (50.0%) |
| 2 Vehicles | 235 (40.7%) | 26 (24.1%) |
| 3 or more Vehicles | 133 (23.1%) | 16 (14.8%) |
| Total | 577 (100.0%) | 108 (100.0%) |
Real Estate & Mortgages in Warsaw
Real Estate and Mortgage Overview in Warsaw
| Characteristic | Without Mortgage | With Mortgage |
| Housing Units | 317 | 260 |
| Median Property Value | $86,100 | $104,700 |
| Median Household Income | $41,875 | $3 |
| Monthly Housing Costs | $481 | $0 |
| Real Estate Taxes | $2,176 | $3 |
Property Value by Mortgage Status in Warsaw
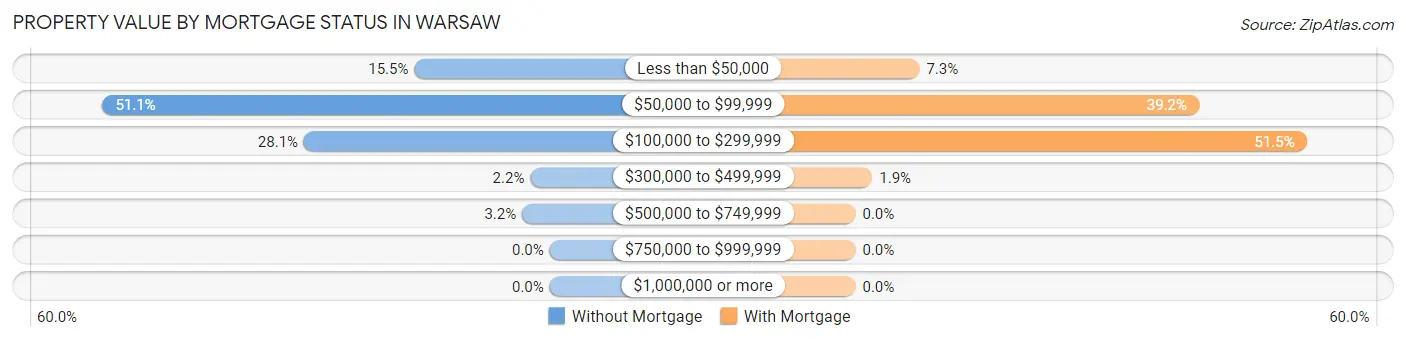
| Property Value | Without Mortgage | With Mortgage |
| Less than $50,000 | 49 (15.5%) | 19 (7.3%) |
| $50,000 to $99,999 | 162 (51.1%) | 102 (39.2%) |
| $100,000 to $299,999 | 89 (28.1%) | 134 (51.5%) |
| $300,000 to $499,999 | 7 (2.2%) | 5 (1.9%) |
| $500,000 to $749,999 | 10 (3.2%) | 0 (0.0%) |
| $750,000 to $999,999 | 0 (0.0%) | 0 (0.0%) |
| $1,000,000 or more | 0 (0.0%) | 0 (0.0%) |
| Total | 317 (100.0%) | 260 (100.0%) |
Household Income by Mortgage Status in Warsaw
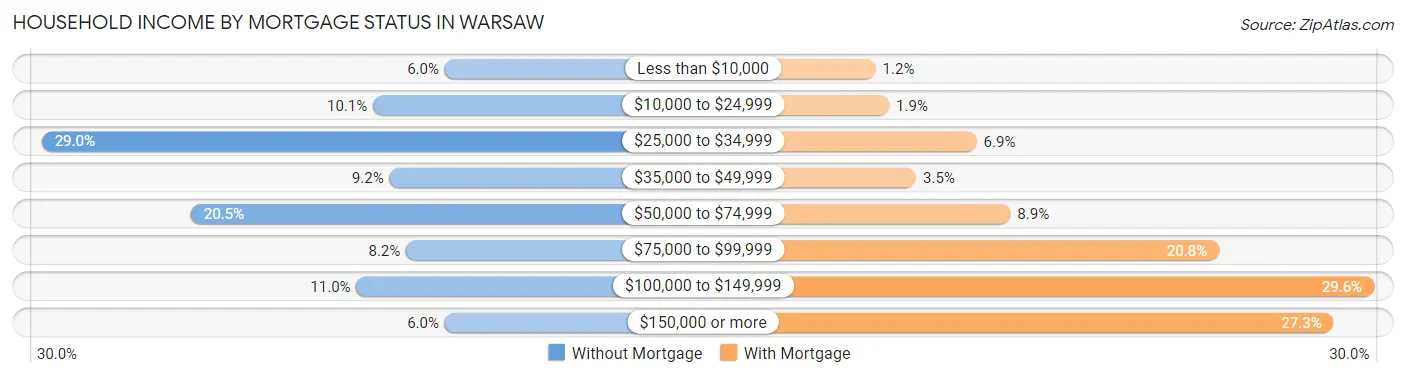
| Household Income | Without Mortgage | With Mortgage |
| Less than $10,000 | 19 (6.0%) | 3 (1.1%) |
| $10,000 to $24,999 | 32 (10.1%) | 5 (1.9%) |
| $25,000 to $34,999 | 92 (29.0%) | 18 (6.9%) |
| $35,000 to $49,999 | 29 (9.1%) | 9 (3.5%) |
| $50,000 to $74,999 | 65 (20.5%) | 23 (8.8%) |
| $75,000 to $99,999 | 26 (8.2%) | 54 (20.8%) |
| $100,000 to $149,999 | 35 (11.0%) | 77 (29.6%) |
| $150,000 or more | 19 (6.0%) | 71 (27.3%) |
| Total | 317 (100.0%) | 260 (100.0%) |
Property Value to Household Income Ratio in Warsaw
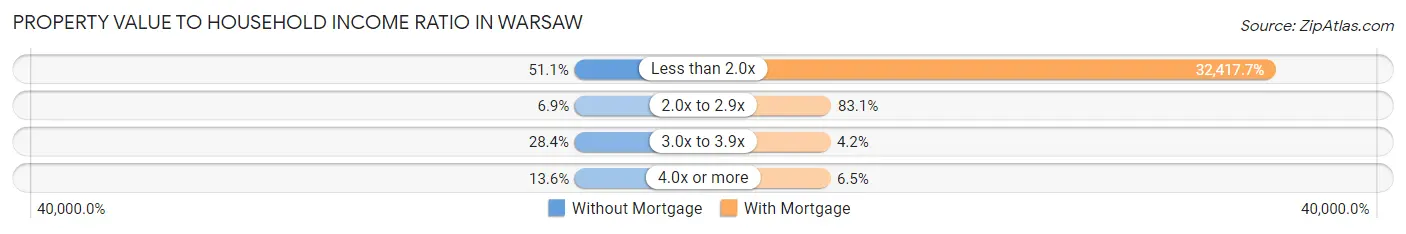
| Value-to-Income Ratio | Without Mortgage | With Mortgage |
| Less than 2.0x | 162 (51.1%) | 84,286 (32,417.7%) |
| 2.0x to 2.9x | 22 (6.9%) | 216 (83.1%) |
| 3.0x to 3.9x | 90 (28.4%) | 11 (4.2%) |
| 4.0x or more | 43 (13.6%) | 17 (6.5%) |
| Total | 317 (100.0%) | 260 (100.0%) |
Real Estate Taxes by Mortgage Status in Warsaw
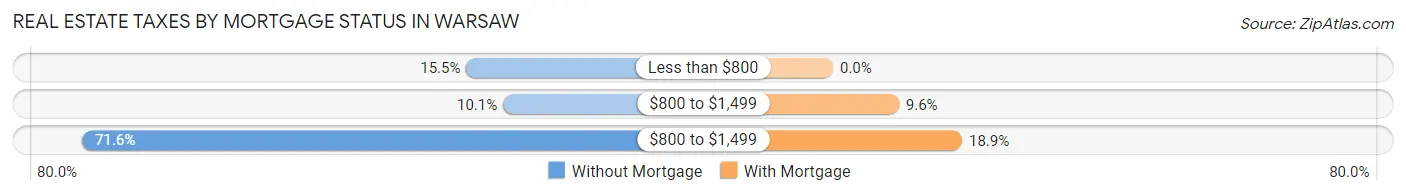
| Property Taxes | Without Mortgage | With Mortgage |
| Less than $800 | 49 (15.5%) | 0 (0.0%) |
| $800 to $1,499 | 32 (10.1%) | 25 (9.6%) |
| $800 to $1,499 | 227 (71.6%) | 49 (18.9%) |
| Total | 317 (100.0%) | 260 (100.0%) |
Health & Disability in Warsaw
Health Insurance Coverage by Age in Warsaw
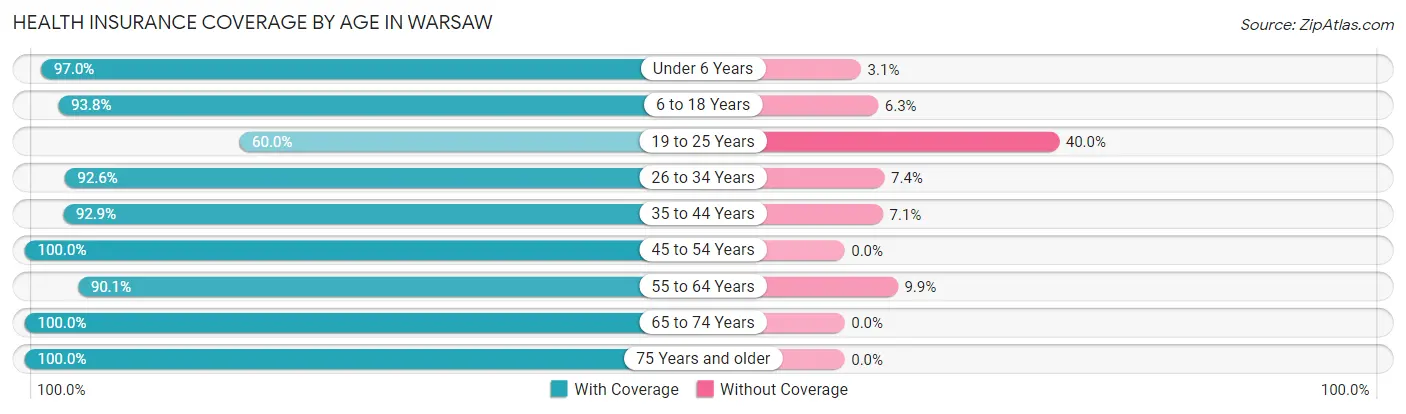
| Age Bracket | With Coverage | Without Coverage |
| Under 6 Years | 127 (97.0%) | 4 (3.0%) |
| 6 to 18 Years | 240 (93.8%) | 16 (6.2%) |
| 19 to 25 Years | 24 (60.0%) | 16 (40.0%) |
| 26 to 34 Years | 187 (92.6%) | 15 (7.4%) |
| 35 to 44 Years | 130 (92.9%) | 10 (7.1%) |
| 45 to 54 Years | 124 (100.0%) | 0 (0.0%) |
| 55 to 64 Years | 227 (90.1%) | 25 (9.9%) |
| 65 to 74 Years | 313 (100.0%) | 0 (0.0%) |
| 75 Years and older | 80 (100.0%) | 0 (0.0%) |
| Total | 1,452 (94.4%) | 86 (5.6%) |
Health Insurance Coverage by Citizenship Status in Warsaw
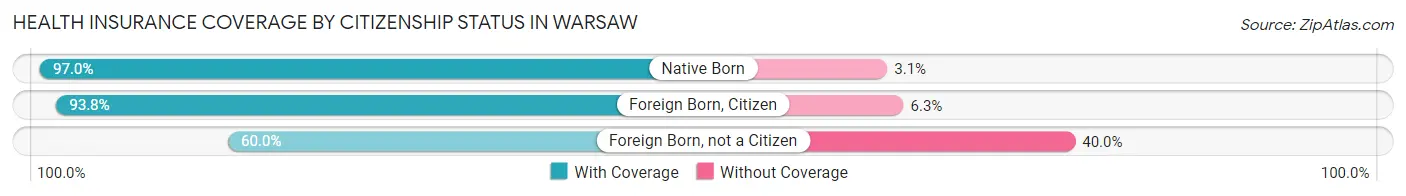
| Citizenship Status | With Coverage | Without Coverage |
| Native Born | 127 (97.0%) | 4 (3.0%) |
| Foreign Born, Citizen | 240 (93.8%) | 16 (6.2%) |
| Foreign Born, not a Citizen | 24 (60.0%) | 16 (40.0%) |
Health Insurance Coverage by Household Income in Warsaw
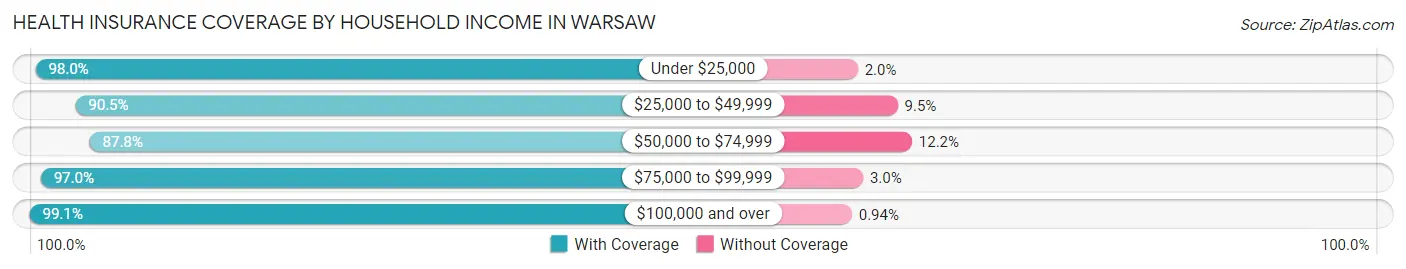
| Household Income | With Coverage | Without Coverage |
| Under $25,000 | 144 (98.0%) | 3 (2.0%) |
| $25,000 to $49,999 | 285 (90.5%) | 30 (9.5%) |
| $50,000 to $74,999 | 281 (87.8%) | 39 (12.2%) |
| $75,000 to $99,999 | 320 (97.0%) | 10 (3.0%) |
| $100,000 and over | 422 (99.1%) | 4 (0.9%) |
Public vs Private Health Insurance Coverage by Age in Warsaw
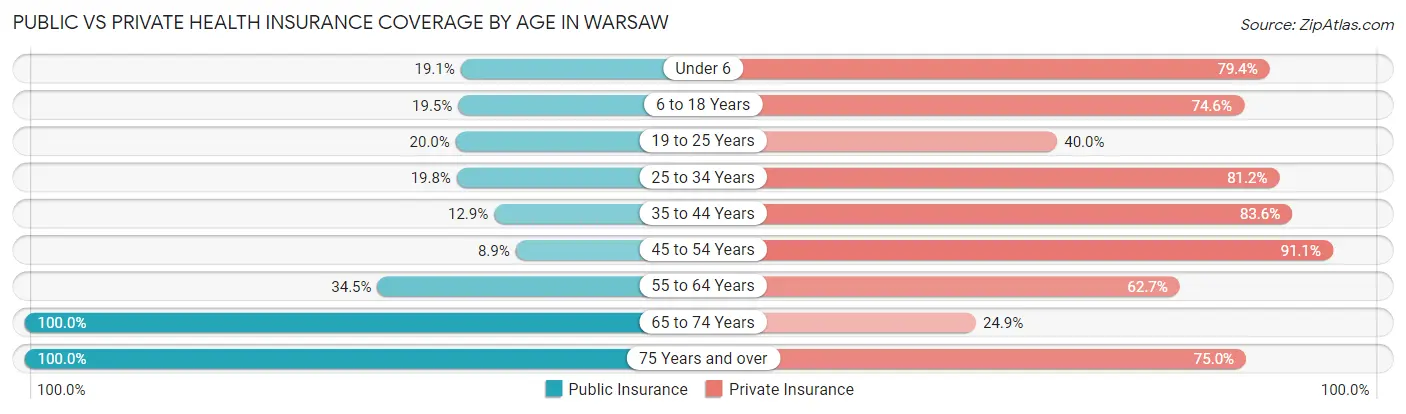
| Age Bracket | Public Insurance | Private Insurance |
| Under 6 | 25 (19.1%) | 104 (79.4%) |
| 6 to 18 Years | 50 (19.5%) | 191 (74.6%) |
| 19 to 25 Years | 8 (20.0%) | 16 (40.0%) |
| 25 to 34 Years | 40 (19.8%) | 164 (81.2%) |
| 35 to 44 Years | 18 (12.9%) | 117 (83.6%) |
| 45 to 54 Years | 11 (8.9%) | 113 (91.1%) |
| 55 to 64 Years | 87 (34.5%) | 158 (62.7%) |
| 65 to 74 Years | 313 (100.0%) | 78 (24.9%) |
| 75 Years and over | 80 (100.0%) | 60 (75.0%) |
| Total | 632 (41.1%) | 1,001 (65.1%) |
Disability Status by Sex by Age in Warsaw
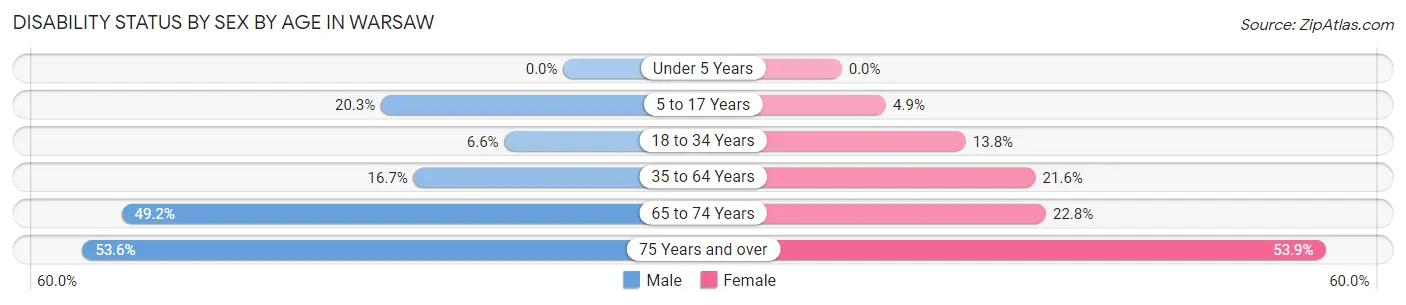
| Age Bracket | Male | Female |
| Under 5 Years | 0 (0.0%) | 0 (0.0%) |
| 5 to 17 Years | 27 (20.3%) | 8 (4.9%) |
| 18 to 34 Years | 8 (6.6%) | 17 (13.8%) |
| 35 to 64 Years | 42 (16.7%) | 57 (21.6%) |
| 65 to 74 Years | 61 (49.2%) | 43 (22.8%) |
| 75 Years and over | 15 (53.6%) | 28 (53.8%) |
Disability Class by Sex by Age in Warsaw
Disability Class: Hearing Difficulty
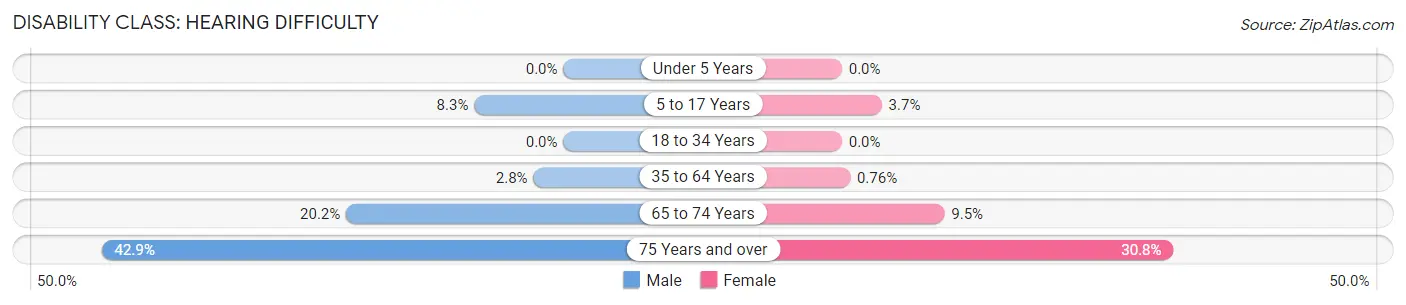
| Age Bracket | Male | Female |
| Under 5 Years | 0 (0.0%) | 0 (0.0%) |
| 5 to 17 Years | 11 (8.3%) | 6 (3.7%) |
| 18 to 34 Years | 0 (0.0%) | 0 (0.0%) |
| 35 to 64 Years | 7 (2.8%) | 2 (0.8%) |
| 65 to 74 Years | 25 (20.2%) | 18 (9.5%) |
| 75 Years and over | 12 (42.9%) | 16 (30.8%) |
Disability Class: Vision Difficulty
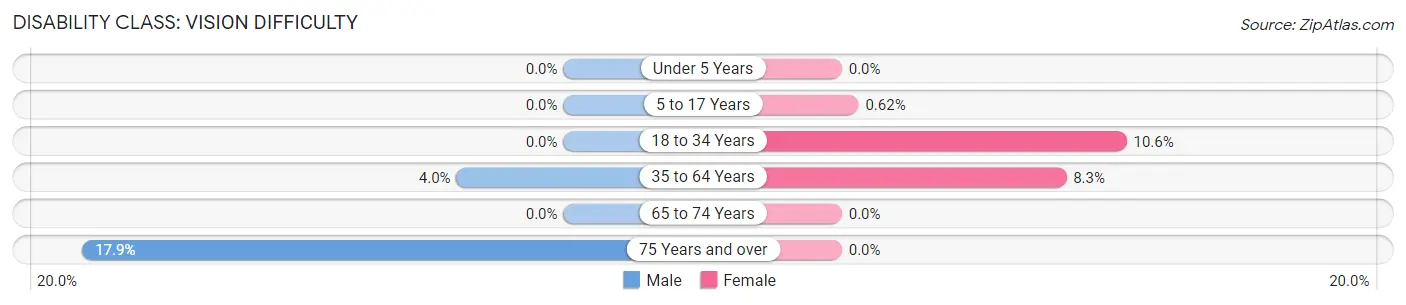
| Age Bracket | Male | Female |
| Under 5 Years | 0 (0.0%) | 0 (0.0%) |
| 5 to 17 Years | 0 (0.0%) | 1 (0.6%) |
| 18 to 34 Years | 0 (0.0%) | 13 (10.6%) |
| 35 to 64 Years | 10 (4.0%) | 22 (8.3%) |
| 65 to 74 Years | 0 (0.0%) | 0 (0.0%) |
| 75 Years and over | 5 (17.9%) | 0 (0.0%) |
Disability Class: Cognitive Difficulty
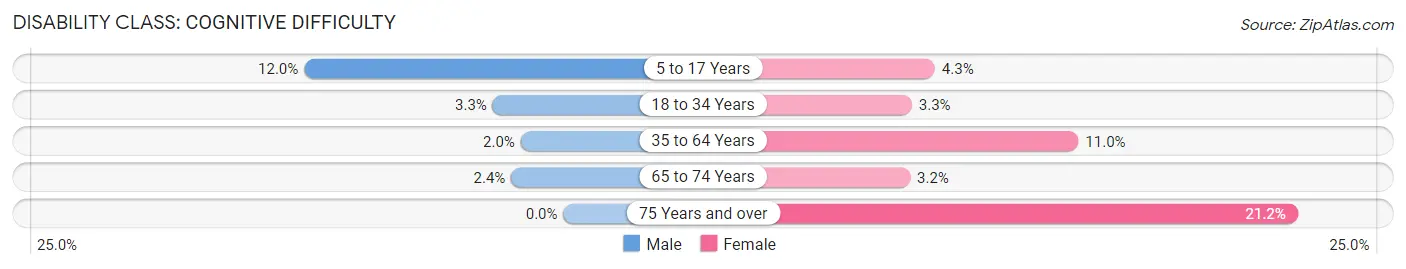
| Age Bracket | Male | Female |
| 5 to 17 Years | 16 (12.0%) | 7 (4.3%) |
| 18 to 34 Years | 4 (3.3%) | 4 (3.3%) |
| 35 to 64 Years | 5 (2.0%) | 29 (11.0%) |
| 65 to 74 Years | 3 (2.4%) | 6 (3.2%) |
| 75 Years and over | 0 (0.0%) | 11 (21.1%) |
Disability Class: Ambulatory Difficulty
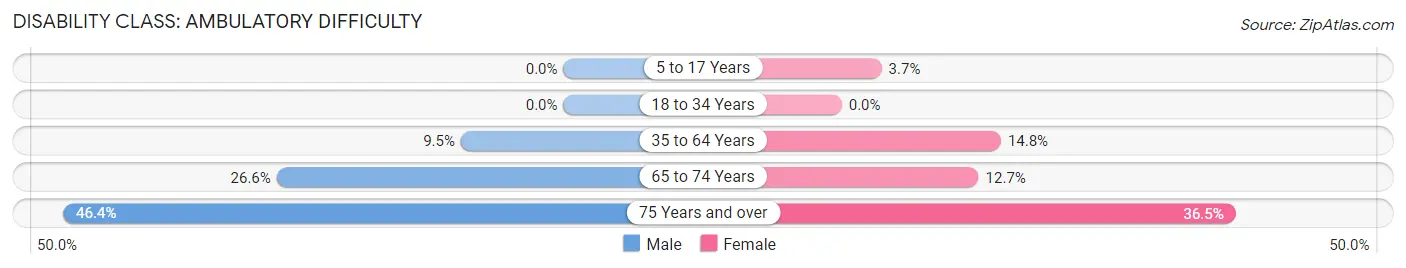
| Age Bracket | Male | Female |
| 5 to 17 Years | 0 (0.0%) | 6 (3.7%) |
| 18 to 34 Years | 0 (0.0%) | 0 (0.0%) |
| 35 to 64 Years | 24 (9.5%) | 39 (14.8%) |
| 65 to 74 Years | 33 (26.6%) | 24 (12.7%) |
| 75 Years and over | 13 (46.4%) | 19 (36.5%) |
Disability Class: Self-Care Difficulty
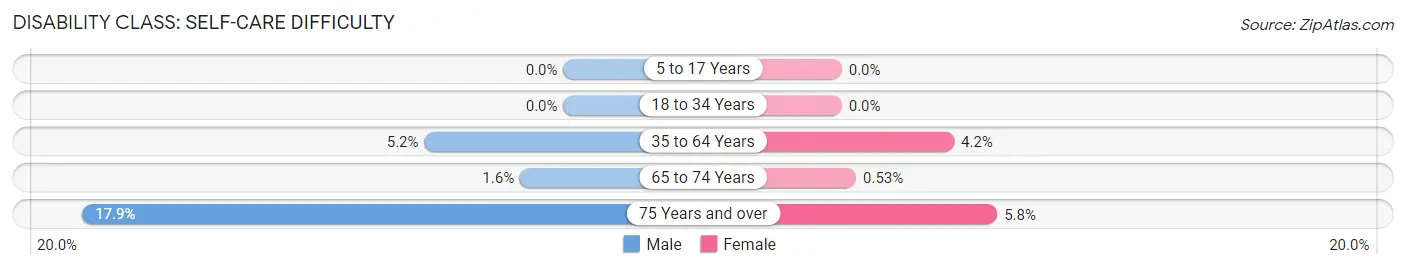
| Age Bracket | Male | Female |
| 5 to 17 Years | 0 (0.0%) | 0 (0.0%) |
| 18 to 34 Years | 0 (0.0%) | 0 (0.0%) |
| 35 to 64 Years | 13 (5.2%) | 11 (4.2%) |
| 65 to 74 Years | 2 (1.6%) | 1 (0.5%) |
| 75 Years and over | 5 (17.9%) | 3 (5.8%) |
Technology Access in Warsaw
Computing Device Access in Warsaw
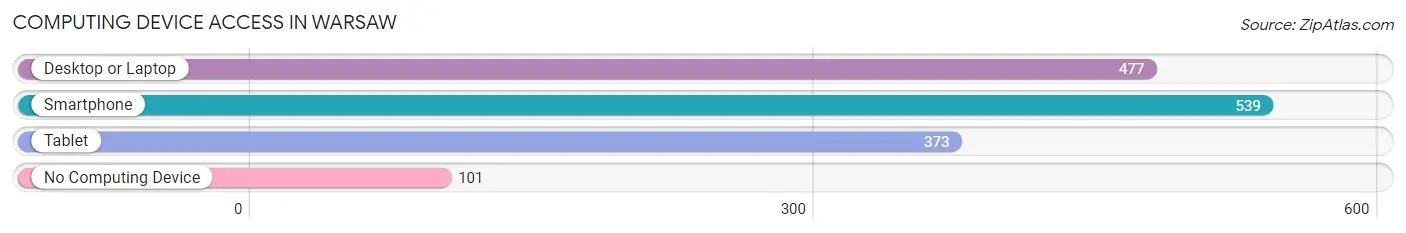
| Device Type | # Households | % Households |
| Desktop or Laptop | 477 | 69.6% |
| Smartphone | 539 | 78.7% |
| Tablet | 373 | 54.4% |
| No Computing Device | 101 | 14.7% |
| Total | 685 | 100.0% |
Internet Access in Warsaw
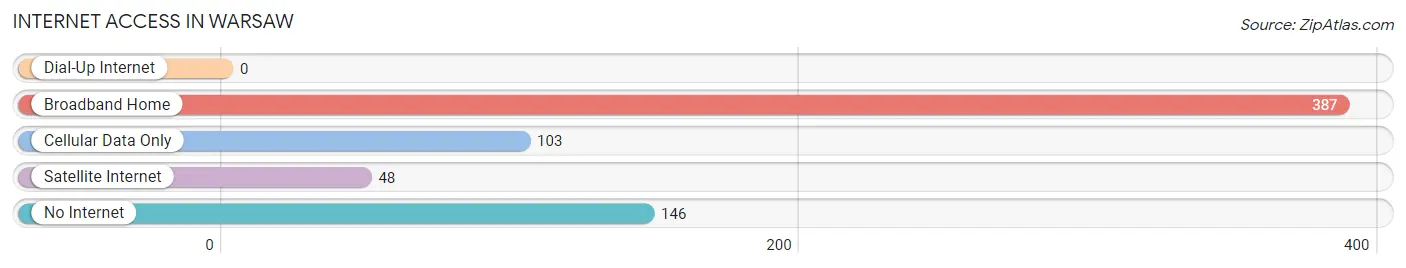
| Internet Type | # Households | % Households |
| Dial-Up Internet | 0 | 0.0% |
| Broadband Home | 387 | 56.5% |
| Cellular Data Only | 103 | 15.0% |
| Satellite Internet | 48 | 7.0% |
| No Internet | 146 | 21.3% |
| Total | 685 | 100.0% |
Warsaw Summary
Warsaw, Illinois is a small city located in Hancock County, Illinois. It is situated on the banks of the Mississippi River, approximately 40 miles south of the Quad Cities. The city has a population of approximately 2,500 people and is the county seat of Hancock County.
History
The area that is now Warsaw was first settled in 1834 by a group of settlers from Ohio. The settlement was originally known as “Ohio Town” and was located on the east bank of the Mississippi River. In 1836, the name was changed to “Warsaw” in honor of the Polish city of the same name. The city was officially incorporated in 1837.
In the early years, Warsaw was a bustling river port and a major center for the lumber industry. The city was also home to a number of manufacturing plants, including a flour mill, a sawmill, and a brickyard.
In the late 19th century, Warsaw was a major stop on the Chicago, Burlington & Quincy Railroad. The railroad brought a great deal of economic growth to the city, and it soon became a major center for the agricultural industry.
Geography
Warsaw is located in the western part of Hancock County, Illinois. It is situated on the east bank of the Mississippi River, approximately 40 miles south of the Quad Cities. The city has a total area of 1.3 square miles, all of which is land.
The city is located in a flat, low-lying area, with the Mississippi River forming the western boundary. The city is surrounded by agricultural land, with the nearest major city being Quincy, Illinois, located approximately 25 miles to the south.
Economy
The economy of Warsaw is largely based on agriculture and manufacturing. The city is home to a number of manufacturing plants, including a flour mill, a sawmill, and a brickyard. The city is also home to a number of agricultural businesses, including grain elevators, feed mills, and livestock operations.
The city is also home to a number of retail businesses, including grocery stores, restaurants, and clothing stores. The city is also home to a number of professional services, including medical offices, law offices, and financial services.
Demographics
As of the 2010 census, the population of Warsaw was 2,500. The racial makeup of the city was 97.2% White, 0.8% African American, 0.4% Native American, 0.2% Asian, and 1.4% from other races. Hispanic or Latino of any race were 1.2% of the population.
The median household income in Warsaw was $37,500, and the median family income was $45,000. The per capita income for the city was $18,000. Approximately 15.2% of the population was below the poverty line.
Common Questions
What is Per Capita Income in Warsaw?
Per Capita income in Warsaw is $32,907.
What is the Median Family Income in Warsaw?
Median Family Income in Warsaw is $74,432.
What is the Median Household income in Warsaw?
Median Household Income in Warsaw is $56,321.
What is Income or Wage Gap in Warsaw?
Income or Wage Gap in Warsaw is 59.0%.
Women in Warsaw earn 41.0 cents for every dollar earned by a man.
What is Inequality or Gini Index in Warsaw?
Inequality or Gini Index in Warsaw is 0.42.
What is the Total Population of Warsaw?
Total Population of Warsaw is 1,538.
What is the Total Male Population of Warsaw?
Total Male Population of Warsaw is 707.
What is the Total Female Population of Warsaw?
Total Female Population of Warsaw is 831.
What is the Ratio of Males per 100 Females in Warsaw?
There are 85.08 Males per 100 Females in Warsaw.
What is the Ratio of Females per 100 Males in Warsaw?
There are 117.54 Females per 100 Males in Warsaw.
What is the Median Population Age in Warsaw?
Median Population Age in Warsaw is 44.5 Years.
What is the Average Family Size in Warsaw
Average Family Size in Warsaw is 2.8 People.
What is the Average Household Size in Warsaw
Average Household Size in Warsaw is 2.2 People.
How Large is the Labor Force in Warsaw?
There are 751 People in the Labor Forcein in Warsaw.
What is the Percentage of People in the Labor Force in Warsaw?
63.3% of People are in the Labor Force in Warsaw.
What is the Unemployment Rate in Warsaw?
Unemployment Rate in Warsaw is 13.6%.