Winchester, IL Map & Demographics
Winchester Map
Winchester Overview
$25,999
PER CAPITA INCOME
$57,125
AVG FAMILY INCOME
$51,667
AVG HOUSEHOLD INCOME
6.1%
WAGE / INCOME GAP [ % ]
93.9¢/ $1
WAGE / INCOME GAP [ $ ]
0.43
INEQUALITY / GINI INDEX
1,541
TOTAL POPULATION
703
MALE POPULATION
838
FEMALE POPULATION
83.89
MALES / 100 FEMALES
119.20
FEMALES / 100 MALES
39.7
MEDIAN AGE
3.1
AVG FAMILY SIZE
2.4
AVG HOUSEHOLD SIZE
741
LABOR FORCE [ PEOPLE ]
63.8%
PERCENT IN LABOR FORCE
4.6%
UNEMPLOYMENT RATE
Winchester Zip Codes
Winchester Area Codes
Income in Winchester
Income Overview in Winchester
Per Capita Income in Winchester is $25,999, while median incomes of families and households are $57,125 and $51,667 respectively.
| Characteristic | Number | Measure |
| Per Capita Income | 1,541 | $25,999 |
| Median Family Income | 414 | $57,125 |
| Mean Family Income | 414 | $70,834 |
| Median Household Income | 636 | $51,667 |
| Mean Household Income | 636 | $59,328 |
| Income Deficit | 414 | $0 |
| Wage / Income Gap (%) | 1,541 | 6.06% |
| Wage / Income Gap ($) | 1,541 | 93.94¢ per $1 |
| Gini / Inequality Index | 1,541 | 0.43 |
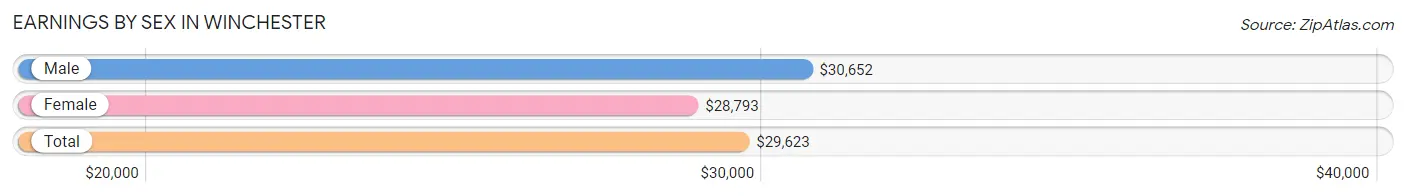
Earnings by Sex in Winchester
Average Earnings in Winchester are $29,623, $30,652 for men and $28,793 for women, a difference of 6.1%.
| Sex | Number | Average Earnings |
| Male | 376 (50.3%) | $30,652 |
| Female | 372 (49.7%) | $28,793 |
| Total | 748 (100.0%) | $29,623 |
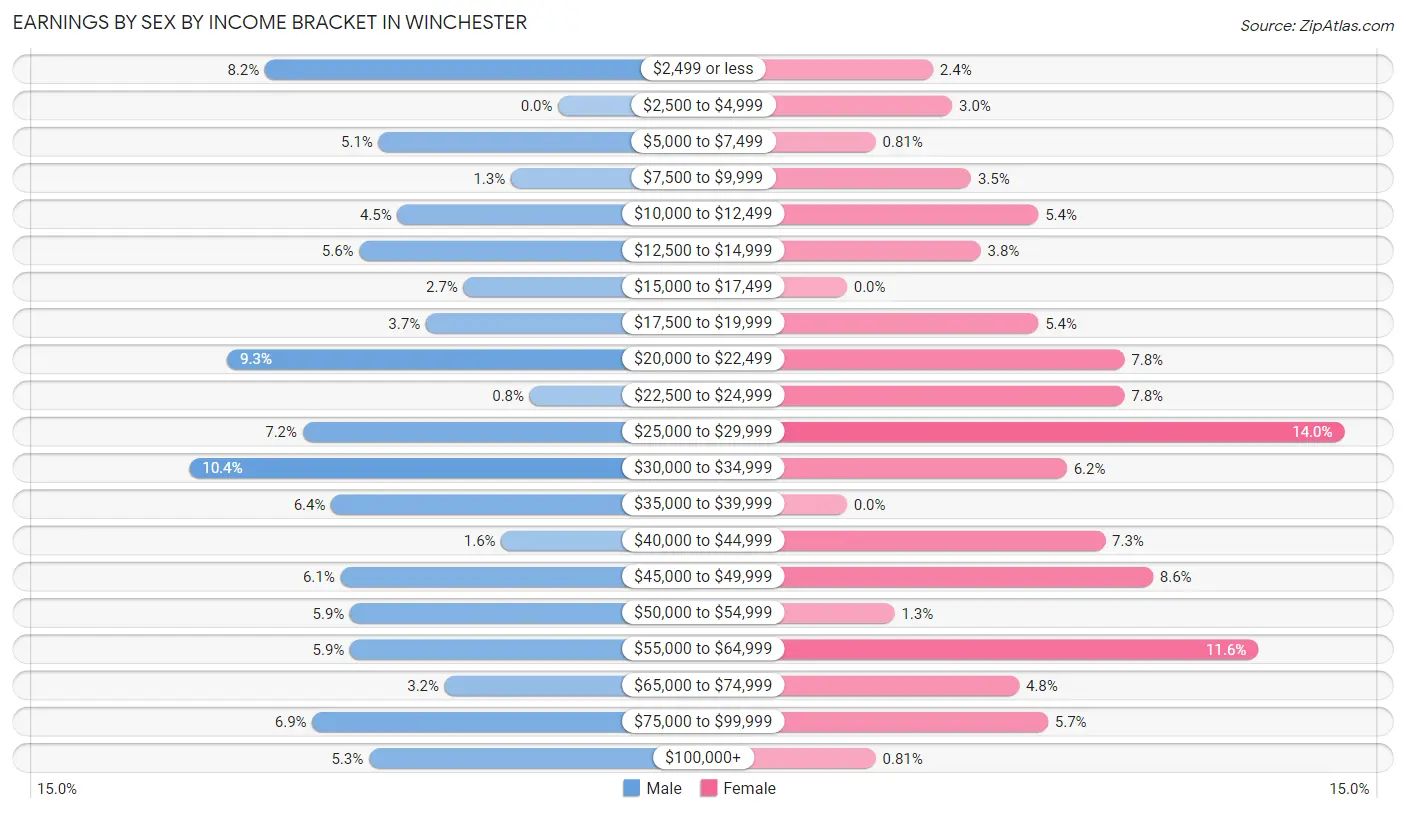
Earnings by Sex by Income Bracket in Winchester
The most common earnings brackets in Winchester are $30,000 to $34,999 for men (39 | 10.4%) and $25,000 to $29,999 for women (52 | 14.0%).
| Income | Male | Female |
| $2,499 or less | 31 (8.2%) | 9 (2.4%) |
| $2,500 to $4,999 | 0 (0.0%) | 11 (3.0%) |
| $5,000 to $7,499 | 19 (5.1%) | 3 (0.8%) |
| $7,500 to $9,999 | 5 (1.3%) | 13 (3.5%) |
| $10,000 to $12,499 | 17 (4.5%) | 20 (5.4%) |
| $12,500 to $14,999 | 21 (5.6%) | 14 (3.8%) |
| $15,000 to $17,499 | 10 (2.7%) | 0 (0.0%) |
| $17,500 to $19,999 | 14 (3.7%) | 20 (5.4%) |
| $20,000 to $22,499 | 35 (9.3%) | 29 (7.8%) |
| $22,500 to $24,999 | 3 (0.8%) | 29 (7.8%) |
| $25,000 to $29,999 | 27 (7.2%) | 52 (14.0%) |
| $30,000 to $34,999 | 39 (10.4%) | 23 (6.2%) |
| $35,000 to $39,999 | 24 (6.4%) | 0 (0.0%) |
| $40,000 to $44,999 | 6 (1.6%) | 27 (7.3%) |
| $45,000 to $49,999 | 23 (6.1%) | 32 (8.6%) |
| $50,000 to $54,999 | 22 (5.9%) | 5 (1.3%) |
| $55,000 to $64,999 | 22 (5.9%) | 43 (11.6%) |
| $65,000 to $74,999 | 12 (3.2%) | 18 (4.8%) |
| $75,000 to $99,999 | 26 (6.9%) | 21 (5.7%) |
| $100,000+ | 20 (5.3%) | 3 (0.8%) |
| Total | 376 (100.0%) | 372 (100.0%) |
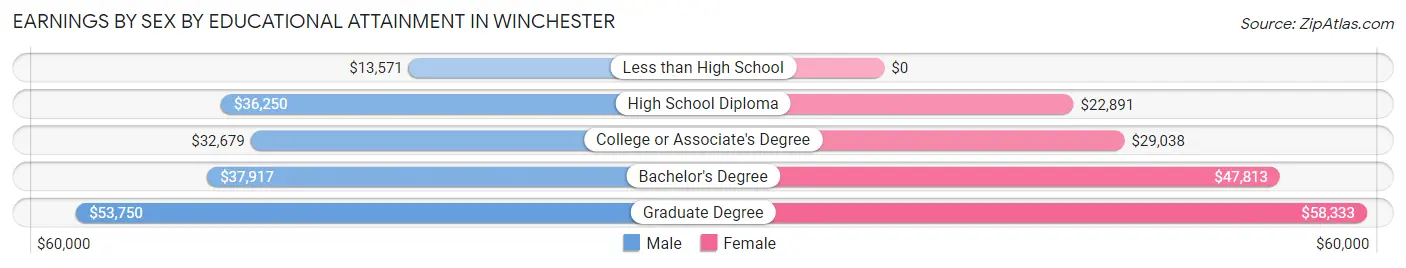
Earnings by Sex by Educational Attainment in Winchester
Average earnings in Winchester are $34,205 for men and $28,534 for women, a difference of 16.6%. Men with an educational attainment of graduate degree enjoy the highest average annual earnings of $53,750, while those with less than high school education earn the least with $13,571. Women with an educational attainment of graduate degree earn the most with the average annual earnings of $58,333, while those with high school diploma education have the smallest earnings of $22,891.
| Educational Attainment | Male Income | Female Income |
| Less than High School | $13,571 | $0 |
| High School Diploma | $36,250 | $22,891 |
| College or Associate's Degree | $32,679 | $29,038 |
| Bachelor's Degree | $37,917 | $47,813 |
| Graduate Degree | $53,750 | $58,333 |
| Total | $34,205 | $28,534 |
Family Income in Winchester
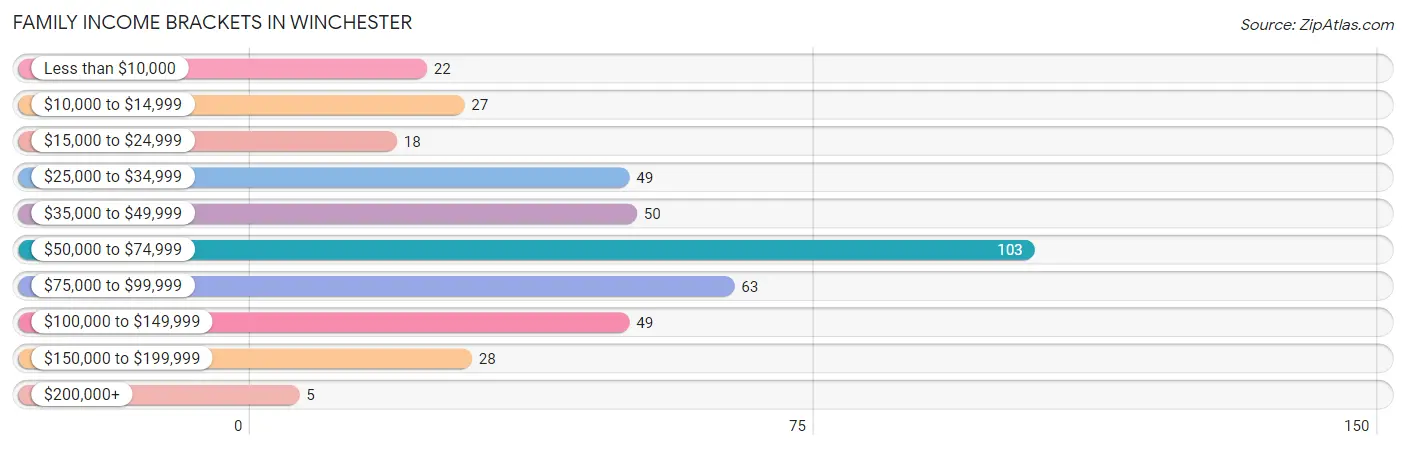
Family Income Brackets in Winchester
According to the Winchester family income data, there are 103 families falling into the $50,000 to $74,999 income range, which is the most common income bracket and makes up 24.9% of all families. Conversely, the $200,000+ income bracket is the least frequent group with only 5 families (1.2%) belonging to this category.
| Income Bracket | # Families | % Families |
| Less than $10,000 | 22 | 5.3% |
| $10,000 to $14,999 | 27 | 6.5% |
| $15,000 to $24,999 | 18 | 4.3% |
| $25,000 to $34,999 | 49 | 11.8% |
| $35,000 to $49,999 | 50 | 12.1% |
| $50,000 to $74,999 | 103 | 24.9% |
| $75,000 to $99,999 | 63 | 15.2% |
| $100,000 to $149,999 | 49 | 11.8% |
| $150,000 to $199,999 | 28 | 6.8% |
| $200,000+ | 5 | 1.2% |
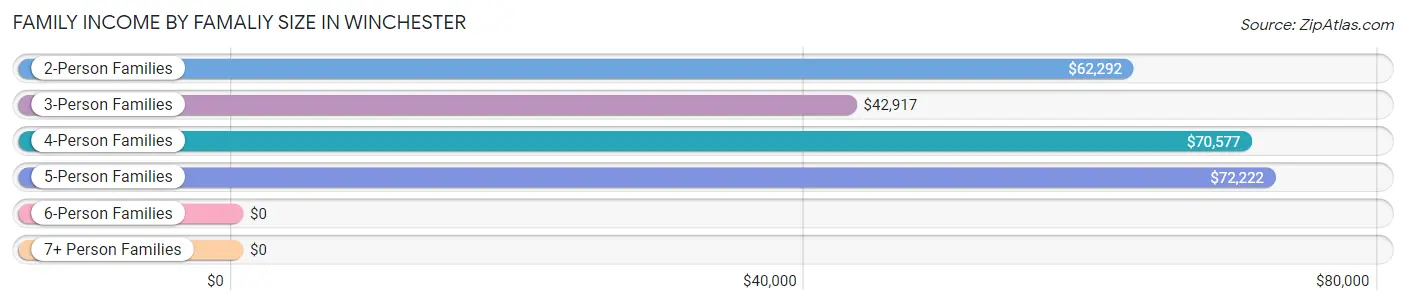
Family Income by Famaliy Size in Winchester
5-person families (34 | 8.2%) account for the highest median family income in Winchester with $72,222 per family, while 2-person families (215 | 51.9%) have the highest median income of $31,146 per family member.
| Income Bracket | # Families | Median Income |
| 2-Person Families | 215 (51.9%) | $62,292 |
| 3-Person Families | 89 (21.5%) | $42,917 |
| 4-Person Families | 70 (16.9%) | $70,577 |
| 5-Person Families | 34 (8.2%) | $72,222 |
| 6-Person Families | 0 (0.0%) | $0 |
| 7+ Person Families | 6 (1.5%) | $0 |
| Total | 414 (100.0%) | $57,125 |
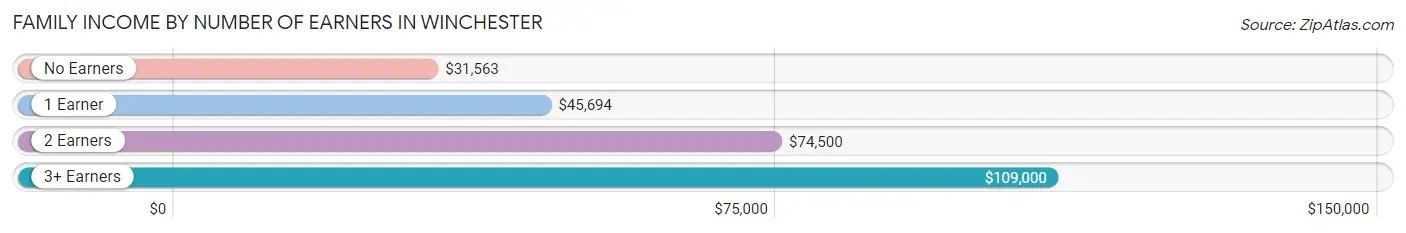
Family Income by Number of Earners in Winchester
The median family income in Winchester is $57,125, with families comprising 3+ earners (32) having the highest median family income of $109,000, while families with no earners (76) have the lowest median family income of $31,563, accounting for 7.7% and 18.4% of families, respectively.
| Number of Earners | # Families | Median Income |
| No Earners | 76 (18.4%) | $31,563 |
| 1 Earner | 144 (34.8%) | $45,694 |
| 2 Earners | 162 (39.1%) | $74,500 |
| 3+ Earners | 32 (7.7%) | $109,000 |
| Total | 414 (100.0%) | $57,125 |
Household Income in Winchester
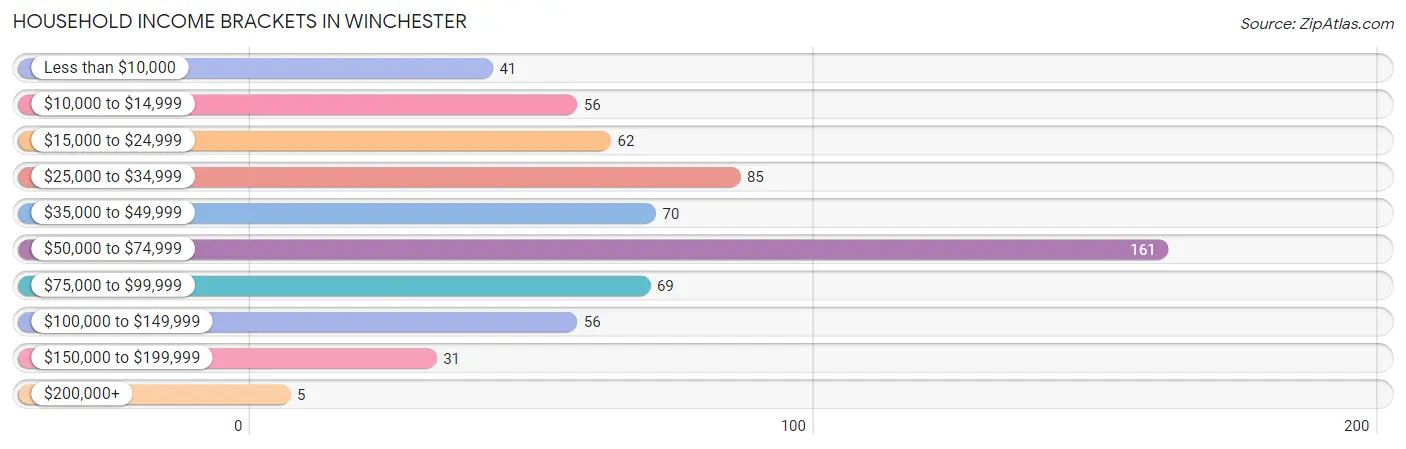
Household Income Brackets in Winchester
With 161 households falling in the category, the $50,000 to $74,999 income range is the most frequent in Winchester, accounting for 25.3% of all households. In contrast, only 5 households (0.8%) fall into the $200,000+ income bracket, making it the least populous group.
| Income Bracket | # Households | % Households |
| Less than $10,000 | 41 | 6.4% |
| $10,000 to $14,999 | 56 | 8.8% |
| $15,000 to $24,999 | 62 | 9.7% |
| $25,000 to $34,999 | 85 | 13.4% |
| $35,000 to $49,999 | 70 | 11.0% |
| $50,000 to $74,999 | 161 | 25.3% |
| $75,000 to $99,999 | 69 | 10.8% |
| $100,000 to $149,999 | 56 | 8.8% |
| $150,000 to $199,999 | 31 | 4.9% |
| $200,000+ | 5 | 0.8% |
Household Income by Householder Age in Winchester
The median household income in Winchester is $51,667, with the highest median household income of $56,250 found in the 25 to 44 years age bracket for the primary householder. A total of 128 households (20.1%) fall into this category. Meanwhile, the 15 to 24 years age bracket for the primary householder has the lowest median household income of $0, with 44 households (6.9%) in this group.
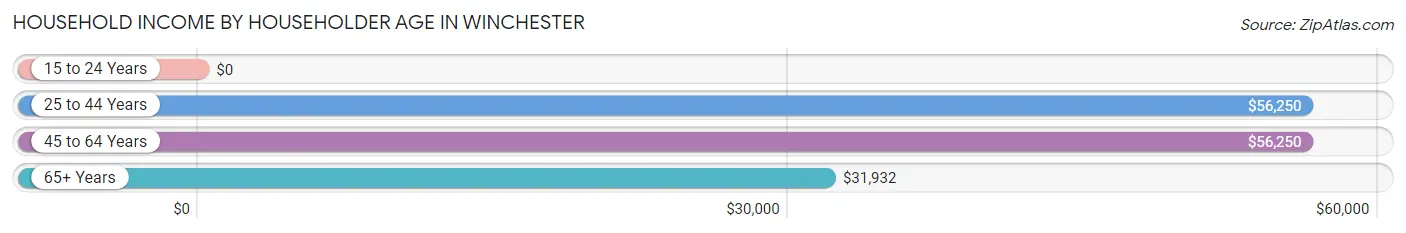
| Income Bracket | # Households | Median Income |
| 15 to 24 Years | 44 (6.9%) | $0 |
| 25 to 44 Years | 128 (20.1%) | $56,250 |
| 45 to 64 Years | 273 (42.9%) | $56,250 |
| 65+ Years | 191 (30.0%) | $31,932 |
| Total | 636 (100.0%) | $51,667 |
Poverty in Winchester
Income Below Poverty by Sex and Age in Winchester
With 16.8% poverty level for males and 23.6% for females among the residents of Winchester, 5 year old males and 15 year old females are the most vulnerable to poverty, with 21 males (100.0%) and 7 females (100.0%) in their respective age groups living below the poverty level.
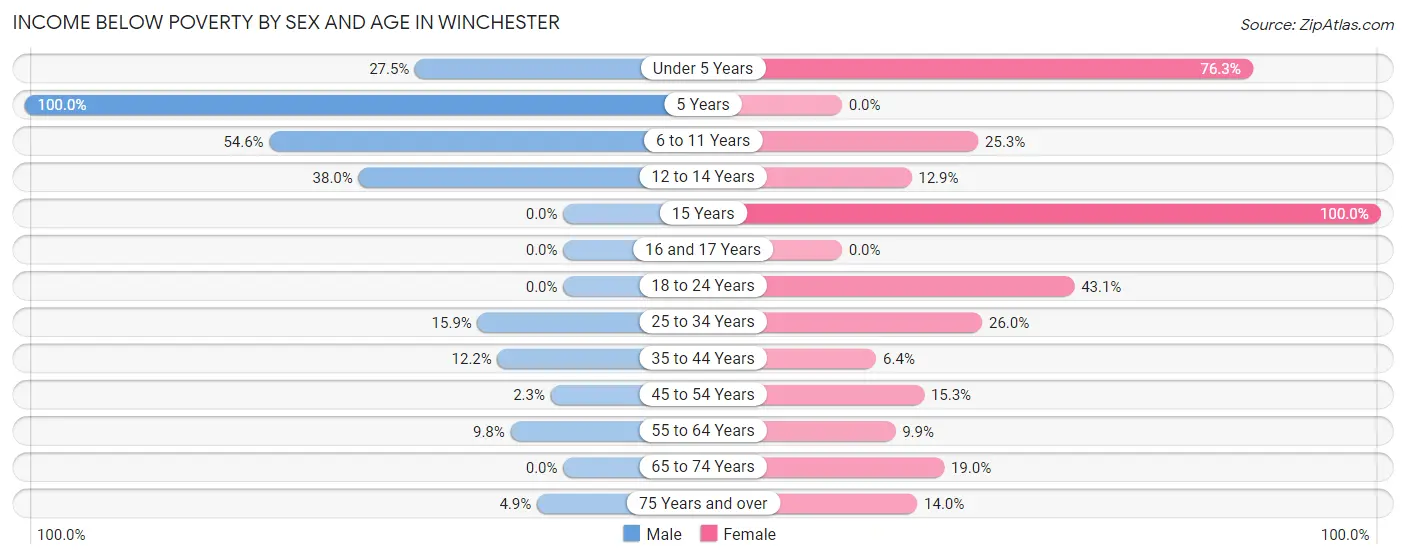
| Age Bracket | Male | Female |
| Under 5 Years | 11 (27.5%) | 61 (76.2%) |
| 5 Years | 21 (100.0%) | 0 (0.0%) |
| 6 to 11 Years | 30 (54.5%) | 21 (25.3%) |
| 12 to 14 Years | 19 (38.0%) | 4 (12.9%) |
| 15 Years | 0 (0.0%) | 7 (100.0%) |
| 16 and 17 Years | 0 (0.0%) | 0 (0.0%) |
| 18 to 24 Years | 0 (0.0%) | 22 (43.1%) |
| 25 to 34 Years | 14 (15.9%) | 25 (26.0%) |
| 35 to 44 Years | 5 (12.2%) | 3 (6.4%) |
| 45 to 54 Years | 2 (2.3%) | 18 (15.2%) |
| 55 to 64 Years | 14 (9.8%) | 13 (9.9%) |
| 65 to 74 Years | 0 (0.0%) | 11 (19.0%) |
| 75 Years and over | 2 (4.9%) | 13 (14.0%) |
| Total | 118 (16.8%) | 198 (23.6%) |
Income Above Poverty by Sex and Age in Winchester
According to the poverty statistics in Winchester, males aged 15 years and females aged 5 years are the age groups that are most secure financially, with 100.0% of males and 100.0% of females in these age groups living above the poverty line.
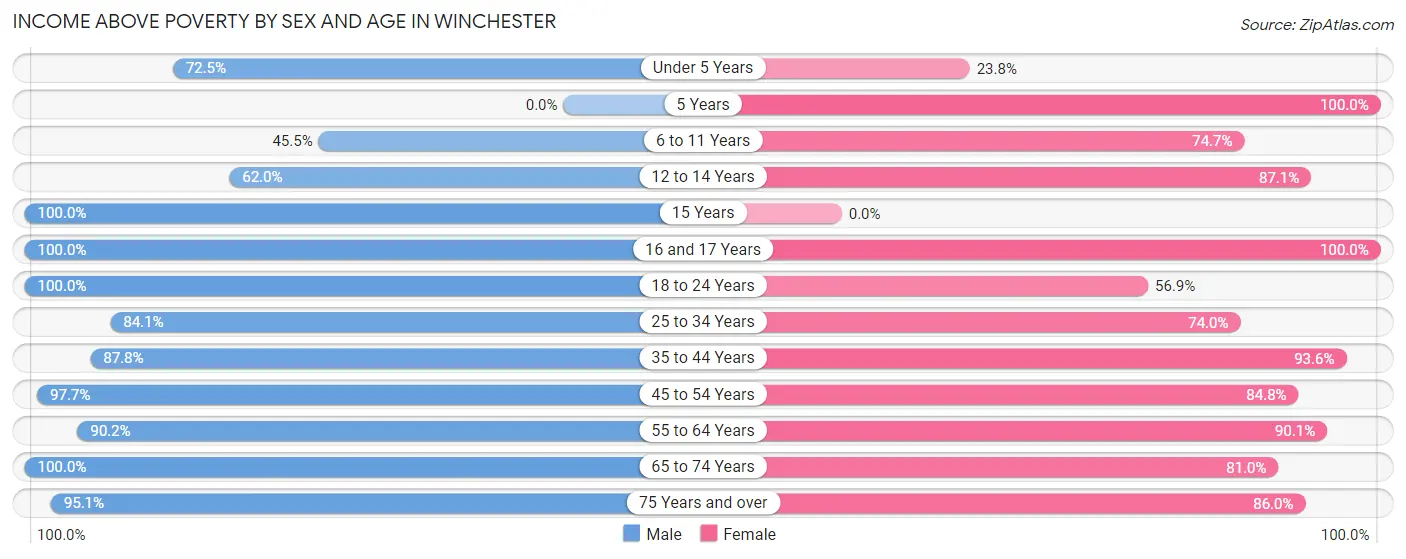
| Age Bracket | Male | Female |
| Under 5 Years | 29 (72.5%) | 19 (23.7%) |
| 5 Years | 0 (0.0%) | 7 (100.0%) |
| 6 to 11 Years | 25 (45.5%) | 62 (74.7%) |
| 12 to 14 Years | 31 (62.0%) | 27 (87.1%) |
| 15 Years | 5 (100.0%) | 0 (0.0%) |
| 16 and 17 Years | 10 (100.0%) | 36 (100.0%) |
| 18 to 24 Years | 66 (100.0%) | 29 (56.9%) |
| 25 to 34 Years | 74 (84.1%) | 71 (74.0%) |
| 35 to 44 Years | 36 (87.8%) | 44 (93.6%) |
| 45 to 54 Years | 84 (97.7%) | 100 (84.8%) |
| 55 to 64 Years | 129 (90.2%) | 118 (90.1%) |
| 65 to 74 Years | 57 (100.0%) | 47 (81.0%) |
| 75 Years and over | 39 (95.1%) | 80 (86.0%) |
| Total | 585 (83.2%) | 640 (76.4%) |
Income Below Poverty Among Married-Couple Families in Winchester
The poverty statistics for married-couple families in Winchester show that 0.7% or 2 of the total 269 families live below the poverty line. Families with no children have the highest poverty rate of 1.0%, comprising of 2 families. On the other hand, families with 1 or 2 children have the lowest poverty rate of 0.0%, which includes 0 families.
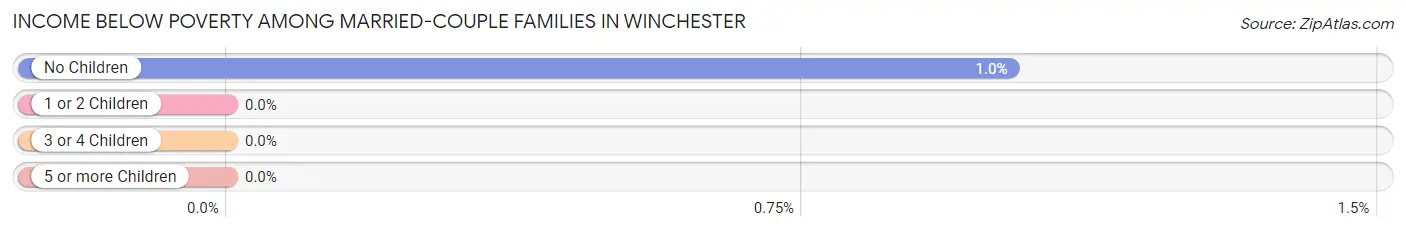
| Children | Above Poverty | Below Poverty |
| No Children | 194 (99.0%) | 2 (1.0%) |
| 1 or 2 Children | 50 (100.0%) | 0 (0.0%) |
| 3 or 4 Children | 23 (100.0%) | 0 (0.0%) |
| 5 or more Children | 0 (0.0%) | 0 (0.0%) |
| Total | 267 (99.3%) | 2 (0.7%) |
Income Below Poverty Among Single-Parent Households in Winchester
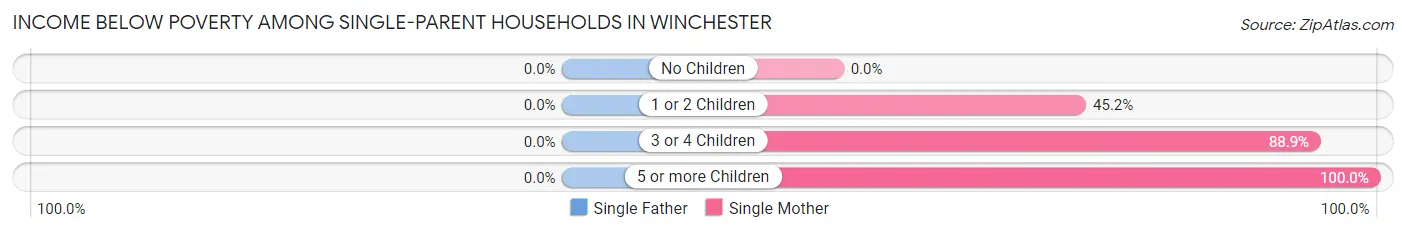
| Children | Single Father | Single Mother |
| No Children | 0 (0.0%) | 0 (0.0%) |
| 1 or 2 Children | 0 (0.0%) | 28 (45.2%) |
| 3 or 4 Children | 0 (0.0%) | 32 (88.9%) |
| 5 or more Children | 0 (0.0%) | 6 (100.0%) |
| Total | 0 (0.0%) | 66 (52.8%) |
Income Below Poverty Among Married-Couple vs Single-Parent Households in Winchester
The poverty data for Winchester shows that 2 of the married-couple family households (0.7%) and 66 of the single-parent households (45.5%) are living below the poverty level. Within the married-couple family households, those with no children have the highest poverty rate, with 2 households (1.0%) falling below the poverty line. Among the single-parent households, those with 5 or more children have the highest poverty rate, with 6 household (100.0%) living below poverty.
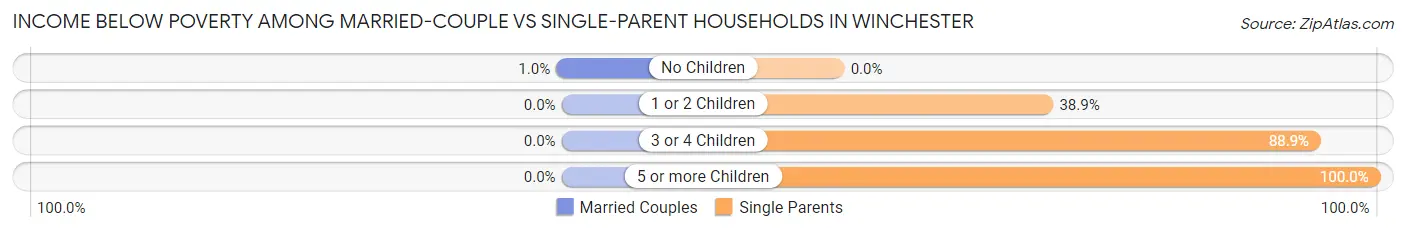
| Children | Married-Couple Families | Single-Parent Households |
| No Children | 2 (1.0%) | 0 (0.0%) |
| 1 or 2 Children | 0 (0.0%) | 28 (38.9%) |
| 3 or 4 Children | 0 (0.0%) | 32 (88.9%) |
| 5 or more Children | 0 (0.0%) | 6 (100.0%) |
| Total | 2 (0.7%) | 66 (45.5%) |
Race in Winchester
The most populous races in Winchester are White / Caucasian (1,476 | 95.8%), Two or more Races (61 | 4.0%), and Hispanic or Latino (14 | 0.9%).
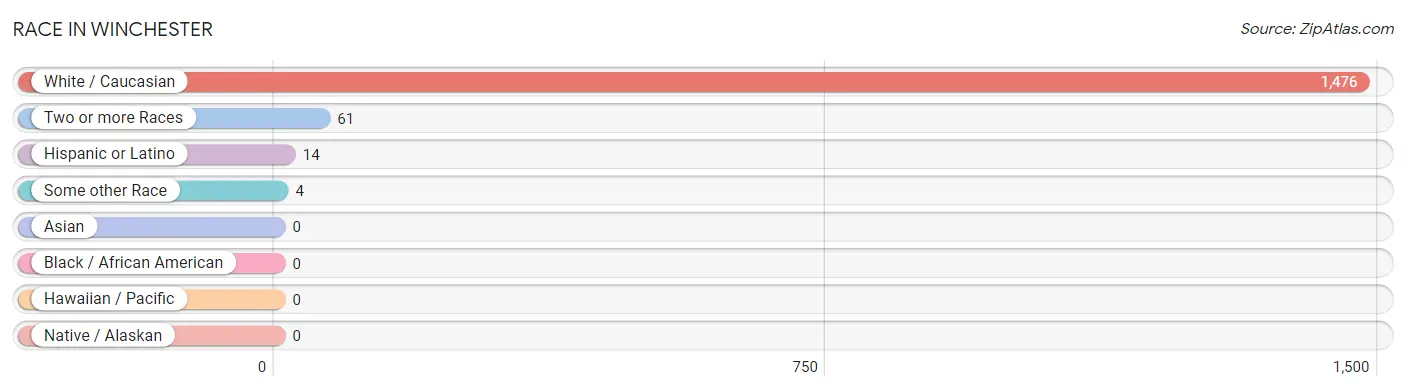
| Race | # Population | % Population |
| Asian | 0 | 0.0% |
| Black / African American | 0 | 0.0% |
| Hawaiian / Pacific | 0 | 0.0% |
| Hispanic or Latino | 14 | 0.9% |
| Native / Alaskan | 0 | 0.0% |
| White / Caucasian | 1,476 | 95.8% |
| Two or more Races | 61 | 4.0% |
| Some other Race | 4 | 0.3% |
| Total | 1,541 | 100.0% |
Ancestry in Winchester
The most populous ancestries reported in Winchester are German (421 | 27.3%), Irish (257 | 16.7%), English (214 | 13.9%), American (136 | 8.8%), and Italian (104 | 6.8%), together accounting for 73.5% of all Winchester residents.
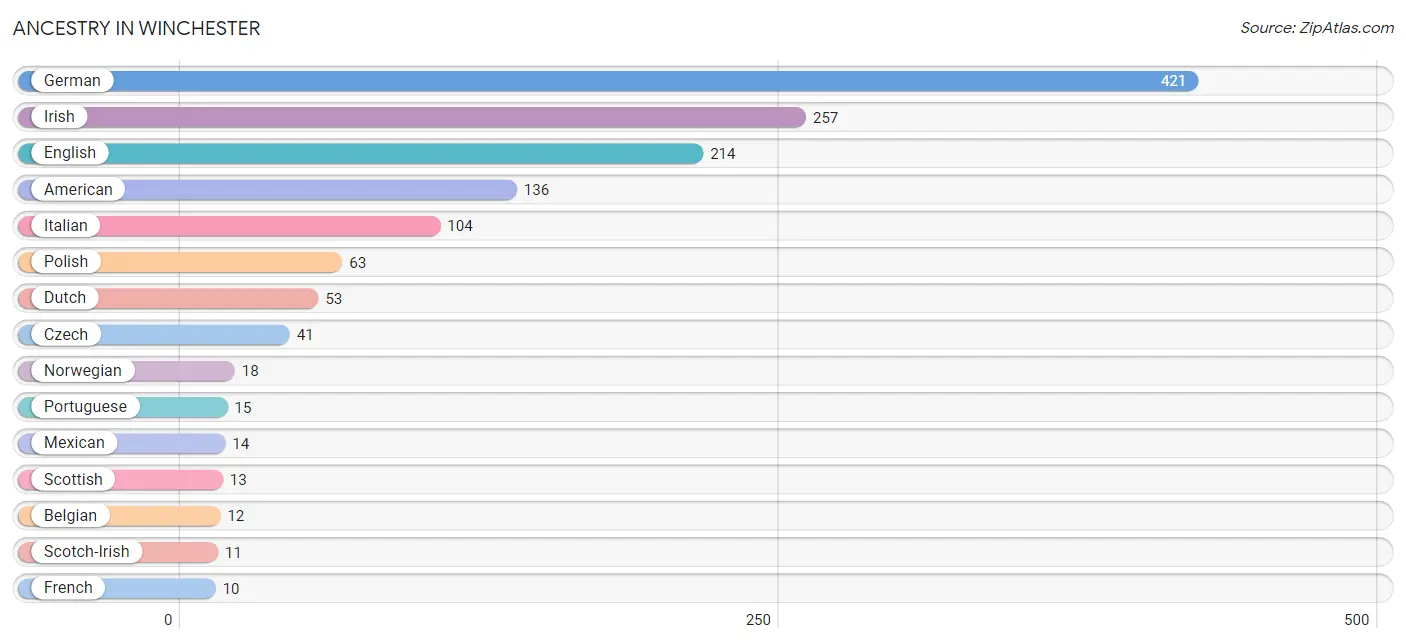
| Ancestry | # Population | % Population |
| American | 136 | 8.8% |
| Australian | 4 | 0.3% |
| Belgian | 12 | 0.8% |
| British | 3 | 0.2% |
| Czech | 41 | 2.7% |
| Dutch | 53 | 3.4% |
| English | 214 | 13.9% |
| European | 2 | 0.1% |
| French | 10 | 0.6% |
| German | 421 | 27.3% |
| Irish | 257 | 16.7% |
| Italian | 104 | 6.8% |
| Mexican | 14 | 0.9% |
| Norwegian | 18 | 1.2% |
| Polish | 63 | 4.1% |
| Portuguese | 15 | 1.0% |
| Russian | 1 | 0.1% |
| Scotch-Irish | 11 | 0.7% |
| Scottish | 13 | 0.8% |
| Swedish | 4 | 0.3% |
| Ukrainian | 4 | 0.3% |
| Welsh | 3 | 0.2% | View All 22 Rows |
Immigrants in Winchester
The most numerous immigrant groups reported in Winchester came from Central America (4 | 0.3%), Latin America (4 | 0.3%), Mexico (4 | 0.3%), Eastern Europe (1 | 0.1%), and Europe (1 | 0.1%), together accounting for 0.9% of all Winchester residents.
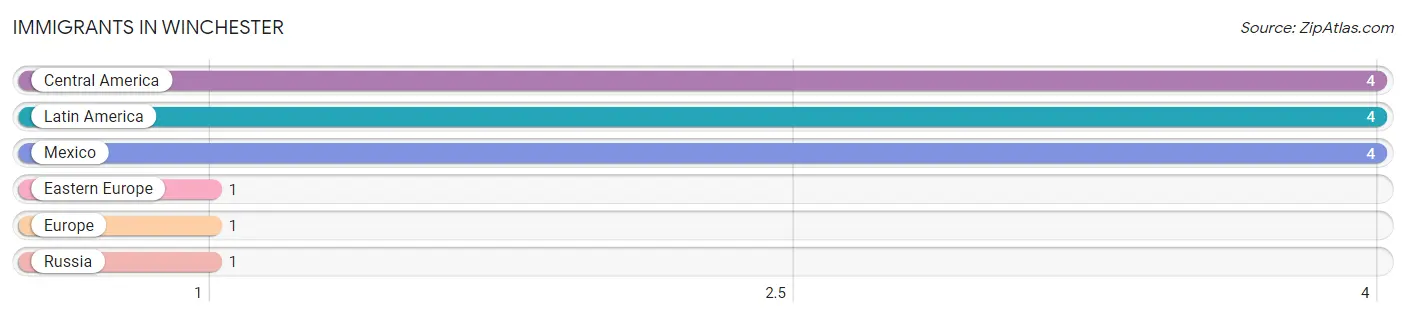
| Immigration Origin | # Population | % Population |
| Central America | 4 | 0.3% |
| Eastern Europe | 1 | 0.1% |
| Europe | 1 | 0.1% |
| Latin America | 4 | 0.3% |
| Mexico | 4 | 0.3% |
| Russia | 1 | 0.1% | View All 6 Rows |
Sex and Age in Winchester
Sex and Age in Winchester
The most populous age groups in Winchester are 55 to 59 Years (84 | 11.9%) for men and 55 to 59 Years (81 | 9.7%) for women.
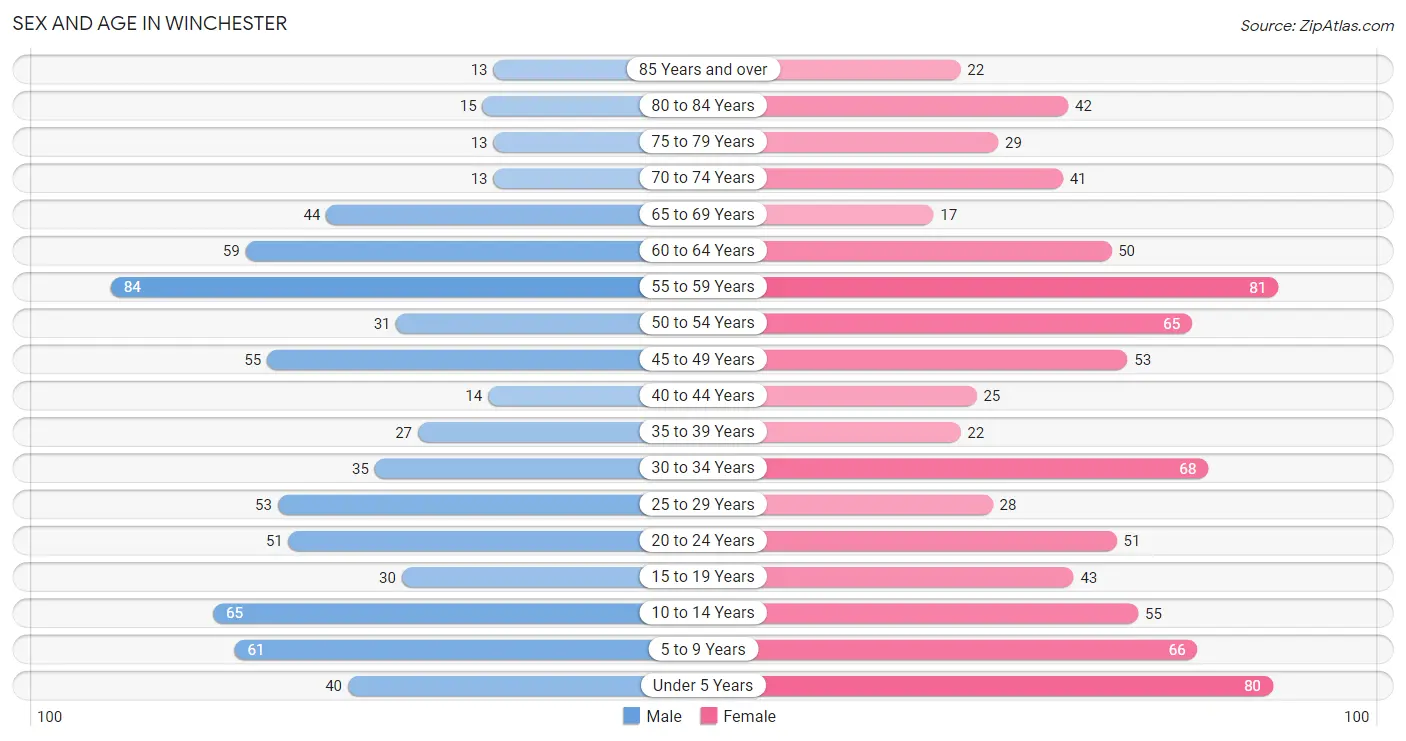
| Age Bracket | Male | Female |
| Under 5 Years | 40 (5.7%) | 80 (9.6%) |
| 5 to 9 Years | 61 (8.7%) | 66 (7.9%) |
| 10 to 14 Years | 65 (9.2%) | 55 (6.6%) |
| 15 to 19 Years | 30 (4.3%) | 43 (5.1%) |
| 20 to 24 Years | 51 (7.2%) | 51 (6.1%) |
| 25 to 29 Years | 53 (7.5%) | 28 (3.3%) |
| 30 to 34 Years | 35 (5.0%) | 68 (8.1%) |
| 35 to 39 Years | 27 (3.8%) | 22 (2.6%) |
| 40 to 44 Years | 14 (2.0%) | 25 (3.0%) |
| 45 to 49 Years | 55 (7.8%) | 53 (6.3%) |
| 50 to 54 Years | 31 (4.4%) | 65 (7.8%) |
| 55 to 59 Years | 84 (11.9%) | 81 (9.7%) |
| 60 to 64 Years | 59 (8.4%) | 50 (6.0%) |
| 65 to 69 Years | 44 (6.3%) | 17 (2.0%) |
| 70 to 74 Years | 13 (1.8%) | 41 (4.9%) |
| 75 to 79 Years | 13 (1.8%) | 29 (3.5%) |
| 80 to 84 Years | 15 (2.1%) | 42 (5.0%) |
| 85 Years and over | 13 (1.8%) | 22 (2.6%) |
| Total | 703 (100.0%) | 838 (100.0%) |
Families and Households in Winchester
Median Family Size in Winchester
The median family size in Winchester is 3.08 persons per family, with single female/mother families (125 | 30.2%) accounting for the largest median family size of 3.26 persons per family. On the other hand, single male/father families (20 | 4.8%) represent the smallest median family size with 2.65 persons per family.
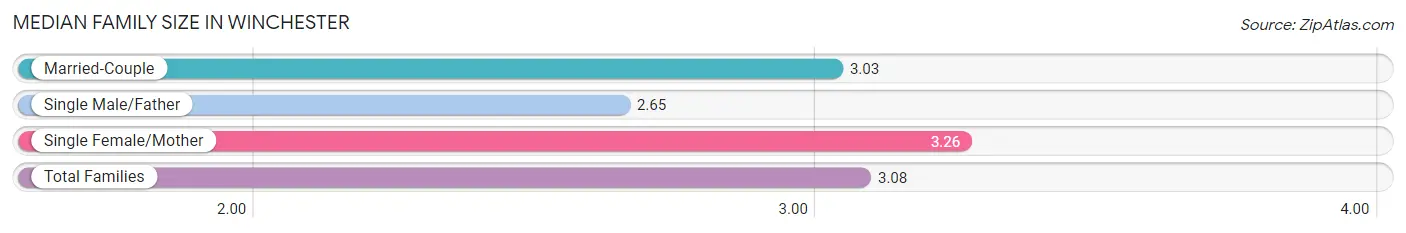
| Family Type | # Families | Family Size |
| Married-Couple | 269 (65.0%) | 3.03 |
| Single Male/Father | 20 (4.8%) | 2.65 |
| Single Female/Mother | 125 (30.2%) | 3.26 |
| Total Families | 414 (100.0%) | 3.08 |
Median Household Size in Winchester
The median household size in Winchester is 2.42 persons per household, with single female/mother households (125 | 19.7%) accounting for the largest median household size of 3.34 persons per household. non-family households (222 | 34.9%) represent the smallest median household size with 1.10 persons per household.
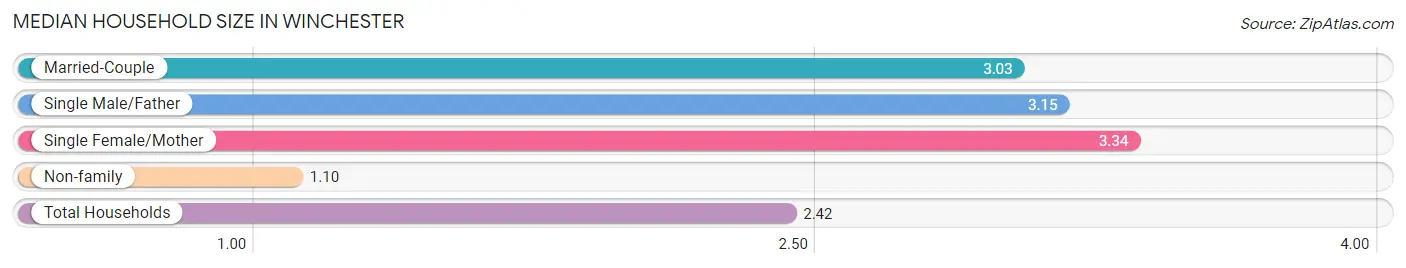
| Household Type | # Households | Household Size |
| Married-Couple | 269 (42.3%) | 3.03 |
| Single Male/Father | 20 (3.1%) | 3.15 |
| Single Female/Mother | 125 (19.7%) | 3.34 |
| Non-family | 222 (34.9%) | 1.10 |
| Total Households | 636 (100.0%) | 2.42 |
Household Size by Marriage Status in Winchester
Out of a total of 636 households in Winchester, 414 (65.1%) are family households, while 222 (34.9%) are nonfamily households. The most numerous type of family households are 2-person households, comprising 209, and the most common type of nonfamily households are 1-person households, comprising 201.
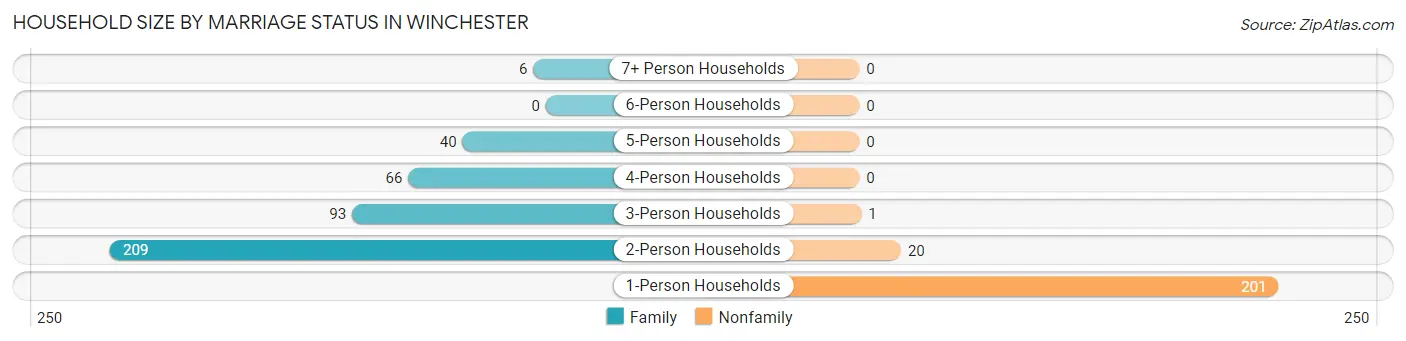
| Household Size | Family Households | Nonfamily Households |
| 1-Person Households | - | 201 (31.6%) |
| 2-Person Households | 209 (32.9%) | 20 (3.1%) |
| 3-Person Households | 93 (14.6%) | 1 (0.2%) |
| 4-Person Households | 66 (10.4%) | 0 (0.0%) |
| 5-Person Households | 40 (6.3%) | 0 (0.0%) |
| 6-Person Households | 0 (0.0%) | 0 (0.0%) |
| 7+ Person Households | 6 (0.9%) | 0 (0.0%) |
| Total | 414 (65.1%) | 222 (34.9%) |
Female Fertility in Winchester
Fertility by Age in Winchester
Average fertility rate in Winchester is 61.0 births per 1,000 women. Women in the age bracket of 20 to 34 years have the highest fertility rate with 129.0 births per 1,000 women. Women in the age bracket of 20 to 34 years acount for 100.0% of all women with births.
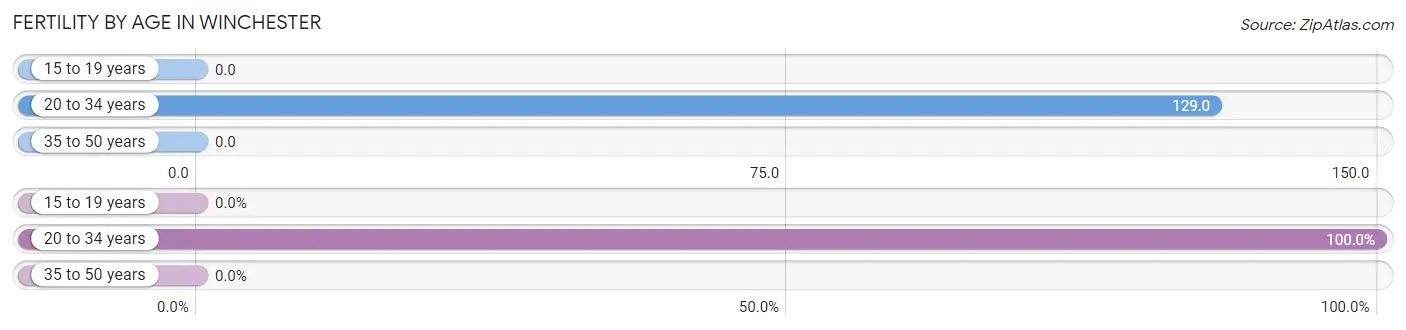
| Age Bracket | Women with Births | Births / 1,000 Women |
| 15 to 19 years | 0 (0.0%) | 0.0 |
| 20 to 34 years | 19 (100.0%) | 129.0 |
| 35 to 50 years | 0 (0.0%) | 0.0 |
| Total | 19 (100.0%) | 61.0 |
Fertility by Age by Marriage Status in Winchester
68.4% of women with births (19) in Winchester are married. The highest percentage of unmarried women with births falls into 20 to 34 years age bracket with 31.6% of them unmarried at the time of birth, while the lowest percentage of unmarried women with births belong to 20 to 34 years age bracket with 31.6% of them unmarried.
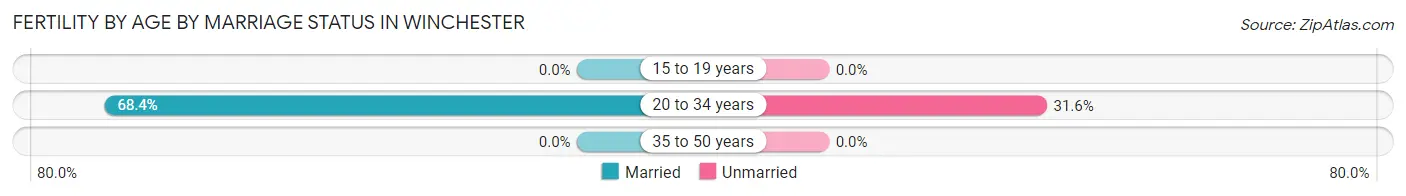
| Age Bracket | Married | Unmarried |
| 15 to 19 years | 0 (0.0%) | 0 (0.0%) |
| 20 to 34 years | 13 (68.4%) | 6 (31.6%) |
| 35 to 50 years | 0 (0.0%) | 0 (0.0%) |
| Total | 13 (68.4%) | 6 (31.6%) |
Fertility by Education in Winchester
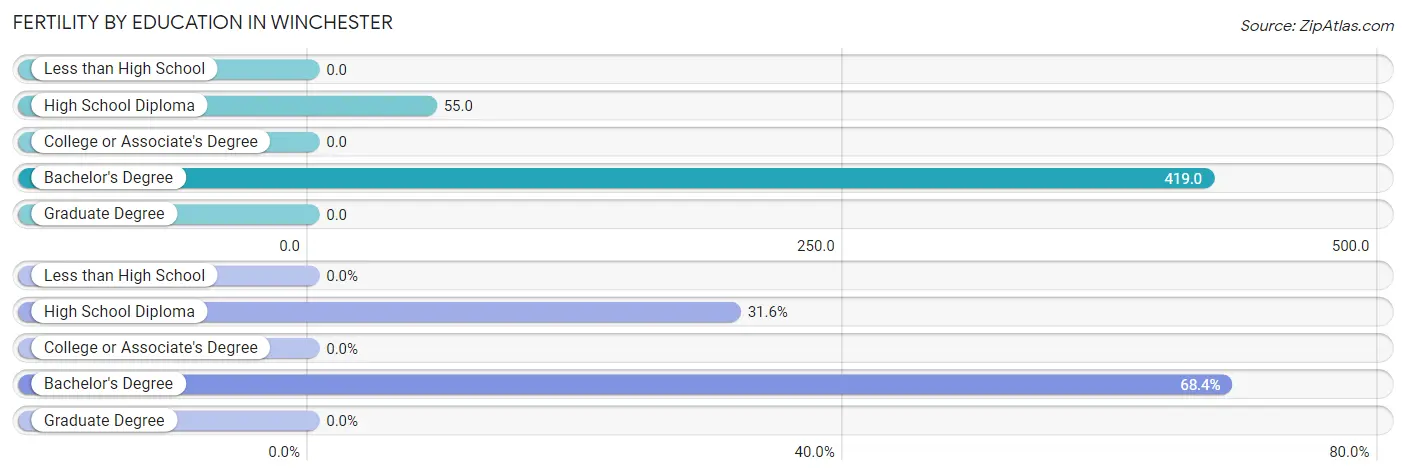
| Educational Attainment | Women with Births | Births / 1,000 Women |
| Less than High School | 0 (0.0%) | 0.0 |
| High School Diploma | 6 (31.6%) | 55.0 |
| College or Associate's Degree | 0 (0.0%) | 0.0 |
| Bachelor's Degree | 13 (68.4%) | 419.0 |
| Graduate Degree | 0 (0.0%) | 0.0 |
| Total | 19 (100.0%) | 61.0 |
Fertility by Education by Marriage Status in Winchester
31.6% of women with births in Winchester are unmarried. Women with the educational attainment of bachelor's degree are most likely to be married with 100.0% of them married at childbirth, while women with the educational attainment of high school diploma are least likely to be married with 100.0% of them unmarried at childbirth.
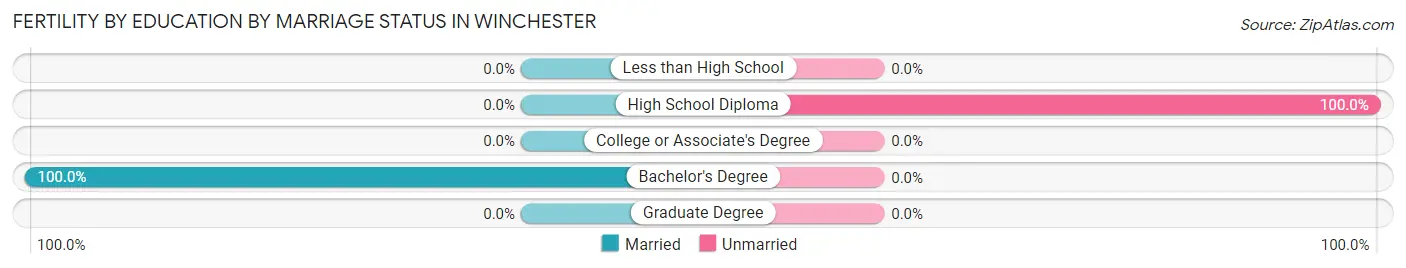
| Educational Attainment | Married | Unmarried |
| Less than High School | 0 (0.0%) | 0 (0.0%) |
| High School Diploma | 0 (0.0%) | 6 (100.0%) |
| College or Associate's Degree | 0 (0.0%) | 0 (0.0%) |
| Bachelor's Degree | 13 (100.0%) | 0 (0.0%) |
| Graduate Degree | 0 (0.0%) | 0 (0.0%) |
| Total | 13 (68.4%) | 6 (31.6%) |
Employment Characteristics in Winchester
Employment by Class of Employer in Winchester
Among the 678 employed individuals in Winchester, private company employees (434 | 64.0%), local government employees (77 | 11.4%), and not-for-profit organizations (72 | 10.6%) make up the most common classes of employment.
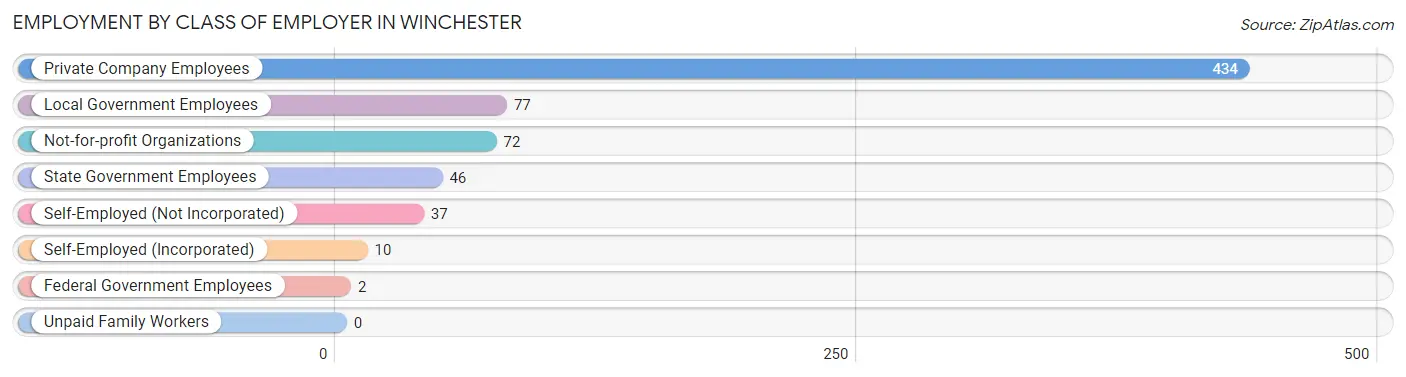
| Employer Class | # Employees | % Employees |
| Private Company Employees | 434 | 64.0% |
| Self-Employed (Incorporated) | 10 | 1.5% |
| Self-Employed (Not Incorporated) | 37 | 5.5% |
| Not-for-profit Organizations | 72 | 10.6% |
| Local Government Employees | 77 | 11.4% |
| State Government Employees | 46 | 6.8% |
| Federal Government Employees | 2 | 0.3% |
| Unpaid Family Workers | 0 | 0.0% |
| Total | 678 | 100.0% |
Employment Status by Age in Winchester
According to the labor force statistics for Winchester, out of the total population over 16 years of age (1,162), 63.8% or 741 individuals are in the labor force, with 4.6% or 34 of them unemployed. The age group with the highest labor force participation rate is 35 to 44 years, with 95.5% or 84 individuals in the labor force. Within the labor force, the 25 to 29 years age range has the highest percentage of unemployed individuals, with 15.4% or 10 of them being unemployed.
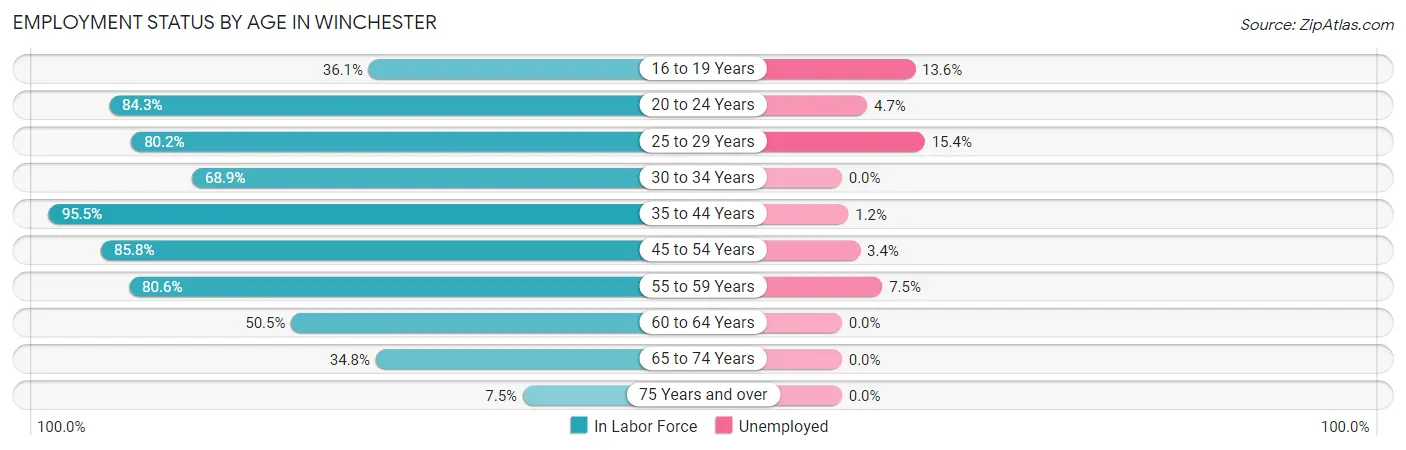
| Age Bracket | In Labor Force | Unemployed |
| 16 to 19 Years | 22 (36.1%) | 3 (13.6%) |
| 20 to 24 Years | 86 (84.3%) | 4 (4.7%) |
| 25 to 29 Years | 65 (80.2%) | 10 (15.4%) |
| 30 to 34 Years | 71 (68.9%) | 0 (0.0%) |
| 35 to 44 Years | 84 (95.5%) | 1 (1.2%) |
| 45 to 54 Years | 175 (85.8%) | 6 (3.4%) |
| 55 to 59 Years | 133 (80.6%) | 10 (7.5%) |
| 60 to 64 Years | 55 (50.5%) | 0 (0.0%) |
| 65 to 74 Years | 40 (34.8%) | 0 (0.0%) |
| 75 Years and over | 10 (7.5%) | 0 (0.0%) |
| Total | 741 (63.8%) | 34 (4.6%) |
Employment Status by Educational Attainment in Winchester
According to labor force statistics for Winchester, 77.7% of individuals (583) out of the total population between 25 and 64 years of age (750) are in the labor force, with 4.6% or 27 of them being unemployed. The group with the highest labor force participation rate are those with the educational attainment of bachelor's degree or higher, with 94.0% or 158 individuals in the labor force. Within the labor force, individuals with high school diploma education have the highest percentage of unemployment, with 9.2% or 25 of them being unemployed.
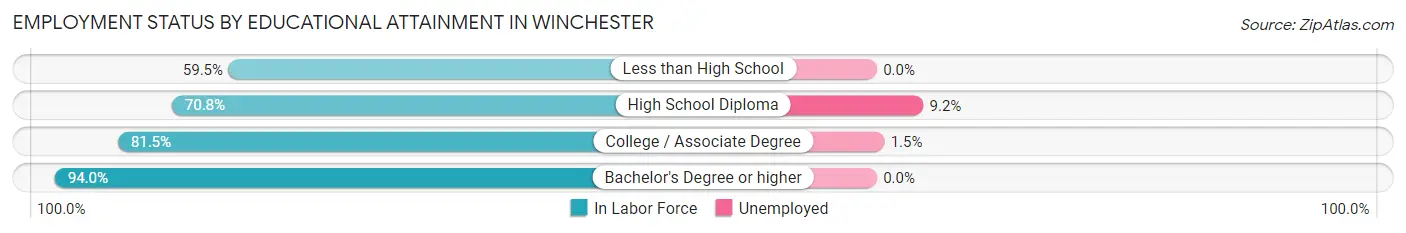
| Educational Attainment | In Labor Force | Unemployed |
| Less than High School | 22 (59.5%) | 0 (0.0%) |
| High School Diploma | 271 (70.8%) | 35 (9.2%) |
| College / Associate Degree | 132 (81.5%) | 2 (1.5%) |
| Bachelor's Degree or higher | 158 (94.0%) | 0 (0.0%) |
| Total | 583 (77.7%) | 34 (4.6%) |
Employment Occupations by Sex in Winchester
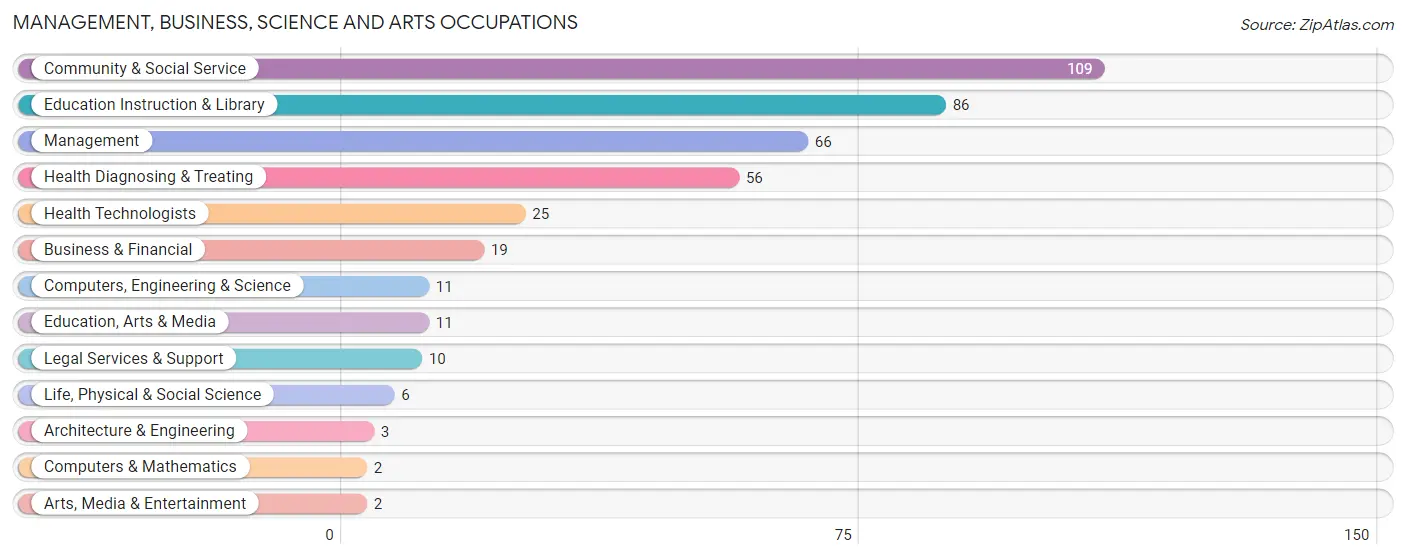
Management, Business, Science and Arts Occupations
The most common Management, Business, Science and Arts occupations in Winchester are Community & Social Service (109 | 15.4%), Education Instruction & Library (86 | 12.2%), Management (66 | 9.3%), Health Diagnosing & Treating (56 | 7.9%), and Health Technologists (25 | 3.5%).
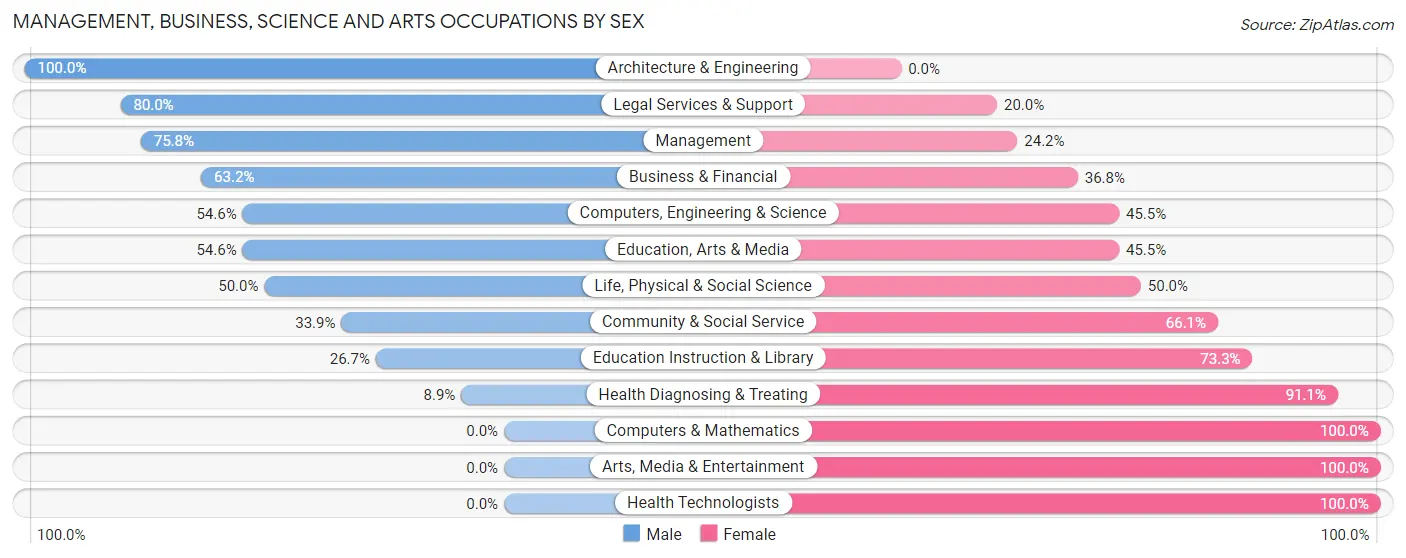
Management, Business, Science and Arts Occupations by Sex
Within the Management, Business, Science and Arts occupations in Winchester, the most male-oriented occupations are Architecture & Engineering (100.0%), Legal Services & Support (80.0%), and Management (75.8%), while the most female-oriented occupations are Computers & Mathematics (100.0%), Arts, Media & Entertainment (100.0%), and Health Technologists (100.0%).
| Occupation | Male | Female |
| Management | 50 (75.8%) | 16 (24.2%) |
| Business & Financial | 12 (63.2%) | 7 (36.8%) |
| Computers, Engineering & Science | 6 (54.5%) | 5 (45.5%) |
| Computers & Mathematics | 0 (0.0%) | 2 (100.0%) |
| Architecture & Engineering | 3 (100.0%) | 0 (0.0%) |
| Life, Physical & Social Science | 3 (50.0%) | 3 (50.0%) |
| Community & Social Service | 37 (33.9%) | 72 (66.1%) |
| Education, Arts & Media | 6 (54.5%) | 5 (45.5%) |
| Legal Services & Support | 8 (80.0%) | 2 (20.0%) |
| Education Instruction & Library | 23 (26.7%) | 63 (73.3%) |
| Arts, Media & Entertainment | 0 (0.0%) | 2 (100.0%) |
| Health Diagnosing & Treating | 5 (8.9%) | 51 (91.1%) |
| Health Technologists | 0 (0.0%) | 25 (100.0%) |
| Total (Category) | 110 (42.1%) | 151 (57.9%) |
| Total (Overall) | 346 (48.9%) | 361 (51.1%) |
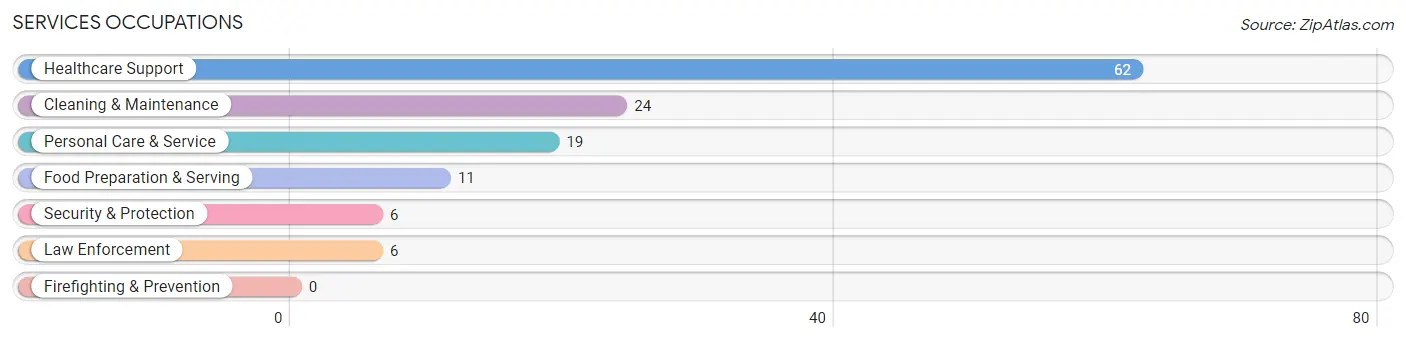
Services Occupations
The most common Services occupations in Winchester are Healthcare Support (62 | 8.8%), Cleaning & Maintenance (24 | 3.4%), Personal Care & Service (19 | 2.7%), Food Preparation & Serving (11 | 1.6%), and Security & Protection (6 | 0.9%).
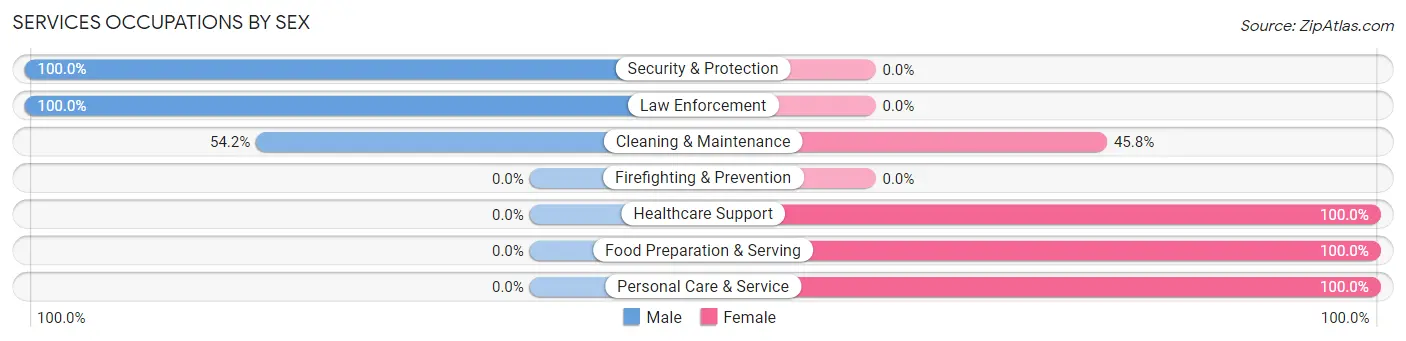
Services Occupations by Sex
Within the Services occupations in Winchester, the most male-oriented occupations are Security & Protection (100.0%), Law Enforcement (100.0%), and Cleaning & Maintenance (54.2%), while the most female-oriented occupations are Healthcare Support (100.0%), Food Preparation & Serving (100.0%), and Personal Care & Service (100.0%).
| Occupation | Male | Female |
| Healthcare Support | 0 (0.0%) | 62 (100.0%) |
| Security & Protection | 6 (100.0%) | 0 (0.0%) |
| Firefighting & Prevention | 0 (0.0%) | 0 (0.0%) |
| Law Enforcement | 6 (100.0%) | 0 (0.0%) |
| Food Preparation & Serving | 0 (0.0%) | 11 (100.0%) |
| Cleaning & Maintenance | 13 (54.2%) | 11 (45.8%) |
| Personal Care & Service | 0 (0.0%) | 19 (100.0%) |
| Total (Category) | 19 (15.6%) | 103 (84.4%) |
| Total (Overall) | 346 (48.9%) | 361 (51.1%) |
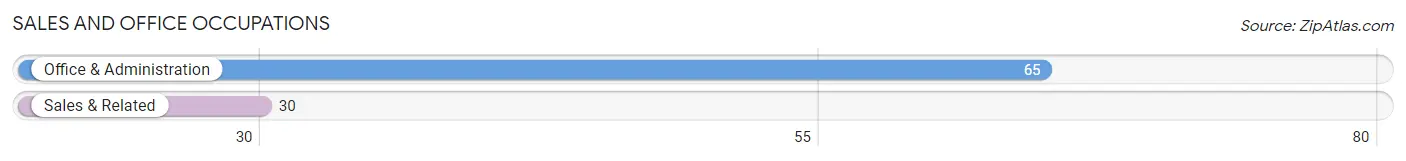
Sales and Office Occupations
The most common Sales and Office occupations in Winchester are Office & Administration (65 | 9.2%), and Sales & Related (30 | 4.2%).
Sales and Office Occupations by Sex
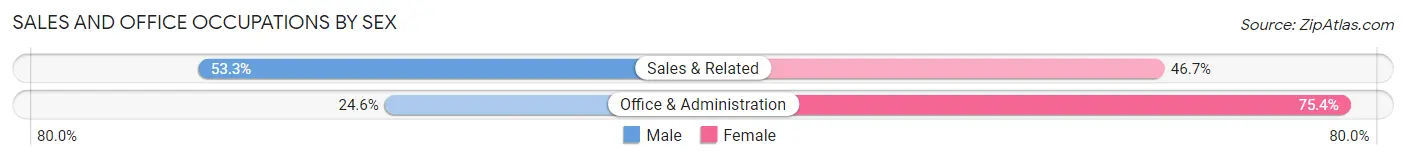
| Occupation | Male | Female |
| Sales & Related | 16 (53.3%) | 14 (46.7%) |
| Office & Administration | 16 (24.6%) | 49 (75.4%) |
| Total (Category) | 32 (33.7%) | 63 (66.3%) |
| Total (Overall) | 346 (48.9%) | 361 (51.1%) |
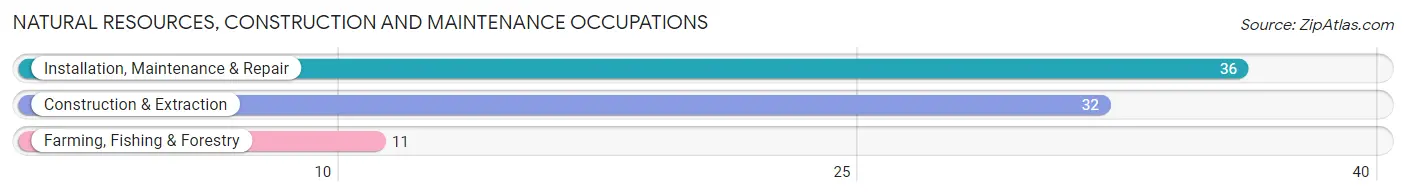
Natural Resources, Construction and Maintenance Occupations
The most common Natural Resources, Construction and Maintenance occupations in Winchester are Installation, Maintenance & Repair (36 | 5.1%), Construction & Extraction (32 | 4.5%), and Farming, Fishing & Forestry (11 | 1.6%).
Natural Resources, Construction and Maintenance Occupations by Sex
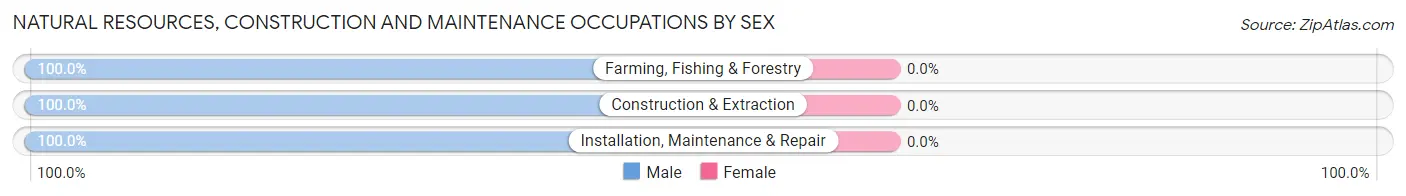
| Occupation | Male | Female |
| Farming, Fishing & Forestry | 11 (100.0%) | 0 (0.0%) |
| Construction & Extraction | 32 (100.0%) | 0 (0.0%) |
| Installation, Maintenance & Repair | 36 (100.0%) | 0 (0.0%) |
| Total (Category) | 79 (100.0%) | 0 (0.0%) |
| Total (Overall) | 346 (48.9%) | 361 (51.1%) |
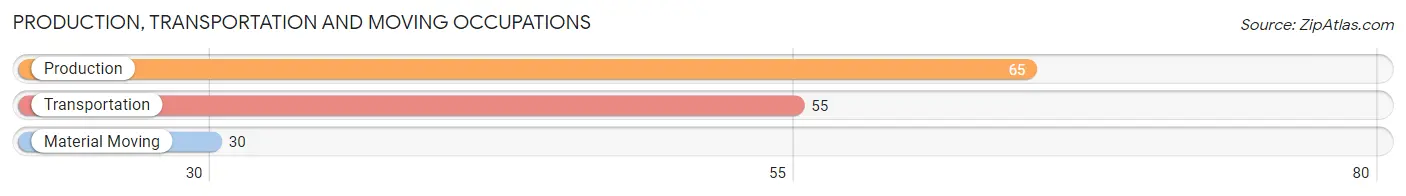
Production, Transportation and Moving Occupations
The most common Production, Transportation and Moving occupations in Winchester are Production (65 | 9.2%), Transportation (55 | 7.8%), and Material Moving (30 | 4.2%).
Production, Transportation and Moving Occupations by Sex
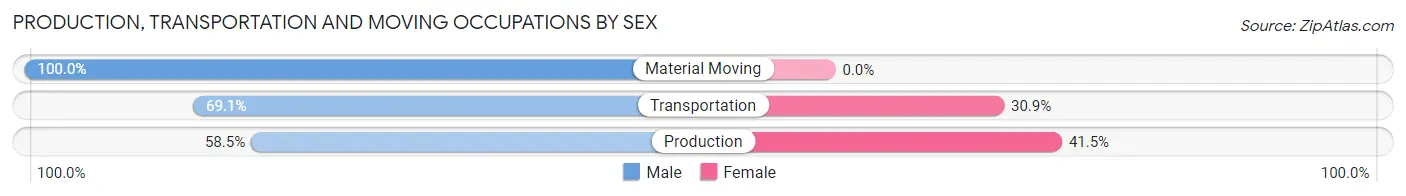
| Occupation | Male | Female |
| Production | 38 (58.5%) | 27 (41.5%) |
| Transportation | 38 (69.1%) | 17 (30.9%) |
| Material Moving | 30 (100.0%) | 0 (0.0%) |
| Total (Category) | 106 (70.7%) | 44 (29.3%) |
| Total (Overall) | 346 (48.9%) | 361 (51.1%) |
Employment Industries by Sex in Winchester
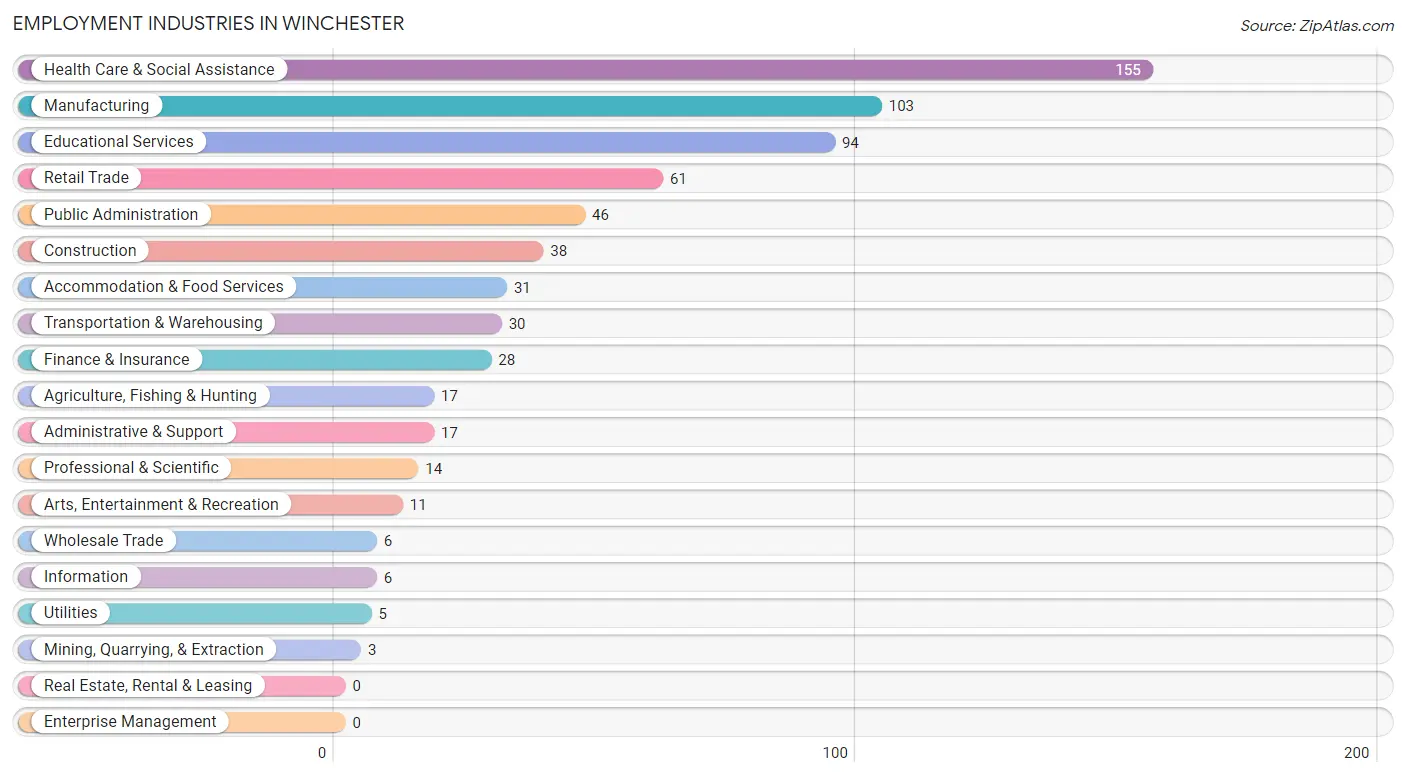
Employment Industries in Winchester
The major employment industries in Winchester include Health Care & Social Assistance (155 | 21.9%), Manufacturing (103 | 14.6%), Educational Services (94 | 13.3%), Retail Trade (61 | 8.6%), and Public Administration (46 | 6.5%).
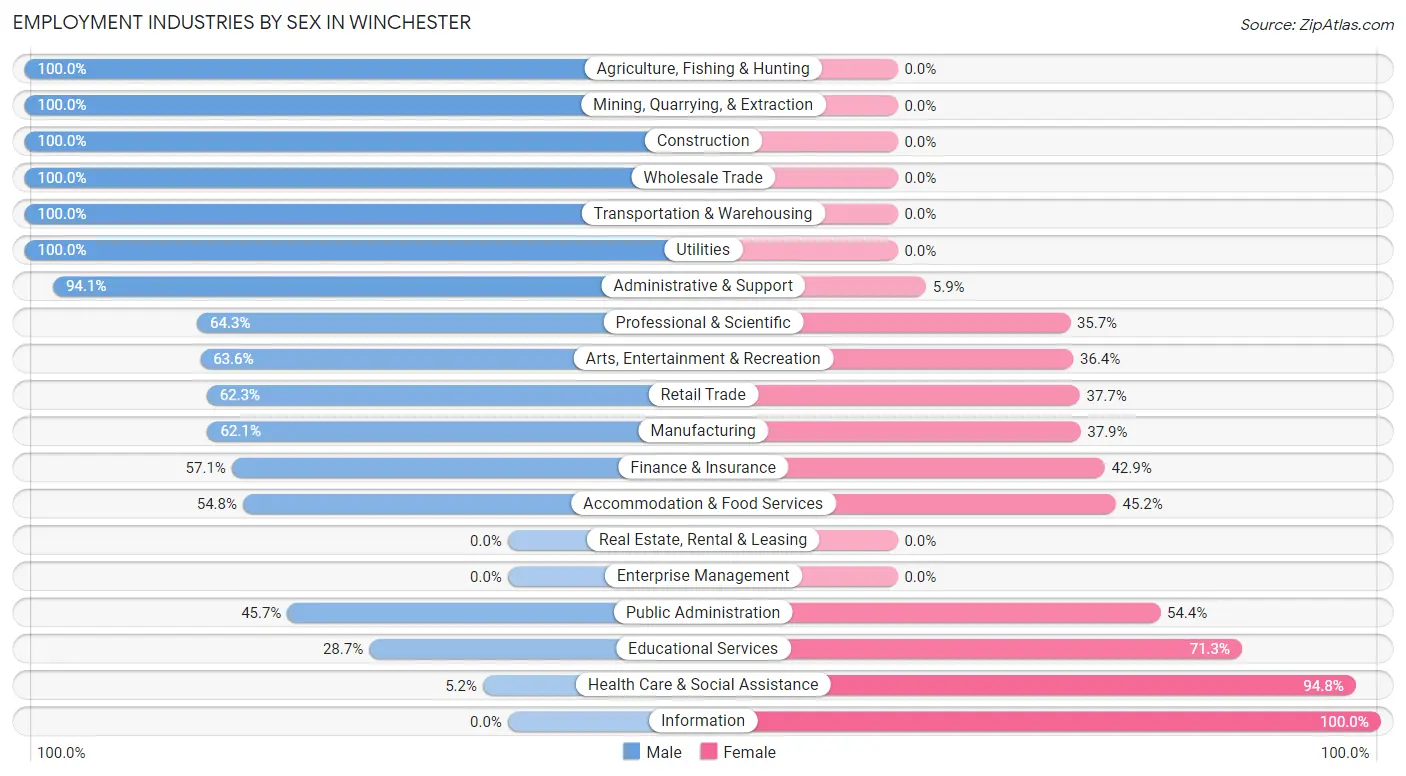
Employment Industries by Sex in Winchester
The Winchester industries that see more men than women are Agriculture, Fishing & Hunting (100.0%), Mining, Quarrying, & Extraction (100.0%), and Construction (100.0%), whereas the industries that tend to have a higher number of women are Information (100.0%), Health Care & Social Assistance (94.8%), and Educational Services (71.3%).
| Industry | Male | Female |
| Agriculture, Fishing & Hunting | 17 (100.0%) | 0 (0.0%) |
| Mining, Quarrying, & Extraction | 3 (100.0%) | 0 (0.0%) |
| Construction | 38 (100.0%) | 0 (0.0%) |
| Manufacturing | 64 (62.1%) | 39 (37.9%) |
| Wholesale Trade | 6 (100.0%) | 0 (0.0%) |
| Retail Trade | 38 (62.3%) | 23 (37.7%) |
| Transportation & Warehousing | 30 (100.0%) | 0 (0.0%) |
| Utilities | 5 (100.0%) | 0 (0.0%) |
| Information | 0 (0.0%) | 6 (100.0%) |
| Finance & Insurance | 16 (57.1%) | 12 (42.9%) |
| Real Estate, Rental & Leasing | 0 (0.0%) | 0 (0.0%) |
| Professional & Scientific | 9 (64.3%) | 5 (35.7%) |
| Enterprise Management | 0 (0.0%) | 0 (0.0%) |
| Administrative & Support | 16 (94.1%) | 1 (5.9%) |
| Educational Services | 27 (28.7%) | 67 (71.3%) |
| Health Care & Social Assistance | 8 (5.2%) | 147 (94.8%) |
| Arts, Entertainment & Recreation | 7 (63.6%) | 4 (36.4%) |
| Accommodation & Food Services | 17 (54.8%) | 14 (45.2%) |
| Public Administration | 21 (45.7%) | 25 (54.3%) |
| Total | 346 (48.9%) | 361 (51.1%) |
Education in Winchester
School Enrollment in Winchester
The most common levels of schooling among the 357 students in Winchester are elementary school (116 | 32.5%), high school (88 | 24.6%), and middle school (74 | 20.7%).
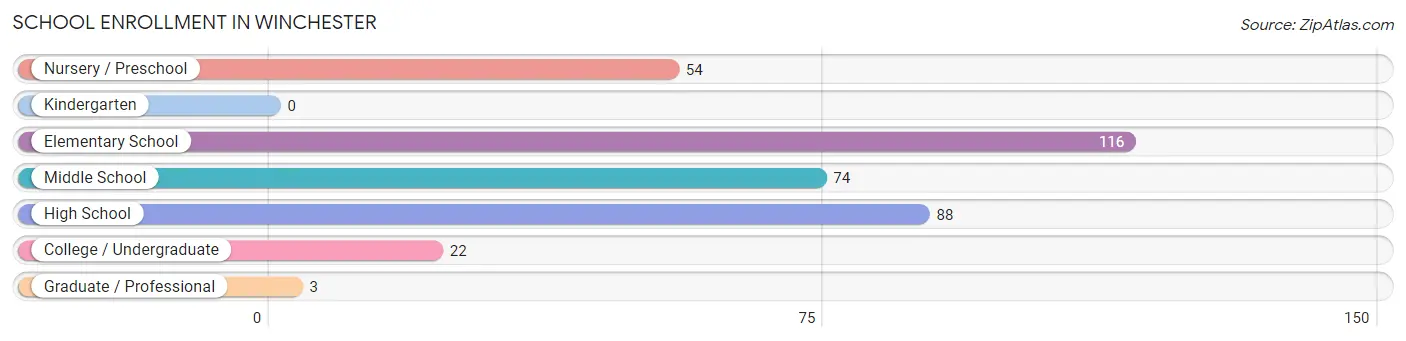
| School Level | # Students | % Students |
| Nursery / Preschool | 54 | 15.1% |
| Kindergarten | 0 | 0.0% |
| Elementary School | 116 | 32.5% |
| Middle School | 74 | 20.7% |
| High School | 88 | 24.6% |
| College / Undergraduate | 22 | 6.2% |
| Graduate / Professional | 3 | 0.8% |
| Total | 357 | 100.0% |
School Enrollment by Age by Funding Source in Winchester
Out of a total of 357 students who are enrolled in schools in Winchester, 22 (6.2%) attend a private institution, while the remaining 335 (93.8%) are enrolled in public schools. The age group of 25 to 34 year olds has the highest likelihood of being enrolled in private schools, with 6 (75.0% in the age bracket) enrolled. Conversely, the age group of 10 to 14 year olds has the lowest likelihood of being enrolled in a private school, with 117 (100.0% in the age bracket) attending a public institution.
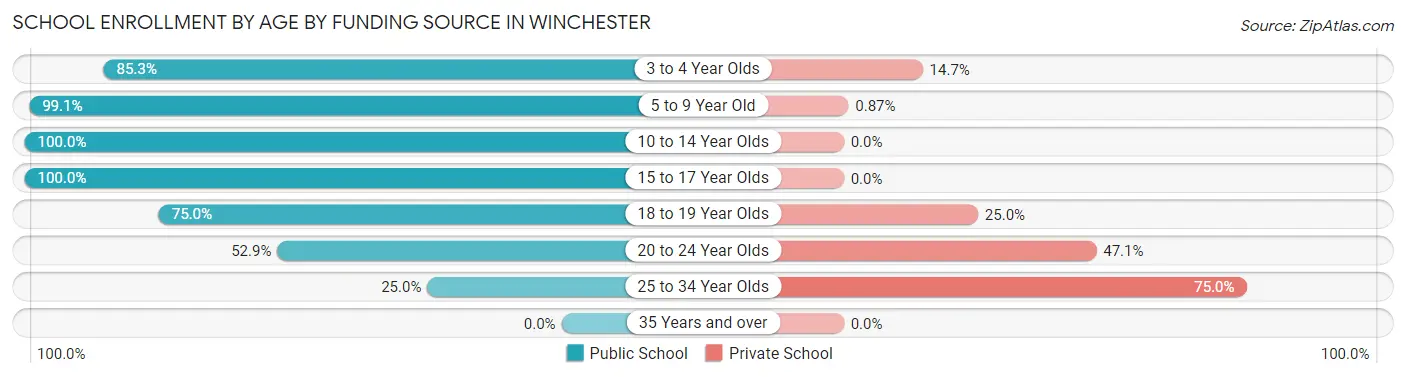
| Age Bracket | Public School | Private School |
| 3 to 4 Year Olds | 29 (85.3%) | 5 (14.7%) |
| 5 to 9 Year Old | 114 (99.1%) | 1 (0.9%) |
| 10 to 14 Year Olds | 117 (100.0%) | 0 (0.0%) |
| 15 to 17 Year Olds | 58 (100.0%) | 0 (0.0%) |
| 18 to 19 Year Olds | 6 (75.0%) | 2 (25.0%) |
| 20 to 24 Year Olds | 9 (52.9%) | 8 (47.1%) |
| 25 to 34 Year Olds | 2 (25.0%) | 6 (75.0%) |
| 35 Years and over | 0 (0.0%) | 0 (0.0%) |
| Total | 335 (93.8%) | 22 (6.2%) |
Educational Attainment by Field of Study in Winchester
Education (98 | 42.6%), business (20 | 8.7%), science & technology (19 | 8.3%), social sciences (18 | 7.8%), and bio, nature & agricultural (14 | 6.1%) are the most common fields of study among 230 individuals in Winchester who have obtained a bachelor's degree or higher.
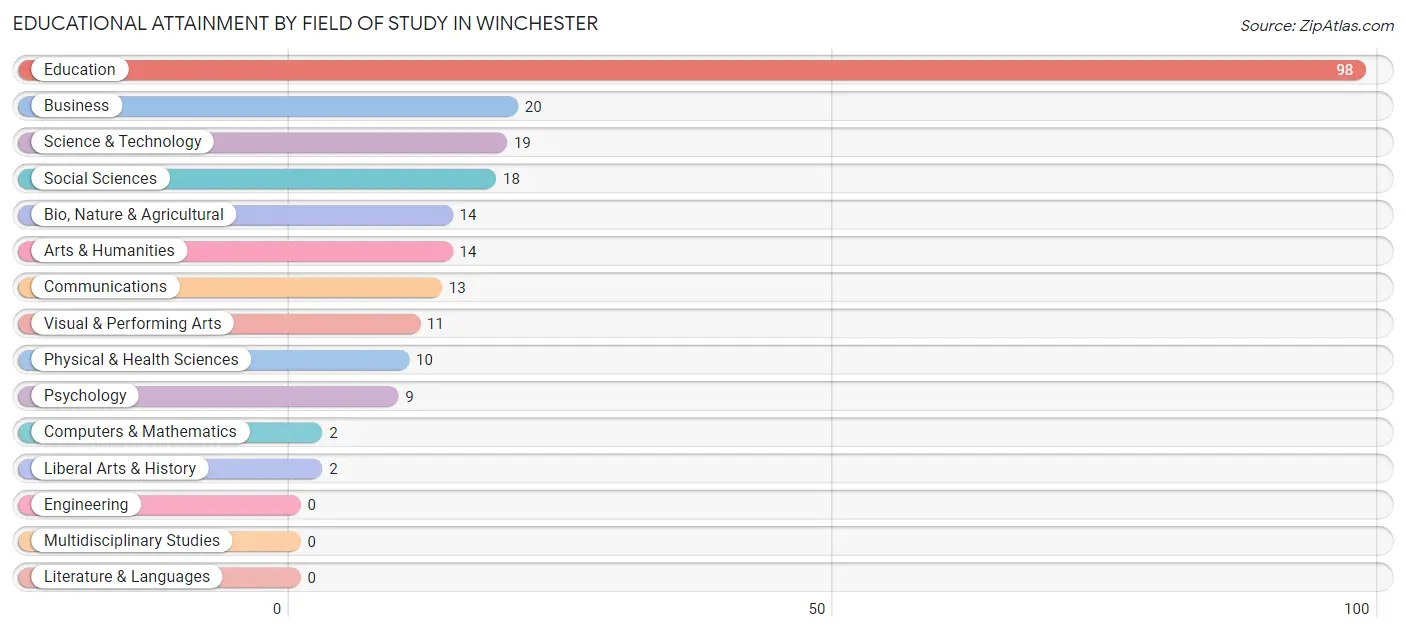
| Field of Study | # Graduates | % Graduates |
| Computers & Mathematics | 2 | 0.9% |
| Bio, Nature & Agricultural | 14 | 6.1% |
| Physical & Health Sciences | 10 | 4.3% |
| Psychology | 9 | 3.9% |
| Social Sciences | 18 | 7.8% |
| Engineering | 0 | 0.0% |
| Multidisciplinary Studies | 0 | 0.0% |
| Science & Technology | 19 | 8.3% |
| Business | 20 | 8.7% |
| Education | 98 | 42.6% |
| Literature & Languages | 0 | 0.0% |
| Liberal Arts & History | 2 | 0.9% |
| Visual & Performing Arts | 11 | 4.8% |
| Communications | 13 | 5.7% |
| Arts & Humanities | 14 | 6.1% |
| Total | 230 | 100.0% |
Transportation & Commute in Winchester
Vehicle Availability by Sex in Winchester
The most prevalent vehicle ownership categories in Winchester are males with 2 vehicles (123, accounting for 37.6%) and females with 2 vehicles (131, making up 35.0%).
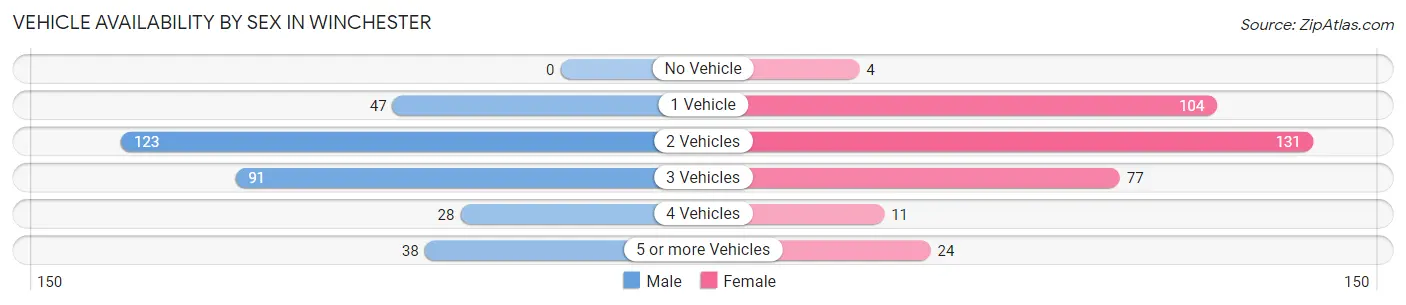
| Vehicles Available | Male | Female |
| No Vehicle | 0 (0.0%) | 4 (1.1%) |
| 1 Vehicle | 47 (14.4%) | 104 (29.6%) |
| 2 Vehicles | 123 (37.6%) | 131 (37.3%) |
| 3 Vehicles | 91 (27.8%) | 77 (21.9%) |
| 4 Vehicles | 28 (8.6%) | 11 (3.1%) |
| 5 or more Vehicles | 38 (11.6%) | 24 (6.8%) |
| Total | 327 (100.0%) | 351 (100.0%) |
Commute Time in Winchester
The most frequently occuring commute durations in Winchester are 20 to 24 minutes (137 commuters, 20.7%), 25 to 29 minutes (118 commuters, 17.8%), and less than 5 minutes (79 commuters, 11.9%).
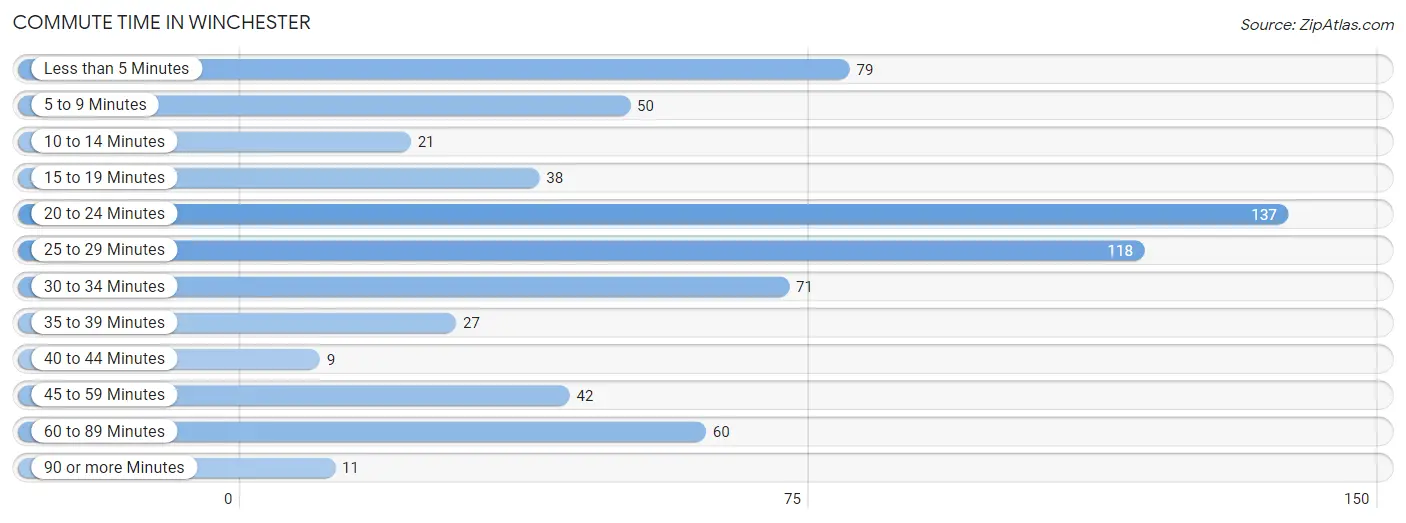
| Commute Time | # Commuters | % Commuters |
| Less than 5 Minutes | 79 | 11.9% |
| 5 to 9 Minutes | 50 | 7.5% |
| 10 to 14 Minutes | 21 | 3.2% |
| 15 to 19 Minutes | 38 | 5.7% |
| 20 to 24 Minutes | 137 | 20.7% |
| 25 to 29 Minutes | 118 | 17.8% |
| 30 to 34 Minutes | 71 | 10.7% |
| 35 to 39 Minutes | 27 | 4.1% |
| 40 to 44 Minutes | 9 | 1.4% |
| 45 to 59 Minutes | 42 | 6.3% |
| 60 to 89 Minutes | 60 | 9.0% |
| 90 or more Minutes | 11 | 1.7% |
Commute Time by Sex in Winchester
The most common commute times in Winchester are 20 to 24 minutes (61 commuters, 18.8%) for males and 25 to 29 minutes (83 commuters, 24.5%) for females.
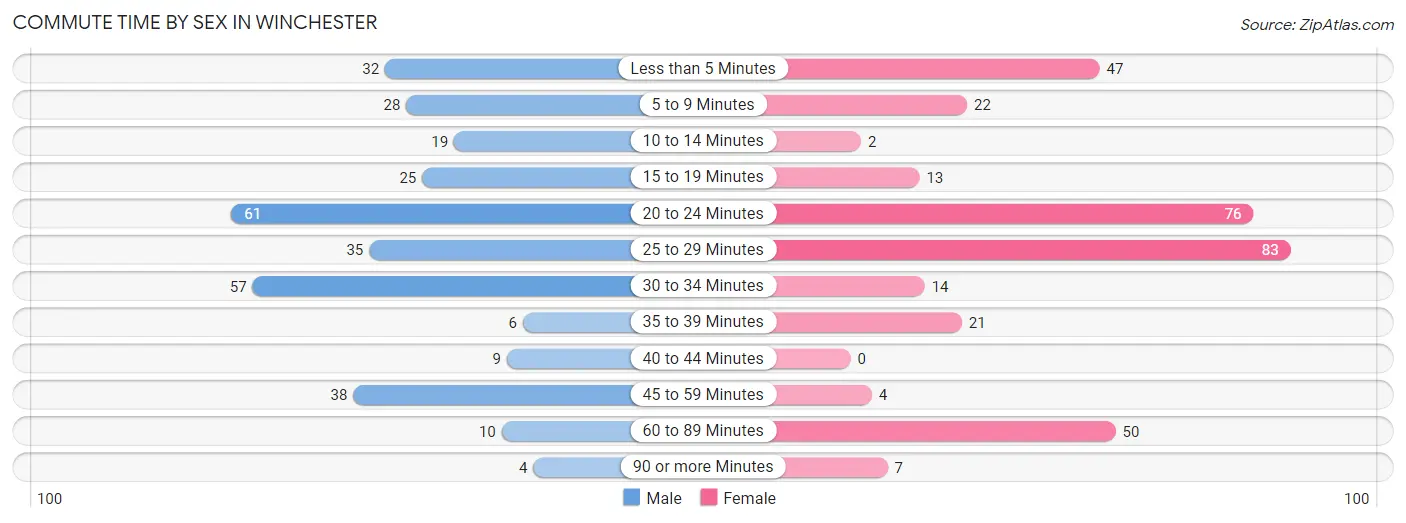
| Commute Time | Male | Female |
| Less than 5 Minutes | 32 (9.9%) | 47 (13.9%) |
| 5 to 9 Minutes | 28 (8.6%) | 22 (6.5%) |
| 10 to 14 Minutes | 19 (5.9%) | 2 (0.6%) |
| 15 to 19 Minutes | 25 (7.7%) | 13 (3.8%) |
| 20 to 24 Minutes | 61 (18.8%) | 76 (22.4%) |
| 25 to 29 Minutes | 35 (10.8%) | 83 (24.5%) |
| 30 to 34 Minutes | 57 (17.6%) | 14 (4.1%) |
| 35 to 39 Minutes | 6 (1.8%) | 21 (6.2%) |
| 40 to 44 Minutes | 9 (2.8%) | 0 (0.0%) |
| 45 to 59 Minutes | 38 (11.7%) | 4 (1.2%) |
| 60 to 89 Minutes | 10 (3.1%) | 50 (14.7%) |
| 90 or more Minutes | 4 (1.2%) | 7 (2.1%) |
Time of Departure to Work by Sex in Winchester
The most frequent times of departure to work in Winchester are 7:00 AM to 7:29 AM (54, 16.7%) for males and 7:00 AM to 7:29 AM (98, 28.9%) for females.
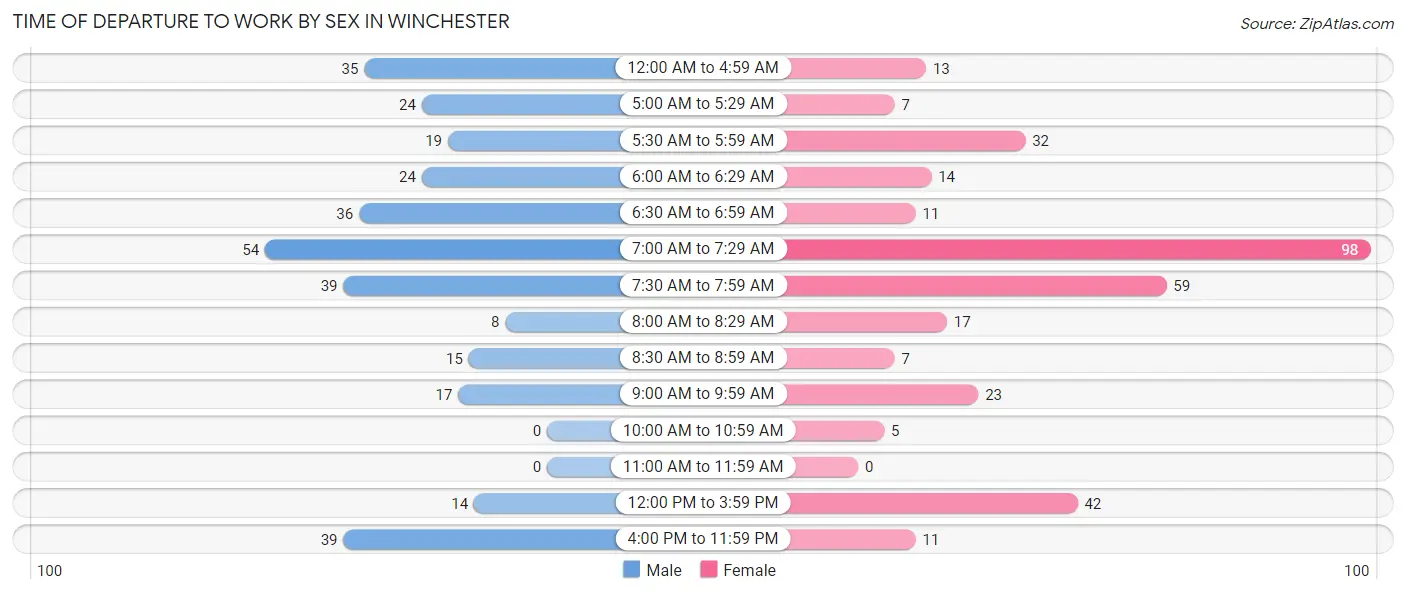
| Time of Departure | Male | Female |
| 12:00 AM to 4:59 AM | 35 (10.8%) | 13 (3.8%) |
| 5:00 AM to 5:29 AM | 24 (7.4%) | 7 (2.1%) |
| 5:30 AM to 5:59 AM | 19 (5.9%) | 32 (9.4%) |
| 6:00 AM to 6:29 AM | 24 (7.4%) | 14 (4.1%) |
| 6:30 AM to 6:59 AM | 36 (11.1%) | 11 (3.2%) |
| 7:00 AM to 7:29 AM | 54 (16.7%) | 98 (28.9%) |
| 7:30 AM to 7:59 AM | 39 (12.0%) | 59 (17.4%) |
| 8:00 AM to 8:29 AM | 8 (2.5%) | 17 (5.0%) |
| 8:30 AM to 8:59 AM | 15 (4.6%) | 7 (2.1%) |
| 9:00 AM to 9:59 AM | 17 (5.2%) | 23 (6.8%) |
| 10:00 AM to 10:59 AM | 0 (0.0%) | 5 (1.5%) |
| 11:00 AM to 11:59 AM | 0 (0.0%) | 0 (0.0%) |
| 12:00 PM to 3:59 PM | 14 (4.3%) | 42 (12.4%) |
| 4:00 PM to 11:59 PM | 39 (12.0%) | 11 (3.2%) |
| Total | 324 (100.0%) | 339 (100.0%) |
Housing Occupancy in Winchester
Occupancy by Ownership in Winchester
Of the total 636 dwellings in Winchester, owner-occupied units account for 431 (67.8%), while renter-occupied units make up 205 (32.2%).
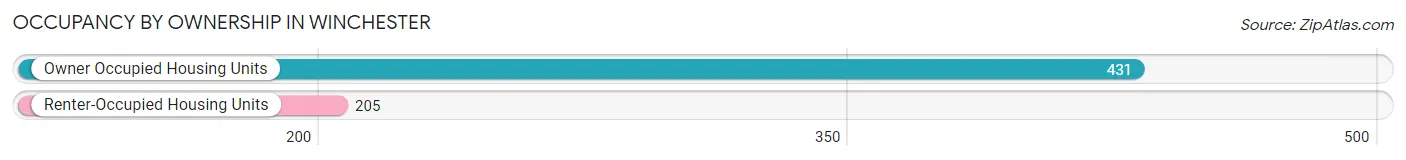
| Occupancy | # Housing Units | % Housing Units |
| Owner Occupied Housing Units | 431 | 67.8% |
| Renter-Occupied Housing Units | 205 | 32.2% |
| Total Occupied Housing Units | 636 | 100.0% |
Occupancy by Household Size in Winchester
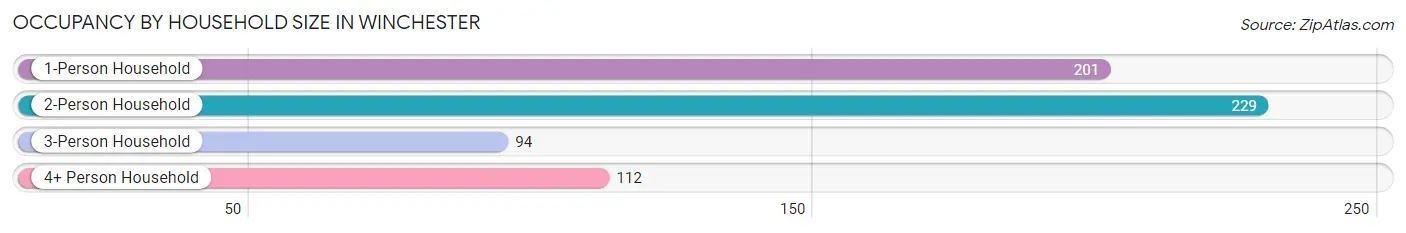
| Household Size | # Housing Units | % Housing Units |
| 1-Person Household | 201 | 31.6% |
| 2-Person Household | 229 | 36.0% |
| 3-Person Household | 94 | 14.8% |
| 4+ Person Household | 112 | 17.6% |
| Total Housing Units | 636 | 100.0% |
Occupancy by Ownership by Household Size in Winchester
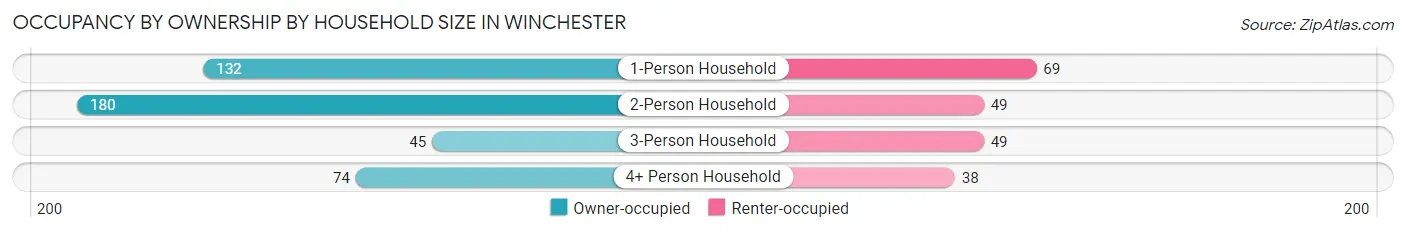
| Household Size | Owner-occupied | Renter-occupied |
| 1-Person Household | 132 (65.7%) | 69 (34.3%) |
| 2-Person Household | 180 (78.6%) | 49 (21.4%) |
| 3-Person Household | 45 (47.9%) | 49 (52.1%) |
| 4+ Person Household | 74 (66.1%) | 38 (33.9%) |
| Total Housing Units | 431 (67.8%) | 205 (32.2%) |
Occupancy by Educational Attainment in Winchester
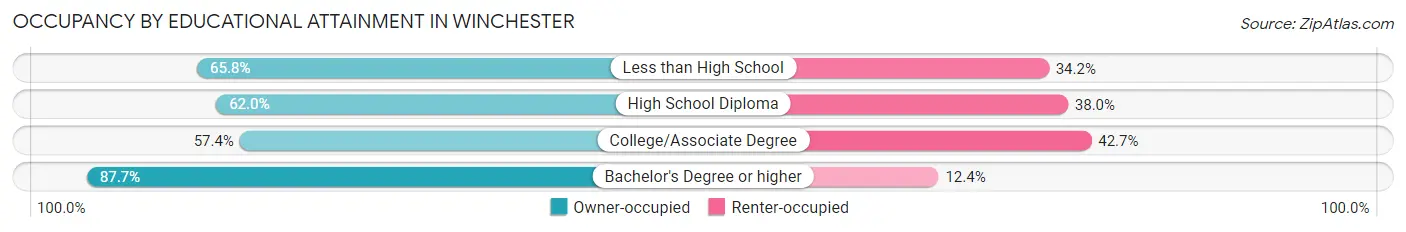
| Household Size | Owner-occupied | Renter-occupied |
| Less than High School | 25 (65.8%) | 13 (34.2%) |
| High School Diploma | 186 (62.0%) | 114 (38.0%) |
| College/Associate Degree | 78 (57.4%) | 58 (42.6%) |
| Bachelor's Degree or higher | 142 (87.6%) | 20 (12.3%) |
Occupancy by Age of Householder in Winchester
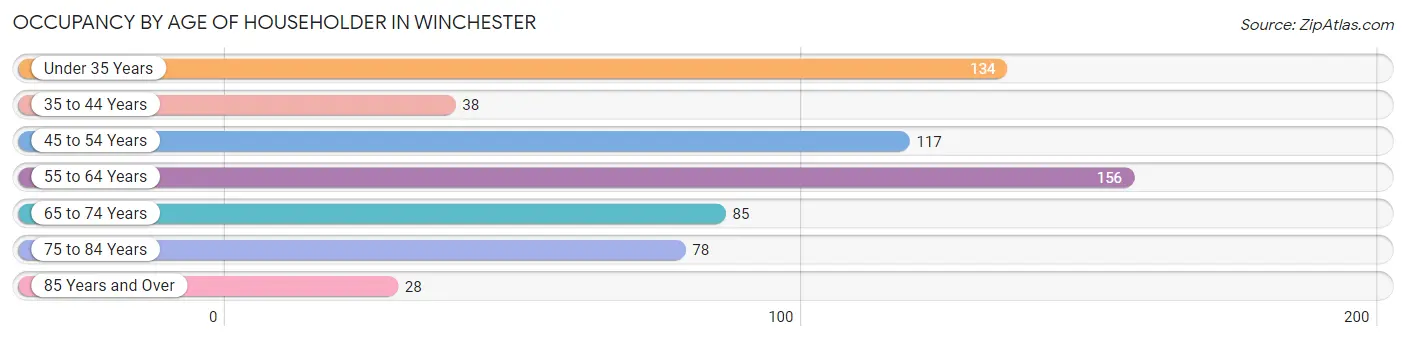
| Age Bracket | # Households | % Households |
| Under 35 Years | 134 | 21.1% |
| 35 to 44 Years | 38 | 6.0% |
| 45 to 54 Years | 117 | 18.4% |
| 55 to 64 Years | 156 | 24.5% |
| 65 to 74 Years | 85 | 13.4% |
| 75 to 84 Years | 78 | 12.3% |
| 85 Years and Over | 28 | 4.4% |
| Total | 636 | 100.0% |
Housing Finances in Winchester
Median Income by Occupancy in Winchester
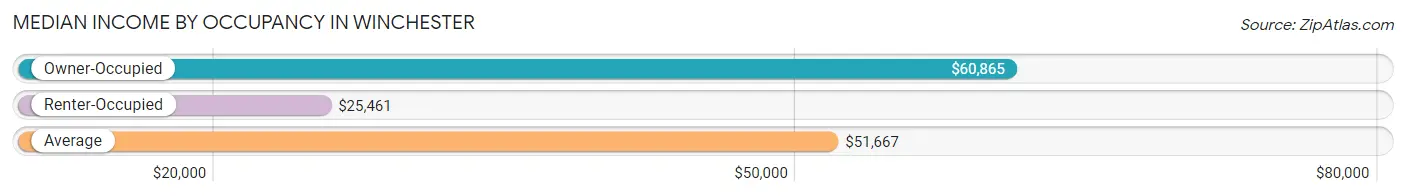
| Occupancy Type | # Households | Median Income |
| Owner-Occupied | 431 (67.8%) | $60,865 |
| Renter-Occupied | 205 (32.2%) | $25,461 |
| Average | 636 (100.0%) | $51,667 |
Occupancy by Householder Income Bracket in Winchester
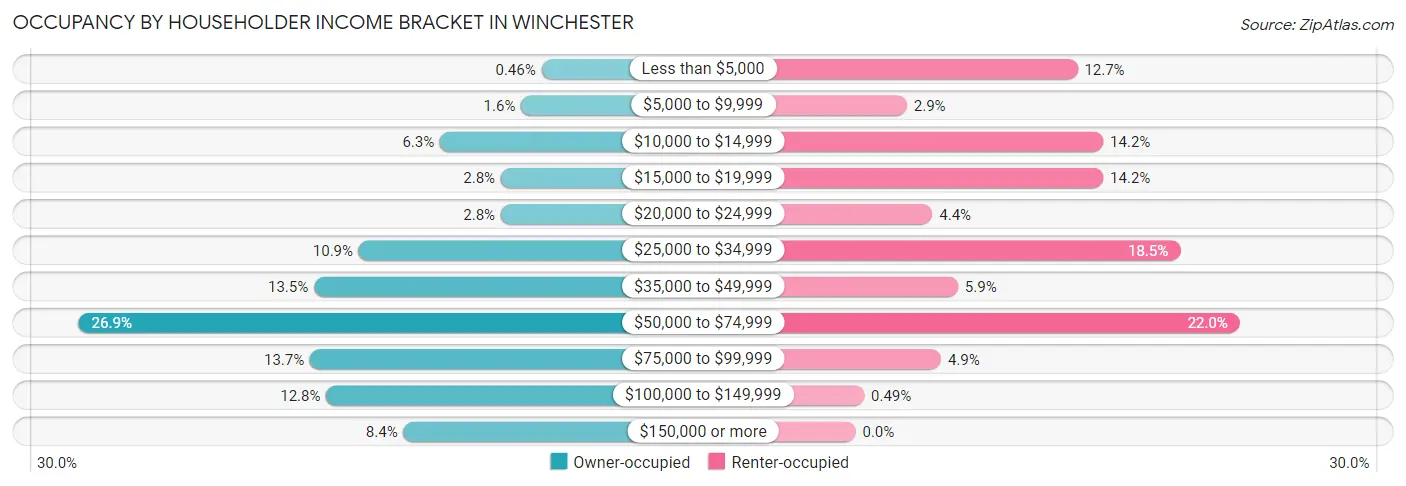
| Income Bracket | Owner-occupied | Renter-occupied |
| Less than $5,000 | 2 (0.5%) | 26 (12.7%) |
| $5,000 to $9,999 | 7 (1.6%) | 6 (2.9%) |
| $10,000 to $14,999 | 27 (6.3%) | 29 (14.1%) |
| $15,000 to $19,999 | 12 (2.8%) | 29 (14.1%) |
| $20,000 to $24,999 | 12 (2.8%) | 9 (4.4%) |
| $25,000 to $34,999 | 47 (10.9%) | 38 (18.5%) |
| $35,000 to $49,999 | 58 (13.5%) | 12 (5.9%) |
| $50,000 to $74,999 | 116 (26.9%) | 45 (22.0%) |
| $75,000 to $99,999 | 59 (13.7%) | 10 (4.9%) |
| $100,000 to $149,999 | 55 (12.8%) | 1 (0.5%) |
| $150,000 or more | 36 (8.4%) | 0 (0.0%) |
| Total | 431 (100.0%) | 205 (100.0%) |
Monthly Housing Cost Tiers in Winchester
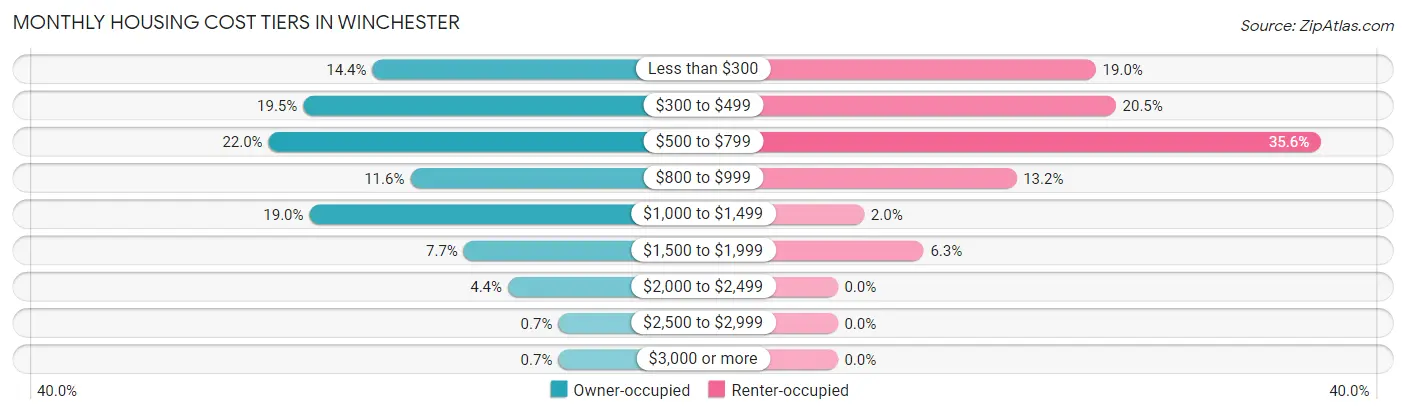
| Monthly Cost | Owner-occupied | Renter-occupied |
| Less than $300 | 62 (14.4%) | 39 (19.0%) |
| $300 to $499 | 84 (19.5%) | 42 (20.5%) |
| $500 to $799 | 95 (22.0%) | 73 (35.6%) |
| $800 to $999 | 50 (11.6%) | 27 (13.2%) |
| $1,000 to $1,499 | 82 (19.0%) | 4 (1.9%) |
| $1,500 to $1,999 | 33 (7.7%) | 13 (6.3%) |
| $2,000 to $2,499 | 19 (4.4%) | 0 (0.0%) |
| $2,500 to $2,999 | 3 (0.7%) | 0 (0.0%) |
| $3,000 or more | 3 (0.7%) | 0 (0.0%) |
| Total | 431 (100.0%) | 205 (100.0%) |
Physical Housing Characteristics in Winchester
Housing Structures in Winchester
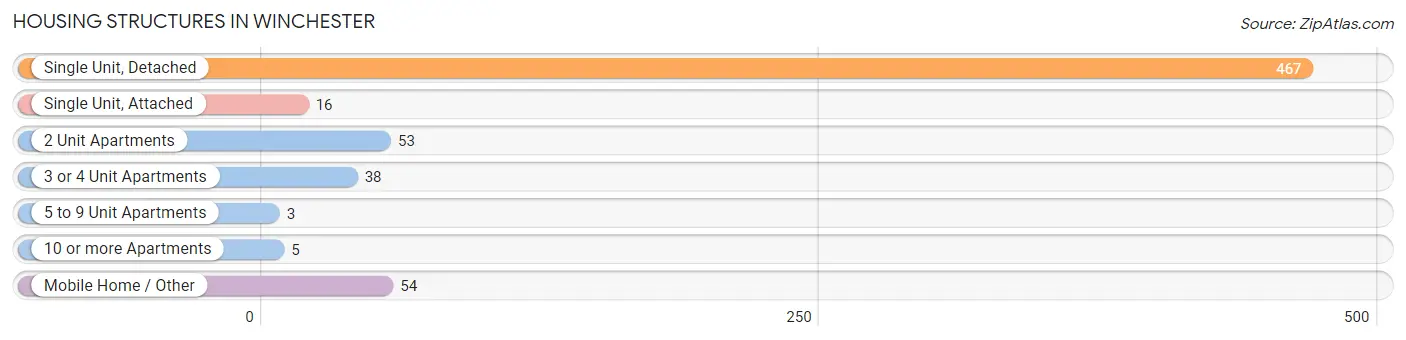
| Structure Type | # Housing Units | % Housing Units |
| Single Unit, Detached | 467 | 73.4% |
| Single Unit, Attached | 16 | 2.5% |
| 2 Unit Apartments | 53 | 8.3% |
| 3 or 4 Unit Apartments | 38 | 6.0% |
| 5 to 9 Unit Apartments | 3 | 0.5% |
| 10 or more Apartments | 5 | 0.8% |
| Mobile Home / Other | 54 | 8.5% |
| Total | 636 | 100.0% |
Housing Structures by Occupancy in Winchester
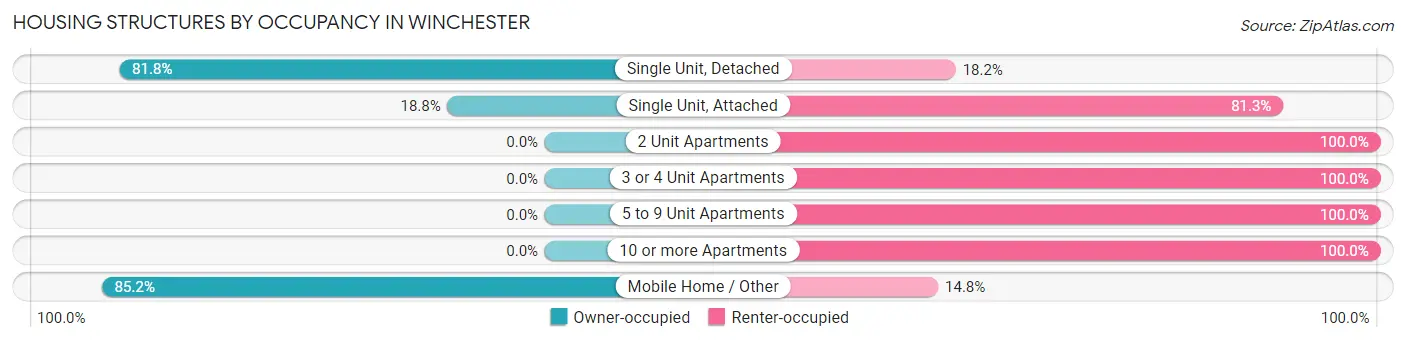
| Structure Type | Owner-occupied | Renter-occupied |
| Single Unit, Detached | 382 (81.8%) | 85 (18.2%) |
| Single Unit, Attached | 3 (18.8%) | 13 (81.2%) |
| 2 Unit Apartments | 0 (0.0%) | 53 (100.0%) |
| 3 or 4 Unit Apartments | 0 (0.0%) | 38 (100.0%) |
| 5 to 9 Unit Apartments | 0 (0.0%) | 3 (100.0%) |
| 10 or more Apartments | 0 (0.0%) | 5 (100.0%) |
| Mobile Home / Other | 46 (85.2%) | 8 (14.8%) |
| Total | 431 (67.8%) | 205 (32.2%) |
Housing Structures by Number of Rooms in Winchester
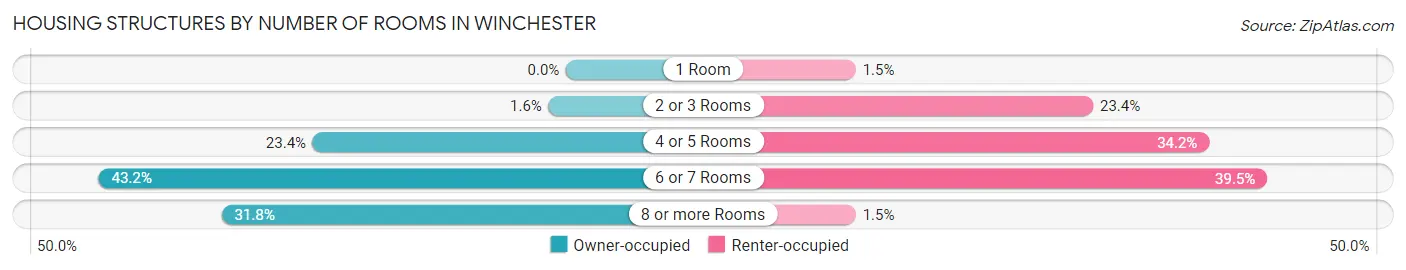
| Number of Rooms | Owner-occupied | Renter-occupied |
| 1 Room | 0 (0.0%) | 3 (1.5%) |
| 2 or 3 Rooms | 7 (1.6%) | 48 (23.4%) |
| 4 or 5 Rooms | 101 (23.4%) | 70 (34.2%) |
| 6 or 7 Rooms | 186 (43.2%) | 81 (39.5%) |
| 8 or more Rooms | 137 (31.8%) | 3 (1.5%) |
| Total | 431 (100.0%) | 205 (100.0%) |
Housing Structure by Heating Type in Winchester
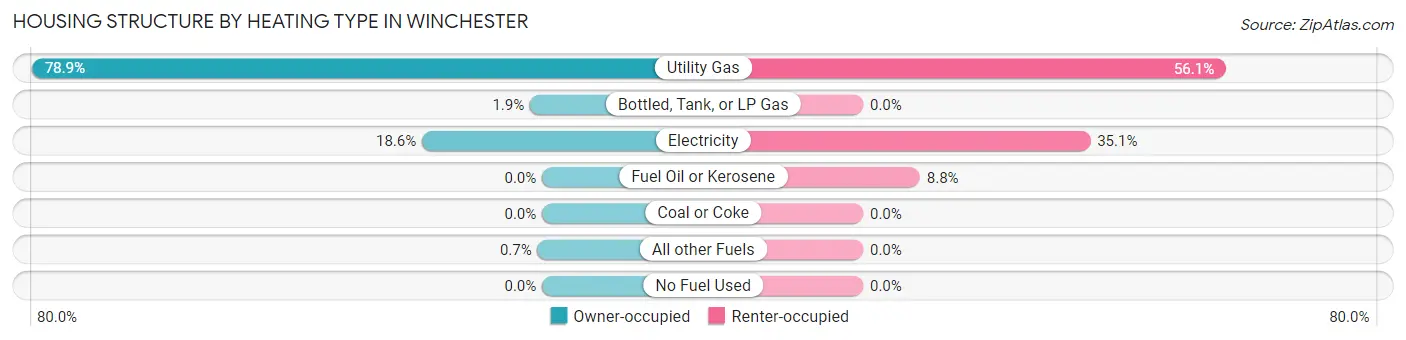
| Heating Type | Owner-occupied | Renter-occupied |
| Utility Gas | 340 (78.9%) | 115 (56.1%) |
| Bottled, Tank, or LP Gas | 8 (1.9%) | 0 (0.0%) |
| Electricity | 80 (18.6%) | 72 (35.1%) |
| Fuel Oil or Kerosene | 0 (0.0%) | 18 (8.8%) |
| Coal or Coke | 0 (0.0%) | 0 (0.0%) |
| All other Fuels | 3 (0.7%) | 0 (0.0%) |
| No Fuel Used | 0 (0.0%) | 0 (0.0%) |
| Total | 431 (100.0%) | 205 (100.0%) |
Household Vehicle Usage in Winchester
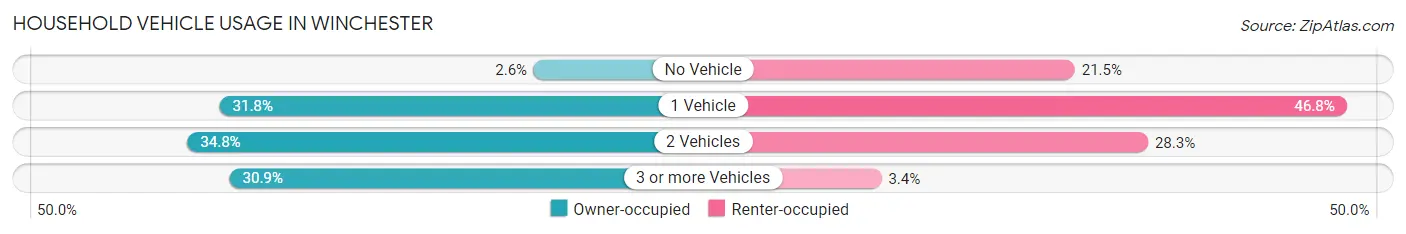
| Vehicles per Household | Owner-occupied | Renter-occupied |
| No Vehicle | 11 (2.5%) | 44 (21.5%) |
| 1 Vehicle | 137 (31.8%) | 96 (46.8%) |
| 2 Vehicles | 150 (34.8%) | 58 (28.3%) |
| 3 or more Vehicles | 133 (30.9%) | 7 (3.4%) |
| Total | 431 (100.0%) | 205 (100.0%) |
Real Estate & Mortgages in Winchester
Real Estate and Mortgage Overview in Winchester
| Characteristic | Without Mortgage | With Mortgage |
| Housing Units | 191 | 240 |
| Median Property Value | $79,800 | $107,300 |
| Median Household Income | $50,938 | $22 |
| Monthly Housing Costs | $389 | $3 |
| Real Estate Taxes | $1,188 | $11 |
Property Value by Mortgage Status in Winchester
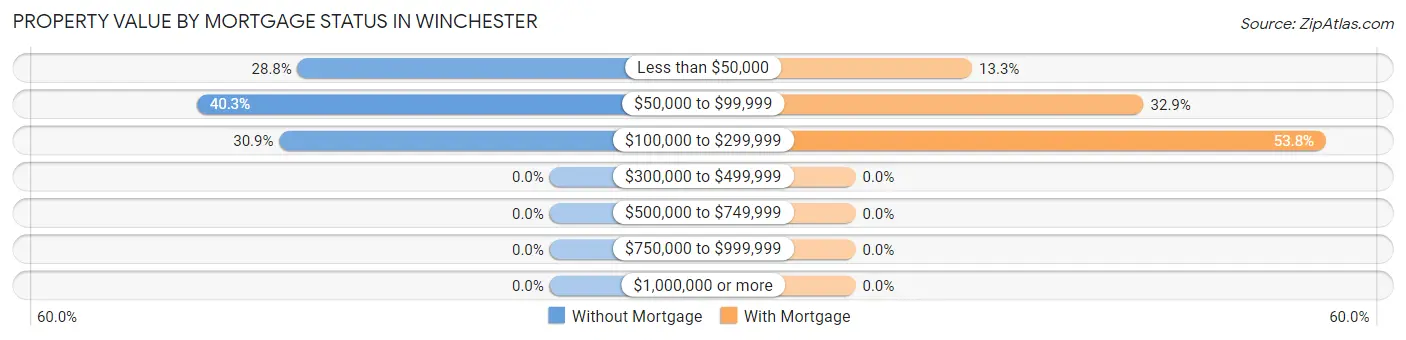
| Property Value | Without Mortgage | With Mortgage |
| Less than $50,000 | 55 (28.8%) | 32 (13.3%) |
| $50,000 to $99,999 | 77 (40.3%) | 79 (32.9%) |
| $100,000 to $299,999 | 59 (30.9%) | 129 (53.7%) |
| $300,000 to $499,999 | 0 (0.0%) | 0 (0.0%) |
| $500,000 to $749,999 | 0 (0.0%) | 0 (0.0%) |
| $750,000 to $999,999 | 0 (0.0%) | 0 (0.0%) |
| $1,000,000 or more | 0 (0.0%) | 0 (0.0%) |
| Total | 191 (100.0%) | 240 (100.0%) |
Household Income by Mortgage Status in Winchester
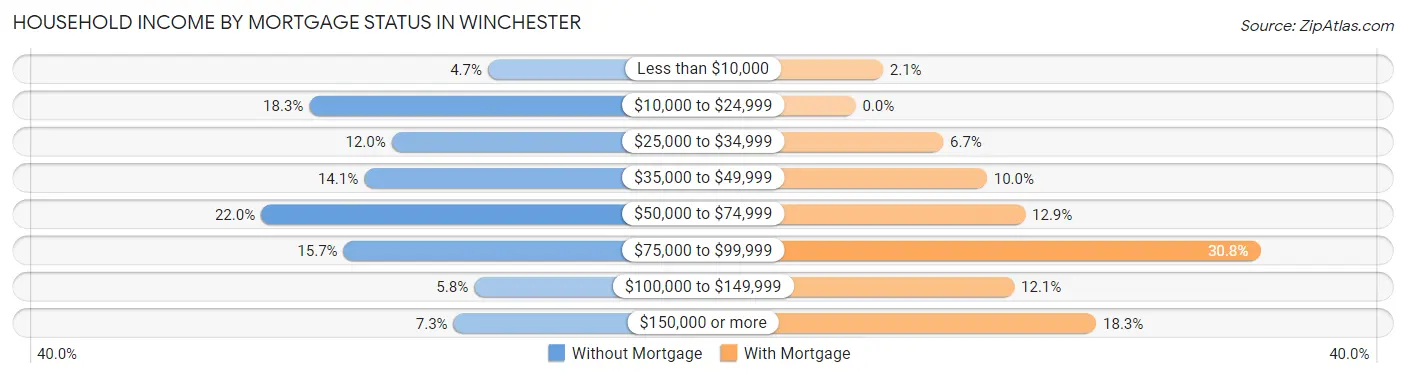
| Household Income | Without Mortgage | With Mortgage |
| Less than $10,000 | 9 (4.7%) | 5 (2.1%) |
| $10,000 to $24,999 | 35 (18.3%) | 0 (0.0%) |
| $25,000 to $34,999 | 23 (12.0%) | 16 (6.7%) |
| $35,000 to $49,999 | 27 (14.1%) | 24 (10.0%) |
| $50,000 to $74,999 | 42 (22.0%) | 31 (12.9%) |
| $75,000 to $99,999 | 30 (15.7%) | 74 (30.8%) |
| $100,000 to $149,999 | 11 (5.8%) | 29 (12.1%) |
| $150,000 or more | 14 (7.3%) | 44 (18.3%) |
| Total | 191 (100.0%) | 240 (100.0%) |
Property Value to Household Income Ratio in Winchester
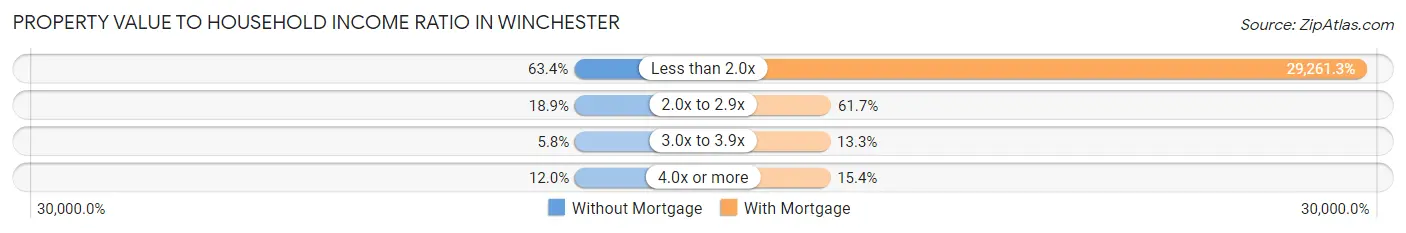
| Value-to-Income Ratio | Without Mortgage | With Mortgage |
| Less than 2.0x | 121 (63.3%) | 70,227 (29,261.3%) |
| 2.0x to 2.9x | 36 (18.9%) | 148 (61.7%) |
| 3.0x to 3.9x | 11 (5.8%) | 32 (13.3%) |
| 4.0x or more | 23 (12.0%) | 37 (15.4%) |
| Total | 191 (100.0%) | 240 (100.0%) |
Real Estate Taxes by Mortgage Status in Winchester
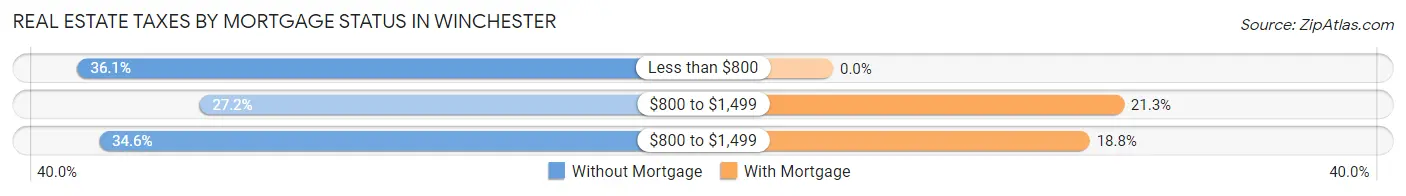
| Property Taxes | Without Mortgage | With Mortgage |
| Less than $800 | 69 (36.1%) | 0 (0.0%) |
| $800 to $1,499 | 52 (27.2%) | 51 (21.2%) |
| $800 to $1,499 | 66 (34.5%) | 45 (18.8%) |
| Total | 191 (100.0%) | 240 (100.0%) |
Health & Disability in Winchester
Health Insurance Coverage by Age in Winchester
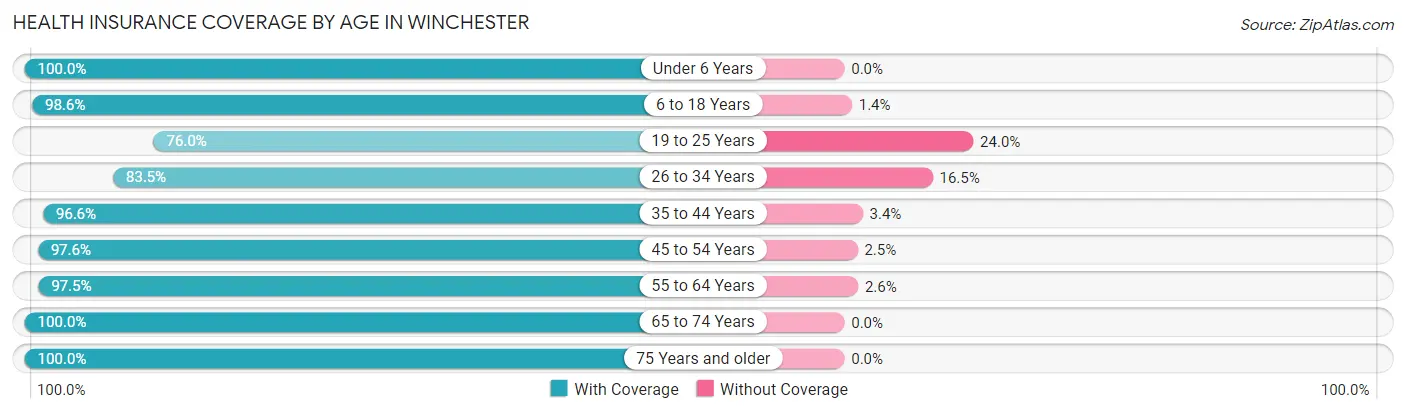
| Age Bracket | With Coverage | Without Coverage |
| Under 6 Years | 148 (100.0%) | 0 (0.0%) |
| 6 to 18 Years | 281 (98.6%) | 4 (1.4%) |
| 19 to 25 Years | 98 (76.0%) | 31 (24.0%) |
| 26 to 34 Years | 137 (83.5%) | 27 (16.5%) |
| 35 to 44 Years | 85 (96.6%) | 3 (3.4%) |
| 45 to 54 Years | 199 (97.6%) | 5 (2.5%) |
| 55 to 64 Years | 267 (97.5%) | 7 (2.5%) |
| 65 to 74 Years | 115 (100.0%) | 0 (0.0%) |
| 75 Years and older | 134 (100.0%) | 0 (0.0%) |
| Total | 1,464 (95.0%) | 77 (5.0%) |
Health Insurance Coverage by Citizenship Status in Winchester
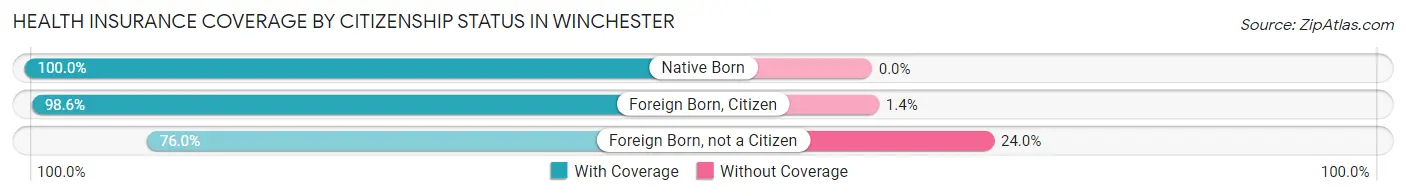
| Citizenship Status | With Coverage | Without Coverage |
| Native Born | 148 (100.0%) | 0 (0.0%) |
| Foreign Born, Citizen | 281 (98.6%) | 4 (1.4%) |
| Foreign Born, not a Citizen | 98 (76.0%) | 31 (24.0%) |
Health Insurance Coverage by Household Income in Winchester
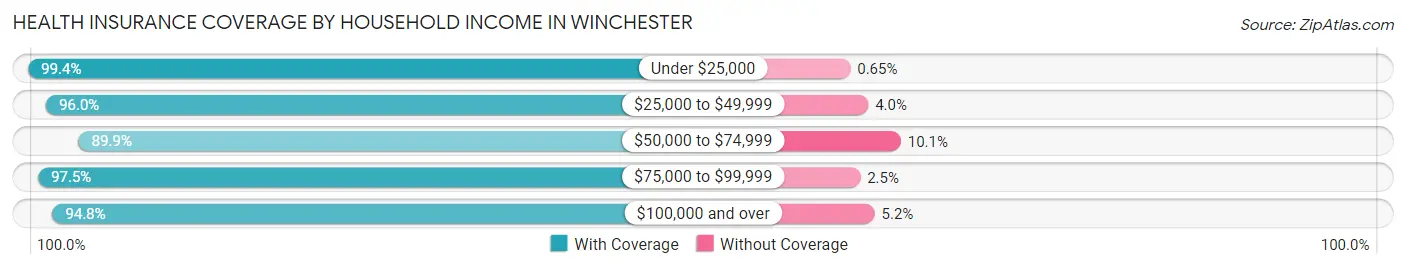
| Household Income | With Coverage | Without Coverage |
| Under $25,000 | 304 (99.4%) | 2 (0.6%) |
| $25,000 to $49,999 | 311 (96.0%) | 13 (4.0%) |
| $50,000 to $74,999 | 364 (89.9%) | 41 (10.1%) |
| $75,000 to $99,999 | 194 (97.5%) | 5 (2.5%) |
| $100,000 and over | 291 (94.8%) | 16 (5.2%) |
Public vs Private Health Insurance Coverage by Age in Winchester
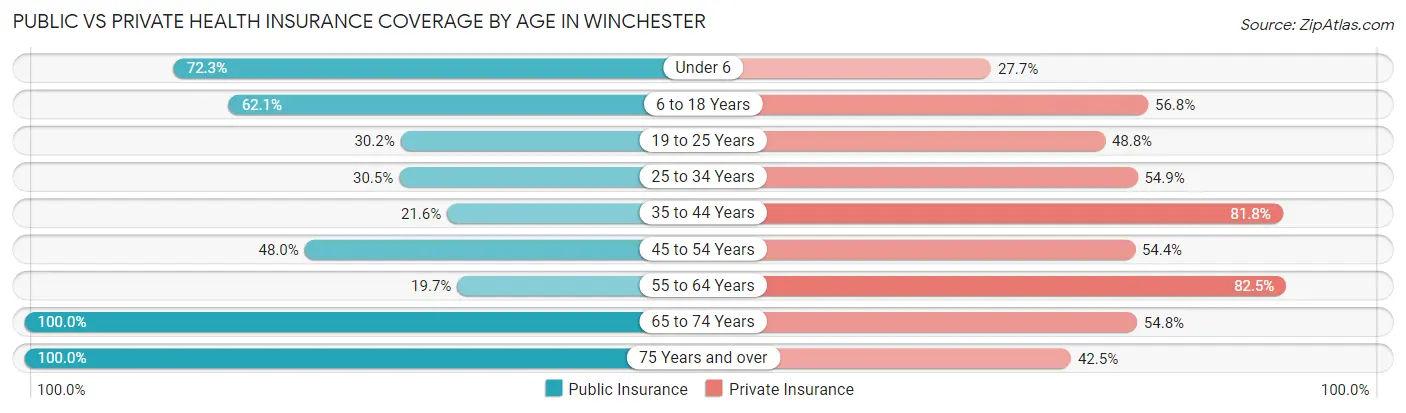
| Age Bracket | Public Insurance | Private Insurance |
| Under 6 | 107 (72.3%) | 41 (27.7%) |
| 6 to 18 Years | 177 (62.1%) | 162 (56.8%) |
| 19 to 25 Years | 39 (30.2%) | 63 (48.8%) |
| 25 to 34 Years | 50 (30.5%) | 90 (54.9%) |
| 35 to 44 Years | 19 (21.6%) | 72 (81.8%) |
| 45 to 54 Years | 98 (48.0%) | 111 (54.4%) |
| 55 to 64 Years | 54 (19.7%) | 226 (82.5%) |
| 65 to 74 Years | 115 (100.0%) | 63 (54.8%) |
| 75 Years and over | 134 (100.0%) | 57 (42.5%) |
| Total | 793 (51.5%) | 885 (57.4%) |
Disability Status by Sex by Age in Winchester
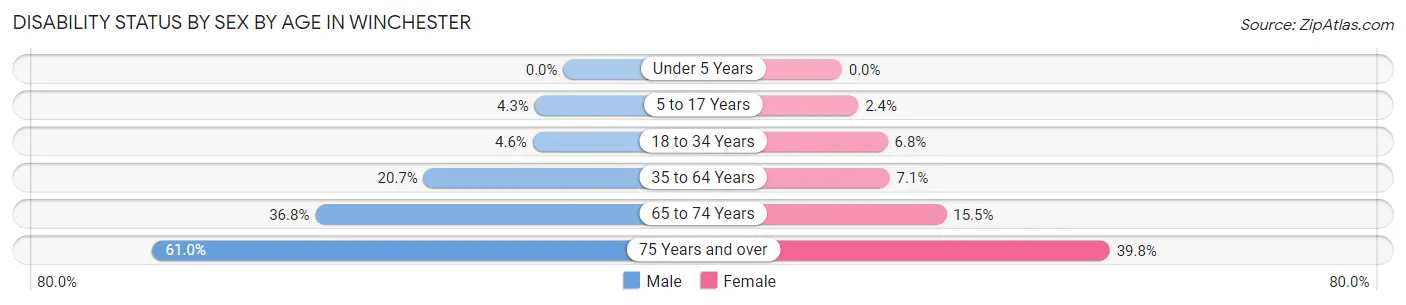
| Age Bracket | Male | Female |
| Under 5 Years | 0 (0.0%) | 0 (0.0%) |
| 5 to 17 Years | 6 (4.3%) | 4 (2.4%) |
| 18 to 34 Years | 7 (4.5%) | 10 (6.8%) |
| 35 to 64 Years | 56 (20.7%) | 21 (7.1%) |
| 65 to 74 Years | 21 (36.8%) | 9 (15.5%) |
| 75 Years and over | 25 (61.0%) | 37 (39.8%) |
Disability Class by Sex by Age in Winchester
Disability Class: Hearing Difficulty
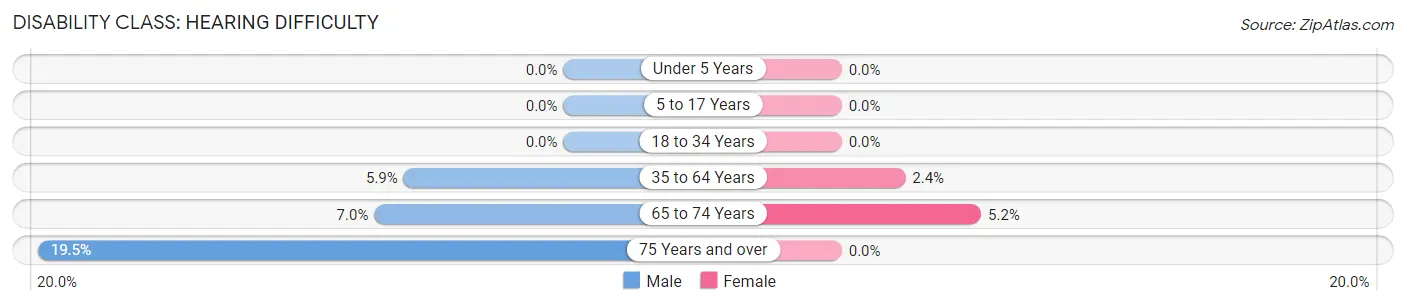
| Age Bracket | Male | Female |
| Under 5 Years | 0 (0.0%) | 0 (0.0%) |
| 5 to 17 Years | 0 (0.0%) | 0 (0.0%) |
| 18 to 34 Years | 0 (0.0%) | 0 (0.0%) |
| 35 to 64 Years | 16 (5.9%) | 7 (2.4%) |
| 65 to 74 Years | 4 (7.0%) | 3 (5.2%) |
| 75 Years and over | 8 (19.5%) | 0 (0.0%) |
Disability Class: Vision Difficulty
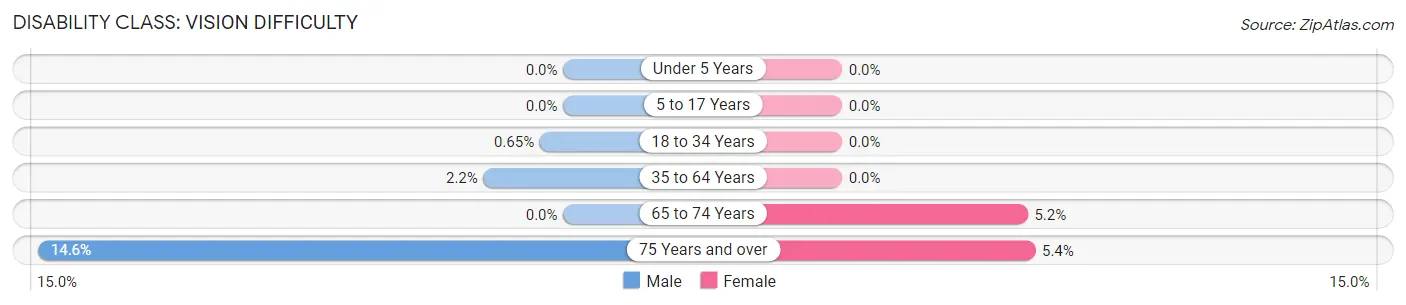
| Age Bracket | Male | Female |
| Under 5 Years | 0 (0.0%) | 0 (0.0%) |
| 5 to 17 Years | 0 (0.0%) | 0 (0.0%) |
| 18 to 34 Years | 1 (0.6%) | 0 (0.0%) |
| 35 to 64 Years | 6 (2.2%) | 0 (0.0%) |
| 65 to 74 Years | 0 (0.0%) | 3 (5.2%) |
| 75 Years and over | 6 (14.6%) | 5 (5.4%) |
Disability Class: Cognitive Difficulty
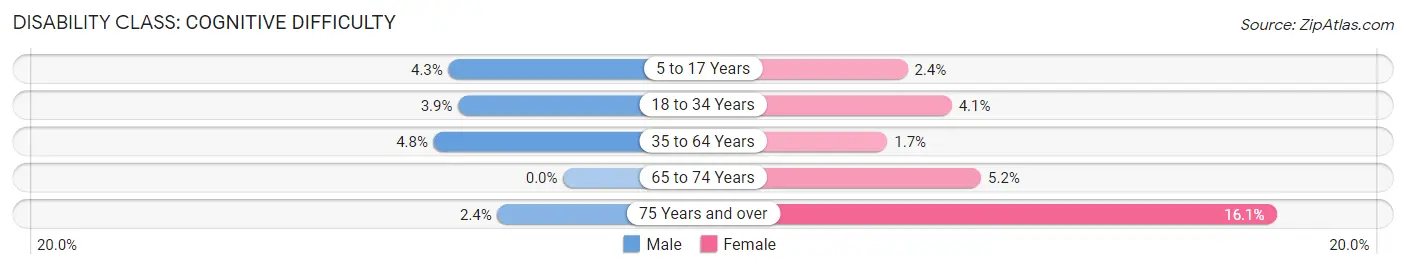
| Age Bracket | Male | Female |
| 5 to 17 Years | 6 (4.3%) | 4 (2.4%) |
| 18 to 34 Years | 6 (3.9%) | 6 (4.1%) |
| 35 to 64 Years | 13 (4.8%) | 5 (1.7%) |
| 65 to 74 Years | 0 (0.0%) | 3 (5.2%) |
| 75 Years and over | 1 (2.4%) | 15 (16.1%) |
Disability Class: Ambulatory Difficulty
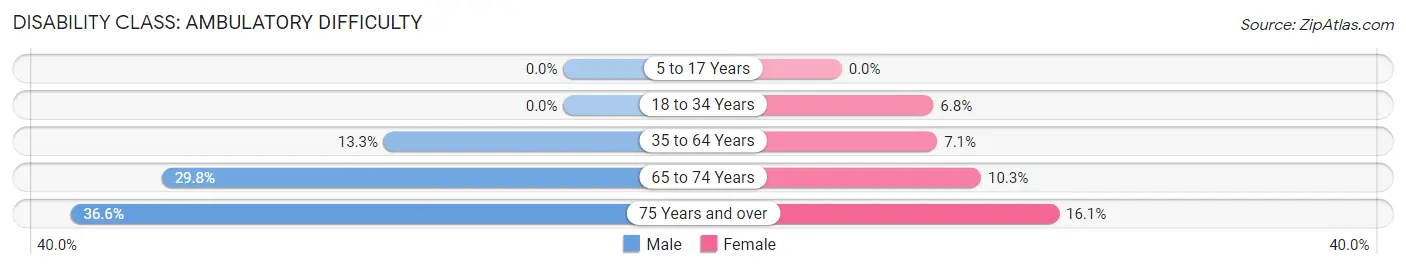
| Age Bracket | Male | Female |
| 5 to 17 Years | 0 (0.0%) | 0 (0.0%) |
| 18 to 34 Years | 0 (0.0%) | 10 (6.8%) |
| 35 to 64 Years | 36 (13.3%) | 21 (7.1%) |
| 65 to 74 Years | 17 (29.8%) | 6 (10.3%) |
| 75 Years and over | 15 (36.6%) | 15 (16.1%) |
Disability Class: Self-Care Difficulty
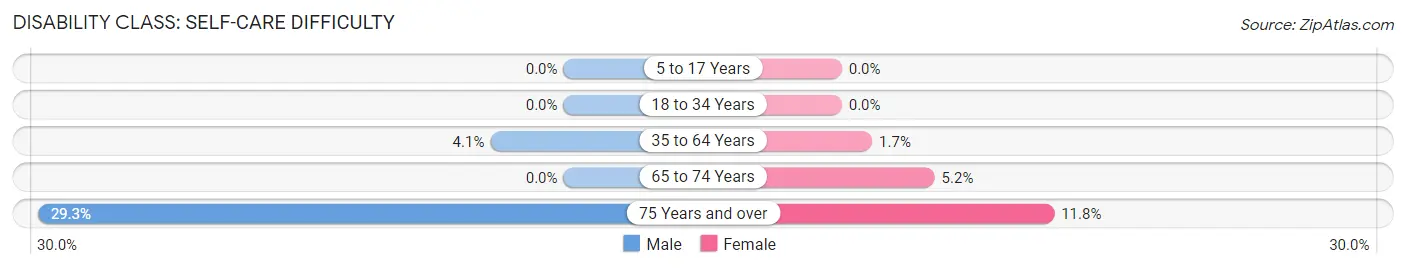
| Age Bracket | Male | Female |
| 5 to 17 Years | 0 (0.0%) | 0 (0.0%) |
| 18 to 34 Years | 0 (0.0%) | 0 (0.0%) |
| 35 to 64 Years | 11 (4.1%) | 5 (1.7%) |
| 65 to 74 Years | 0 (0.0%) | 3 (5.2%) |
| 75 Years and over | 12 (29.3%) | 11 (11.8%) |
Technology Access in Winchester
Computing Device Access in Winchester
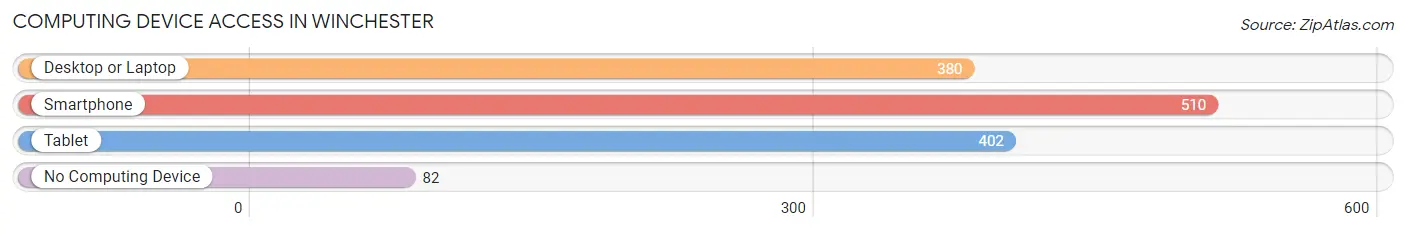
| Device Type | # Households | % Households |
| Desktop or Laptop | 380 | 59.8% |
| Smartphone | 510 | 80.2% |
| Tablet | 402 | 63.2% |
| No Computing Device | 82 | 12.9% |
| Total | 636 | 100.0% |
Internet Access in Winchester
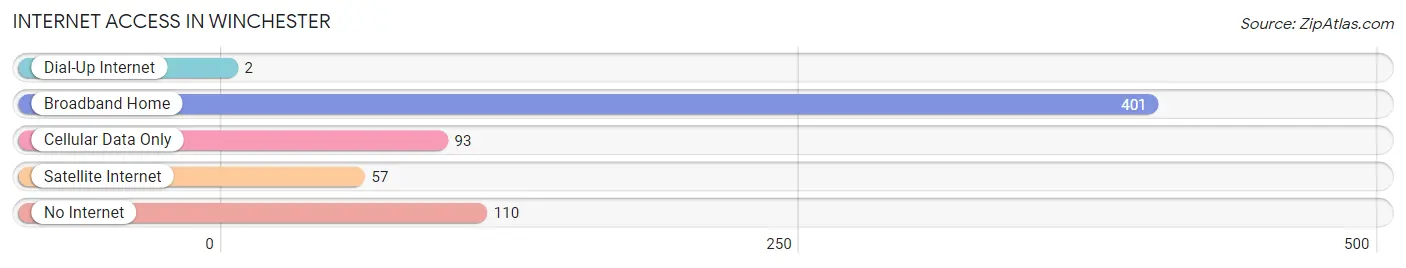
| Internet Type | # Households | % Households |
| Dial-Up Internet | 2 | 0.3% |
| Broadband Home | 401 | 63.0% |
| Cellular Data Only | 93 | 14.6% |
| Satellite Internet | 57 | 9.0% |
| No Internet | 110 | 17.3% |
| Total | 636 | 100.0% |
Winchester Summary
Winchester, Illinois is a small city located in Scott County, Illinois. It is situated on the banks of the Mississippi River, approximately 30 miles south of St. Louis, Missouri. The city has a population of approximately 1,500 people and covers an area of 1.2 square miles.
History
Winchester was founded in 1836 by a group of settlers from Kentucky. The city was named after Winchester, Kentucky, the hometown of the settlers. The city was incorporated in 1837 and was the first city in Scott County.
In the early years, Winchester was a small farming community. The city was home to a number of small businesses, including a sawmill, a gristmill, and a blacksmith shop. The city also had a number of churches, including the First Baptist Church, which was founded in 1837.
In the late 19th century, Winchester began to grow and develop. The city was home to a number of factories, including a brickyard, a furniture factory, and a canning factory. The city also had a number of stores, including a general store, a drug store, and a hardware store.
Geography
Winchester is located in the central part of Scott County, Illinois. The city is situated on the banks of the Mississippi River, approximately 30 miles south of St. Louis, Missouri. The city has a total area of 1.2 square miles, all of which is land.
The city is located in a hilly region of the state. The terrain is mostly flat, with some rolling hills. The city is located in a humid continental climate zone, with hot summers and cold winters.
Economy
Winchester has a small, but diverse economy. The city is home to a number of small businesses, including a grocery store, a hardware store, and a number of restaurants. The city also has a number of manufacturing companies, including a furniture factory and a canning factory.
The city is also home to a number of agricultural businesses, including a dairy farm and a number of grain farms. The city is also home to a number of service businesses, including a number of auto repair shops and a number of medical offices.
Demographics
As of the 2010 census, Winchester had a population of 1,500 people. The racial makeup of the city was 97.3% White, 0.7% African American, 0.3% Native American, 0.3% Asian, and 1.3% from other races. The median household income was $37,500, and the median family income was $45,000.
The city is home to a number of churches, including the First Baptist Church, which was founded in 1837. The city also has a number of schools, including a public elementary school and a private high school. The city is also home to a number of parks, including a city park and a number of smaller parks.
Common Questions
What is Per Capita Income in Winchester?
Per Capita income in Winchester is $25,999.
What is the Median Family Income in Winchester?
Median Family Income in Winchester is $57,125.
What is the Median Household income in Winchester?
Median Household Income in Winchester is $51,667.
What is Income or Wage Gap in Winchester?
Income or Wage Gap in Winchester is 6.1%.
Women in Winchester earn 93.9 cents for every dollar earned by a man.
What is Inequality or Gini Index in Winchester?
Inequality or Gini Index in Winchester is 0.43.
What is the Total Population of Winchester?
Total Population of Winchester is 1,541.
What is the Total Male Population of Winchester?
Total Male Population of Winchester is 703.
What is the Total Female Population of Winchester?
Total Female Population of Winchester is 838.
What is the Ratio of Males per 100 Females in Winchester?
There are 83.89 Males per 100 Females in Winchester.
What is the Ratio of Females per 100 Males in Winchester?
There are 119.20 Females per 100 Males in Winchester.
What is the Median Population Age in Winchester?
Median Population Age in Winchester is 39.7 Years.
What is the Average Family Size in Winchester
Average Family Size in Winchester is 3.1 People.
What is the Average Household Size in Winchester
Average Household Size in Winchester is 2.4 People.
How Large is the Labor Force in Winchester?
There are 741 People in the Labor Forcein in Winchester.
What is the Percentage of People in the Labor Force in Winchester?
63.8% of People are in the Labor Force in Winchester.
What is the Unemployment Rate in Winchester?
Unemployment Rate in Winchester is 4.6%.