Zip Codes with the Highest Percentage of Self-Employed / Not Incorporated in Vancouver, WA

RELATED REPORTS & OPTIONS

Self-Employed / Not Incorporated
Population
Families and Households
Female Fertility
Female Fertility (Unmarried)
Race (Community Size)
Race (Percentage)
Ancestry (Community Size)
AfghanAfricanAlaska NativeAlaskan AthabascanAlbanianAleutAlsatianAmericanApacheArabArgentineanArmenianAustralianAustrianBangladeshiBasqueBelgianBhutaneseBlackfeetBritishBurmeseCajunCanadianCelticCentral AmericanCentral American IndianCherokeeCheyenneChickasawChileanChippewaChoctawColombianColvilleCosta RicanCreeCreekCroatianCubanCzechCzechoslovakianDanishDominicanDutchEastern EuropeanEcuadorianEgyptianEnglishEstonianEthiopianEuropeanFilipinoFinnishFrenchFrench CanadianGermanGreekGuamanian / ChamorroGuatemalanHaitianHonduranHungarianIcelanderIndian (Asian)IndonesianInupiatIranianIraqiIrishIroquoisIsraeliItalianJamaicanJapaneseKoreanLaotianLatvianLebaneseLiberianLithuanianMacedonianMalaysianMalteseMarshalleseMexicanMexican American IndianNative HawaiianNavajoNepaleseNew ZealanderNicaraguanNigerianNorthern EuropeanNorwegianOsagePaiutePakistaniPalestinianPanamanianPennsylvania GermanPeruvianPolishPortuguesePotawatomiPuebloPuerto RicanPuget Sound SalishRomanianRussianSalvadoranSamoanScandinavianScotch-IrishScottishSeminoleSenegaleseSerbianSiouxSlavicSlovakSloveneSomaliSouth AfricanSouth AmericanSouth American IndianSpaniardSpanishSri LankanSubsaharan AfricanSwedishSwissSyrianThaiTlingit-HaidaTonganTurkishUkrainianVenezuelanWelshYakamaYaquiYugoslavianYup'ik
Ancestry (Percentage)
AfghanAfricanAlaska NativeAlaskan AthabascanAlbanianAleutAlsatianAmericanApacheArabArgentineanArmenianAustralianAustrianBangladeshiBasqueBelgianBhutaneseBlackfeetBritishBurmeseCajunCanadianCelticCentral AmericanCentral American IndianCherokeeCheyenneChickasawChileanChippewaChoctawColombianColvilleCosta RicanCreeCreekCroatianCubanCzechCzechoslovakianDanishDominicanDutchEastern EuropeanEcuadorianEgyptianEnglishEstonianEthiopianEuropeanFilipinoFinnishFrenchFrench CanadianGermanGreekGuamanian / ChamorroGuatemalanHaitianHonduranHungarianIcelanderIndian (Asian)IndonesianInupiatIranianIraqiIrishIroquoisIsraeliItalianJamaicanJapaneseKoreanLaotianLatvianLebaneseLiberianLithuanianMacedonianMalaysianMalteseMarshalleseMexicanMexican American IndianNative HawaiianNavajoNepaleseNew ZealanderNicaraguanNigerianNorthern EuropeanNorwegianOsagePaiutePakistaniPalestinianPanamanianPennsylvania GermanPeruvianPolishPortuguesePotawatomiPuebloPuerto RicanPuget Sound SalishRomanianRussianSalvadoranSamoanScandinavianScotch-IrishScottishSeminoleSenegaleseSerbianSiouxSlavicSlovakSloveneSomaliSouth AfricanSouth AmericanSouth American IndianSpaniardSpanishSri LankanSubsaharan AfricanSwedishSwissSyrianThaiTlingit-HaidaTonganTurkishUkrainianVenezuelanWelshYakamaYaquiYugoslavianYup'ik
Immigrant Origin (Total)
AfghanistanAfricaArgentinaArmeniaAsiaAustraliaAustriaAzoresBangladeshBelarusBoliviaBosnia and HerzegovinaBrazilBulgariaBurma / MyanmarCambodiaCanadaCaribbeanCentral AmericaChileChinaColombiaCosta RicaCubaCzechoslovakiaDenmarkDominican RepublicEastern AfricaEastern AsiaEastern EuropeEcuadorEgyptEl SalvadorEnglandEritreaEthiopiaEuropeFijiFranceGermanyGreeceGuatemalaHaitiHondurasHong KongIndiaIndonesiaIranIraqIrelandItalyJamaicaJapanKazakhstanKenyaKoreaLaosLatin AmericaLiberiaMalaysiaMexicoMicronesiaMoldovaNetherlandsNicaraguaNigeriaNorthern AfricaNorthern EuropeNorwayOceaniaPanamaPeruPhilippinesPolandPortugalRomaniaRussiaScotlandSerbiaSingaporeSouth AfricaSouth AmericaSouth Central AsiaSouth Eastern AsiaSouthern EuropeSpainSri LankaSwedenSyriaTaiwanThailandTrinidad and TobagoTurkeyUgandaUkraineUzbekistanVietnamWestern AfricaWestern AsiaWestern Europe
Immigrant Origin (Percentage)
AfghanistanAfricaArgentinaArmeniaAsiaAustraliaAustriaAzoresBangladeshBelarusBoliviaBosnia and HerzegovinaBrazilBulgariaBurma / MyanmarCambodiaCanadaCaribbeanCentral AmericaChileChinaColombiaCosta RicaCubaCzechoslovakiaDenmarkDominican RepublicEastern AfricaEastern AsiaEastern EuropeEcuadorEgyptEl SalvadorEnglandEritreaEthiopiaEuropeFijiFranceGermanyGreeceGuatemalaHaitiHondurasHong KongIndiaIndonesiaIranIraqIrelandItalyJamaicaJapanKazakhstanKenyaKoreaLaosLatin AmericaLiberiaMalaysiaMexicoMicronesiaMoldovaNetherlandsNicaraguaNigeriaNorthern AfricaNorthern EuropeNorwayOceaniaPanamaPeruPhilippinesPolandPortugalRomaniaRussiaScotlandSerbiaSingaporeSouth AfricaSouth AmericaSouth Central AsiaSouth Eastern AsiaSouthern EuropeSpainSri LankaSwedenSyriaTaiwanThailandTrinidad and TobagoTurkeyUgandaUkraineUzbekistanVietnamWestern AfricaWestern AsiaWestern Europe
Income
Income (Families)
Income (Households)
Poverty
Poverty (Families)
Unemployment
Employment Occupations
Employment Industries
Employer Class
Commute Time
Commute Means
School Enrollment
Education by Degree Field
Occupancy
Finances
Physical Characteristics
Vancouver
Compare Zip Codes
Comparison Subject

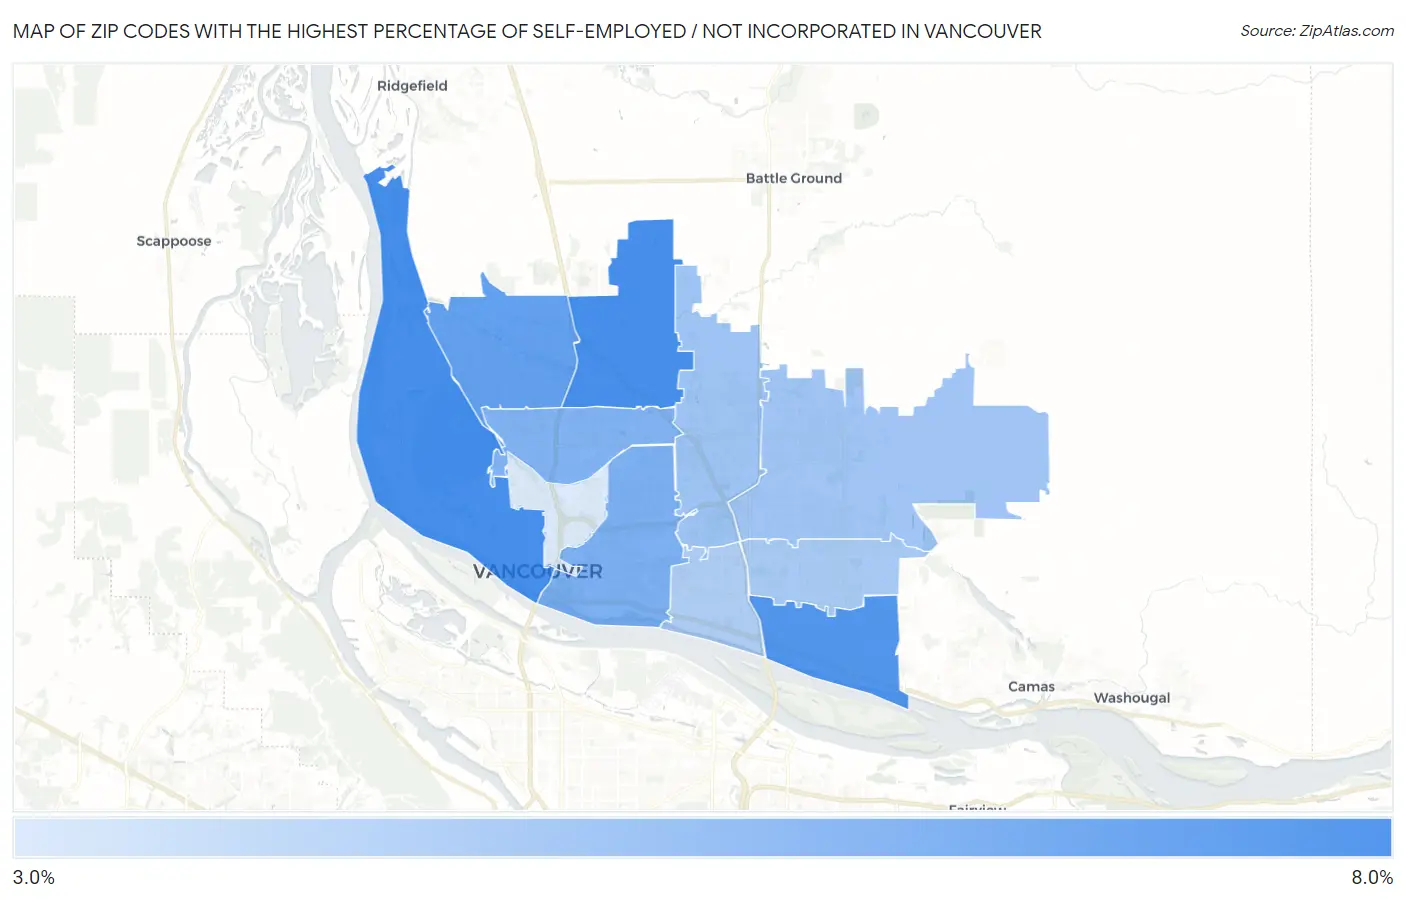
Map of Zip Codes with the Highest Percentage of Self-Employed / Not Incorporated in Vancouver

0.0%
8.0%
Zip Codes with the Highest Percentage of Self-Employed / Not Incorporated in Vancouver Map

Zip Codes with the Highest Percentage of Self-Employed / Not Incorporated in Vancouver, WA

Zip Code % Self-Employed / Not Incorporated vs State vs National
1.986867.2%5.4%(+1.80)#1715.8%(+1.42)#12,427
2.986607.2%5.4%(+1.79)#1725.8%(+1.41)#12,452
3.986836.9%5.4%(+1.49)#1885.8%(+1.11)#13,256
4.986856.5%5.4%(+1.07)#2115.8%(+0.689)#14,458
5.986615.9%5.4%(+0.419)#2645.8%(+0.042)#16,520
6.986655.7%5.4%(+0.300)#2735.8%(-0.077)#16,899
7.986625.0%5.4%(-0.451)#3305.8%(-0.829)#19,723
8.986824.9%5.4%(-0.501)#3395.8%(-0.879)#19,907
9.986844.7%5.4%(-0.706)#3655.8%(-1.08)#20,677
10.986644.6%5.4%(-0.873)#3775.8%(-1.25)#21,300
11.986633.4%5.4%(-2.03)#4535.8%(-2.40)#25,279

Common Questions

What are the Top 10 Zip Codes with the Highest Percentage of Self-Employed / Not Incorporated in Vancouver, WA?
Top 10 Zip Codes with the Highest Percentage of Self-Employed / Not Incorporated in Vancouver, WA are:
#1
7.2%
#2
7.2%
#3
6.9%
#4
6.5%
#5
5.9%
#6
5.7%
#7
5.0%
#8
4.9%
#9
4.7%
#10
4.6%
What zip code has the Highest Percentage of Self-Employed / Not Incorporated in Vancouver, WA?
98686 has the Highest Percentage of Self-Employed / Not Incorporated in Vancouver, WA with 7.2%.
What is the Percentage of Self-Employed / Not Incorporated in Vancouver, WA?
Percentage of Self-Employed / Not Incorporated in Vancouver is 5.5%.
What is the Percentage of Self-Employed / Not Incorporated in Washington?
Percentage of Self-Employed / Not Incorporated in Washington is 5.4%.
What is the Percentage of Self-Employed / Not Incorporated in the United States?
Percentage of Self-Employed / Not Incorporated in the United States is 5.8%.