Turkish vs Immigrants from Caribbean 1 or more Vehicles in Household
COMPARE
Turkish
Immigrants from Caribbean
1 or more Vehicles in Household
1 or more Vehicles in Household Comparison
Turks
Immigrants from Caribbean
88.4%
1 OR MORE VEHICLES IN HOUSEHOLD
2.5/ 100
METRIC RATING
242nd/ 347
METRIC RANK
80.4%
1 OR MORE VEHICLES IN HOUSEHOLD
0.0/ 100
METRIC RATING
324th/ 347
METRIC RANK
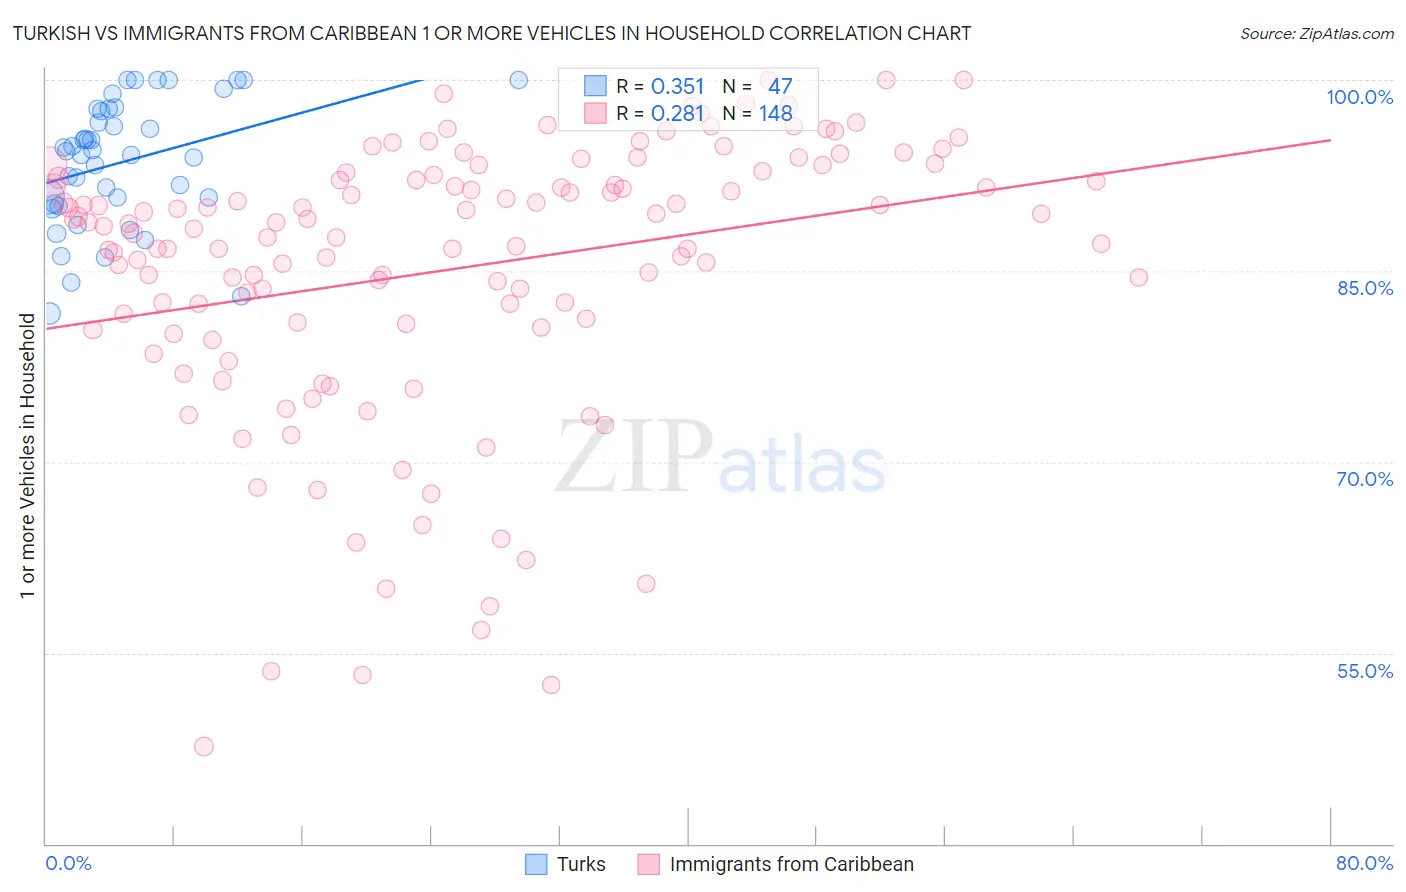
Turkish vs Immigrants from Caribbean 1 or more Vehicles in Household Correlation Chart
The statistical analysis conducted on geographies consisting of 271,719,396 people shows a mild positive correlation between the proportion of Turks and percentage of households with 1 or more vehicles available in the United States with a correlation coefficient (R) of 0.351 and weighted average of 88.4%. Similarly, the statistical analysis conducted on geographies consisting of 449,656,070 people shows a weak positive correlation between the proportion of Immigrants from Caribbean and percentage of households with 1 or more vehicles available in the United States with a correlation coefficient (R) of 0.281 and weighted average of 80.4%, a difference of 9.9%.
1 or more Vehicles in Household Correlation Summary
| Measurement | Turkish | Immigrants from Caribbean |
| Minimum | 81.7% | 47.7% |
| Maximum | 100.0% | 100.0% |
| Range | 18.3% | 52.3% |
| Mean | 93.6% | 85.1% |
| Median | 94.4% | 88.4% |
| Interquartile 25% (IQ1) | 90.3% | 80.9% |
| Interquartile 75% (IQ3) | 97.7% | 92.2% |
| Interquartile Range (IQR) | 7.4% | 11.3% |
| Standard Deviation (Sample) | 4.9% | 10.9% |
| Standard Deviation (Population) | 4.9% | 10.9% |
Similar Demographics by 1 or more Vehicles in Household
Demographics Similar to Turks by 1 or more Vehicles in Household
In terms of 1 or more vehicles in household, the demographic groups most similar to Turks are Taiwanese (88.4%, a difference of 0.020%), Immigrants from Belgium (88.4%, a difference of 0.060%), Eastern European (88.5%, a difference of 0.070%), Immigrants from Portugal (88.3%, a difference of 0.080%), and Immigrants from Czechoslovakia (88.3%, a difference of 0.10%).
| Demographics | Rating | Rank | 1 or more Vehicles in Household |
| Paiute | 4.6 /100 | #235 | Tragic 88.6% |
| Immigrants | Pakistan | 4.5 /100 | #236 | Tragic 88.6% |
| Immigrants | Turkey | 4.4 /100 | #237 | Tragic 88.6% |
| Immigrants | Somalia | 4.2 /100 | #238 | Tragic 88.6% |
| Kiowa | 3.8 /100 | #239 | Tragic 88.6% |
| Eastern Europeans | 3.0 /100 | #240 | Tragic 88.5% |
| Taiwanese | 2.6 /100 | #241 | Tragic 88.4% |
| Turks | 2.5 /100 | #242 | Tragic 88.4% |
| Immigrants | Belgium | 2.1 /100 | #243 | Tragic 88.4% |
| Immigrants | Portugal | 2.0 /100 | #244 | Tragic 88.3% |
| Immigrants | Czechoslovakia | 1.9 /100 | #245 | Tragic 88.3% |
| Menominee | 1.9 /100 | #246 | Tragic 88.3% |
| Immigrants | Honduras | 1.7 /100 | #247 | Tragic 88.3% |
| Immigrants | Nigeria | 1.5 /100 | #248 | Tragic 88.2% |
| Blacks/African Americans | 1.4 /100 | #249 | Tragic 88.2% |
Demographics Similar to Immigrants from Caribbean by 1 or more Vehicles in Household
In terms of 1 or more vehicles in household, the demographic groups most similar to Immigrants from Caribbean are Senegalese (80.4%, a difference of 0.10%), Immigrants from Yemen (80.5%, a difference of 0.11%), Immigrants from West Indies (79.5%, a difference of 1.2%), Immigrants from Cabo Verde (81.6%, a difference of 1.4%), and Immigrants from Senegal (79.0%, a difference of 1.8%).
| Demographics | Rating | Rank | 1 or more Vehicles in Household |
| Ghanaians | 0.0 /100 | #317 | Tragic 83.6% |
| Immigrants | Ghana | 0.0 /100 | #318 | Tragic 83.4% |
| Immigrants | Belarus | 0.0 /100 | #319 | Tragic 83.3% |
| Soviet Union | 0.0 /100 | #320 | Tragic 82.7% |
| Jamaicans | 0.0 /100 | #321 | Tragic 82.1% |
| Immigrants | Cabo Verde | 0.0 /100 | #322 | Tragic 81.6% |
| Immigrants | Yemen | 0.0 /100 | #323 | Tragic 80.5% |
| Immigrants | Caribbean | 0.0 /100 | #324 | Tragic 80.4% |
| Senegalese | 0.0 /100 | #325 | Tragic 80.4% |
| Immigrants | West Indies | 0.0 /100 | #326 | Tragic 79.5% |
| Immigrants | Senegal | 0.0 /100 | #327 | Tragic 79.0% |
| Ecuadorians | 0.0 /100 | #328 | Tragic 77.9% |
| Immigrants | Dominica | 0.0 /100 | #329 | Tragic 77.8% |
| Immigrants | Trinidad and Tobago | 0.0 /100 | #330 | Tragic 76.8% |
| West Indians | 0.0 /100 | #331 | Tragic 76.4% |