Tongan 1 or more Vehicles in Household
COMPARE
Tongan
Select to Compare
1 or more Vehicles in Household
Tongan 1 or more Vehicles in Household
92.9%
1+ VEHICLES AVAILABLE
100.0/ 100
METRIC RATING
19th/ 347
METRIC RANK
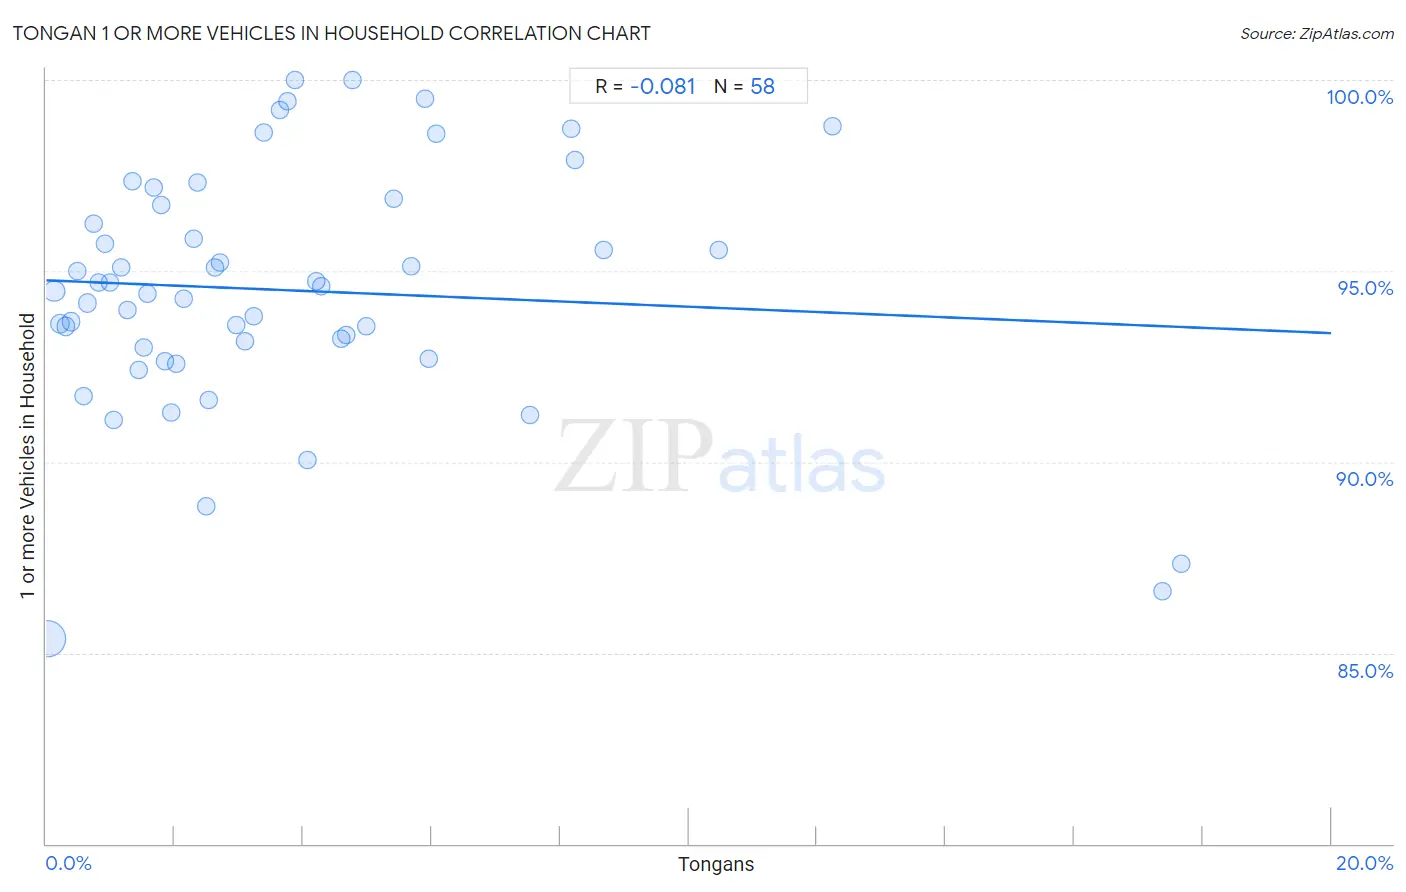
Tongan 1 or more Vehicles in Household Correlation Chart
The statistical analysis conducted on geographies consisting of 102,873,244 people shows a slight negative correlation between the proportion of Tongans and percentage of households with 1 or more vehicles available in the United States with a correlation coefficient (R) of -0.081 and weighted average of 92.9%. On average, for every 1% (one percent) increase in Tongans within a typical geography, there is a decrease of 0.069% in percentage of households with 1 or more vehicles available.
It is essential to understand that the correlation between the percentage of Tongans and percentage of households with 1 or more vehicles available does not imply a direct cause-and-effect relationship. It remains uncertain whether the presence of Tongans influences an upward or downward trend in the level of percentage of households with 1 or more vehicles available within an area, or if Tongans simply ended up residing in those areas with higher or lower levels of percentage of households with 1 or more vehicles available due to other factors.
Demographics Similar to Tongans by 1 or more Vehicles in Household
In terms of 1 or more vehicles in household, the demographic groups most similar to Tongans are Welsh (93.0%, a difference of 0.12%), European (93.0%, a difference of 0.15%), Arapaho (92.7%, a difference of 0.17%), Mexican (93.0%, a difference of 0.18%), and Assyrian/Chaldean/Syriac (93.0%, a difference of 0.18%).
| Demographics | Rating | Rank | 1 or more Vehicles in Household |
| Scandinavians | 100.0 /100 | #12 | Exceptional 93.1% |
| Whites/Caucasians | 100.0 /100 | #13 | Exceptional 93.1% |
| Irish | 100.0 /100 | #14 | Exceptional 93.1% |
| Mexicans | 100.0 /100 | #15 | Exceptional 93.0% |
| Assyrians/Chaldeans/Syriacs | 100.0 /100 | #16 | Exceptional 93.0% |
| Europeans | 100.0 /100 | #17 | Exceptional 93.0% |
| Welsh | 100.0 /100 | #18 | Exceptional 93.0% |
| Tongans | 100.0 /100 | #19 | Exceptional 92.9% |
| Arapaho | 100.0 /100 | #20 | Exceptional 92.7% |
| Ottawa | 100.0 /100 | #21 | Exceptional 92.7% |
| French | 100.0 /100 | #22 | Exceptional 92.7% |
| Nepalese | 100.0 /100 | #23 | Exceptional 92.6% |
| Yaqui | 100.0 /100 | #24 | Exceptional 92.6% |
| Immigrants from Iraq | 100.0 /100 | #25 | Exceptional 92.5% |
| British | 100.0 /100 | #26 | Exceptional 92.5% |
Tongan 1 or more Vehicles in Household Correlation Summary
| Measurement | Tongan Data | 1 or more Vehicles in Household Data |
| Minimum | 0.023% | 85.4% |
| Maximum | 17.7% | 100.0% |
| Range | 17.6% | 14.6% |
| Mean | 3.7% | 94.5% |
| Median | 2.6% | 94.5% |
| Interquartile 25% (IQ1) | 1.3% | 93.0% |
| Interquartile 75% (IQ3) | 4.8% | 96.7% |
| Interquartile Range (IQR) | 3.5% | 3.7% |
| Standard Deviation (Sample) | 3.7% | 3.2% |
| Standard Deviation (Population) | 3.7% | 3.2% |
Correlation Details
| Tongan Percentile | Sample Size | 1 or more Vehicles in Household |
[ 0.0% - 0.5% ] 0.023% | 74,456,234 | 85.4% |
[ 0.0% - 0.5% ] 0.13% | 10,599,855 | 94.5% |
[ 0.0% - 0.5% ] 0.22% | 5,188,319 | 93.6% |
[ 0.0% - 0.5% ] 0.31% | 3,571,828 | 93.5% |
[ 0.0% - 0.5% ] 0.39% | 1,855,234 | 93.7% |
[ 0.0% - 0.5% ] 0.48% | 1,298,773 | 95.0% |
[ 0.5% - 1.0% ] 0.58% | 1,279,278 | 91.7% |
[ 0.5% - 1.0% ] 0.64% | 669,687 | 94.2% |
[ 0.5% - 1.0% ] 0.74% | 615,604 | 96.2% |
[ 0.5% - 1.0% ] 0.82% | 305,901 | 94.7% |
[ 0.5% - 1.0% ] 0.91% | 241,281 | 95.7% |
[ 1.0% - 1.5% ] 1.00% | 230,154 | 94.7% |
[ 1.0% - 1.5% ] 1.05% | 430,156 | 91.1% |
[ 1.0% - 1.5% ] 1.16% | 586,537 | 95.1% |
[ 1.0% - 1.5% ] 1.27% | 88,805 | 94.0% |
[ 1.0% - 1.5% ] 1.34% | 76,408 | 97.4% |
[ 1.0% - 1.5% ] 1.43% | 235,690 | 92.4% |
[ 1.5% - 2.0% ] 1.53% | 70,749 | 93.0% |
[ 1.5% - 2.0% ] 1.58% | 99,729 | 94.4% |
[ 1.5% - 2.0% ] 1.68% | 62,019 | 97.2% |
[ 1.5% - 2.0% ] 1.79% | 100,730 | 96.7% |
[ 1.5% - 2.0% ] 1.84% | 11,943 | 92.6% |
[ 1.5% - 2.0% ] 1.94% | 18,789 | 91.3% |
[ 2.0% - 2.5% ] 2.02% | 74,250 | 92.6% |
[ 2.0% - 2.5% ] 2.13% | 100,992 | 94.3% |
[ 2.0% - 2.5% ] 2.29% | 179,962 | 95.8% |
[ 2.0% - 2.5% ] 2.36% | 48,692 | 97.3% |
[ 2.0% - 2.5% ] 2.49% | 23,708 | 88.9% |
[ 2.5% - 3.0% ] 2.52% | 35,392 | 91.6% |
[ 2.5% - 3.0% ] 2.62% | 3,397 | 95.1% |
[ 2.5% - 3.0% ] 2.70% | 56,709 | 95.2% |
[ 2.5% - 3.0% ] 2.97% | 13,281 | 93.6% |
[ 3.0% - 3.5% ] 3.09% | 26,954 | 93.2% |
[ 3.0% - 3.5% ] 3.24% | 92,160 | 93.8% |
[ 3.0% - 3.5% ] 3.39% | 295 | 98.6% |
[ 3.5% - 4.0% ] 3.63% | 3,746 | 99.2% |
[ 3.5% - 4.0% ] 3.75% | 853 | 99.5% |
[ 3.5% - 4.0% ] 3.86% | 1,527 | 100.0% |
[ 4.0% - 4.5% ] 4.08% | 6,257 | 90.1% |
[ 4.0% - 4.5% ] 4.21% | 4,708 | 94.7% |
[ 4.0% - 4.5% ] 4.29% | 30,983 | 94.6% |
[ 4.5% - 5.0% ] 4.59% | 12,906 | 93.2% |
[ 4.5% - 5.0% ] 4.68% | 4,555 | 93.3% |
[ 4.5% - 5.0% ] 4.76% | 84 | 100.0% |
[ 4.5% - 5.0% ] 4.97% | 23,214 | 93.6% |
[ 5.0% - 5.5% ] 5.40% | 722 | 96.9% |
[ 5.5% - 6.0% ] 5.68% | 3,593 | 95.1% |
[ 5.5% - 6.0% ] 5.89% | 1,648 | 99.5% |
[ 5.5% - 6.0% ] 5.95% | 3,986 | 92.7% |
[ 6.0% - 6.5% ] 6.06% | 693 | 98.6% |
[ 7.5% - 8.0% ] 7.54% | 6,779 | 91.2% |
[ 8.0% - 8.5% ] 8.16% | 392 | 98.7% |
[ 8.0% - 8.5% ] 8.24% | 510 | 97.9% |
[ 8.5% - 9.0% ] 8.68% | 2,742 | 95.6% |
[ 10.0% - 10.5% ] 10.47% | 2,274 | 95.5% |
[ 12.0% - 12.5% ] 12.24% | 392 | 98.8% |
[ 17.0% - 17.5% ] 17.37% | 5,411 | 86.6% |
[ 17.5% - 18.0% ] 17.67% | 5,774 | 87.3% |