Turkish vs Immigrants from Colombia 1 or more Vehicles in Household
COMPARE
Turkish
Immigrants from Colombia
1 or more Vehicles in Household
1 or more Vehicles in Household Comparison
Turks
Immigrants from Colombia
88.4%
1 OR MORE VEHICLES IN HOUSEHOLD
2.5/ 100
METRIC RATING
242nd/ 347
METRIC RANK
87.6%
1 OR MORE VEHICLES IN HOUSEHOLD
0.3/ 100
METRIC RATING
267th/ 347
METRIC RANK
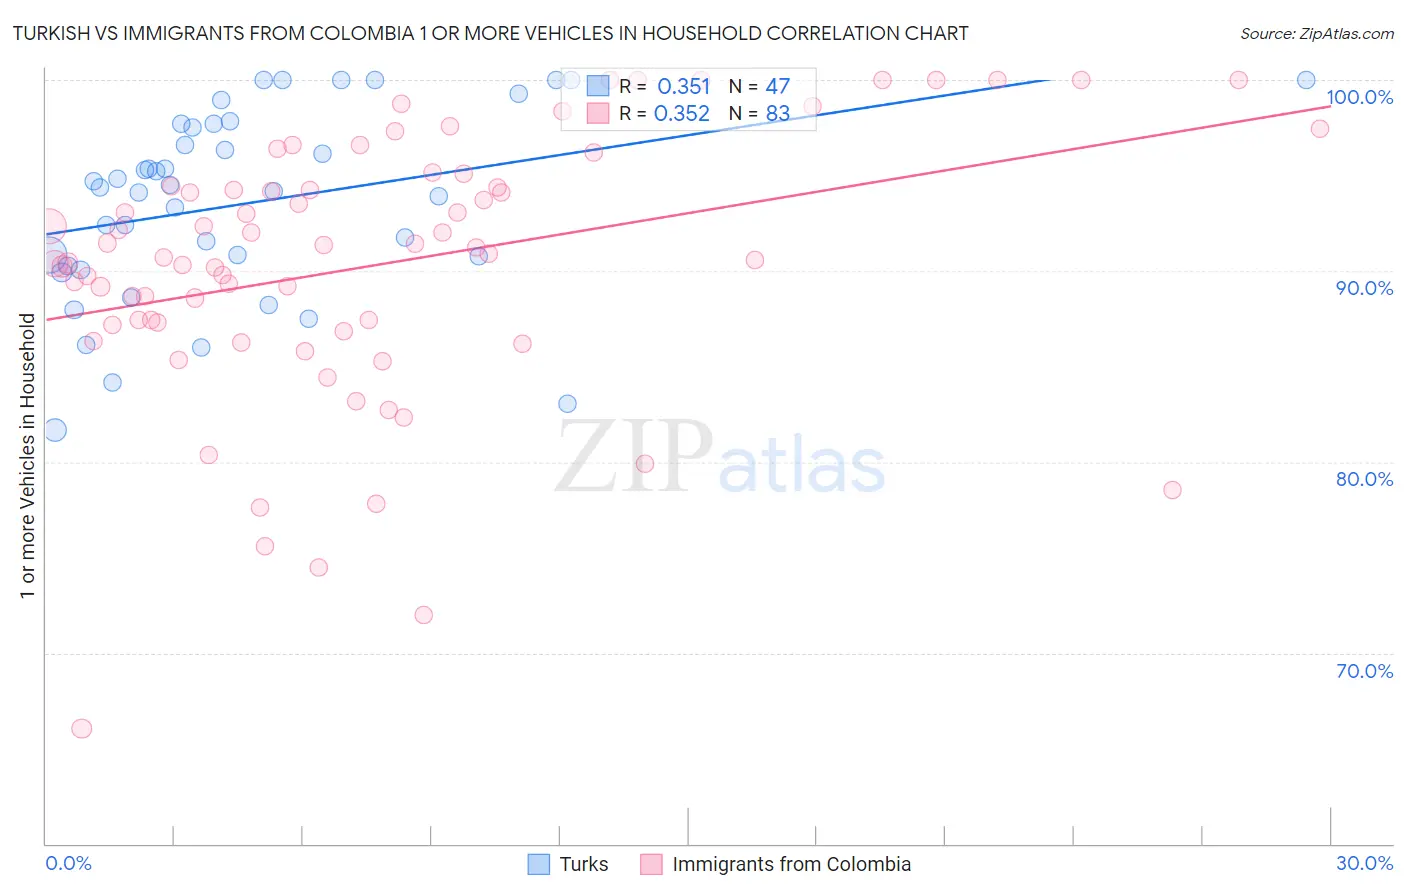
Turkish vs Immigrants from Colombia 1 or more Vehicles in Household Correlation Chart
The statistical analysis conducted on geographies consisting of 271,719,396 people shows a mild positive correlation between the proportion of Turks and percentage of households with 1 or more vehicles available in the United States with a correlation coefficient (R) of 0.351 and weighted average of 88.4%. Similarly, the statistical analysis conducted on geographies consisting of 378,512,544 people shows a mild positive correlation between the proportion of Immigrants from Colombia and percentage of households with 1 or more vehicles available in the United States with a correlation coefficient (R) of 0.352 and weighted average of 87.6%, a difference of 0.89%.
1 or more Vehicles in Household Correlation Summary
| Measurement | Turkish | Immigrants from Colombia |
| Minimum | 81.7% | 66.1% |
| Maximum | 100.0% | 100.0% |
| Range | 18.3% | 33.9% |
| Mean | 93.6% | 90.3% |
| Median | 94.4% | 90.9% |
| Interquartile 25% (IQ1) | 90.3% | 87.2% |
| Interquartile 75% (IQ3) | 97.7% | 94.4% |
| Interquartile Range (IQR) | 7.4% | 7.2% |
| Standard Deviation (Sample) | 4.9% | 6.9% |
| Standard Deviation (Population) | 4.9% | 6.9% |
Similar Demographics by 1 or more Vehicles in Household
Demographics Similar to Turks by 1 or more Vehicles in Household
In terms of 1 or more vehicles in household, the demographic groups most similar to Turks are Taiwanese (88.4%, a difference of 0.020%), Immigrants from Belgium (88.4%, a difference of 0.060%), Eastern European (88.5%, a difference of 0.070%), Immigrants from Portugal (88.3%, a difference of 0.080%), and Immigrants from Czechoslovakia (88.3%, a difference of 0.10%).
| Demographics | Rating | Rank | 1 or more Vehicles in Household |
| Paiute | 4.6 /100 | #235 | Tragic 88.6% |
| Immigrants | Pakistan | 4.5 /100 | #236 | Tragic 88.6% |
| Immigrants | Turkey | 4.4 /100 | #237 | Tragic 88.6% |
| Immigrants | Somalia | 4.2 /100 | #238 | Tragic 88.6% |
| Kiowa | 3.8 /100 | #239 | Tragic 88.6% |
| Eastern Europeans | 3.0 /100 | #240 | Tragic 88.5% |
| Taiwanese | 2.6 /100 | #241 | Tragic 88.4% |
| Turks | 2.5 /100 | #242 | Tragic 88.4% |
| Immigrants | Belgium | 2.1 /100 | #243 | Tragic 88.4% |
| Immigrants | Portugal | 2.0 /100 | #244 | Tragic 88.3% |
| Immigrants | Czechoslovakia | 1.9 /100 | #245 | Tragic 88.3% |
| Menominee | 1.9 /100 | #246 | Tragic 88.3% |
| Immigrants | Honduras | 1.7 /100 | #247 | Tragic 88.3% |
| Immigrants | Nigeria | 1.5 /100 | #248 | Tragic 88.2% |
| Blacks/African Americans | 1.4 /100 | #249 | Tragic 88.2% |
Demographics Similar to Immigrants from Colombia by 1 or more Vehicles in Household
In terms of 1 or more vehicles in household, the demographic groups most similar to Immigrants from Colombia are Israeli (87.7%, a difference of 0.030%), Immigrants from Europe (87.6%, a difference of 0.030%), Immigrants from Africa (87.6%, a difference of 0.080%), Panamanian (87.5%, a difference of 0.10%), and Bermudan (87.5%, a difference of 0.10%).
| Demographics | Rating | Rank | 1 or more Vehicles in Household |
| Macedonians | 0.6 /100 | #260 | Tragic 87.9% |
| Immigrants | Switzerland | 0.6 /100 | #261 | Tragic 87.9% |
| Sub-Saharan Africans | 0.5 /100 | #262 | Tragic 87.9% |
| Immigrants | Egypt | 0.5 /100 | #263 | Tragic 87.8% |
| Immigrants | Liberia | 0.4 /100 | #264 | Tragic 87.8% |
| Africans | 0.4 /100 | #265 | Tragic 87.8% |
| Israelis | 0.3 /100 | #266 | Tragic 87.7% |
| Immigrants | Colombia | 0.3 /100 | #267 | Tragic 87.6% |
| Immigrants | Europe | 0.2 /100 | #268 | Tragic 87.6% |
| Immigrants | Africa | 0.2 /100 | #269 | Tragic 87.6% |
| Panamanians | 0.2 /100 | #270 | Tragic 87.5% |
| Bermudans | 0.2 /100 | #271 | Tragic 87.5% |
| Aleuts | 0.2 /100 | #272 | Tragic 87.5% |
| Immigrants | Northern Africa | 0.2 /100 | #273 | Tragic 87.4% |
| Immigrants | Morocco | 0.1 /100 | #274 | Tragic 87.4% |