Apache 1 or more Vehicles in Household
COMPARE
Apache
Select to Compare
1 or more Vehicles in Household
Apache 1 or more Vehicles in Household
89.1%
1+ VEHICLES AVAILABLE
16.2/ 100
METRIC RATING
206th/ 347
METRIC RANK
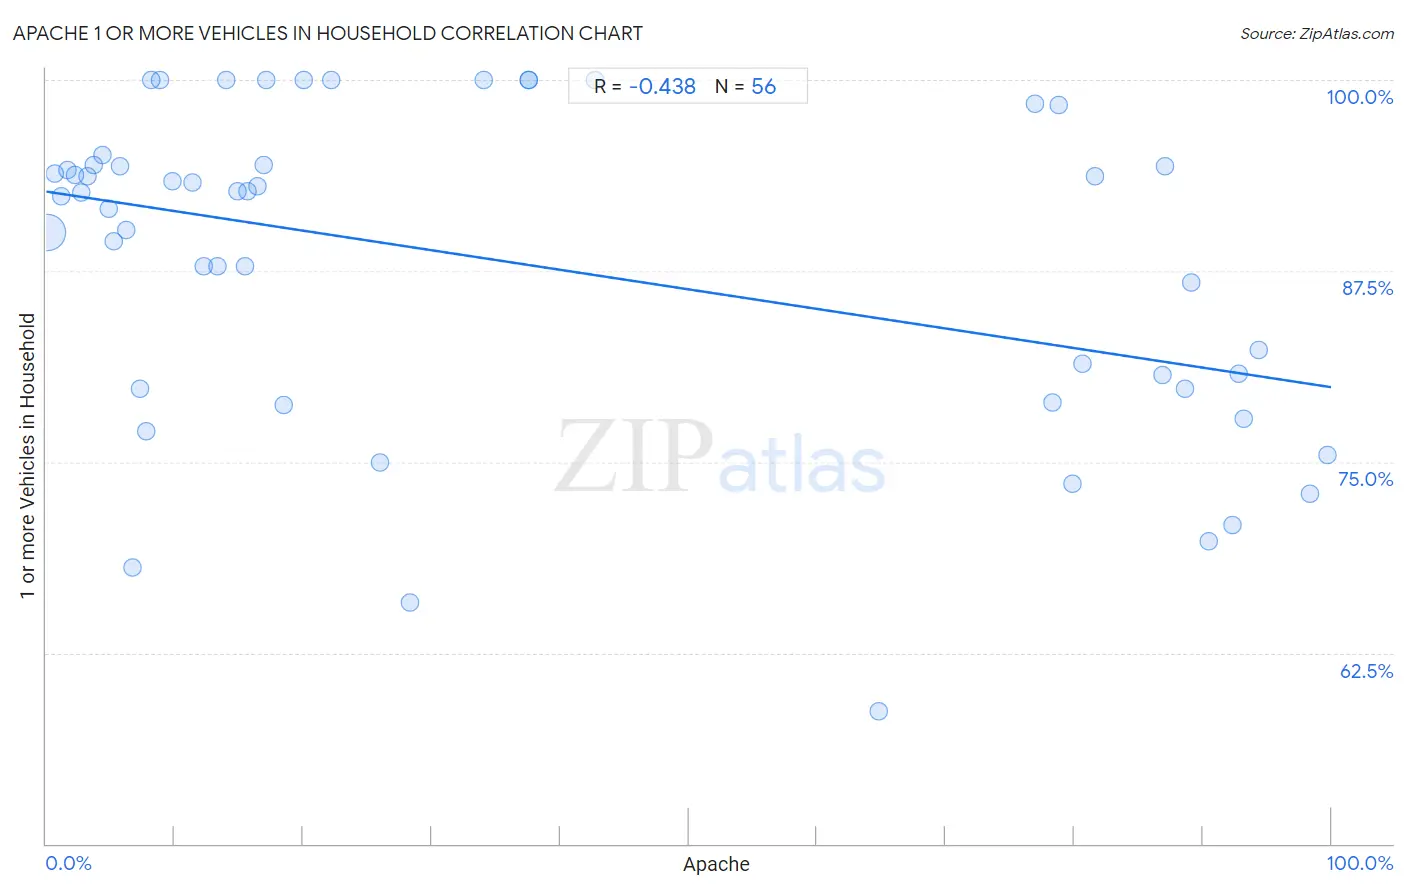
Apache 1 or more Vehicles in Household Correlation Chart
The statistical analysis conducted on geographies consisting of 231,048,129 people shows a moderate negative correlation between the proportion of Apache and percentage of households with 1 or more vehicles available in the United States with a correlation coefficient (R) of -0.438 and weighted average of 89.1%. On average, for every 1% (one percent) increase in Apache within a typical geography, there is a decrease of 0.13% in percentage of households with 1 or more vehicles available.
It is essential to understand that the correlation between the percentage of Apache and percentage of households with 1 or more vehicles available does not imply a direct cause-and-effect relationship. It remains uncertain whether the presence of Apache influences an upward or downward trend in the level of percentage of households with 1 or more vehicles available within an area, or if Apache simply ended up residing in those areas with higher or lower levels of percentage of households with 1 or more vehicles available due to other factors.
Demographics Similar to Apache by 1 or more Vehicles in Household
In terms of 1 or more vehicles in household, the demographic groups most similar to Apache are Immigrants from Denmark (89.1%, a difference of 0.040%), Guatemalan (89.2%, a difference of 0.050%), Immigrants from Chile (89.1%, a difference of 0.050%), Romanian (89.2%, a difference of 0.060%), and Immigrants from Italy (89.1%, a difference of 0.070%).
| Demographics | Rating | Rank | 1 or more Vehicles in Household |
| Immigrants from Asia | 22.8 /100 | #199 | Fair 89.3% |
| Central Americans | 21.4 /100 | #200 | Fair 89.2% |
| Immigrants from Western Europe | 20.5 /100 | #201 | Fair 89.2% |
| Iroquois | 19.8 /100 | #202 | Poor 89.2% |
| Cambodians | 18.9 /100 | #203 | Poor 89.2% |
| Romanians | 18.2 /100 | #204 | Poor 89.2% |
| Guatemalans | 17.8 /100 | #205 | Poor 89.2% |
| Apache | 16.2 /100 | #206 | Poor 89.1% |
| Immigrants from Denmark | 14.8 /100 | #207 | Poor 89.1% |
| Immigrants from Chile | 14.4 /100 | #208 | Poor 89.1% |
| Immigrants from Italy | 14.0 /100 | #209 | Poor 89.1% |
| Dutch West Indians | 13.5 /100 | #210 | Poor 89.0% |
| Sierra Leoneans | 13.0 /100 | #211 | Poor 89.0% |
| Somalis | 12.8 /100 | #212 | Poor 89.0% |
| Immigrants from Western Asia | 12.3 /100 | #213 | Poor 89.0% |
Apache 1 or more Vehicles in Household Correlation Summary
| Measurement | Apache Data | 1 or more Vehicles in Household Data |
| Minimum | 0.085% | 58.7% |
| Maximum | 99.7% | 100.0% |
| Range | 99.7% | 41.3% |
| Mean | 36.8% | 88.0% |
| Median | 17.1% | 92.5% |
| Interquartile 25% (IQ1) | 7.0% | 79.8% |
| Interquartile 75% (IQ3) | 79.3% | 94.4% |
| Interquartile Range (IQR) | 72.3% | 14.6% |
| Standard Deviation (Sample) | 36.0% | 10.5% |
| Standard Deviation (Population) | 35.6% | 10.4% |
Correlation Details
| Apache Percentile | Sample Size | 1 or more Vehicles in Household |
[ 0.0% - 0.5% ] 0.085% | 224,538,064 | 90.0% |
[ 0.5% - 1.0% ] 0.67% | 4,781,105 | 93.9% |
[ 1.0% - 1.5% ] 1.20% | 901,074 | 92.4% |
[ 1.5% - 2.0% ] 1.68% | 332,860 | 94.1% |
[ 2.0% - 2.5% ] 2.24% | 177,989 | 93.8% |
[ 2.5% - 3.0% ] 2.69% | 55,900 | 92.6% |
[ 3.0% - 3.5% ] 3.22% | 44,304 | 93.7% |
[ 3.5% - 4.0% ] 3.73% | 12,042 | 94.4% |
[ 4.0% - 4.5% ] 4.34% | 42,778 | 95.1% |
[ 4.5% - 5.0% ] 4.83% | 27,540 | 91.5% |
[ 5.0% - 5.5% ] 5.26% | 33,659 | 89.4% |
[ 5.5% - 6.0% ] 5.72% | 11,702 | 94.4% |
[ 6.0% - 6.5% ] 6.23% | 3,289 | 90.2% |
[ 6.5% - 7.0% ] 6.75% | 963 | 68.1% |
[ 7.0% - 7.5% ] 7.29% | 2,482 | 79.8% |
[ 7.5% - 8.0% ] 7.79% | 1,027 | 77.0% |
[ 8.0% - 8.5% ] 8.18% | 489 | 100.0% |
[ 8.5% - 9.0% ] 8.84% | 848 | 100.0% |
[ 9.5% - 10.0% ] 9.80% | 8,287 | 93.3% |
[ 11.0% - 11.5% ] 11.35% | 414 | 93.3% |
[ 12.0% - 12.5% ] 12.30% | 6,319 | 87.8% |
[ 13.0% - 13.5% ] 13.33% | 225 | 87.8% |
[ 14.0% - 14.5% ] 14.02% | 271 | 100.0% |
[ 14.5% - 15.0% ] 14.90% | 2,563 | 92.7% |
[ 15.0% - 15.5% ] 15.50% | 342 | 87.8% |
[ 15.5% - 16.0% ] 15.69% | 1,479 | 92.7% |
[ 16.0% - 16.5% ] 16.44% | 1,928 | 93.0% |
[ 16.5% - 17.0% ] 16.97% | 442 | 94.4% |
[ 17.0% - 17.5% ] 17.16% | 169 | 100.0% |
[ 18.0% - 18.5% ] 18.45% | 618 | 78.7% |
[ 20.0% - 20.5% ] 20.00% | 10 | 100.0% |
[ 22.0% - 22.5% ] 22.22% | 27 | 100.0% |
[ 26.0% - 26.5% ] 26.02% | 246 | 75.0% |
[ 28.0% - 28.5% ] 28.26% | 46 | 65.8% |
[ 34.0% - 34.5% ] 34.01% | 147 | 100.0% |
[ 37.0% - 37.5% ] 37.50% | 16 | 100.0% |
[ 37.5% - 38.0% ] 37.59% | 133 | 100.0% |
[ 42.5% - 43.0% ] 42.73% | 227 | 100.0% |
[ 64.5% - 65.0% ] 64.77% | 457 | 58.7% |
[ 76.5% - 77.0% ] 76.94% | 2,650 | 98.5% |
[ 78.0% - 78.5% ] 78.32% | 7,067 | 78.9% |
[ 78.5% - 79.0% ] 78.81% | 2,261 | 98.3% |
[ 79.5% - 80.0% ] 79.86% | 4,405 | 73.6% |
[ 80.5% - 81.0% ] 80.68% | 4,860 | 81.4% |
[ 81.5% - 82.0% ] 81.63% | 980 | 93.7% |
[ 86.5% - 87.0% ] 86.87% | 11,840 | 80.7% |
[ 87.0% - 87.5% ] 87.10% | 837 | 94.4% |
[ 88.5% - 89.0% ] 88.66% | 3,130 | 79.8% |
[ 89.0% - 89.5% ] 89.14% | 1,621 | 86.8% |
[ 90.0% - 90.5% ] 90.48% | 4,284 | 69.8% |
[ 92.0% - 92.5% ] 92.28% | 3,110 | 70.9% |
[ 92.5% - 93.0% ] 92.84% | 1,592 | 80.8% |
[ 93.0% - 93.5% ] 93.19% | 2,173 | 77.8% |
[ 94.0% - 94.5% ] 94.31% | 2,497 | 82.3% |
[ 98.0% - 98.5% ] 98.39% | 1,552 | 72.9% |
[ 99.5% - 100.0% ] 99.75% | 789 | 75.4% |