Turkish vs French 1 or more Vehicles in Household
COMPARE
Turkish
French
1 or more Vehicles in Household
1 or more Vehicles in Household Comparison
Turks
French
88.4%
1 OR MORE VEHICLES IN HOUSEHOLD
2.5/ 100
METRIC RATING
242nd/ 347
METRIC RANK
92.7%
1 OR MORE VEHICLES IN HOUSEHOLD
100.0/ 100
METRIC RATING
22nd/ 347
METRIC RANK
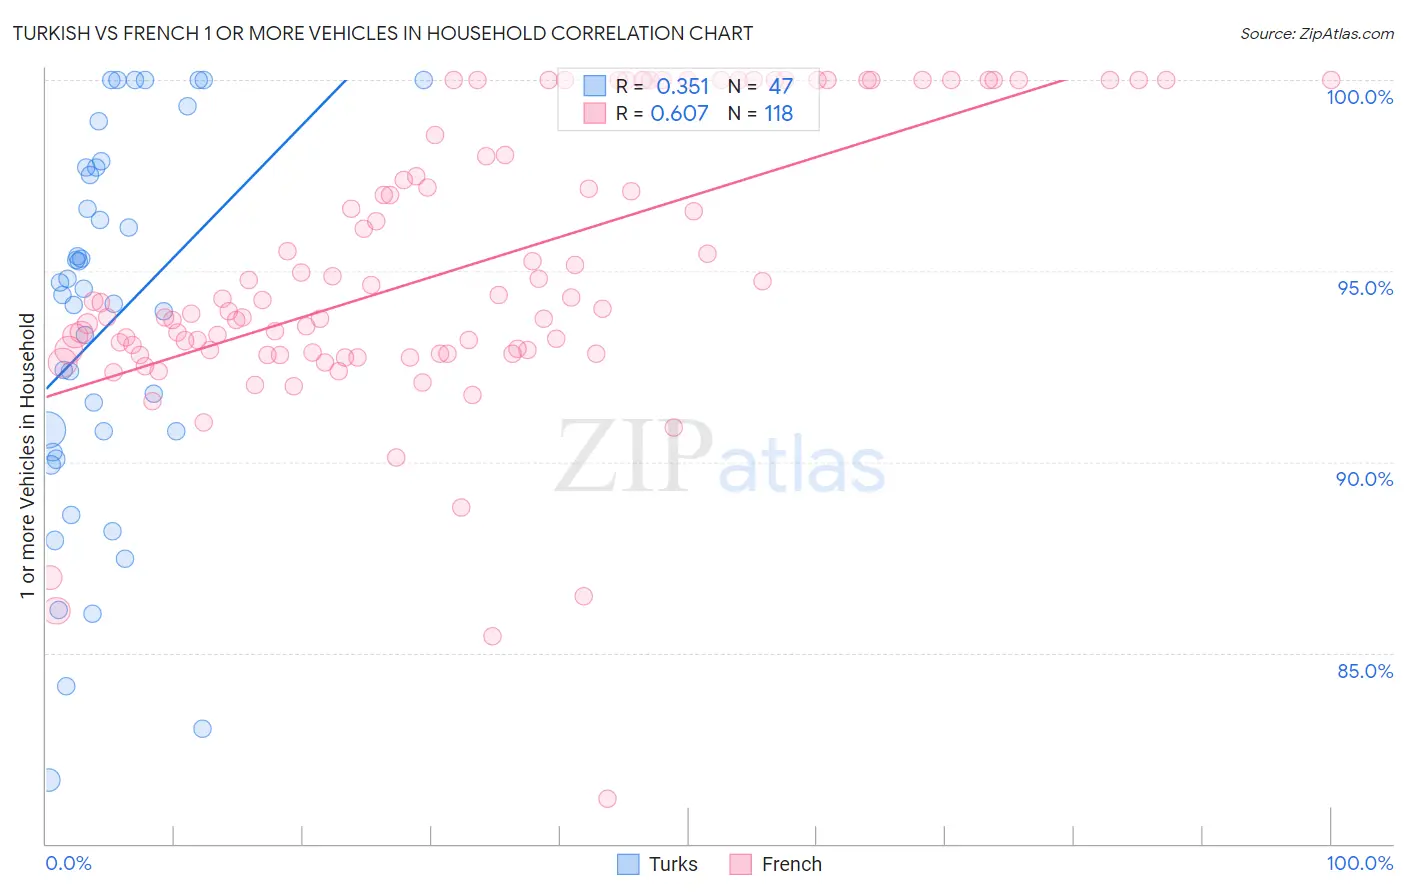
Turkish vs French 1 or more Vehicles in Household Correlation Chart
The statistical analysis conducted on geographies consisting of 271,719,396 people shows a mild positive correlation between the proportion of Turks and percentage of households with 1 or more vehicles available in the United States with a correlation coefficient (R) of 0.351 and weighted average of 88.4%. Similarly, the statistical analysis conducted on geographies consisting of 571,913,868 people shows a significant positive correlation between the proportion of French and percentage of households with 1 or more vehicles available in the United States with a correlation coefficient (R) of 0.607 and weighted average of 92.7%, a difference of 4.8%.
1 or more Vehicles in Household Correlation Summary
| Measurement | Turkish | French |
| Minimum | 81.7% | 81.2% |
| Maximum | 100.0% | 100.0% |
| Range | 18.3% | 18.8% |
| Mean | 93.6% | 95.0% |
| Median | 94.4% | 94.1% |
| Interquartile 25% (IQ1) | 90.3% | 92.8% |
| Interquartile 75% (IQ3) | 97.7% | 98.6% |
| Interquartile Range (IQR) | 7.4% | 5.7% |
| Standard Deviation (Sample) | 4.9% | 3.7% |
| Standard Deviation (Population) | 4.9% | 3.7% |
Similar Demographics by 1 or more Vehicles in Household
Demographics Similar to Turks by 1 or more Vehicles in Household
In terms of 1 or more vehicles in household, the demographic groups most similar to Turks are Taiwanese (88.4%, a difference of 0.020%), Immigrants from Belgium (88.4%, a difference of 0.060%), Eastern European (88.5%, a difference of 0.070%), Immigrants from Portugal (88.3%, a difference of 0.080%), and Immigrants from Czechoslovakia (88.3%, a difference of 0.10%).
| Demographics | Rating | Rank | 1 or more Vehicles in Household |
| Paiute | 4.6 /100 | #235 | Tragic 88.6% |
| Immigrants | Pakistan | 4.5 /100 | #236 | Tragic 88.6% |
| Immigrants | Turkey | 4.4 /100 | #237 | Tragic 88.6% |
| Immigrants | Somalia | 4.2 /100 | #238 | Tragic 88.6% |
| Kiowa | 3.8 /100 | #239 | Tragic 88.6% |
| Eastern Europeans | 3.0 /100 | #240 | Tragic 88.5% |
| Taiwanese | 2.6 /100 | #241 | Tragic 88.4% |
| Turks | 2.5 /100 | #242 | Tragic 88.4% |
| Immigrants | Belgium | 2.1 /100 | #243 | Tragic 88.4% |
| Immigrants | Portugal | 2.0 /100 | #244 | Tragic 88.3% |
| Immigrants | Czechoslovakia | 1.9 /100 | #245 | Tragic 88.3% |
| Menominee | 1.9 /100 | #246 | Tragic 88.3% |
| Immigrants | Honduras | 1.7 /100 | #247 | Tragic 88.3% |
| Immigrants | Nigeria | 1.5 /100 | #248 | Tragic 88.2% |
| Blacks/African Americans | 1.4 /100 | #249 | Tragic 88.2% |
Demographics Similar to French by 1 or more Vehicles in Household
In terms of 1 or more vehicles in household, the demographic groups most similar to French are Ottawa (92.7%, a difference of 0.010%), Arapaho (92.7%, a difference of 0.030%), Nepalese (92.6%, a difference of 0.070%), Yaqui (92.6%, a difference of 0.14%), and Immigrants from Iraq (92.5%, a difference of 0.16%).
| Demographics | Rating | Rank | 1 or more Vehicles in Household |
| Mexicans | 100.0 /100 | #15 | Exceptional 93.0% |
| Assyrians/Chaldeans/Syriacs | 100.0 /100 | #16 | Exceptional 93.0% |
| Europeans | 100.0 /100 | #17 | Exceptional 93.0% |
| Welsh | 100.0 /100 | #18 | Exceptional 93.0% |
| Tongans | 100.0 /100 | #19 | Exceptional 92.9% |
| Arapaho | 100.0 /100 | #20 | Exceptional 92.7% |
| Ottawa | 100.0 /100 | #21 | Exceptional 92.7% |
| French | 100.0 /100 | #22 | Exceptional 92.7% |
| Nepalese | 100.0 /100 | #23 | Exceptional 92.6% |
| Yaqui | 100.0 /100 | #24 | Exceptional 92.6% |
| Immigrants | Iraq | 100.0 /100 | #25 | Exceptional 92.5% |
| British | 100.0 /100 | #26 | Exceptional 92.5% |
| Americans | 100.0 /100 | #27 | Exceptional 92.5% |
| Sri Lankans | 100.0 /100 | #28 | Exceptional 92.5% |
| Native Hawaiians | 100.0 /100 | #29 | Exceptional 92.4% |