Immigrants from Poland vs Immigrants from South Eastern Asia 1 or more Vehicles in Household
COMPARE
Immigrants from Poland
Immigrants from South Eastern Asia
1 or more Vehicles in Household
1 or more Vehicles in Household Comparison
Immigrants from Poland
Immigrants from South Eastern Asia
89.5%
1 OR MORE VEHICLES IN HOUSEHOLD
37.1/ 100
METRIC RATING
191st/ 347
METRIC RANK
91.4%
1 OR MORE VEHICLES IN HOUSEHOLD
99.3/ 100
METRIC RATING
81st/ 347
METRIC RANK
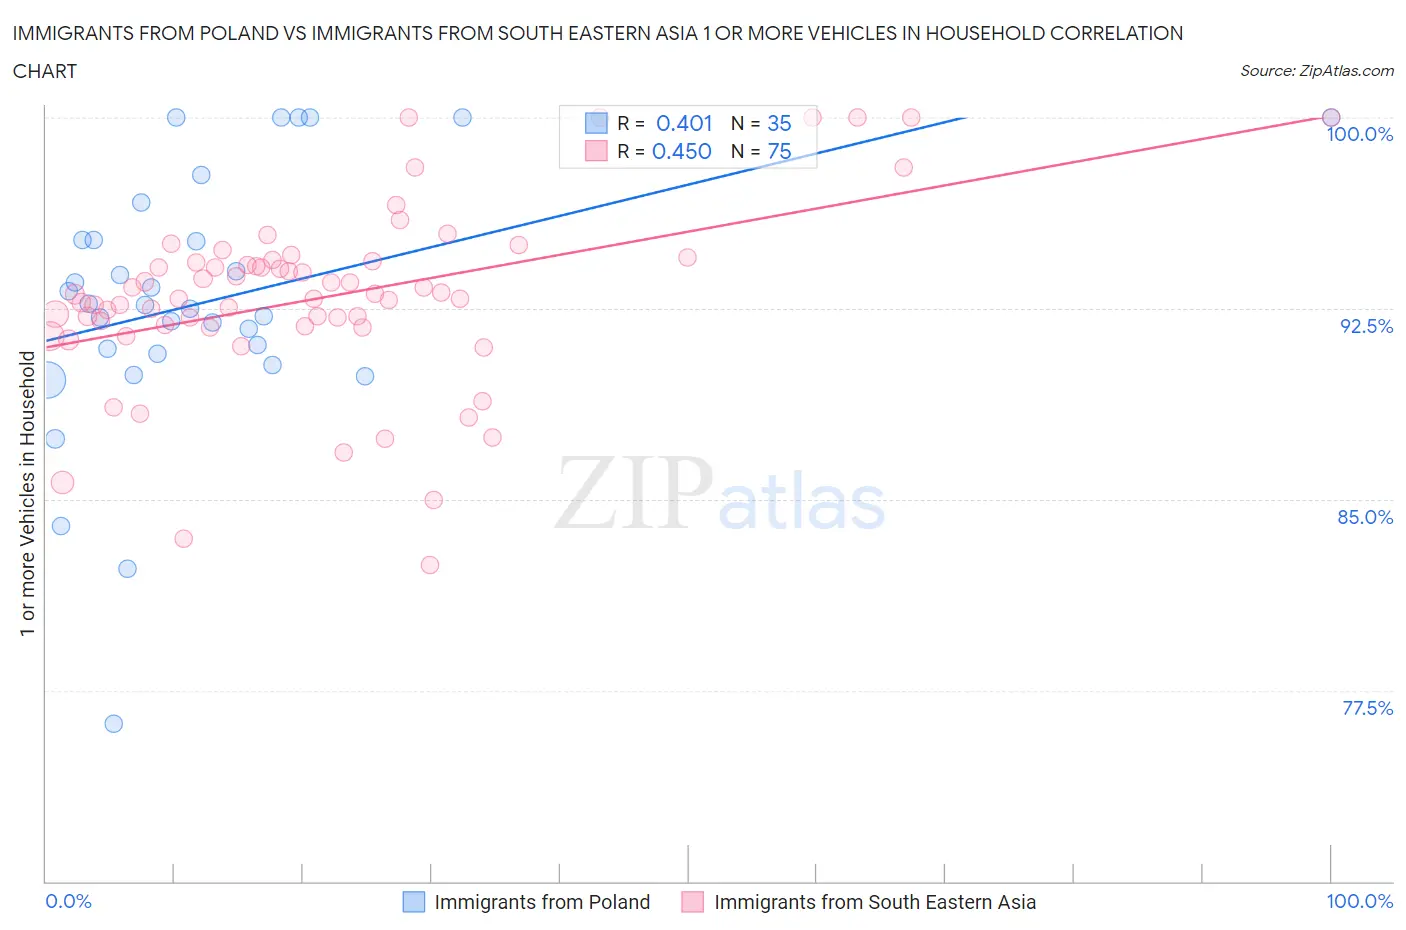
Immigrants from Poland vs Immigrants from South Eastern Asia 1 or more Vehicles in Household Correlation Chart
The statistical analysis conducted on geographies consisting of 304,721,875 people shows a moderate positive correlation between the proportion of Immigrants from Poland and percentage of households with 1 or more vehicles available in the United States with a correlation coefficient (R) of 0.401 and weighted average of 89.5%. Similarly, the statistical analysis conducted on geographies consisting of 512,318,817 people shows a moderate positive correlation between the proportion of Immigrants from South Eastern Asia and percentage of households with 1 or more vehicles available in the United States with a correlation coefficient (R) of 0.450 and weighted average of 91.4%, a difference of 2.2%.
1 or more Vehicles in Household Correlation Summary
| Measurement | Immigrants from Poland | Immigrants from South Eastern Asia |
| Minimum | 76.2% | 82.4% |
| Maximum | 100.0% | 100.0% |
| Range | 23.8% | 17.6% |
| Mean | 92.8% | 92.9% |
| Median | 92.6% | 93.1% |
| Interquartile 25% (IQ1) | 90.7% | 91.8% |
| Interquartile 75% (IQ3) | 95.2% | 94.4% |
| Interquartile Range (IQR) | 4.5% | 2.5% |
| Standard Deviation (Sample) | 5.2% | 3.6% |
| Standard Deviation (Population) | 5.1% | 3.5% |
Similar Demographics by 1 or more Vehicles in Household
Demographics Similar to Immigrants from Poland by 1 or more Vehicles in Household
In terms of 1 or more vehicles in household, the demographic groups most similar to Immigrants from Poland are Carpatho Rusyn (89.5%, a difference of 0.010%), Shoshone (89.5%, a difference of 0.010%), Immigrants from North Macedonia (89.5%, a difference of 0.010%), Immigrants from Nepal (89.5%, a difference of 0.030%), and Immigrants from Northern Europe (89.5%, a difference of 0.030%).
| Demographics | Rating | Rank | 1 or more Vehicles in Household |
| Immigrants | Bulgaria | 40.7 /100 | #184 | Average 89.6% |
| Immigrants | Brazil | 40.1 /100 | #185 | Average 89.6% |
| Pueblo | 39.9 /100 | #186 | Fair 89.6% |
| South Americans | 39.6 /100 | #187 | Fair 89.5% |
| Immigrants | Nepal | 38.9 /100 | #188 | Fair 89.5% |
| Carpatho Rusyns | 37.8 /100 | #189 | Fair 89.5% |
| Shoshone | 37.5 /100 | #190 | Fair 89.5% |
| Immigrants | Poland | 37.1 /100 | #191 | Fair 89.5% |
| Immigrants | North Macedonia | 36.5 /100 | #192 | Fair 89.5% |
| Immigrants | Northern Europe | 35.5 /100 | #193 | Fair 89.5% |
| Immigrants | Eritrea | 33.2 /100 | #194 | Fair 89.4% |
| Immigrants | Armenia | 31.8 /100 | #195 | Fair 89.4% |
| Crow | 24.3 /100 | #196 | Fair 89.3% |
| Immigrants | Sweden | 23.6 /100 | #197 | Fair 89.3% |
| Pennsylvania Germans | 22.9 /100 | #198 | Fair 89.3% |
Demographics Similar to Immigrants from South Eastern Asia by 1 or more Vehicles in Household
In terms of 1 or more vehicles in household, the demographic groups most similar to Immigrants from South Eastern Asia are Lebanese (91.4%, a difference of 0.010%), Immigrants from England (91.4%, a difference of 0.010%), Jordanian (91.4%, a difference of 0.020%), Bolivian (91.5%, a difference of 0.030%), and Tsimshian (91.4%, a difference of 0.030%).
| Demographics | Rating | Rank | 1 or more Vehicles in Household |
| Immigrants | Lebanon | 99.6 /100 | #74 | Exceptional 91.6% |
| Portuguese | 99.5 /100 | #75 | Exceptional 91.6% |
| Cubans | 99.5 /100 | #76 | Exceptional 91.5% |
| Immigrants | Philippines | 99.4 /100 | #77 | Exceptional 91.5% |
| Iranians | 99.4 /100 | #78 | Exceptional 91.5% |
| Immigrants | South Central Asia | 99.4 /100 | #79 | Exceptional 91.5% |
| Bolivians | 99.4 /100 | #80 | Exceptional 91.5% |
| Immigrants | South Eastern Asia | 99.3 /100 | #81 | Exceptional 91.4% |
| Lebanese | 99.3 /100 | #82 | Exceptional 91.4% |
| Immigrants | England | 99.3 /100 | #83 | Exceptional 91.4% |
| Jordanians | 99.3 /100 | #84 | Exceptional 91.4% |
| Tsimshian | 99.3 /100 | #85 | Exceptional 91.4% |
| Osage | 99.2 /100 | #86 | Exceptional 91.4% |
| Immigrants | Germany | 99.2 /100 | #87 | Exceptional 91.4% |
| Spanish Americans | 99.2 /100 | #88 | Exceptional 91.4% |