Immigrants from Poland vs Guatemalan 1 or more Vehicles in Household
COMPARE
Immigrants from Poland
Guatemalan
1 or more Vehicles in Household
1 or more Vehicles in Household Comparison
Immigrants from Poland
Guatemalans
89.5%
1 OR MORE VEHICLES IN HOUSEHOLD
37.1/ 100
METRIC RATING
191st/ 347
METRIC RANK
89.2%
1 OR MORE VEHICLES IN HOUSEHOLD
17.8/ 100
METRIC RATING
205th/ 347
METRIC RANK
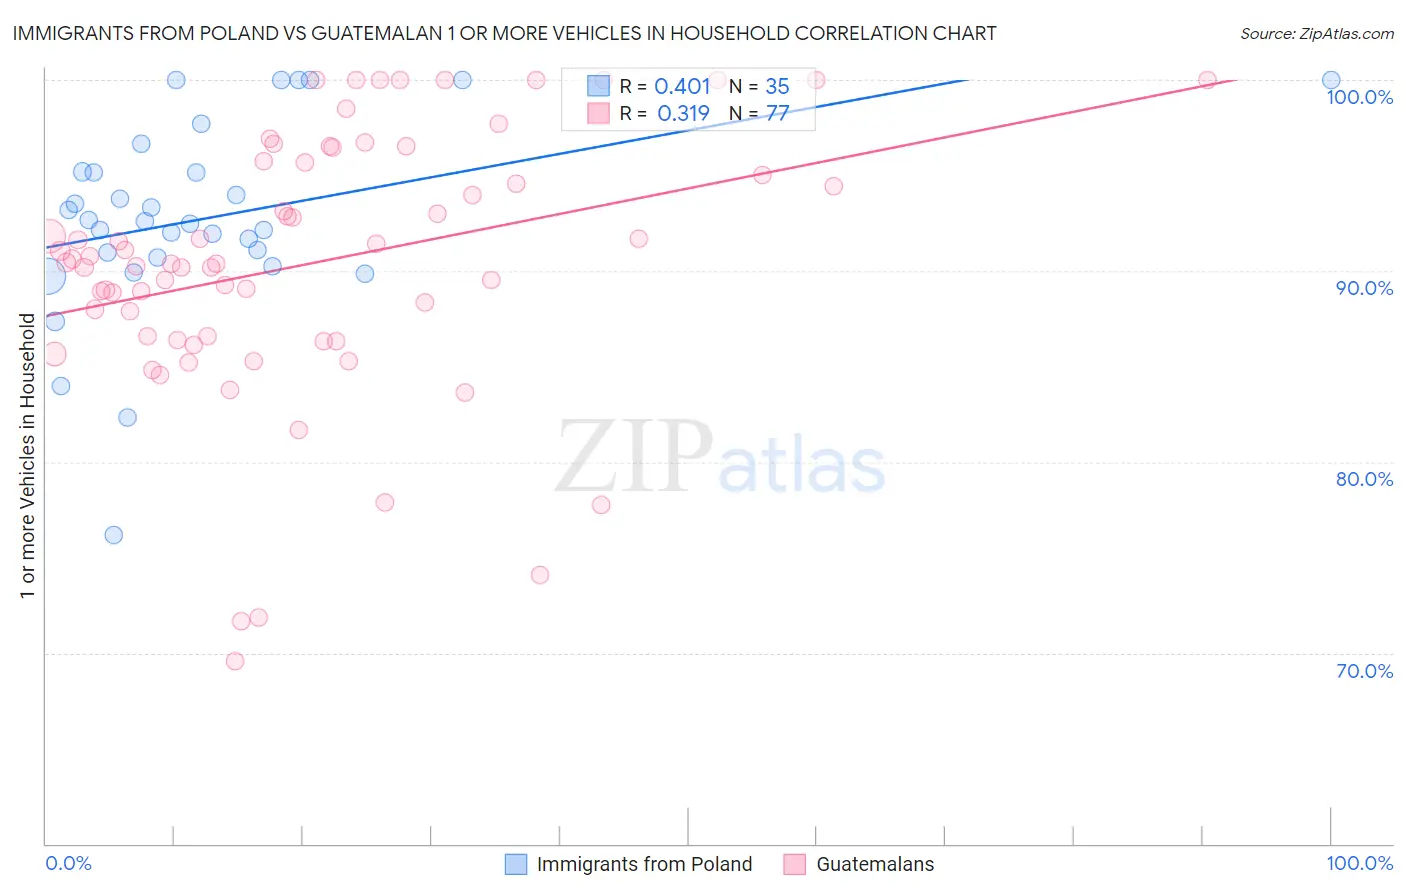
Immigrants from Poland vs Guatemalan 1 or more Vehicles in Household Correlation Chart
The statistical analysis conducted on geographies consisting of 304,721,875 people shows a moderate positive correlation between the proportion of Immigrants from Poland and percentage of households with 1 or more vehicles available in the United States with a correlation coefficient (R) of 0.401 and weighted average of 89.5%. Similarly, the statistical analysis conducted on geographies consisting of 409,296,484 people shows a mild positive correlation between the proportion of Guatemalans and percentage of households with 1 or more vehicles available in the United States with a correlation coefficient (R) of 0.319 and weighted average of 89.2%, a difference of 0.39%.
1 or more Vehicles in Household Correlation Summary
| Measurement | Immigrants from Poland | Guatemalan |
| Minimum | 76.2% | 69.6% |
| Maximum | 100.0% | 100.0% |
| Range | 23.8% | 30.4% |
| Mean | 92.8% | 90.4% |
| Median | 92.6% | 90.4% |
| Interquartile 25% (IQ1) | 90.7% | 86.5% |
| Interquartile 75% (IQ3) | 95.2% | 95.7% |
| Interquartile Range (IQR) | 4.5% | 9.3% |
| Standard Deviation (Sample) | 5.2% | 6.9% |
| Standard Deviation (Population) | 5.1% | 6.8% |
Demographics Similar to Immigrants from Poland and Guatemalans by 1 or more Vehicles in Household
In terms of 1 or more vehicles in household, the demographic groups most similar to Immigrants from Poland are Carpatho Rusyn (89.5%, a difference of 0.010%), Shoshone (89.5%, a difference of 0.010%), Immigrants from North Macedonia (89.5%, a difference of 0.010%), Immigrants from Nepal (89.5%, a difference of 0.030%), and Immigrants from Northern Europe (89.5%, a difference of 0.030%). Similarly, the demographic groups most similar to Guatemalans are Romanian (89.2%, a difference of 0.010%), Cambodian (89.2%, a difference of 0.030%), Iroquois (89.2%, a difference of 0.050%), Apache (89.1%, a difference of 0.050%), and Immigrants from Western Europe (89.2%, a difference of 0.070%).
| Demographics | Rating | Rank | 1 or more Vehicles in Household |
| Immigrants | Nepal | 38.9 /100 | #188 | Fair 89.5% |
| Carpatho Rusyns | 37.8 /100 | #189 | Fair 89.5% |
| Shoshone | 37.5 /100 | #190 | Fair 89.5% |
| Immigrants | Poland | 37.1 /100 | #191 | Fair 89.5% |
| Immigrants | North Macedonia | 36.5 /100 | #192 | Fair 89.5% |
| Immigrants | Northern Europe | 35.5 /100 | #193 | Fair 89.5% |
| Immigrants | Eritrea | 33.2 /100 | #194 | Fair 89.4% |
| Immigrants | Armenia | 31.8 /100 | #195 | Fair 89.4% |
| Crow | 24.3 /100 | #196 | Fair 89.3% |
| Immigrants | Sweden | 23.6 /100 | #197 | Fair 89.3% |
| Pennsylvania Germans | 22.9 /100 | #198 | Fair 89.3% |
| Immigrants | Asia | 22.8 /100 | #199 | Fair 89.3% |
| Central Americans | 21.4 /100 | #200 | Fair 89.2% |
| Immigrants | Western Europe | 20.5 /100 | #201 | Fair 89.2% |
| Iroquois | 19.8 /100 | #202 | Poor 89.2% |
| Cambodians | 18.9 /100 | #203 | Poor 89.2% |
| Romanians | 18.2 /100 | #204 | Poor 89.2% |
| Guatemalans | 17.8 /100 | #205 | Poor 89.2% |
| Apache | 16.2 /100 | #206 | Poor 89.1% |
| Immigrants | Denmark | 14.8 /100 | #207 | Poor 89.1% |
| Immigrants | Chile | 14.4 /100 | #208 | Poor 89.1% |