Aleut vs Immigrants from Zaire 1 or more Vehicles in Household
COMPARE
Aleut
Immigrants from Zaire
1 or more Vehicles in Household
1 or more Vehicles in Household Comparison
Aleuts
Immigrants from Zaire
87.5%
1 OR MORE VEHICLES IN HOUSEHOLD
0.2/ 100
METRIC RATING
272nd/ 347
METRIC RANK
88.8%
1 OR MORE VEHICLES IN HOUSEHOLD
8.1/ 100
METRIC RATING
220th/ 347
METRIC RANK
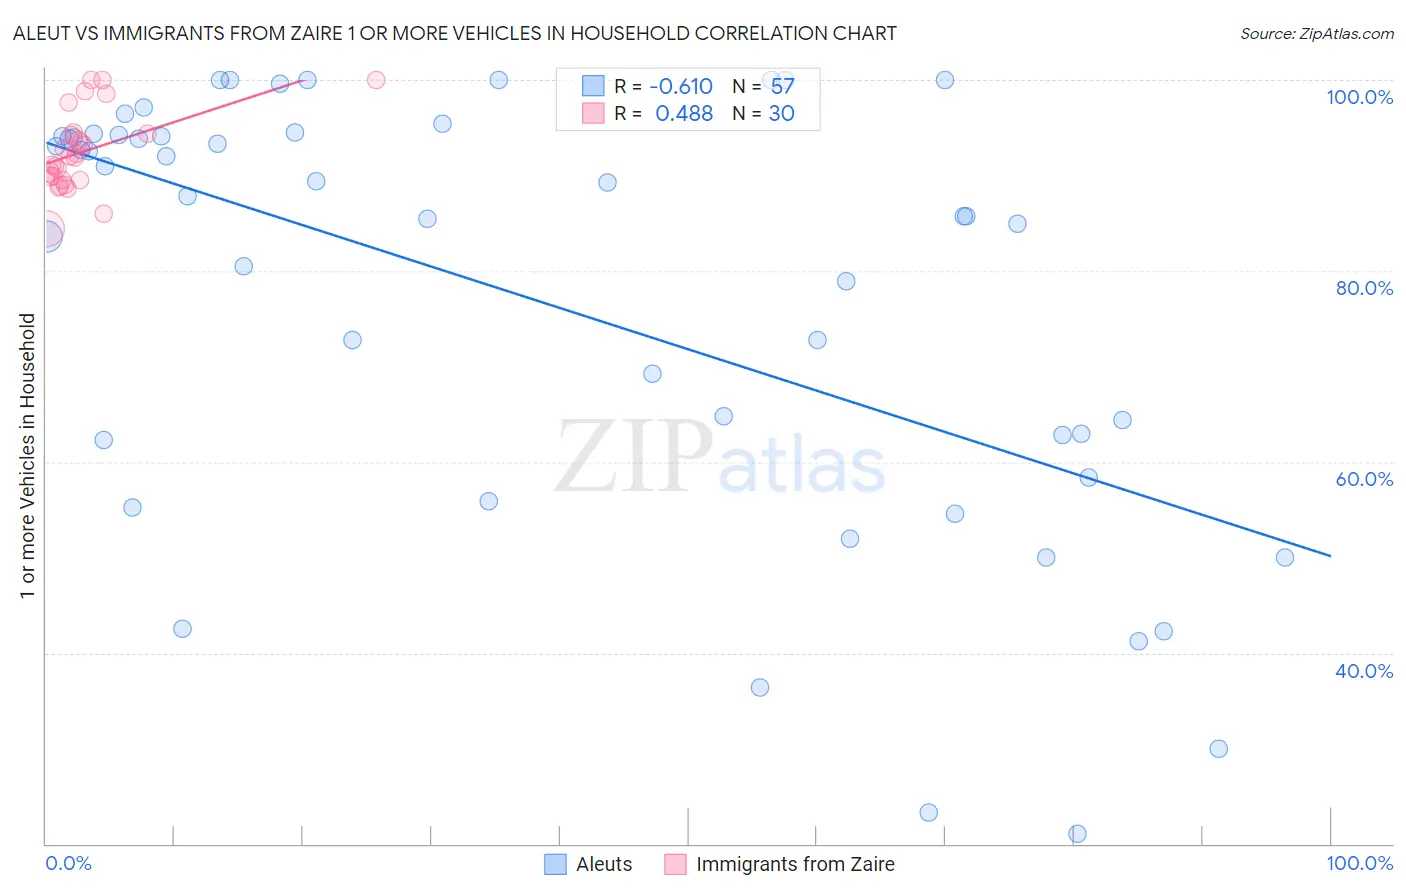
Aleut vs Immigrants from Zaire 1 or more Vehicles in Household Correlation Chart
The statistical analysis conducted on geographies consisting of 61,775,894 people shows a significant negative correlation between the proportion of Aleuts and percentage of households with 1 or more vehicles available in the United States with a correlation coefficient (R) of -0.610 and weighted average of 87.5%. Similarly, the statistical analysis conducted on geographies consisting of 107,246,664 people shows a moderate positive correlation between the proportion of Immigrants from Zaire and percentage of households with 1 or more vehicles available in the United States with a correlation coefficient (R) of 0.488 and weighted average of 88.8%, a difference of 1.6%.
1 or more Vehicles in Household Correlation Summary
| Measurement | Aleut | Immigrants from Zaire |
| Minimum | 21.1% | 84.4% |
| Maximum | 100.0% | 100.0% |
| Range | 78.9% | 15.6% |
| Mean | 77.1% | 92.5% |
| Median | 85.7% | 91.9% |
| Interquartile 25% (IQ1) | 60.3% | 89.6% |
| Interquartile 75% (IQ3) | 94.2% | 94.4% |
| Interquartile Range (IQR) | 33.8% | 4.8% |
| Standard Deviation (Sample) | 22.5% | 4.1% |
| Standard Deviation (Population) | 22.3% | 4.1% |
Similar Demographics by 1 or more Vehicles in Household
Demographics Similar to Aleuts by 1 or more Vehicles in Household
In terms of 1 or more vehicles in household, the demographic groups most similar to Aleuts are Immigrants from Northern Africa (87.4%, a difference of 0.040%), Bermudan (87.5%, a difference of 0.060%), Panamanian (87.5%, a difference of 0.070%), Immigrants from Africa (87.6%, a difference of 0.080%), and Immigrants from Morocco (87.4%, a difference of 0.080%).
| Demographics | Rating | Rank | 1 or more Vehicles in Household |
| Africans | 0.4 /100 | #265 | Tragic 87.8% |
| Israelis | 0.3 /100 | #266 | Tragic 87.7% |
| Immigrants | Colombia | 0.3 /100 | #267 | Tragic 87.6% |
| Immigrants | Europe | 0.2 /100 | #268 | Tragic 87.6% |
| Immigrants | Africa | 0.2 /100 | #269 | Tragic 87.6% |
| Panamanians | 0.2 /100 | #270 | Tragic 87.5% |
| Bermudans | 0.2 /100 | #271 | Tragic 87.5% |
| Aleuts | 0.2 /100 | #272 | Tragic 87.5% |
| Immigrants | Northern Africa | 0.2 /100 | #273 | Tragic 87.4% |
| Immigrants | Morocco | 0.1 /100 | #274 | Tragic 87.4% |
| Immigrants | Singapore | 0.1 /100 | #275 | Tragic 87.2% |
| Immigrants | France | 0.1 /100 | #276 | Tragic 87.1% |
| Alsatians | 0.1 /100 | #277 | Tragic 87.1% |
| Immigrants | Southern Europe | 0.1 /100 | #278 | Tragic 87.1% |
| Immigrants | Albania | 0.1 /100 | #279 | Tragic 87.1% |
Demographics Similar to Immigrants from Zaire by 1 or more Vehicles in Household
In terms of 1 or more vehicles in household, the demographic groups most similar to Immigrants from Zaire are Peruvian (88.8%, a difference of 0.010%), Ugandan (88.9%, a difference of 0.030%), Immigrants from Guatemala (88.9%, a difference of 0.030%), Argentinean (88.9%, a difference of 0.040%), and Immigrants from Argentina (88.9%, a difference of 0.070%).
| Demographics | Rating | Rank | 1 or more Vehicles in Household |
| Immigrants | Western Asia | 12.3 /100 | #213 | Poor 89.0% |
| Immigrants | Hungary | 11.9 /100 | #214 | Poor 89.0% |
| Immigrants | Sri Lanka | 10.2 /100 | #215 | Poor 88.9% |
| Immigrants | Argentina | 9.4 /100 | #216 | Tragic 88.9% |
| Argentineans | 8.8 /100 | #217 | Tragic 88.9% |
| Ugandans | 8.7 /100 | #218 | Tragic 88.9% |
| Immigrants | Guatemala | 8.6 /100 | #219 | Tragic 88.9% |
| Immigrants | Zaire | 8.1 /100 | #220 | Tragic 88.8% |
| Peruvians | 7.9 /100 | #221 | Tragic 88.8% |
| Uruguayans | 7.0 /100 | #222 | Tragic 88.8% |
| Immigrants | South America | 7.0 /100 | #223 | Tragic 88.8% |
| Immigrants | Hong Kong | 6.2 /100 | #224 | Tragic 88.7% |
| Cree | 6.0 /100 | #225 | Tragic 88.7% |
| Cheyenne | 5.7 /100 | #226 | Tragic 88.7% |
| Ute | 5.6 /100 | #227 | Tragic 88.7% |