Aleut vs Iroquois 1 or more Vehicles in Household
COMPARE
Aleut
Iroquois
1 or more Vehicles in Household
1 or more Vehicles in Household Comparison
Aleuts
Iroquois
87.5%
1 OR MORE VEHICLES IN HOUSEHOLD
0.2/ 100
METRIC RATING
272nd/ 347
METRIC RANK
89.2%
1 OR MORE VEHICLES IN HOUSEHOLD
19.8/ 100
METRIC RATING
202nd/ 347
METRIC RANK
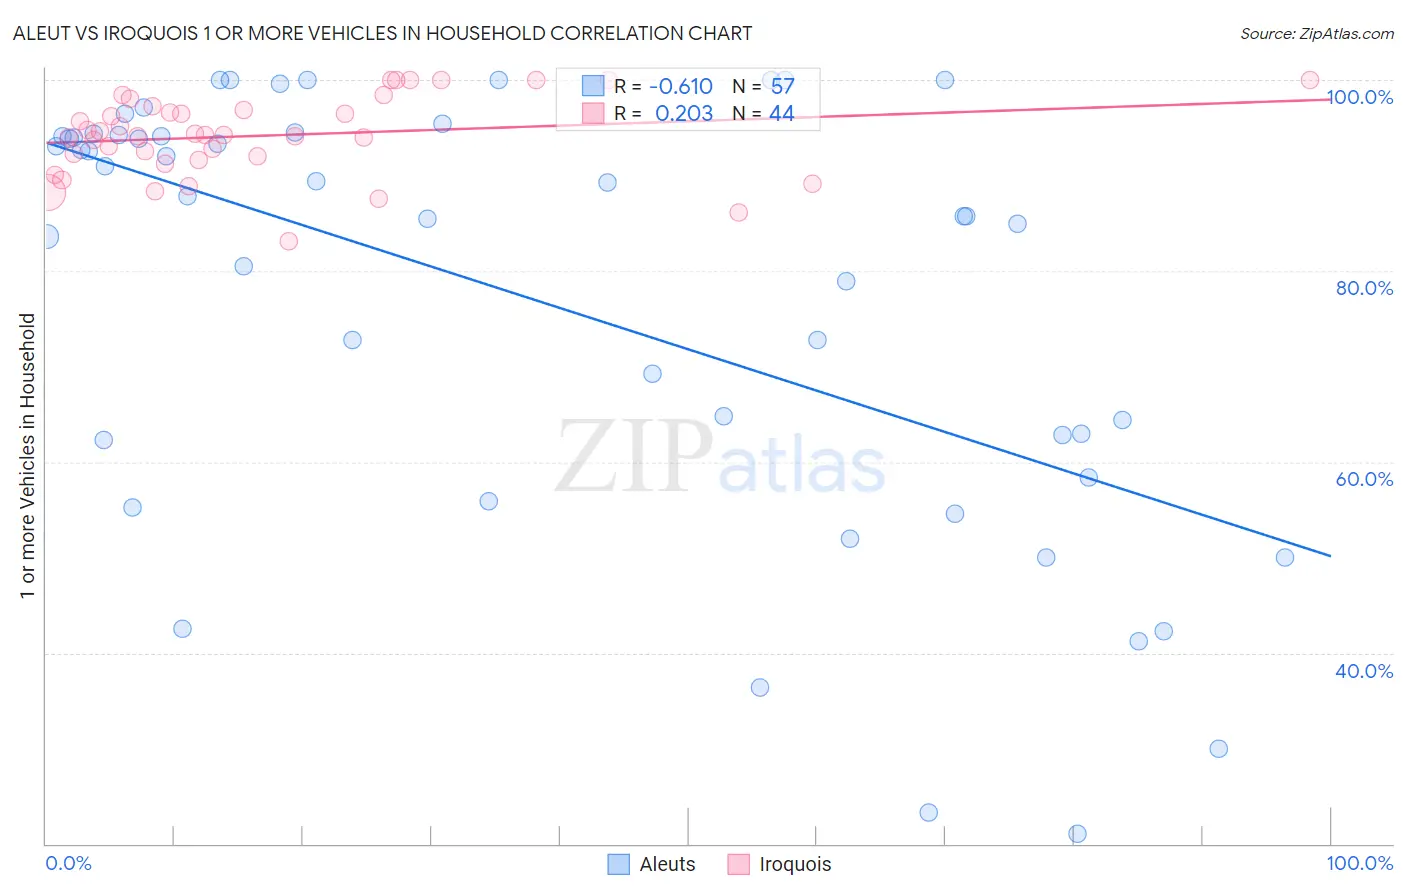
Aleut vs Iroquois 1 or more Vehicles in Household Correlation Chart
The statistical analysis conducted on geographies consisting of 61,775,894 people shows a significant negative correlation between the proportion of Aleuts and percentage of households with 1 or more vehicles available in the United States with a correlation coefficient (R) of -0.610 and weighted average of 87.5%. Similarly, the statistical analysis conducted on geographies consisting of 207,261,680 people shows a weak positive correlation between the proportion of Iroquois and percentage of households with 1 or more vehicles available in the United States with a correlation coefficient (R) of 0.203 and weighted average of 89.2%, a difference of 2.0%.
1 or more Vehicles in Household Correlation Summary
| Measurement | Aleut | Iroquois |
| Minimum | 21.1% | 83.1% |
| Maximum | 100.0% | 100.0% |
| Range | 78.9% | 16.9% |
| Mean | 77.1% | 94.2% |
| Median | 85.7% | 94.2% |
| Interquartile 25% (IQ1) | 60.3% | 91.8% |
| Interquartile 75% (IQ3) | 94.2% | 97.0% |
| Interquartile Range (IQR) | 33.8% | 5.2% |
| Standard Deviation (Sample) | 22.5% | 4.2% |
| Standard Deviation (Population) | 22.3% | 4.1% |
Similar Demographics by 1 or more Vehicles in Household
Demographics Similar to Aleuts by 1 or more Vehicles in Household
In terms of 1 or more vehicles in household, the demographic groups most similar to Aleuts are Immigrants from Northern Africa (87.4%, a difference of 0.040%), Bermudan (87.5%, a difference of 0.060%), Panamanian (87.5%, a difference of 0.070%), Immigrants from Africa (87.6%, a difference of 0.080%), and Immigrants from Morocco (87.4%, a difference of 0.080%).
| Demographics | Rating | Rank | 1 or more Vehicles in Household |
| Africans | 0.4 /100 | #265 | Tragic 87.8% |
| Israelis | 0.3 /100 | #266 | Tragic 87.7% |
| Immigrants | Colombia | 0.3 /100 | #267 | Tragic 87.6% |
| Immigrants | Europe | 0.2 /100 | #268 | Tragic 87.6% |
| Immigrants | Africa | 0.2 /100 | #269 | Tragic 87.6% |
| Panamanians | 0.2 /100 | #270 | Tragic 87.5% |
| Bermudans | 0.2 /100 | #271 | Tragic 87.5% |
| Aleuts | 0.2 /100 | #272 | Tragic 87.5% |
| Immigrants | Northern Africa | 0.2 /100 | #273 | Tragic 87.4% |
| Immigrants | Morocco | 0.1 /100 | #274 | Tragic 87.4% |
| Immigrants | Singapore | 0.1 /100 | #275 | Tragic 87.2% |
| Immigrants | France | 0.1 /100 | #276 | Tragic 87.1% |
| Alsatians | 0.1 /100 | #277 | Tragic 87.1% |
| Immigrants | Southern Europe | 0.1 /100 | #278 | Tragic 87.1% |
| Immigrants | Albania | 0.1 /100 | #279 | Tragic 87.1% |
Demographics Similar to Iroquois by 1 or more Vehicles in Household
In terms of 1 or more vehicles in household, the demographic groups most similar to Iroquois are Immigrants from Western Europe (89.2%, a difference of 0.020%), Cambodian (89.2%, a difference of 0.020%), Central American (89.2%, a difference of 0.040%), Romanian (89.2%, a difference of 0.040%), and Guatemalan (89.2%, a difference of 0.050%).
| Demographics | Rating | Rank | 1 or more Vehicles in Household |
| Immigrants | Armenia | 31.8 /100 | #195 | Fair 89.4% |
| Crow | 24.3 /100 | #196 | Fair 89.3% |
| Immigrants | Sweden | 23.6 /100 | #197 | Fair 89.3% |
| Pennsylvania Germans | 22.9 /100 | #198 | Fair 89.3% |
| Immigrants | Asia | 22.8 /100 | #199 | Fair 89.3% |
| Central Americans | 21.4 /100 | #200 | Fair 89.2% |
| Immigrants | Western Europe | 20.5 /100 | #201 | Fair 89.2% |
| Iroquois | 19.8 /100 | #202 | Poor 89.2% |
| Cambodians | 18.9 /100 | #203 | Poor 89.2% |
| Romanians | 18.2 /100 | #204 | Poor 89.2% |
| Guatemalans | 17.8 /100 | #205 | Poor 89.2% |
| Apache | 16.2 /100 | #206 | Poor 89.1% |
| Immigrants | Denmark | 14.8 /100 | #207 | Poor 89.1% |
| Immigrants | Chile | 14.4 /100 | #208 | Poor 89.1% |
| Immigrants | Italy | 14.0 /100 | #209 | Poor 89.1% |