Zip Codes with the Highest Percentage of Households with Income Above $100,000 in Mabank, TX
RELATED REPORTS & OPTIONS
Household Income | $100k+
Mabank
Compare Zip Codes
Map of Zip Codes with the Highest Percentage of Households with Income Above $100,000 in Mabank
23.1%
26.3%
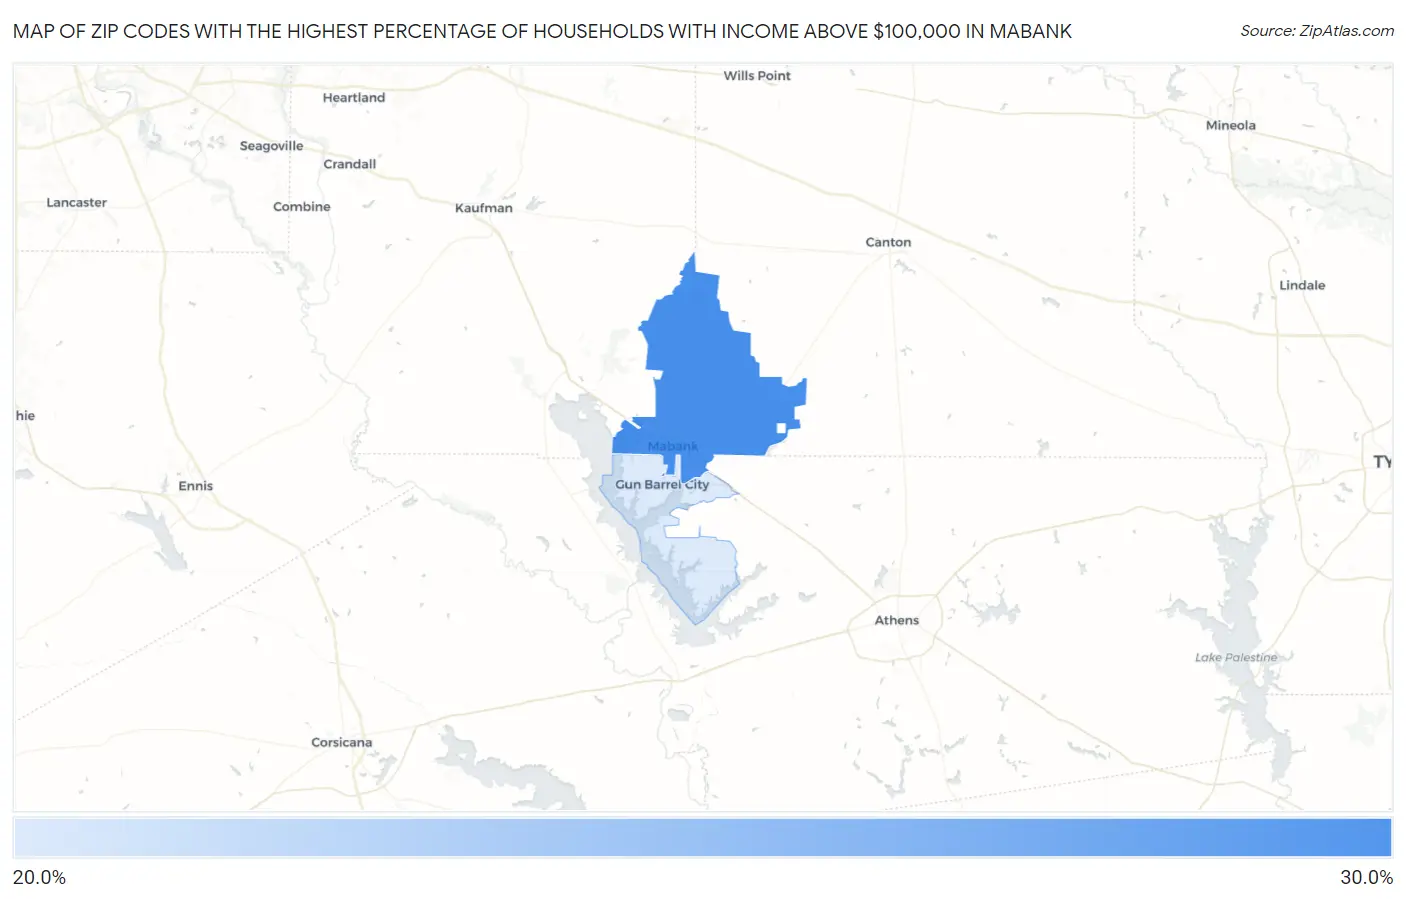
Zip Codes with the Highest Percentage of Households with Income Above $100,000 in Mabank, TX
| Zip Code | Households with Income > $100k | vs State | vs National | |
| 1. | 75147 | 26.3% | 36.2%(-9.90)#1,066 | 37.3%(-11.0)#18,609 |
| 2. | 75156 | 23.1% | 36.2%(-13.1)#1,235 | 37.3%(-14.2)#21,487 |
1
Common Questions
What are the Top Zip Codes with the Highest Percentage of Households with Income Above $100,000 in Mabank, TX?
Top Zip Codes with the Highest Percentage of Households with Income Above $100,000 in Mabank, TX are:
What zip code has the Highest Percentage of Households with Income Above $100,000 in Mabank, TX?
75147 has the Highest Percentage of Households with Income Above $100,000 in Mabank, TX with 26.3%.
What is the Percentage of Households with Income Above $100,000 in Mabank, TX?
Percentage of Households with Income Above $100,000 in Mabank is 28.4%.
What is the Percentage of Households with Income Above $100,000 in Texas?
Percentage of Households with Income Above $100,000 in Texas is 36.2%.
What is the Percentage of Households with Income Above $100,000 in the United States?
Percentage of Households with Income Above $100,000 in the United States is 37.3%.