Zip Codes with the Largest Hawaiian / Pacific Community in Mabank, TX
On this page
RELATED REPORTS & OPTIONS
Hawaiian / Pacific
Population
Highest PopulationHighest Population DensityLowest Population DensityMale / Female RatioFemale / Male RatioOldest PopulationOldest Population | MaleOldest Population | FemaleYoungest PopulationYoungest Population | MaleYoungest Population | Female
Families and Households
Largest Family SizeLargest Household SizeMost Single FathersMost Single MothersFewest Single FathersFewest Single MothersSmallest Family SizeSmallest Household Size
Female Fertility
Highest Birth Rate | All WomenHighest Birth Rate | Women 35+Highest Birth Rate | Below PovertyHighest Birth Rate | Public IncomeHighest Birth Rate | In Labor ForceLowest Birth Rate | All WomenLowest Birth Rate | Women 35+Lowest Birth Rate | Below PovertyLowest Birth Rate | Public IncomeLowest Birth Rate | In Labor Force
Race (Community Size)
Race (Percentage)
Ancestry (Community Size)
AfricanAmericanBritishCzechDutchDutch West IndianEastern EuropeanEnglishEuropeanFrenchGermanIrishItalianKoreanMexicanNative HawaiianNorwegianPolishPuerto RicanScandinavianScotch-IrishSri LankanSubsaharan AfricanSwedishSwissUkrainianWelsh
Ancestry (Percentage)
AfricanAmericanBritishCzechDutchDutch West IndianEastern EuropeanEnglishEuropeanFrenchGermanIrishItalianKoreanMexicanNative HawaiianNorwegianPolishPuerto RicanScandinavianScotch-IrishSri LankanSubsaharan AfricanSwedishSwissUkrainianWelsh
Immigrant Origin (Total)
AsiaCentral AmericaEastern EuropeEuropeGermanyLatin AmericaMexicoPhilippinesSouth Eastern AsiaVietnamWestern Europe
Immigrant Origin (Percentage)
AsiaCentral AmericaEastern EuropeEuropeGermanyLatin AmericaMexicoPhilippinesSouth Eastern AsiaVietnamWestern Europe
Income
Highest Per Capita IncomeHighest Earnings | MaleHighest Earnings | FemaleHighest Wage/Income Gap ($)Highest Wage/Income Gap (%)Highest Inequality / Gini IndexLowest Per Capita IncomeLowest Earnings | MaleLowest Earnings | FemaleLowest Wage/Income Gap ($)Lowest Wage/Income Gap (%)Lowest Inequality / Gini Index
Income (Families)
Highest Family IncomeLowest Family IncomeFamily Income | $0-10kFamily Income | $100k+Family Income | $200k+
Income (Households)
Highest Household IncomeLowest Household IncomeHousehold Income | $0-10kHousehold Income | $200k+Household Income | $100k+
Poverty
Highest PovertyHighest Poverty | MaleHighest Poverty | FemaleHighest Poverty | Female 18-24Highest Poverty | Female 25-34Highest Poverty | Child 0-5Highest Poverty | Child 0-16Highest Poverty | Boys 0-16Highest Poverty | Girls 0-16Highest Poverty | Seniors 65+Highest Poverty | Seniors 75+ Lowest PovertyLowest Poverty | MaleLowest Poverty | FemaleLowest Poverty | Child 0-5Lowest Poverty | Child 0-16Lowest Poverty | Boys 0-16Lowest Poverty | Girls 0-16Lowest Poverty | Seniors 65+Lowest Poverty | Seniors 75+
Poverty (Families)
Highest Family PovertyHighest Poverty | Married CoupleHighest Poverty | Single FemaleHighest Poverty | Single MotherLowest Family PovertyLowest Poverty | Married CoupleLowest Poverty | Single FemaleLowest Poverty | Single Mother
Unemployment
Highest UnemploymentHighest Unemployment | MaleHighest Unemployment | FemaleHighest Unemployment | Youth < 25Highest Unemployment | Senior > 65Lowest UnemploymentLowest Unemployment | MaleLowest Unemployment | FemaleLowest Unemployment | Youth < 25Lowest Unemployment | Senior > 65
Employment Occupations
Architecture & EngineeringArts, Media & EntertainmentBusiness & FinancialCleaning & MaintenanceCommunity & Social Service Computer & MathematicsComputer, Engineering & ScienceConstruction & ExtractionEducation Instruction & LibraryEducation, Arts & MediaFood Preparation & ServingHealth Diagnosing & TreatingHealth TechnologistsHealthcare SupportInstallation, Maintenance & RepairLaw EnforcementLegal Services & SupportManagementMaterial MovingOffice & AdministrationPersonal Care and ServiceProductionSales & RelatedSecurity & ProtectionTransportation
Employment Industries
Accommodation & Food ServicesAdministrative & Support ServicesAgriculture, Fishing & HuntingArts, Entertainment & RecreationConstructionEducational ServicesFinance & InsuranceHealth Care & Social AssistanceInformation & TechnologyManufacturingMining, Quarrying, & ExtractionProfessional & Scientific ServicesPublic AdministrationReal Estate, Rental & LeasingRetail TradeTransportation & WarehousingUtilitiesWholesale Trade
Employer Class
Private Company EmployeesSelf-Employed / IncorporatedSelf-Employed / Not IncorporatedNot-for-profit OrganizationsLocal Government EmployeesState Government EmployeesFederal Government Employees
Commute Time
Longest CommuteLongest Commute | MaleLongest Commute | FemaleShortest CommuteShortest Commute | MaleShortest Commute | Female
Commute Means
School Enrollment
In Private SchoolNursery / PreschoolKindergartenElementary SchoolMiddle SchoolHigh SchoolCollegeUniversity
Education by Degree Field
Computers and MathematicsBio, Nature & AgriculturalPsychologySocial SciencesEngineeringScience and EngineeringBusinessEducationLiberal Arts and HistoryVisual and Performing ArtsArts and Humanities
Occupancy
Finances
Highest Median Housing CostsHighest Property PricesHighest Owner Housing CostsHighest Renter Housing CostsHighest Housing Costs / IncomeLowest Median Housing CostsLowest Property PricesLowest Owner Housing CostsLowest Renter Housing CostsLowest Housing Costs / Income
Physical Characteristics
Mabank
States
AlabamaAlaskaArizonaArkansasCaliforniaColoradoConnecticutDelawareDistrict Of ColumbiaFloridaGeorgiaHawaiiIdahoIllinoisIndianaIowaKansasKentuckyLouisianaMaineMarylandMassachusettsMichiganMinnesotaMississippiMissouriMontanaNebraskaNevadaNew HampshireNew JerseyNew MexicoNew YorkNorth CarolinaNorth DakotaOhioOklahomaOregonPennsylvaniaPuerto RicoRhode IslandSouth CarolinaSouth DakotaTennesseeTexasUtahVermontVirginiaWashingtonWest VirginiaWisconsinWyoming
Texas Cities
AbileneAmarilloArlingtonAustinBaytownBeaumontBoerneBrownsvilleBryanCanyonCarrolltonClevelandCollege StationConroeCorpus ChristiDallasDentonEdinburgEl PasoEulessFort WorthFriscoGalvestonGarlandGatesvilleGeorgetownGrand PrairieHarlingenHoustonHumbleIrvingKatyKilleenLeanderLewisvilleLongviewLubbockMabankMcallenMckinneyMesquiteMidlandMissionNorth Richland HillsPlanoRichardsonRockwallRound RockSan AngeloSan AntonioSpringSugar LandTempleTylerVictoriaWacoWeatherfordWichita Falls
Compare Zip Codes
Comparison Subject
Compare StatesCompare CitiesCompare Zip Codes
Map of Zip Codes with the Largest Hawaiian / Pacific Community in Mabank
11
23
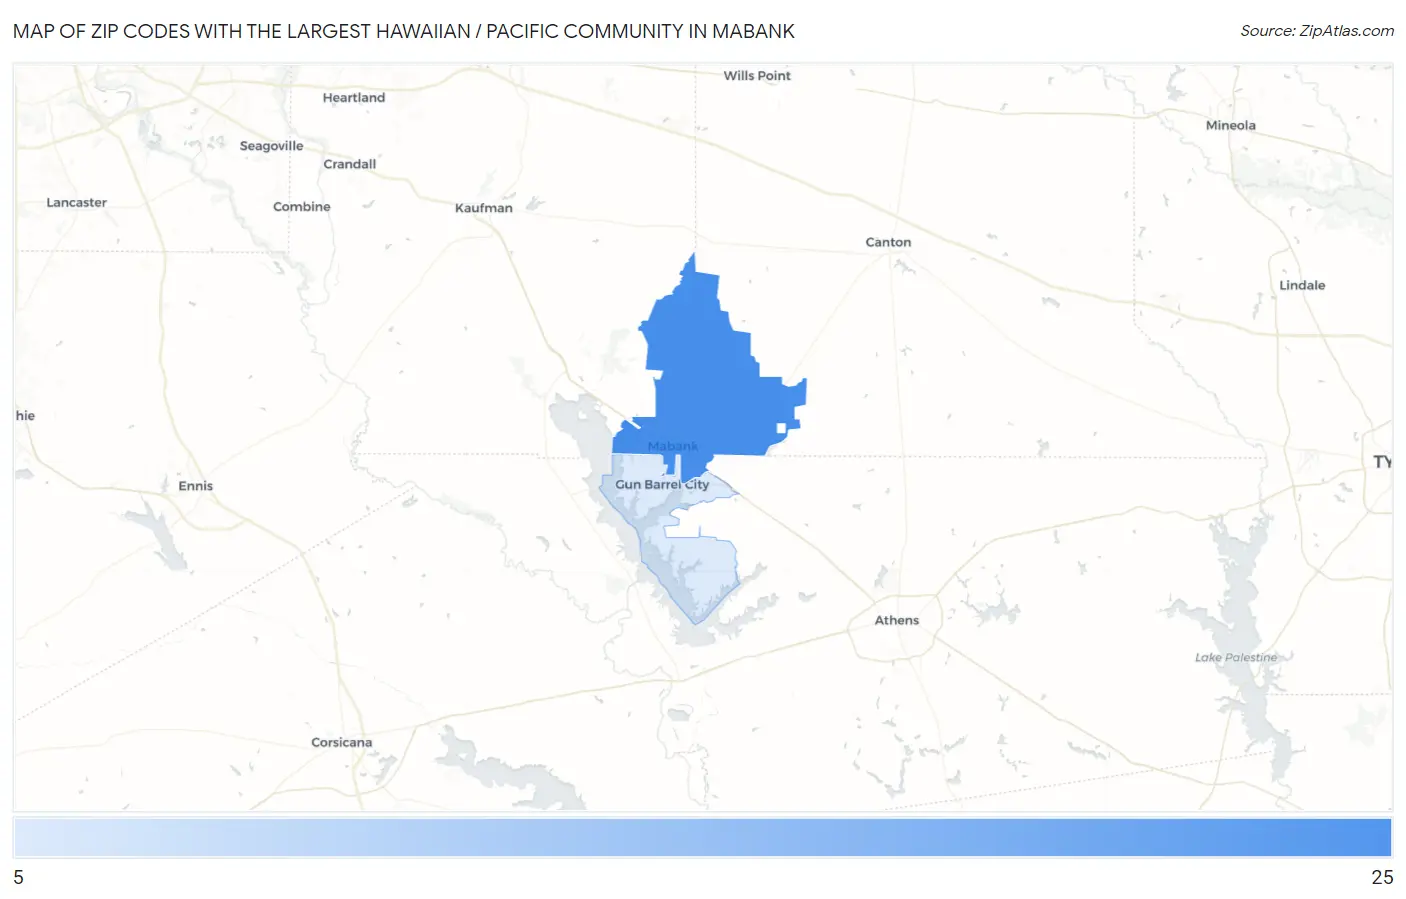
Zip Codes with the Largest Hawaiian / Pacific Community in Mabank, TX
| Zip Code | Hawaiian / Pacific | vs State | vs National | |
| 1. | 75147 | 23 | 27,350(0.08%)#250 | 624,863(0.00%)#3,221 |
| 2. | 75156 | 11 | 27,350(0.04%)#346 | 624,863(0.00%)#4,466 |
1
Common Questions
What are the Top Zip Codes with the Largest Hawaiian / Pacific Community in Mabank, TX?
Top Zip Codes with the Largest Hawaiian / Pacific Community in Mabank, TX are:
What zip code has the Largest Hawaiian / Pacific Community in Mabank, TX?
75147 has the Largest Hawaiian / Pacific Community in Mabank, TX with 23.
What is the Total Hawaiian / Pacific Population in Mabank, TX?
Total Hawaiian / Pacific Population in Mabank is 23.
What is the Total Hawaiian / Pacific Population in Texas?
Total Hawaiian / Pacific Population in Texas is 27,350.
What is the Total Hawaiian / Pacific Population in the United States?
Total Hawaiian / Pacific Population in the United States is 624,863.