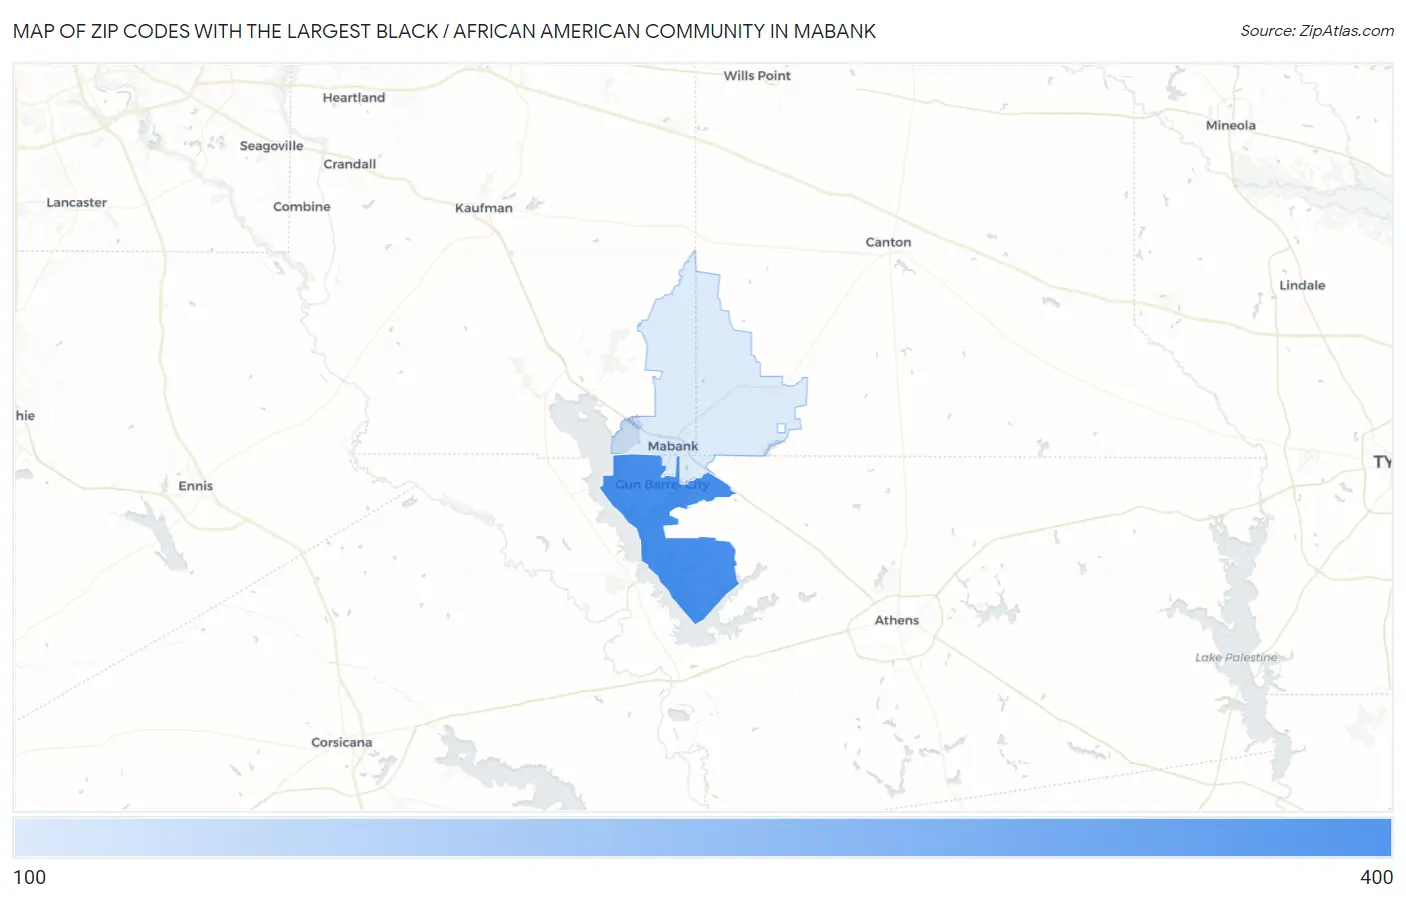
Zip Codes with the Largest Black / African American Community in Mabank, TX
RELATED REPORTS & OPTIONS
Black / African American
Mabank
Compare Zip Codes
Map of Zip Codes with the Largest Black / African American Community in Mabank
161
307
Zip Codes with the Largest Black / African American Community in Mabank, TX
| Zip Code | Black / African American | vs State | vs National | |
| 1. | 75156 | 307 | 3,552,579(0.01%)#886 | 41,288,572(0.00%)#10,595 |
| 2. | 75147 | 161 | 3,552,579(0.00%)#1,022 | 41,288,572(0.00%)#12,451 |
1
Common Questions
What are the Top Zip Codes with the Largest Black / African American Community in Mabank, TX?
Top Zip Codes with the Largest Black / African American Community in Mabank, TX are:
What zip code has the Largest Black / African American Community in Mabank, TX?
75156 has the Largest Black / African American Community in Mabank, TX with 307.
What is the Total Black / African American Population in Mabank, TX?
Total Black / African American Population in Mabank is 148.
What is the Total Black / African American Population in Texas?
Total Black / African American Population in Texas is 3,552,579.
What is the Total Black / African American Population in the United States?
Total Black / African American Population in the United States is 41,288,572.