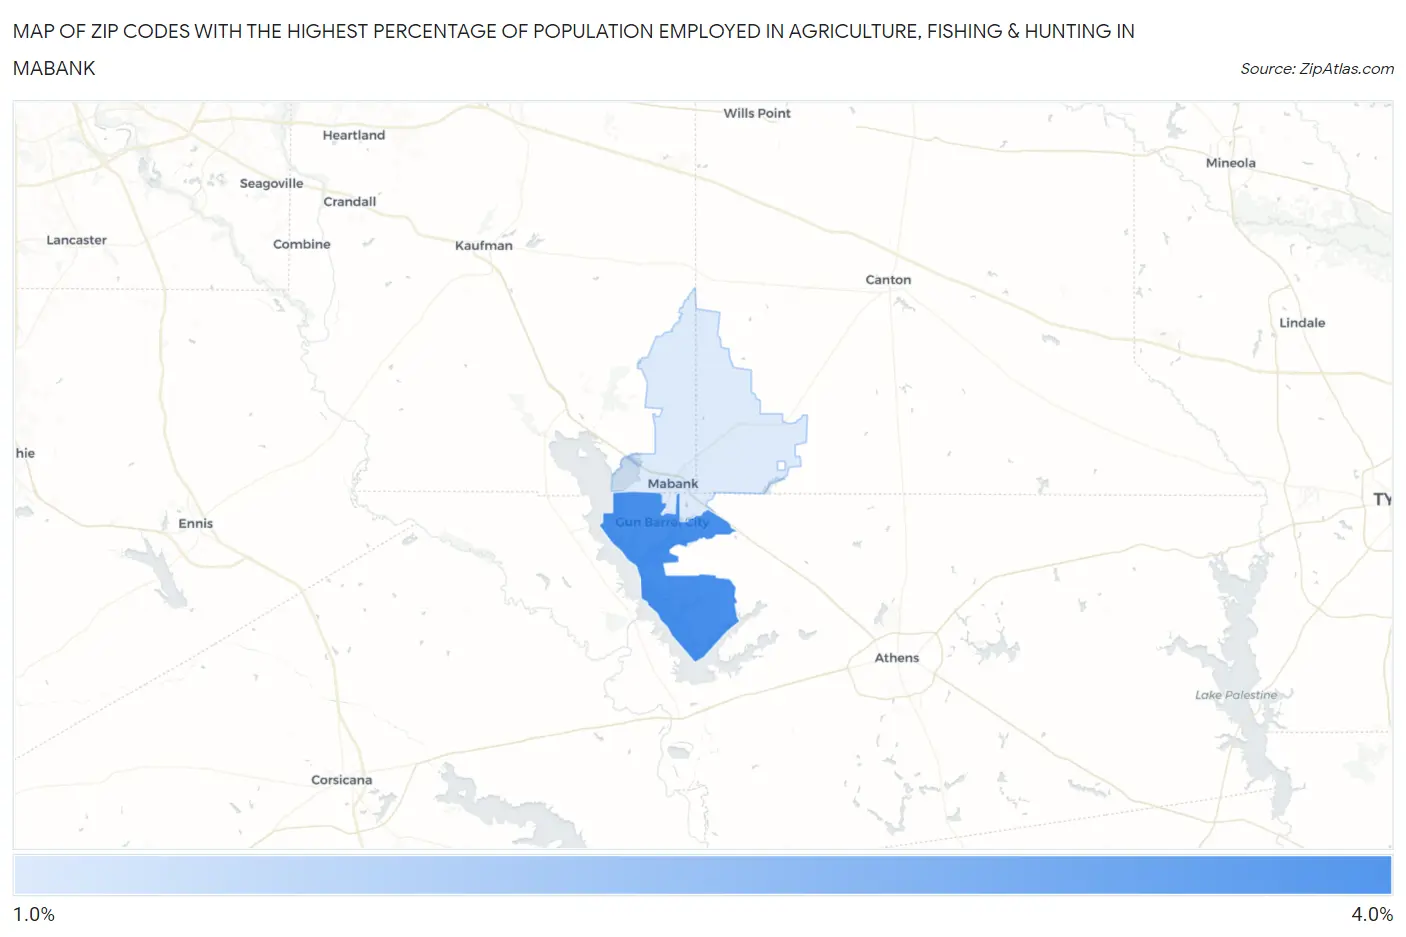
Zip Codes with the Highest Percentage of Population Employed in Agriculture, Fishing & Hunting in Mabank, TX
RELATED REPORTS & OPTIONS
Agriculture, Fishing & Hunting
Mabank
Compare Zip Codes
Map of Zip Codes with the Highest Percentage of Population Employed in Agriculture, Fishing & Hunting in Mabank
1.8%
3.4%
Zip Codes with the Highest Percentage of Population Employed in Agriculture, Fishing & Hunting in Mabank, TX
| Zip Code | % Employed | vs State | vs National | |
| 1. | 75156 | 3.4% | 0.75%(+2.61)#521 | 1.2%(+2.16)#9,963 |
| 2. | 75147 | 1.8% | 0.75%(+1.03)#694 | 1.2%(+0.586)#13,379 |
1
Common Questions
What are the Top Zip Codes with the Highest Percentage of Population Employed in Agriculture, Fishing & Hunting in Mabank, TX?
Top Zip Codes with the Highest Percentage of Population Employed in Agriculture, Fishing & Hunting in Mabank, TX are:
What zip code has the Highest Percentage of Population Employed in Agriculture, Fishing & Hunting in Mabank, TX?
75156 has the Highest Percentage of Population Employed in Agriculture, Fishing & Hunting in Mabank, TX with 3.4%.
What is the Percentage of Population Employed in Agriculture, Fishing & Hunting in Texas?
Percentage of Population Employed in Agriculture, Fishing & Hunting in Texas is 0.75%.
What is the Percentage of Population Employed in Agriculture, Fishing & Hunting in the United States?
Percentage of Population Employed in Agriculture, Fishing & Hunting in the United States is 1.2%.