Zip Codes with the Highest Percentage of Black / African American Population in Mabank, TX
RELATED REPORTS & OPTIONS
Black / African American
Mabank
Compare Zip Codes
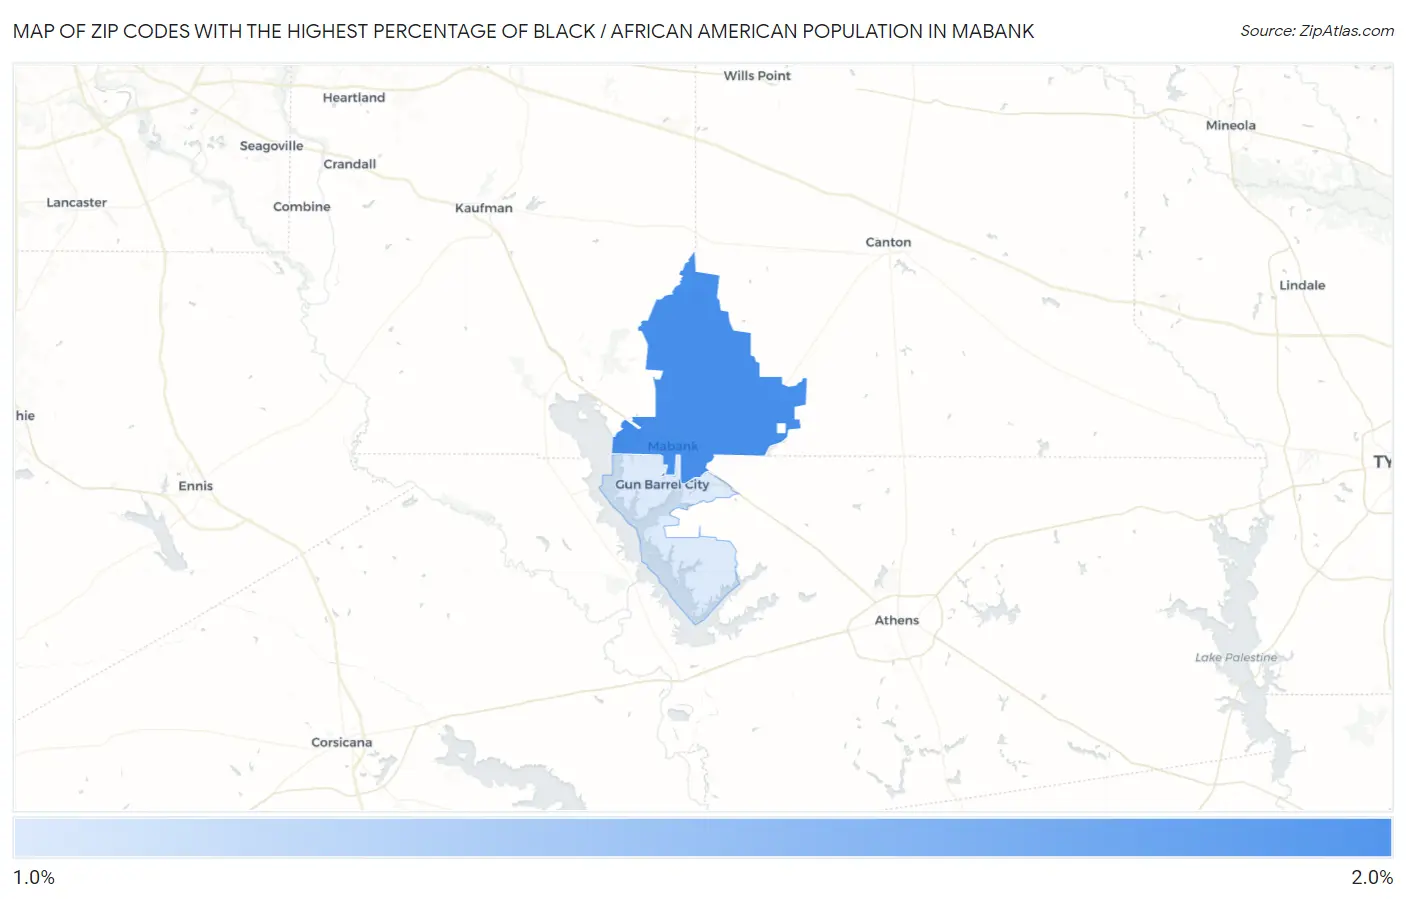
Map of Zip Codes with the Highest Percentage of Black / African American Population in Mabank
1.9%
2.0%
Zip Codes with the Highest Percentage of Black / African American Population in Mabank, TX
| Zip Code | Black / African American | vs State | vs National | |
| 1. | 75147 | 2.0% | 12.1%(-10.2)#1,153 | 12.5%(-10.5)#13,686 |
| 2. | 75156 | 1.9% | 12.1%(-10.3)#1,158 | 12.5%(-10.6)#13,847 |
1
Common Questions
What are the Top Zip Codes with the Highest Percentage of Black / African American Population in Mabank, TX?
Top Zip Codes with the Highest Percentage of Black / African American Population in Mabank, TX are:
What zip code has the Highest Percentage of Black / African American Population in Mabank, TX?
75147 has the Highest Percentage of Black / African American Population in Mabank, TX with 2.0%.
What is the Percentage of Black / African American Population in Mabank, TX?
Percentage of Black / African American Population in Mabank is 3.8%.
What is the Percentage of Black / African American Population in Texas?
Percentage of Black / African American Population in Texas is 12.1%.
What is the Percentage of Black / African American Population in the United States?
Percentage of Black / African American Population in the United States is 12.5%.