Zip Codes with the Highest Percentage of Population with a Degree in Engineering in Mabank, TX
RELATED REPORTS & OPTIONS
Engineering
Mabank
Compare Zip Codes
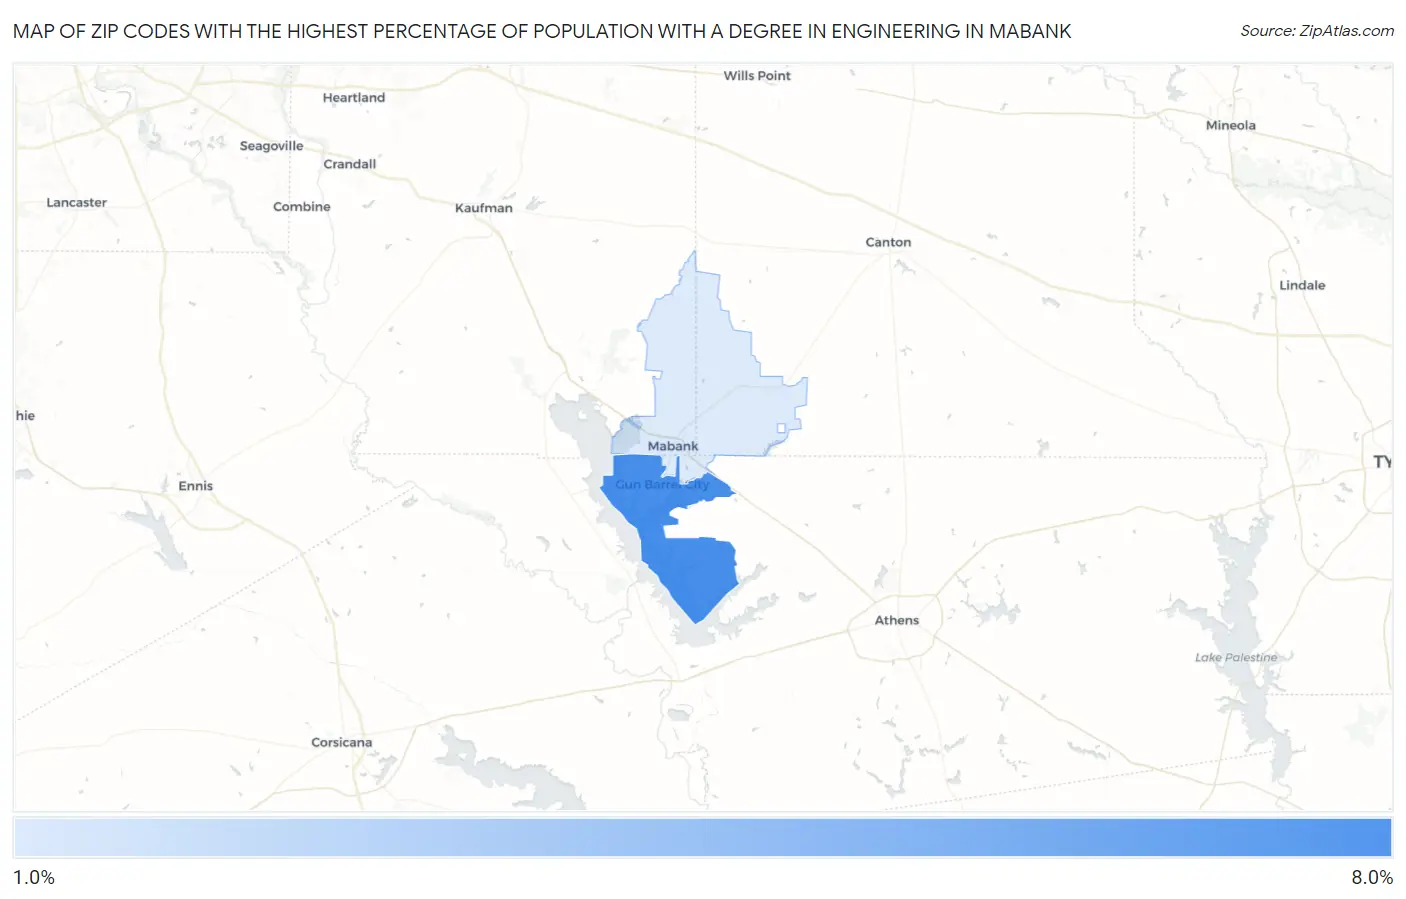
Map of Zip Codes with the Highest Percentage of Population with a Degree in Engineering in Mabank
1.6%
6.9%
Zip Codes with the Highest Percentage of Population with a Degree in Engineering in Mabank, TX
| Zip Code | % Graduates | vs State | vs National | |
| 1. | 75156 | 6.9% | 9.5%(-2.69)#659 | 7.6%(-0.795)#9,294 |
| 2. | 75147 | 1.6% | 9.5%(-7.94)#1,322 | 7.6%(-6.04)#21,659 |
1
Common Questions
What are the Top Zip Codes with the Highest Percentage of Population with a Degree in Engineering in Mabank, TX?
Top Zip Codes with the Highest Percentage of Population with a Degree in Engineering in Mabank, TX are:
What zip code has the Highest Percentage of Population with a Degree in Engineering in Mabank, TX?
75156 has the Highest Percentage of Population with a Degree in Engineering in Mabank, TX with 6.9%.
What is the Percentage of Population with a Degree in Engineering in Texas?
Percentage of Population with a Degree in Engineering in Texas is 9.5%.
What is the Percentage of Population with a Degree in Engineering in the United States?
Percentage of Population with a Degree in Engineering in the United States is 7.6%.