Zip Codes with the Highest Percentage of Population Employed in Arts, Entertainment & Recreation in Tomball, TX
RELATED REPORTS & OPTIONS
Arts, Entertainment & Recreation
Tomball
Compare Zip Codes
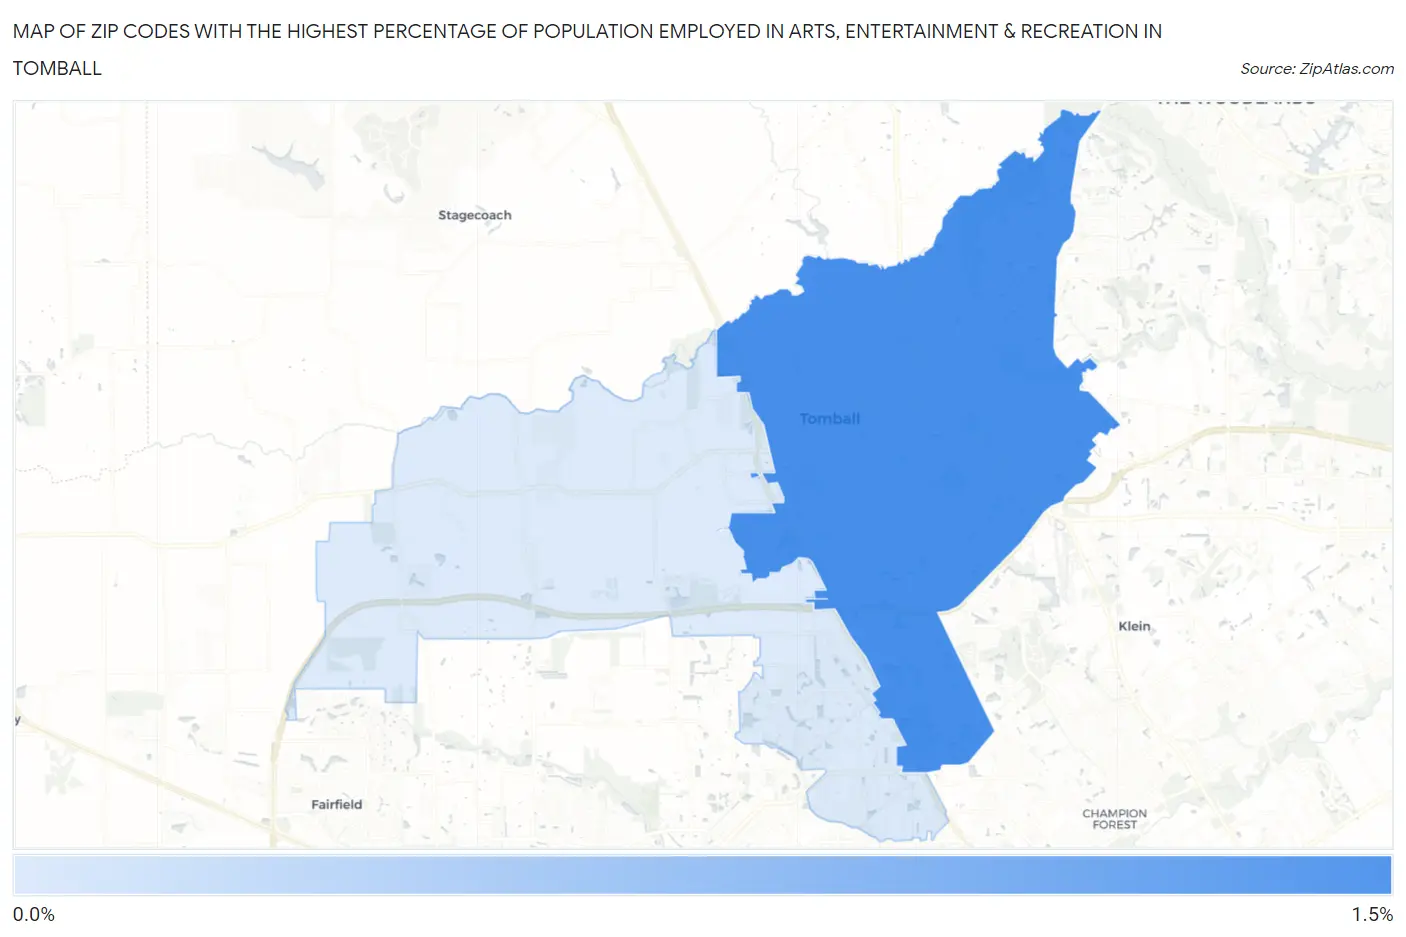
Map of Zip Codes with the Highest Percentage of Population Employed in Arts, Entertainment & Recreation in Tomball
0.43%
1.0%
Zip Codes with the Highest Percentage of Population Employed in Arts, Entertainment & Recreation in Tomball, TX
| Zip Code | % Employed | vs State | vs National | |
| 1. | 77375 | 1.0% | 1.5%(-0.440)#813 | 2.1%(-1.06)#16,794 |
| 2. | 77377 | 0.43% | 1.5%(-1.03)#1,108 | 2.1%(-1.65)#20,901 |
1
Common Questions
What are the Top Zip Codes with the Highest Percentage of Population Employed in Arts, Entertainment & Recreation in Tomball, TX?
Top Zip Codes with the Highest Percentage of Population Employed in Arts, Entertainment & Recreation in Tomball, TX are:
What zip code has the Highest Percentage of Population Employed in Arts, Entertainment & Recreation in Tomball, TX?
77375 has the Highest Percentage of Population Employed in Arts, Entertainment & Recreation in Tomball, TX with 1.0%.
What is the Percentage of Population Employed in Arts, Entertainment & Recreation in Tomball, TX?
Percentage of Population Employed in Arts, Entertainment & Recreation in Tomball is 1.8%.
What is the Percentage of Population Employed in Arts, Entertainment & Recreation in Texas?
Percentage of Population Employed in Arts, Entertainment & Recreation in Texas is 1.5%.
What is the Percentage of Population Employed in Arts, Entertainment & Recreation in the United States?
Percentage of Population Employed in Arts, Entertainment & Recreation in the United States is 2.1%.