Zip Codes with the Highest Percentage of Population Employed in Arts, Entertainment & Recreation in Richmond, TX
RELATED REPORTS & OPTIONS
Arts, Entertainment & Recreation
Richmond
Compare Zip Codes
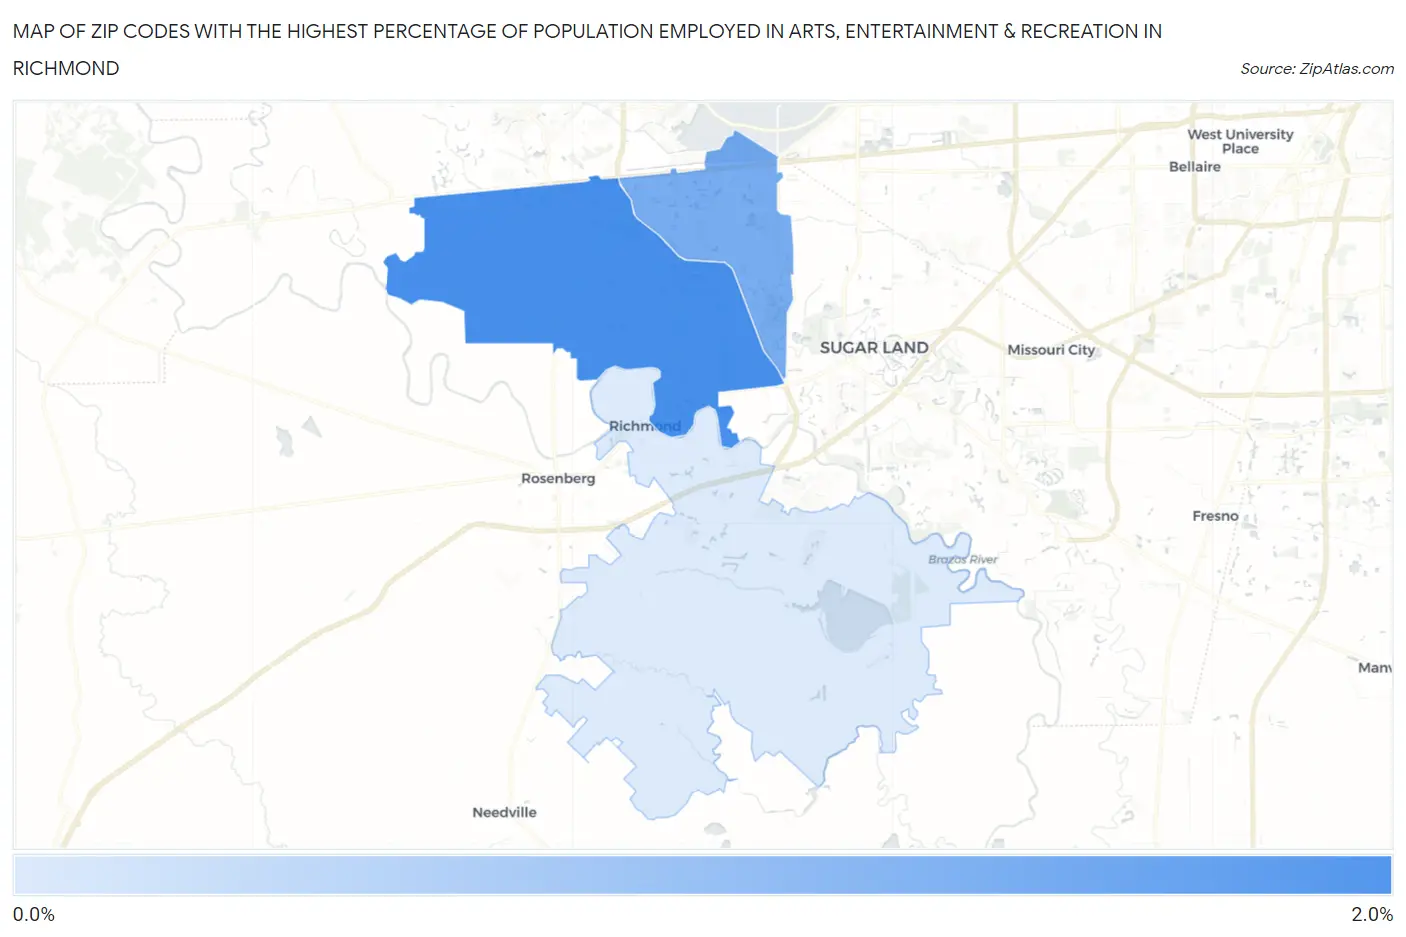
Map of Zip Codes with the Highest Percentage of Population Employed in Arts, Entertainment & Recreation in Richmond
0.43%
1.5%
Zip Codes with the Highest Percentage of Population Employed in Arts, Entertainment & Recreation in Richmond, TX
| Zip Code | % Employed | vs State | vs National | |
| 1. | 77406 | 1.5% | 1.5%(+0.084)#535 | 2.1%(-0.537)#12,902 |
| 2. | 77407 | 1.2% | 1.5%(-0.269)#721 | 2.1%(-0.889)#15,523 |
| 3. | 77469 | 0.43% | 1.5%(-1.03)#1,107 | 2.1%(-1.65)#20,895 |
1
Common Questions
What are the Top Zip Codes with the Highest Percentage of Population Employed in Arts, Entertainment & Recreation in Richmond, TX?
Top Zip Codes with the Highest Percentage of Population Employed in Arts, Entertainment & Recreation in Richmond, TX are:
What zip code has the Highest Percentage of Population Employed in Arts, Entertainment & Recreation in Richmond, TX?
77406 has the Highest Percentage of Population Employed in Arts, Entertainment & Recreation in Richmond, TX with 1.5%.
What is the Percentage of Population Employed in Arts, Entertainment & Recreation in Richmond, TX?
Percentage of Population Employed in Arts, Entertainment & Recreation in Richmond is 0.18%.
What is the Percentage of Population Employed in Arts, Entertainment & Recreation in Texas?
Percentage of Population Employed in Arts, Entertainment & Recreation in Texas is 1.5%.
What is the Percentage of Population Employed in Arts, Entertainment & Recreation in the United States?
Percentage of Population Employed in Arts, Entertainment & Recreation in the United States is 2.1%.