Zip Codes with the Highest Percentage of Population Employed in Arts, Entertainment & Recreation in Mission, TX
RELATED REPORTS & OPTIONS
Arts, Entertainment & Recreation
Mission
Compare Zip Codes
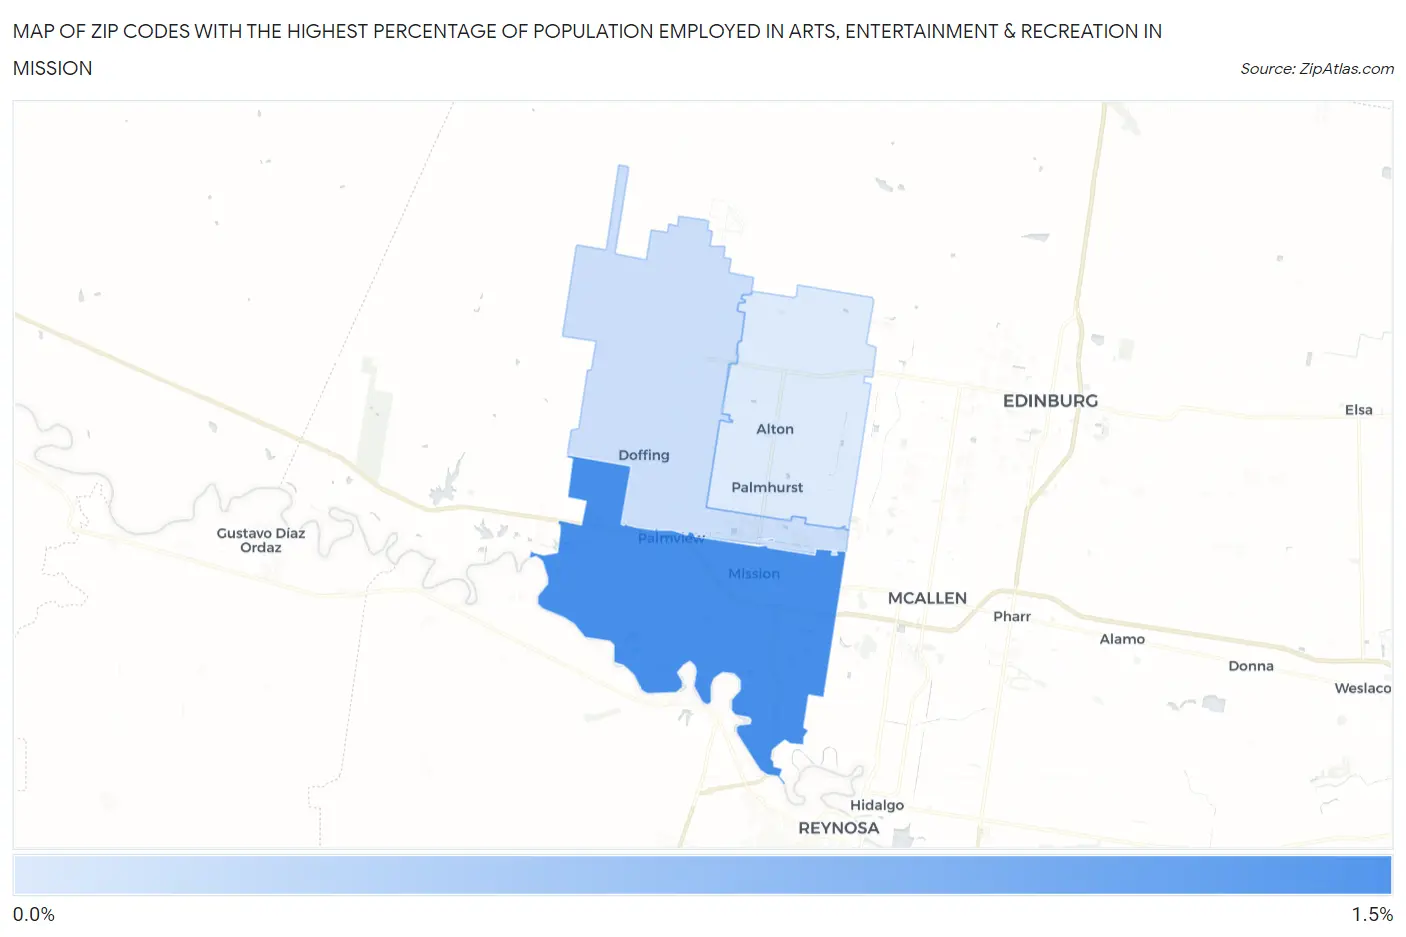
Map of Zip Codes with the Highest Percentage of Population Employed in Arts, Entertainment & Recreation in Mission
0.49%
1.2%
Zip Codes with the Highest Percentage of Population Employed in Arts, Entertainment & Recreation in Mission, TX
| Zip Code | % Employed | vs State | vs National | |
| 1. | 78572 | 1.2% | 1.5%(-0.286)#734 | 2.1%(-0.906)#15,643 |
| 2. | 78574 | 0.58% | 1.5%(-0.882)#1,037 | 2.1%(-1.50)#19,963 |
| 3. | 78573 | 0.49% | 1.5%(-0.968)#1,080 | 2.1%(-1.59)#20,536 |
1
Common Questions
What are the Top Zip Codes with the Highest Percentage of Population Employed in Arts, Entertainment & Recreation in Mission, TX?
Top Zip Codes with the Highest Percentage of Population Employed in Arts, Entertainment & Recreation in Mission, TX are:
What zip code has the Highest Percentage of Population Employed in Arts, Entertainment & Recreation in Mission, TX?
78572 has the Highest Percentage of Population Employed in Arts, Entertainment & Recreation in Mission, TX with 1.2%.
What is the Percentage of Population Employed in Arts, Entertainment & Recreation in Mission, TX?
Percentage of Population Employed in Arts, Entertainment & Recreation in Mission is 1.2%.
What is the Percentage of Population Employed in Arts, Entertainment & Recreation in Texas?
Percentage of Population Employed in Arts, Entertainment & Recreation in Texas is 1.5%.
What is the Percentage of Population Employed in Arts, Entertainment & Recreation in the United States?
Percentage of Population Employed in Arts, Entertainment & Recreation in the United States is 2.1%.